| Previous Month | Next Month |
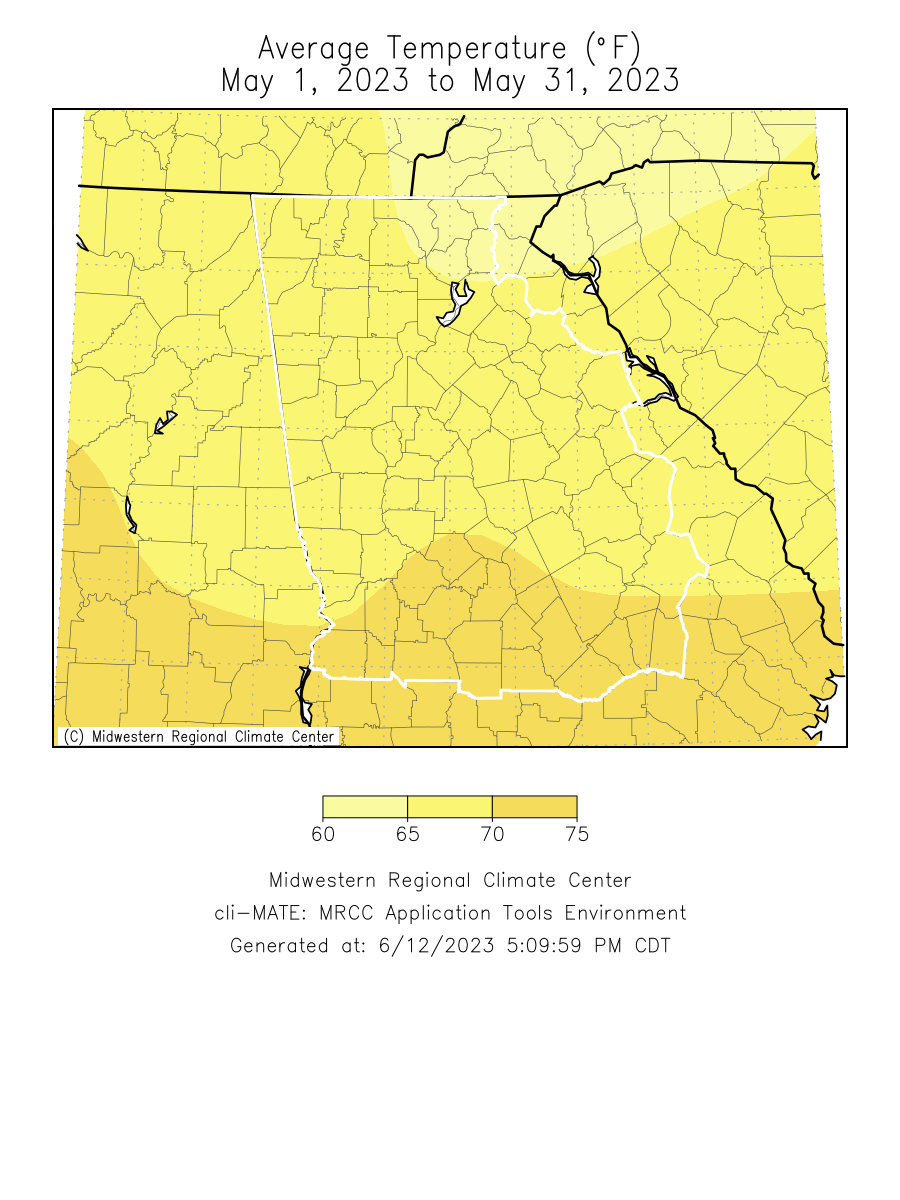
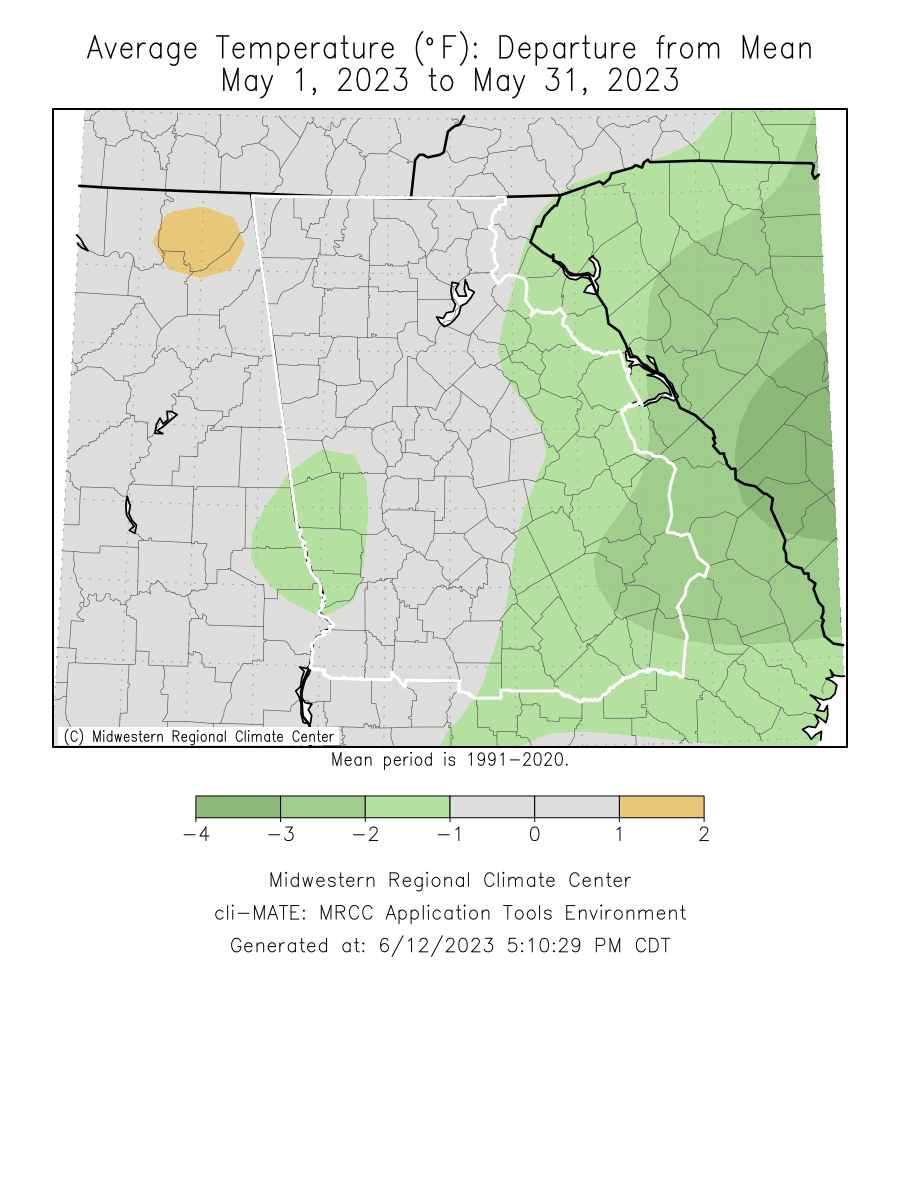
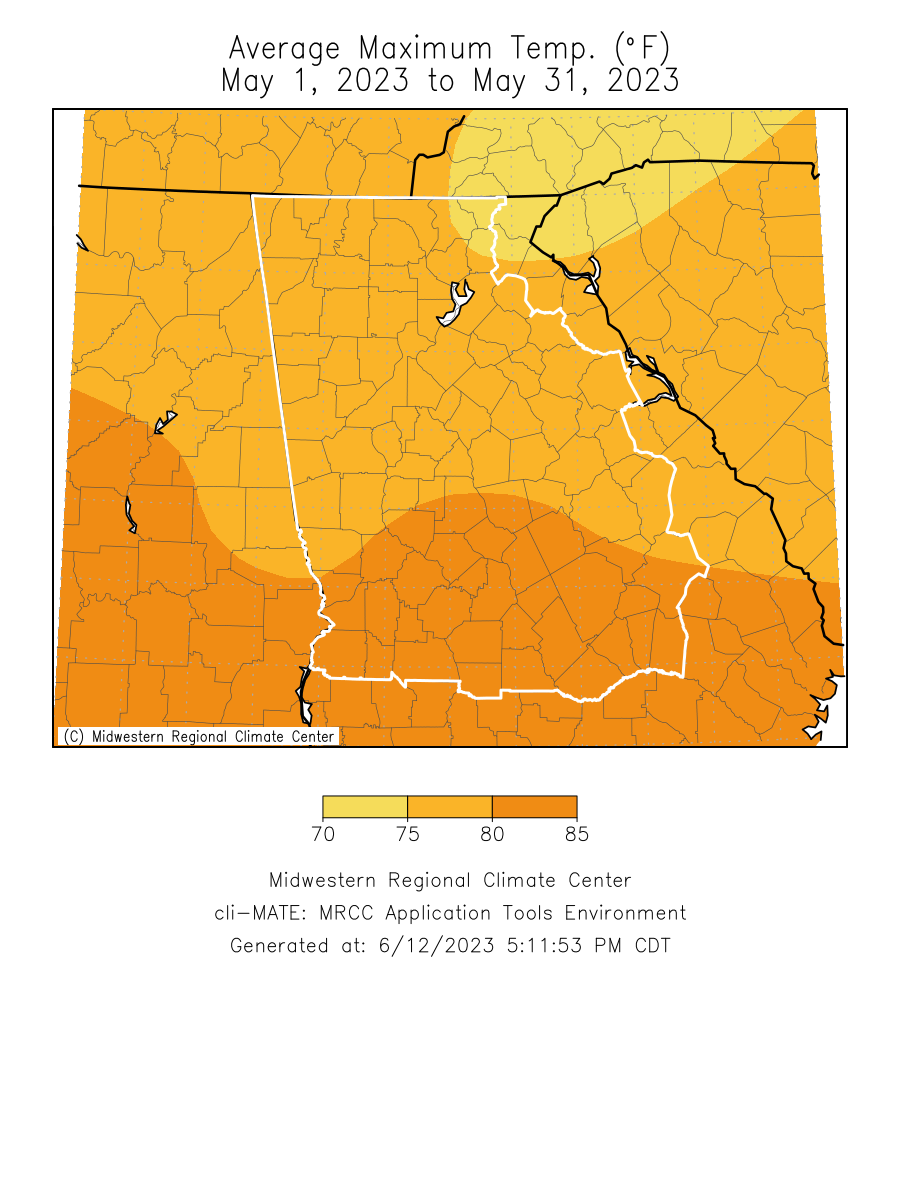
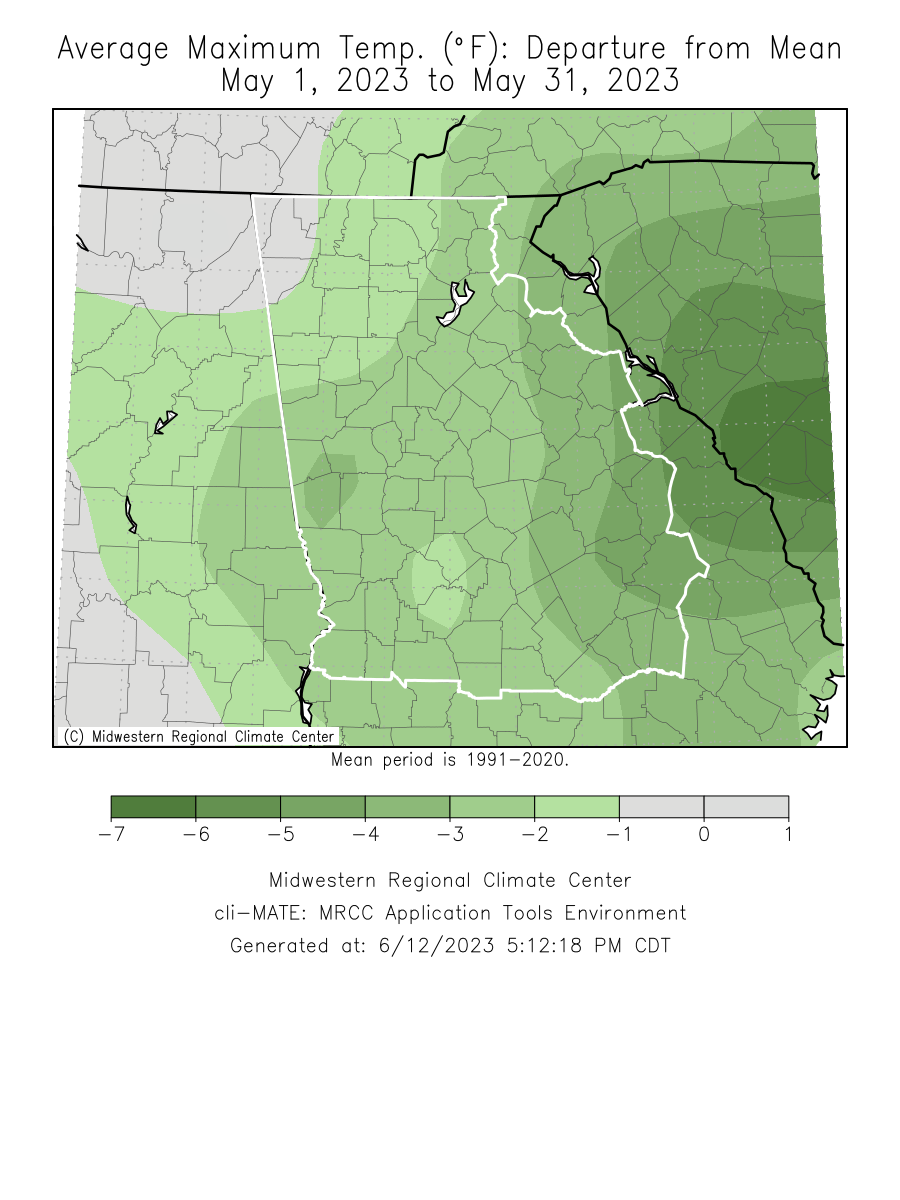
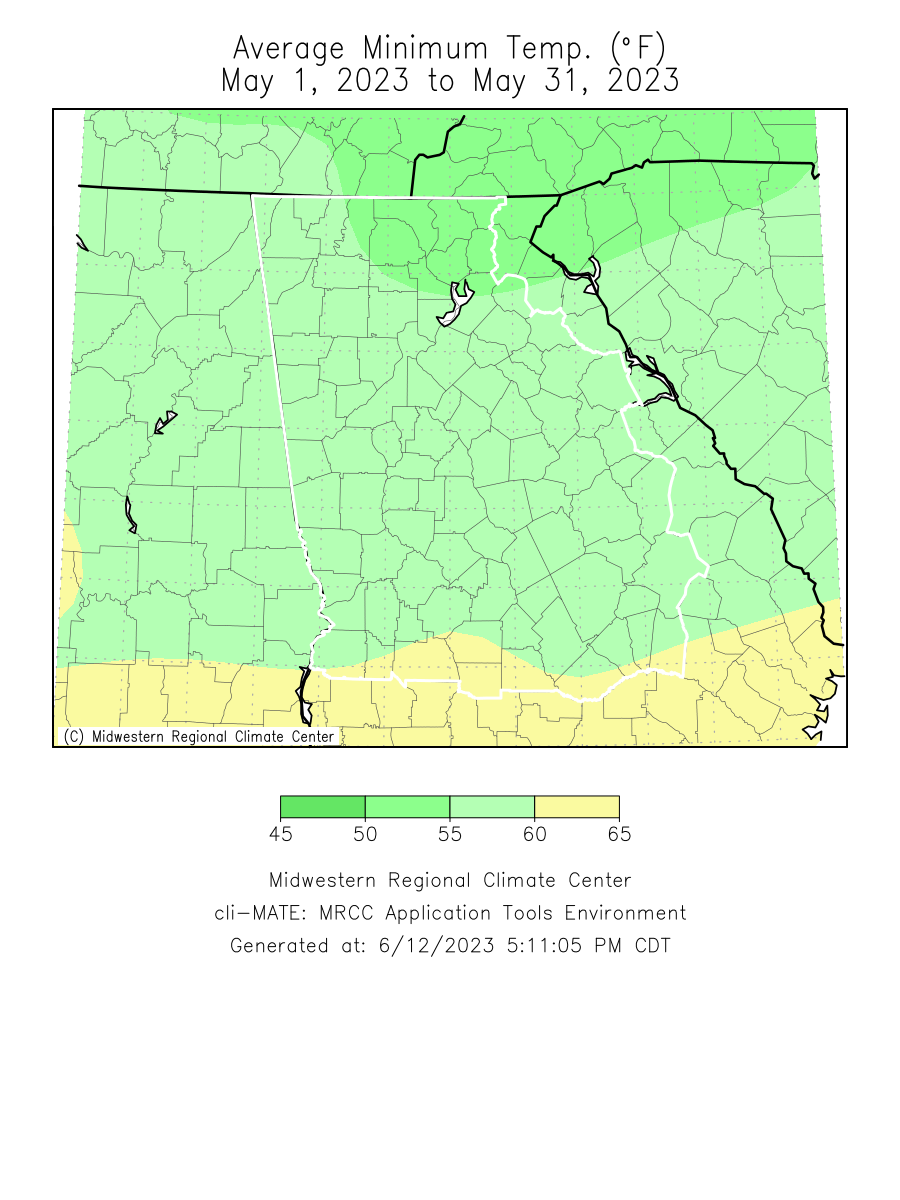
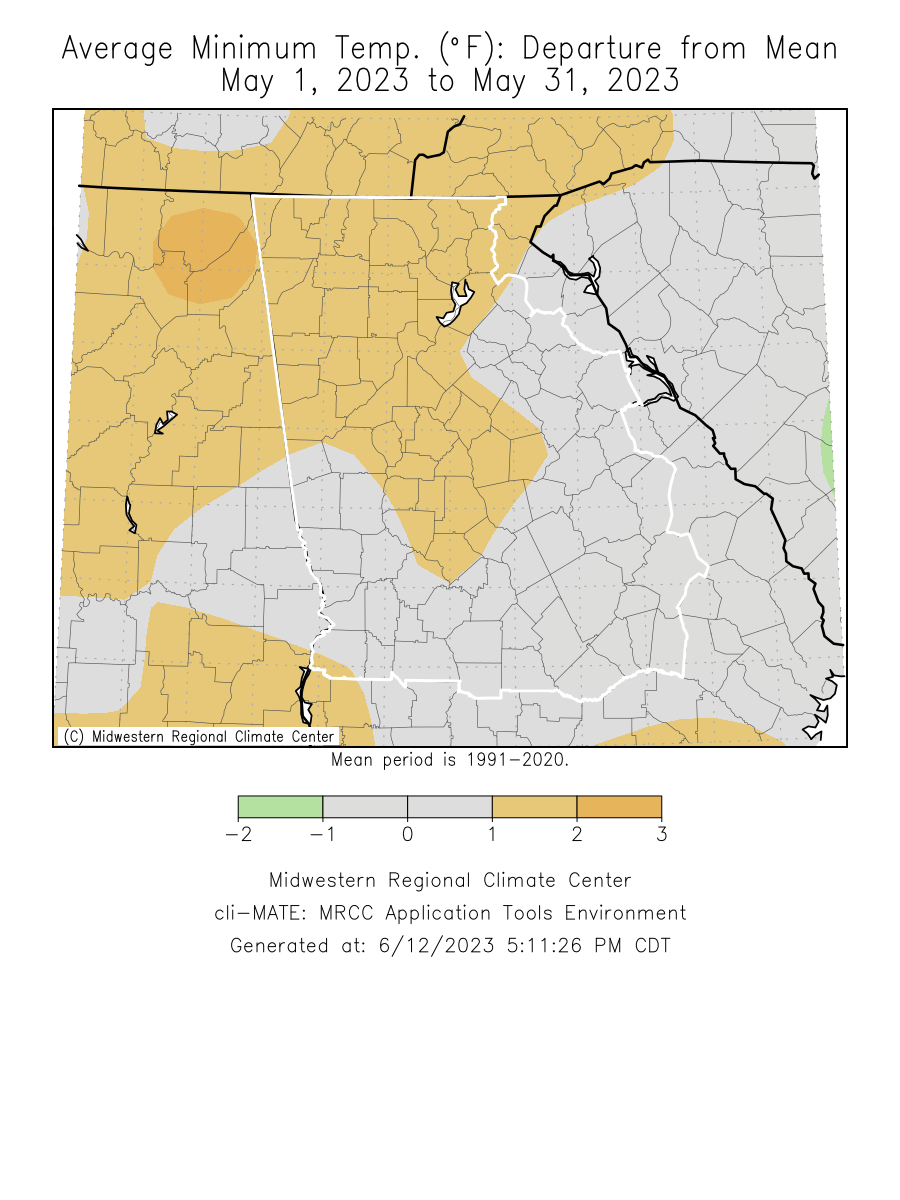
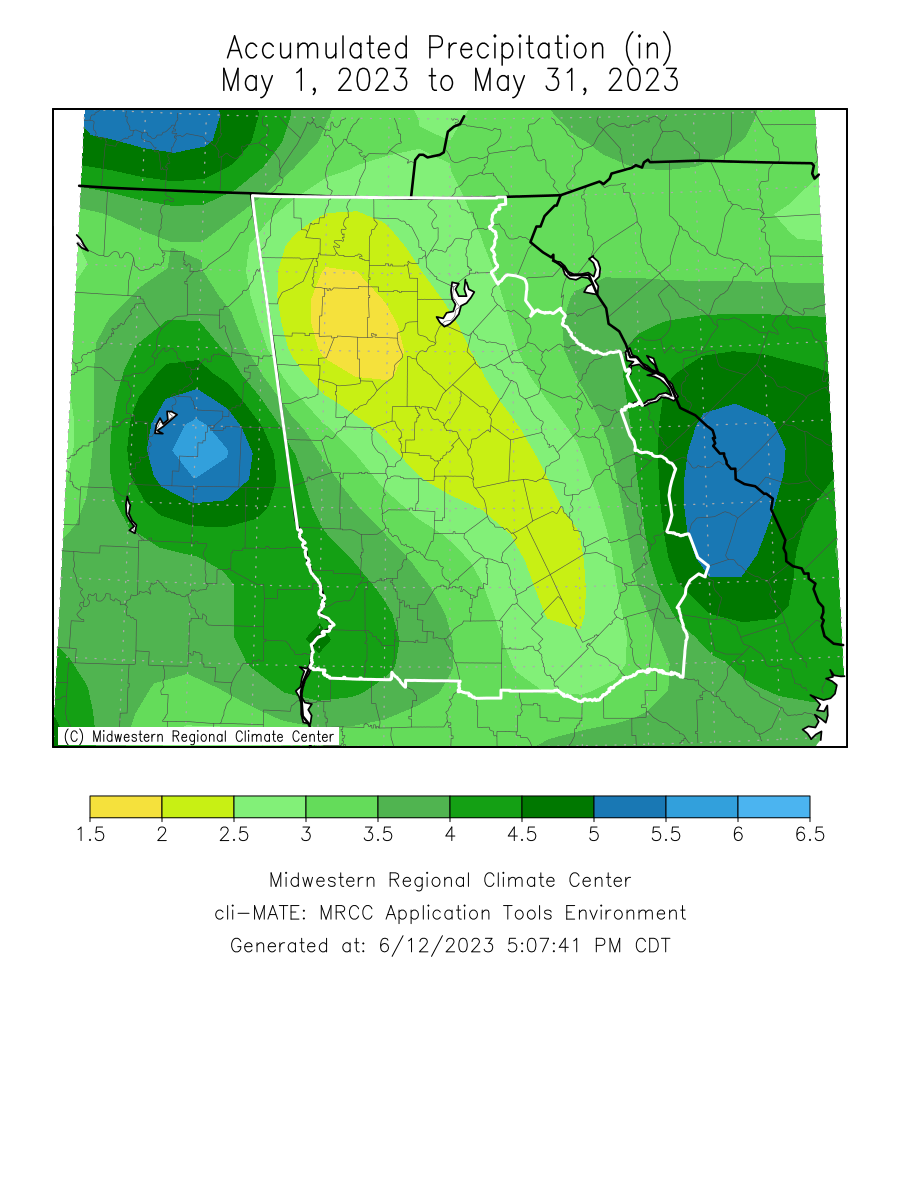
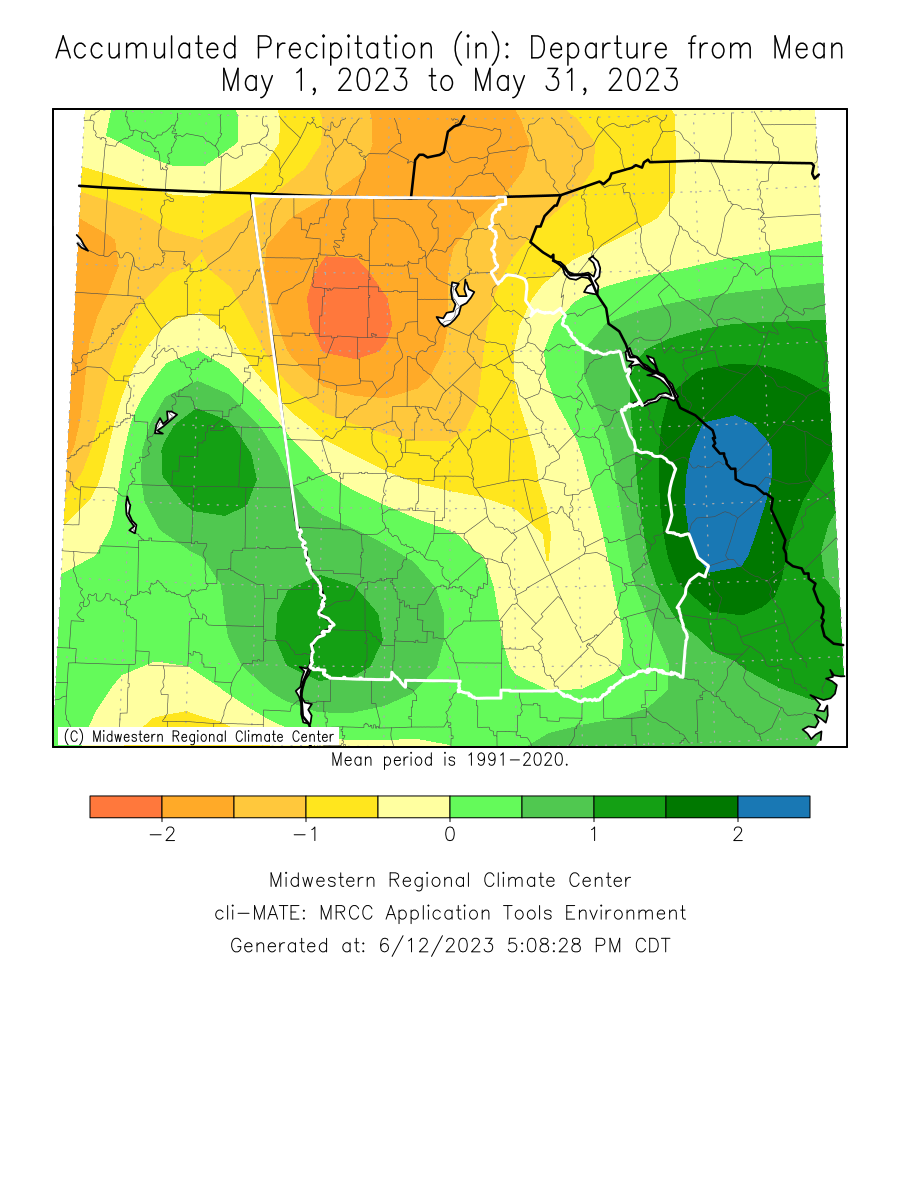
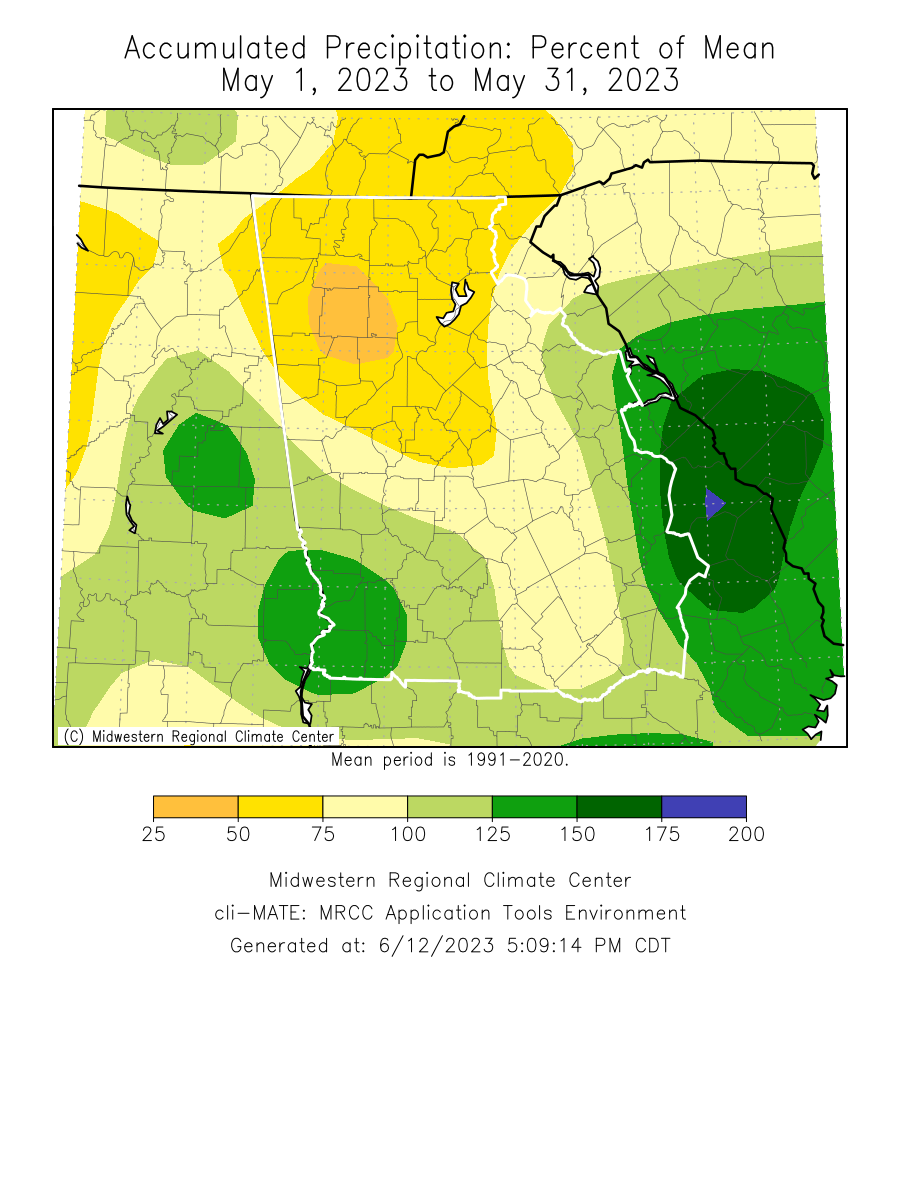
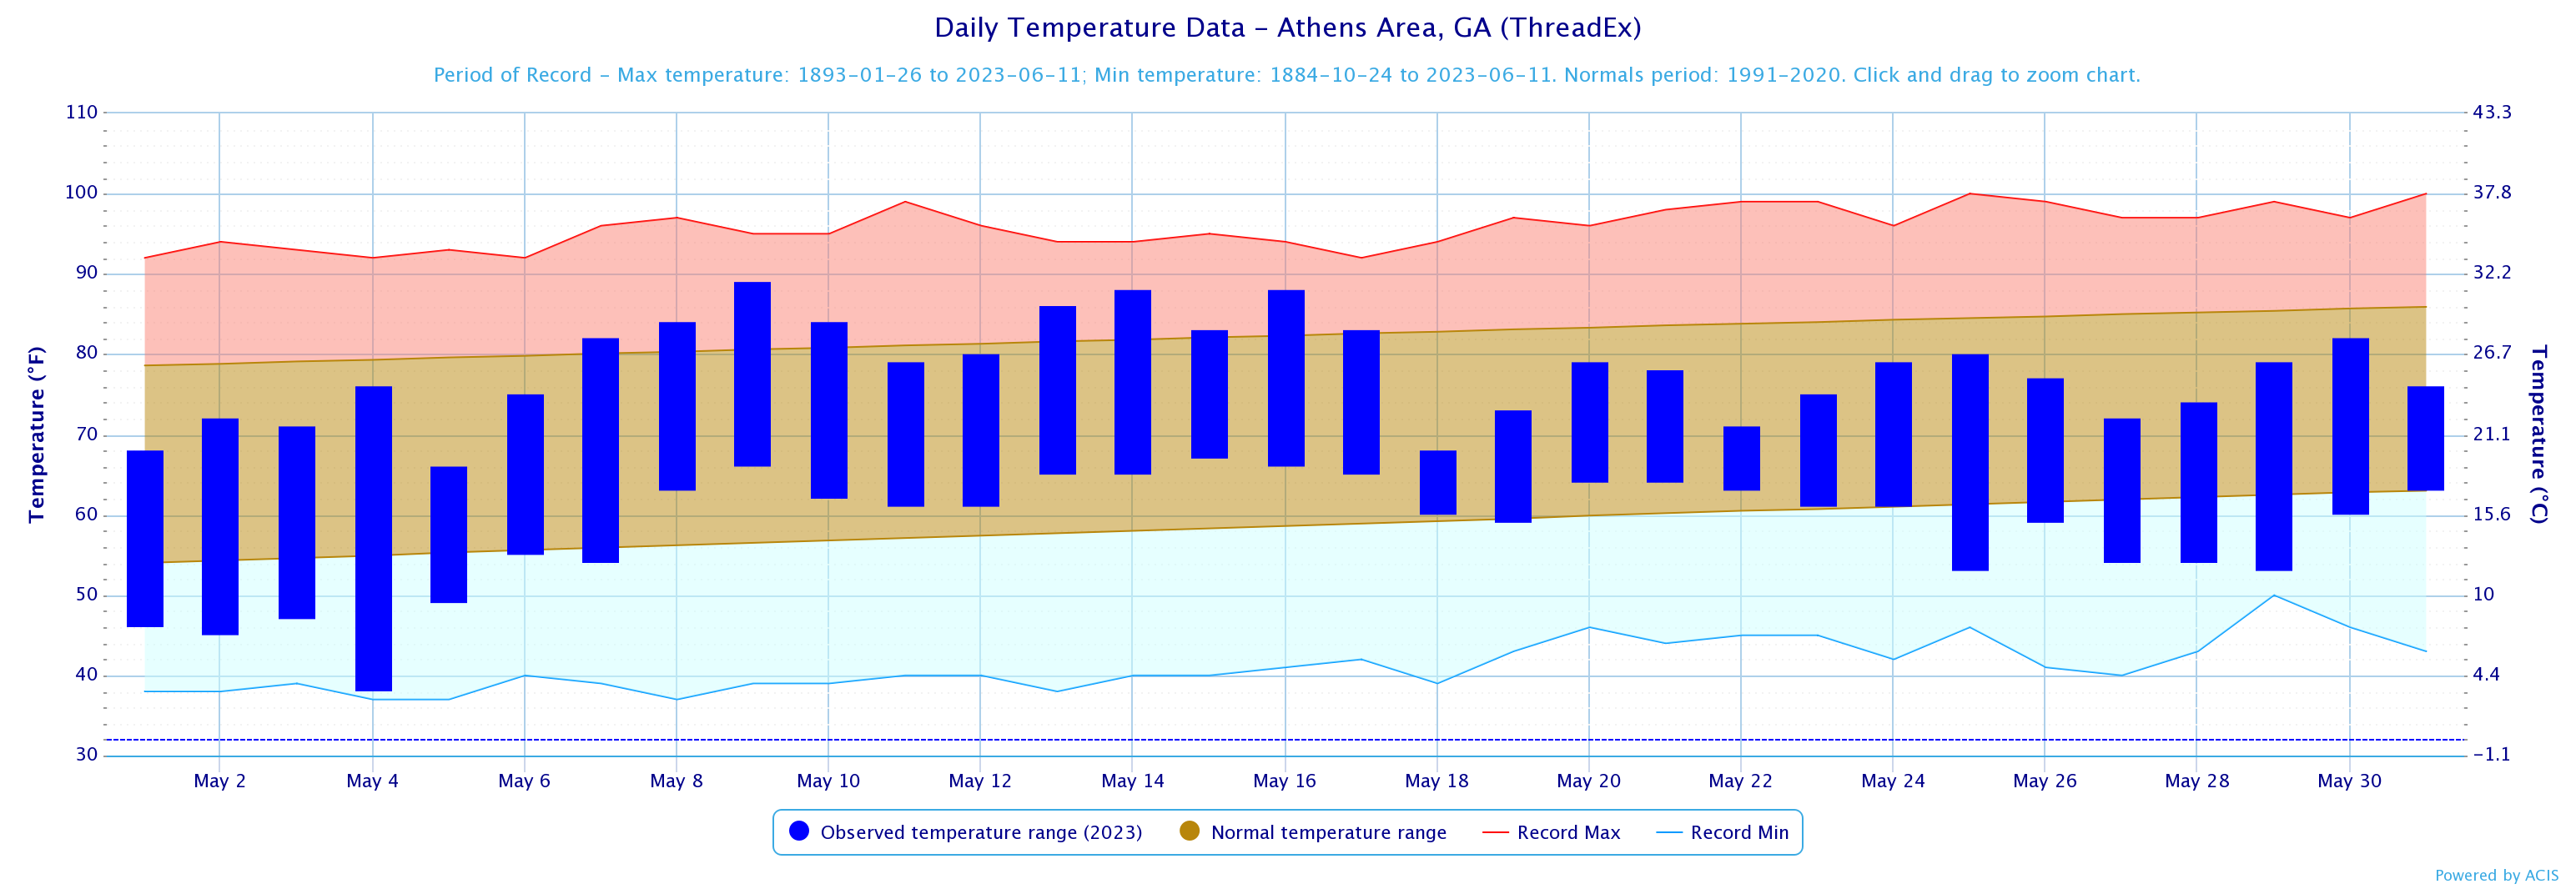
Temperatures through the month of May were around 2 degrees below normal. Precipitation through the month of May was within two inches of normal.
Climate Site Maximum Temperature Max T Date Climate Site Total Precipitation DFN (Departure Climate Site Maximum Daily Precip (in inches) Maximum Precip Date Data prepared by NWS Peachtree City/Atlanta Based on the Climate Prediction Center’s outlook for June, North Georgia has an equal chance for above, below or near normal temperature and precipitation.
Overview
Climate Graphics
Records
Events
June Outlook
Below are the overview stats for May 2023 for our 10 climate sites.
May 2023 Climate Averages
Climate Site
May Temp (°F)
Average Temp
Departure from normal
Athens
68.1
70.5
-2.4
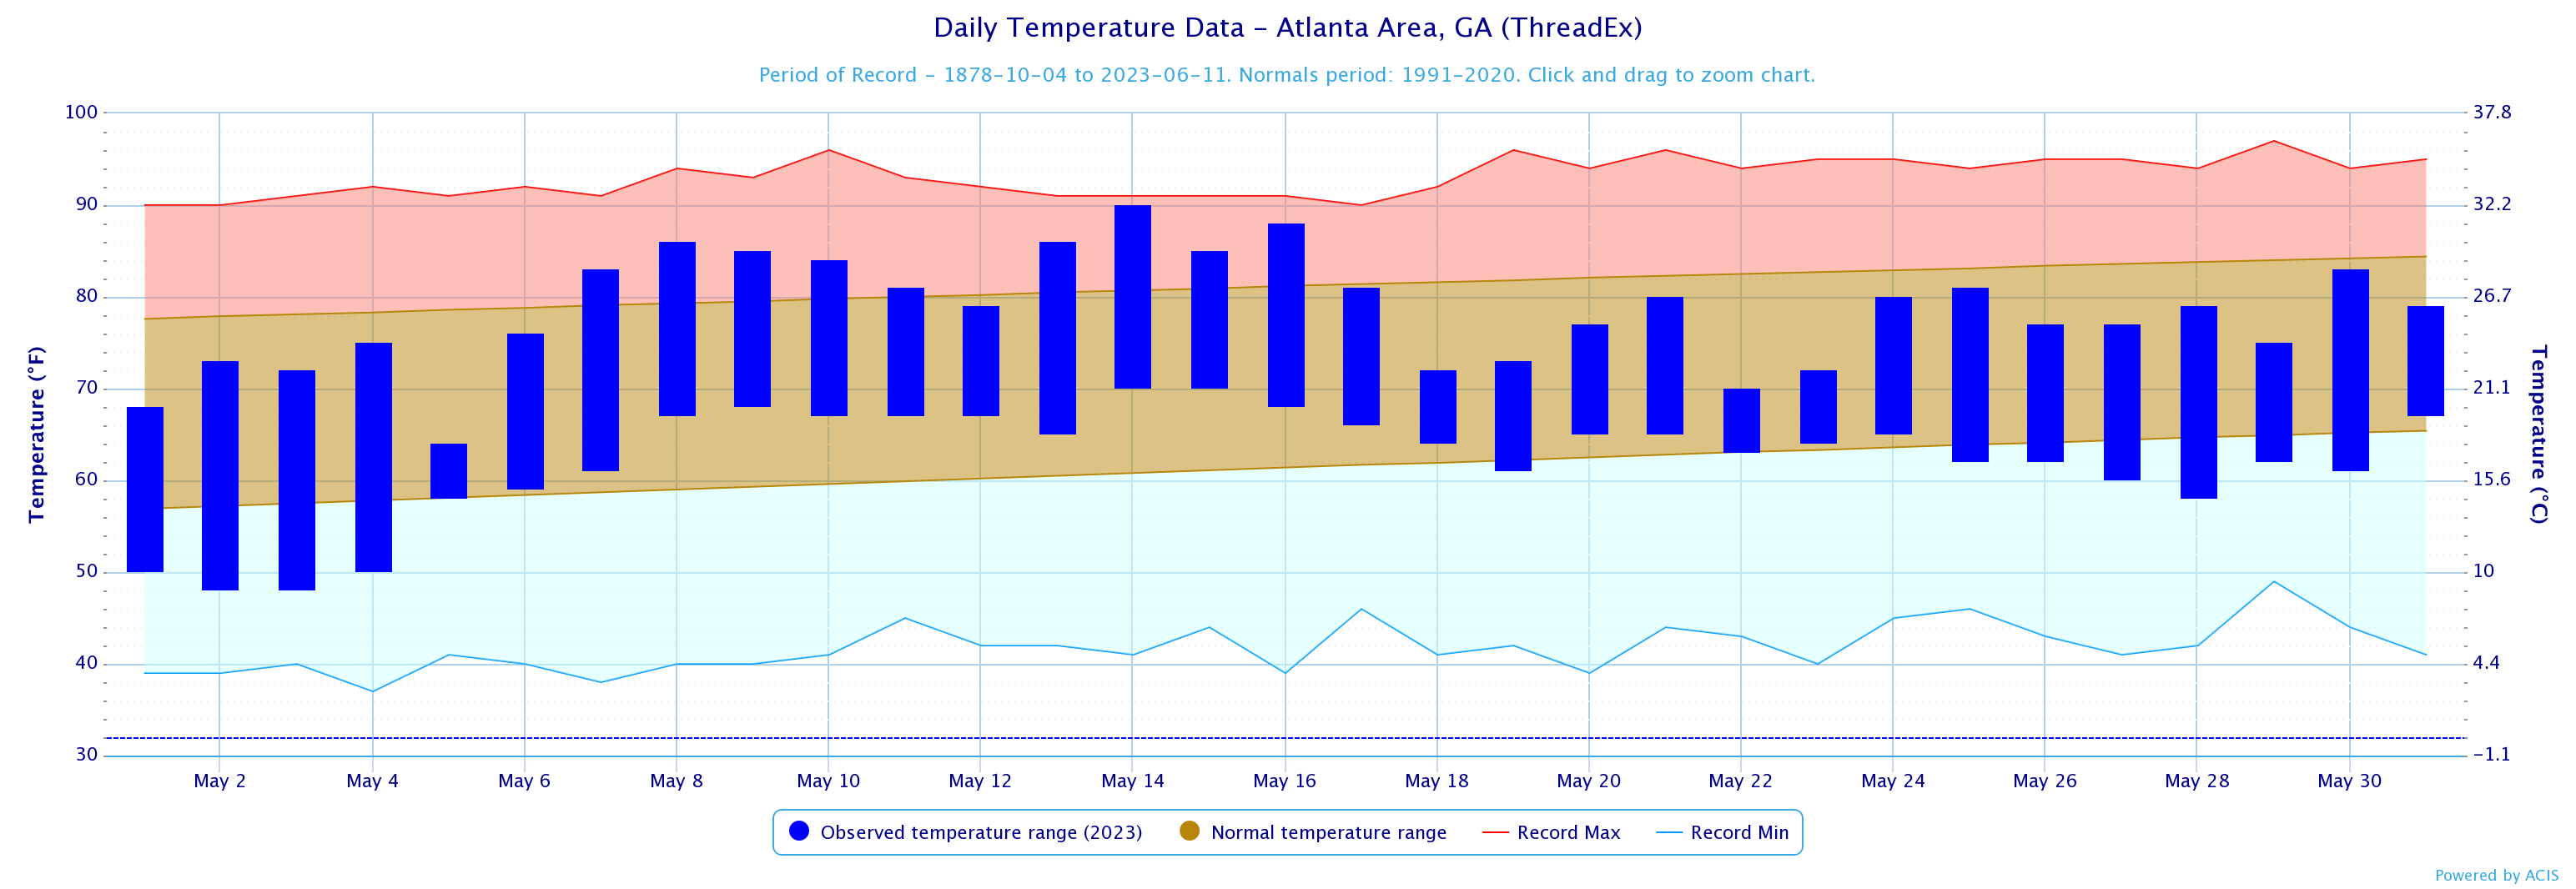
Atlanta
70.3
71.2
-0.9
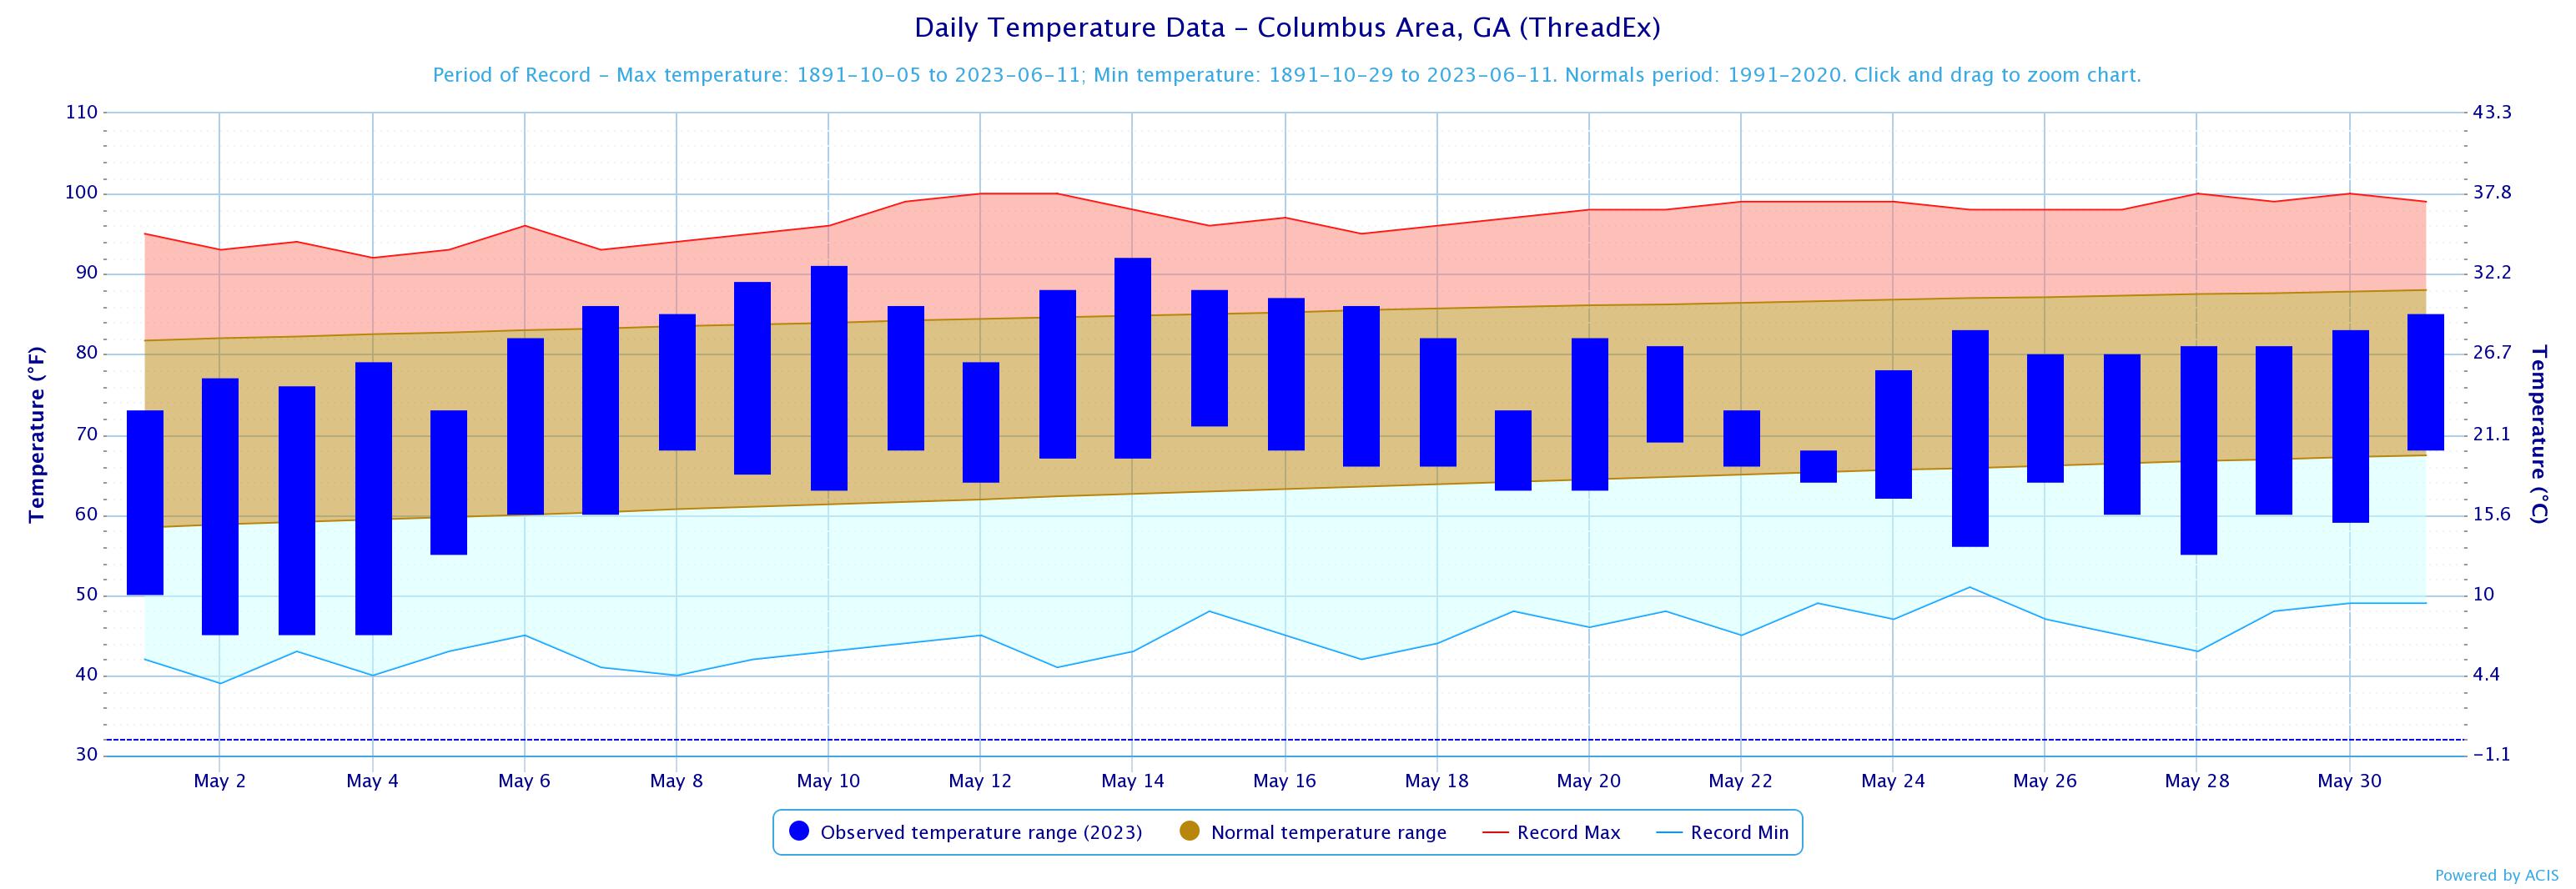
Columbus
71.4
74.1
-2.7
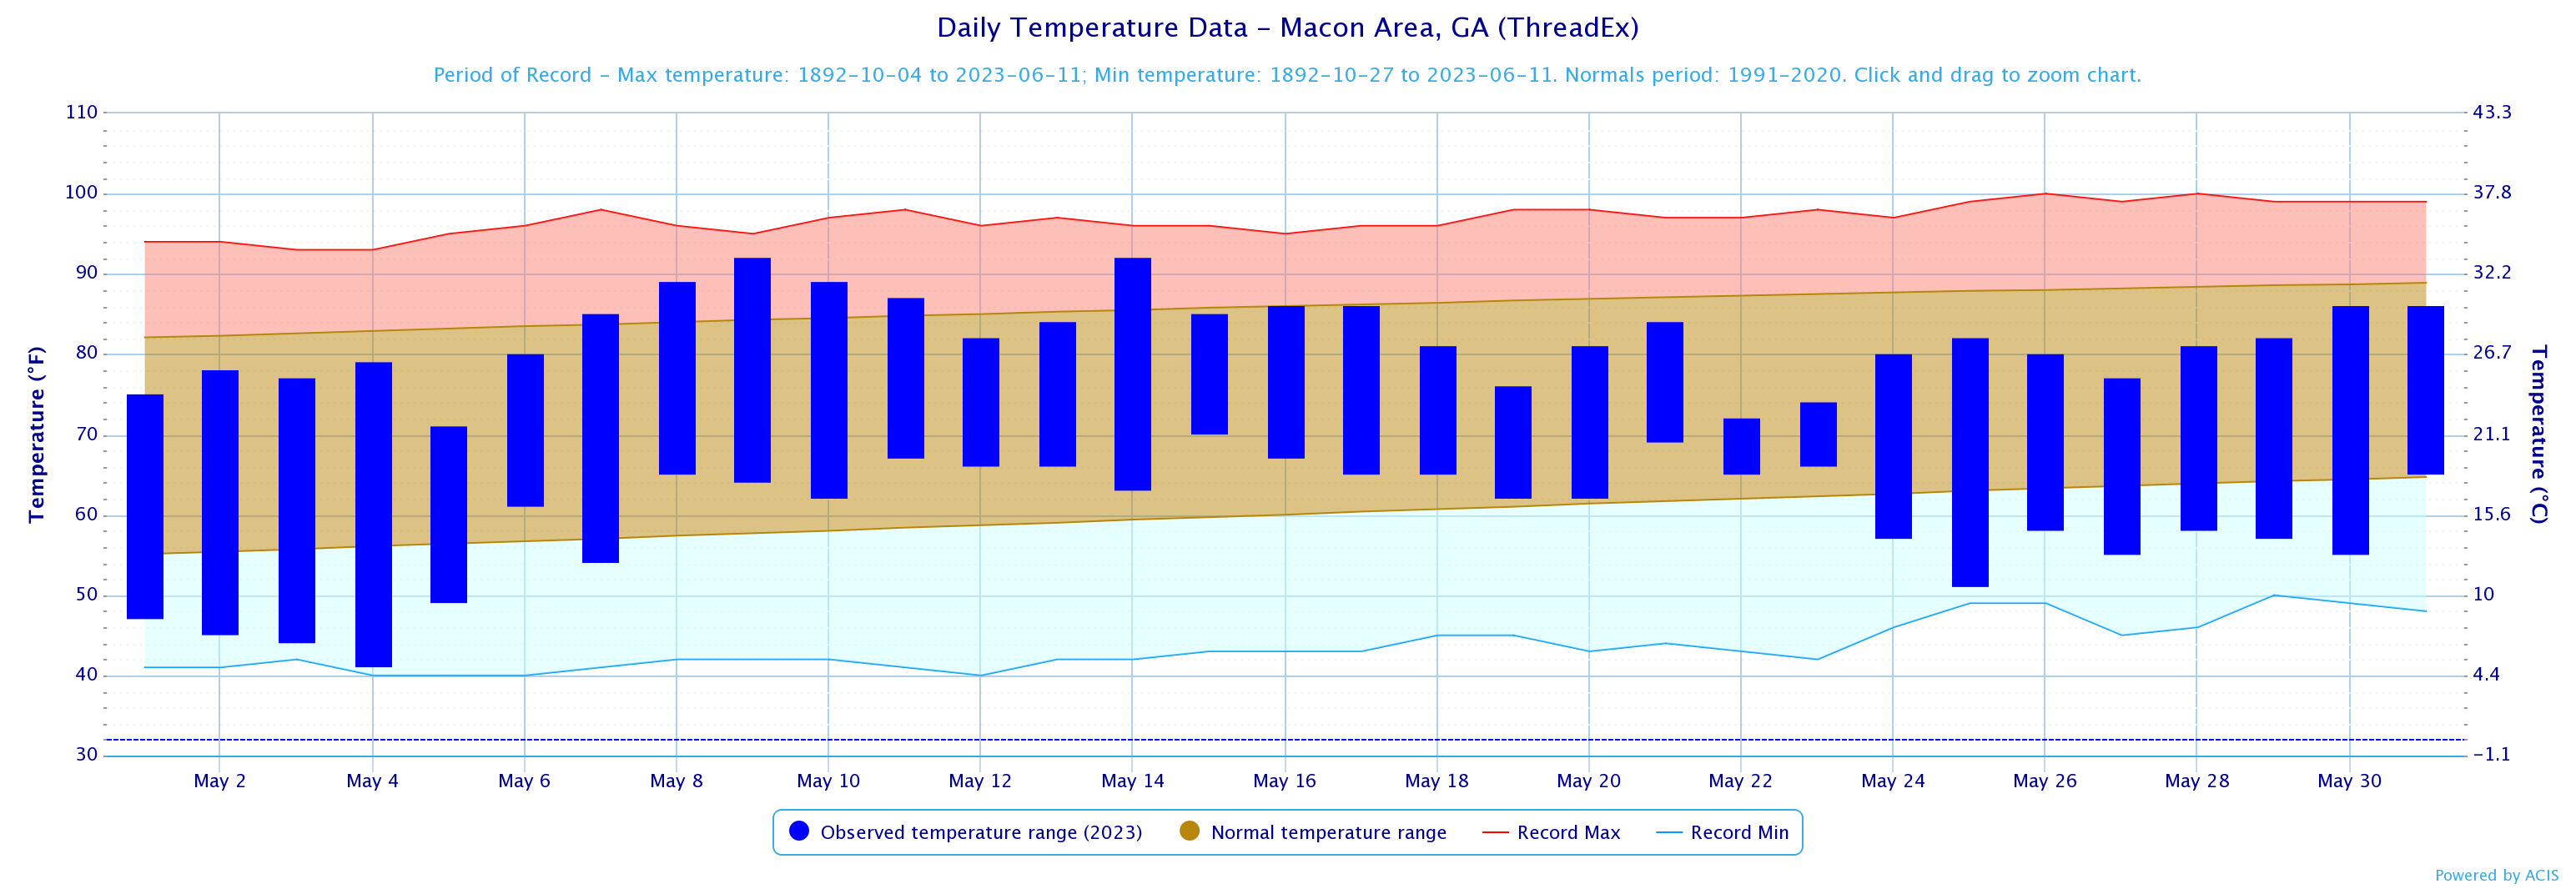
Macon
70.6
72.9
-2.3
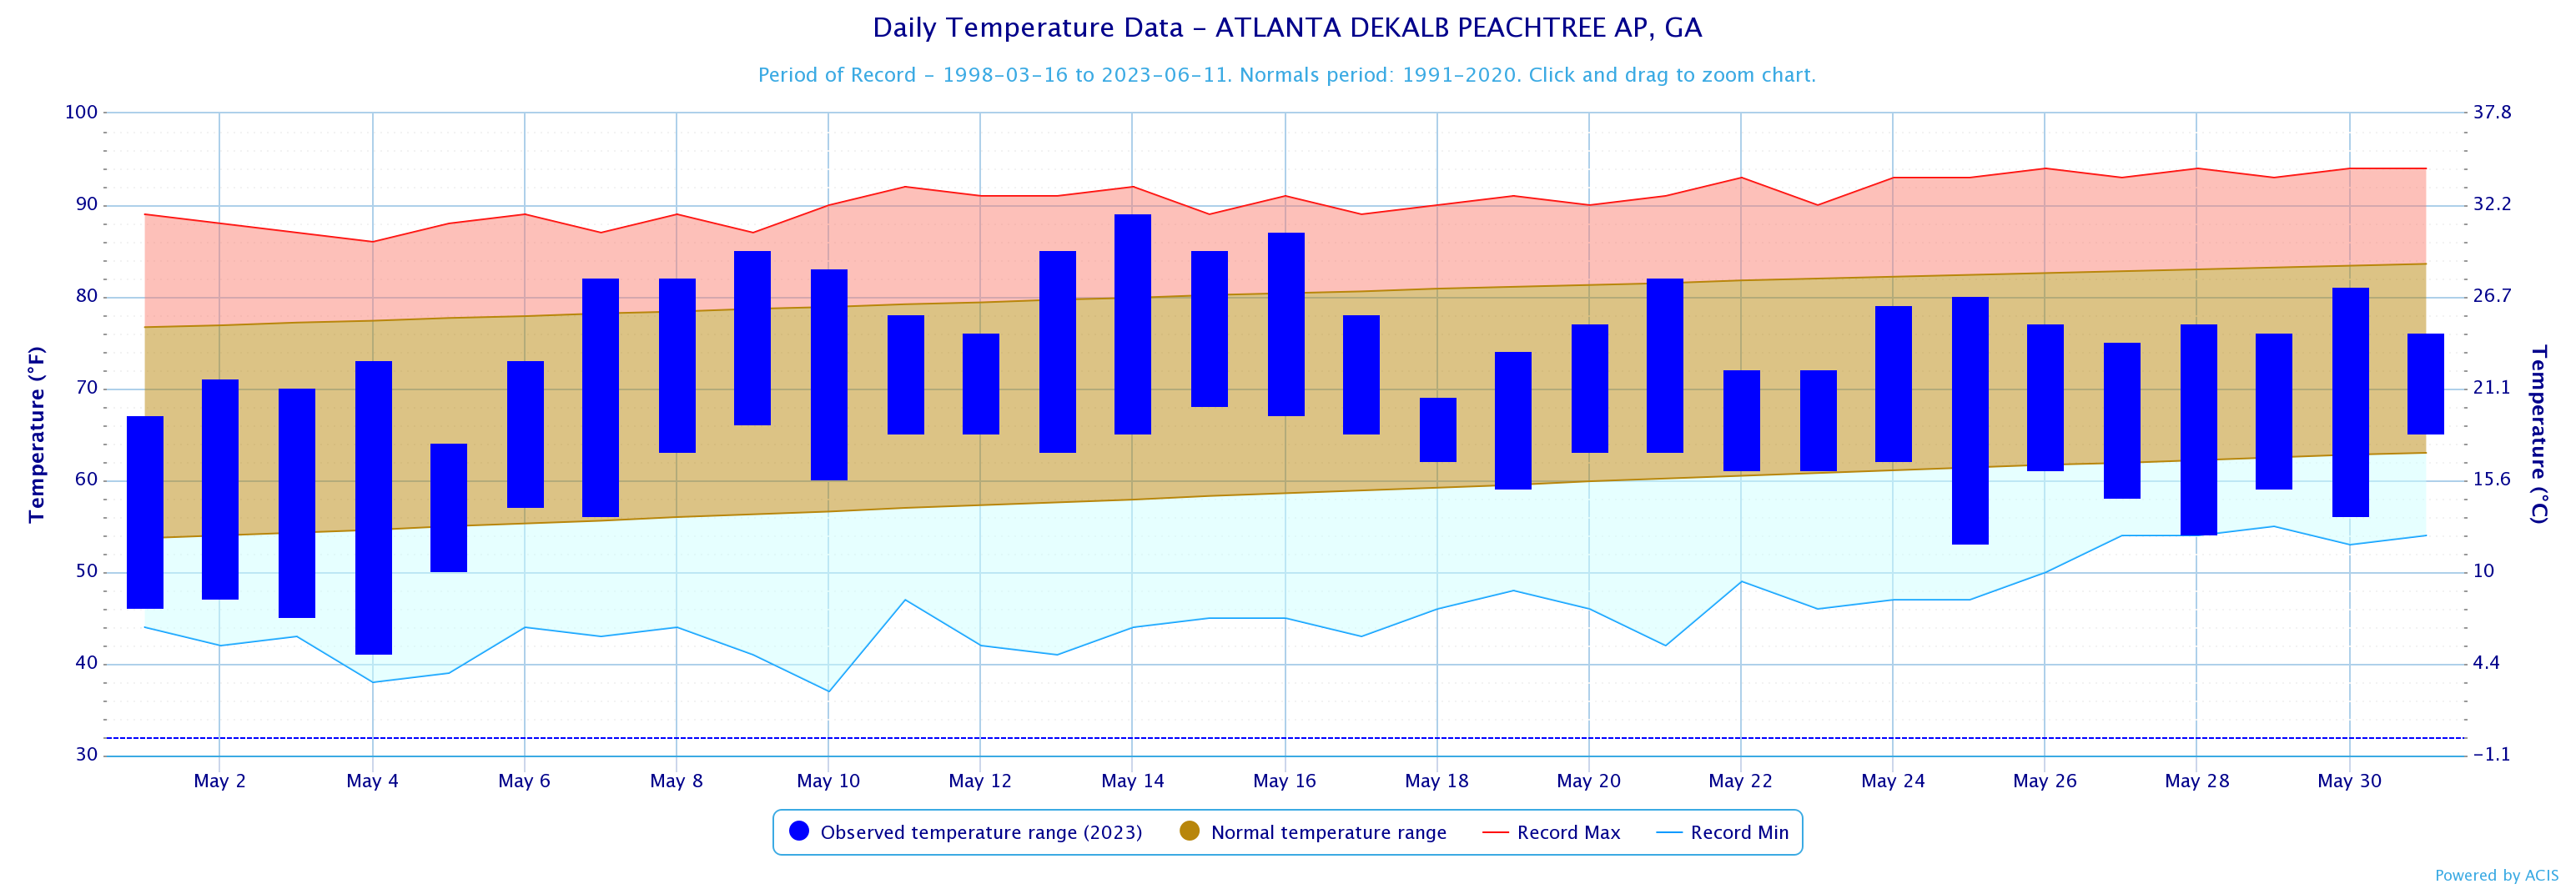
Dekalb Peachtree Arpt
68.1
69.4
-1.3
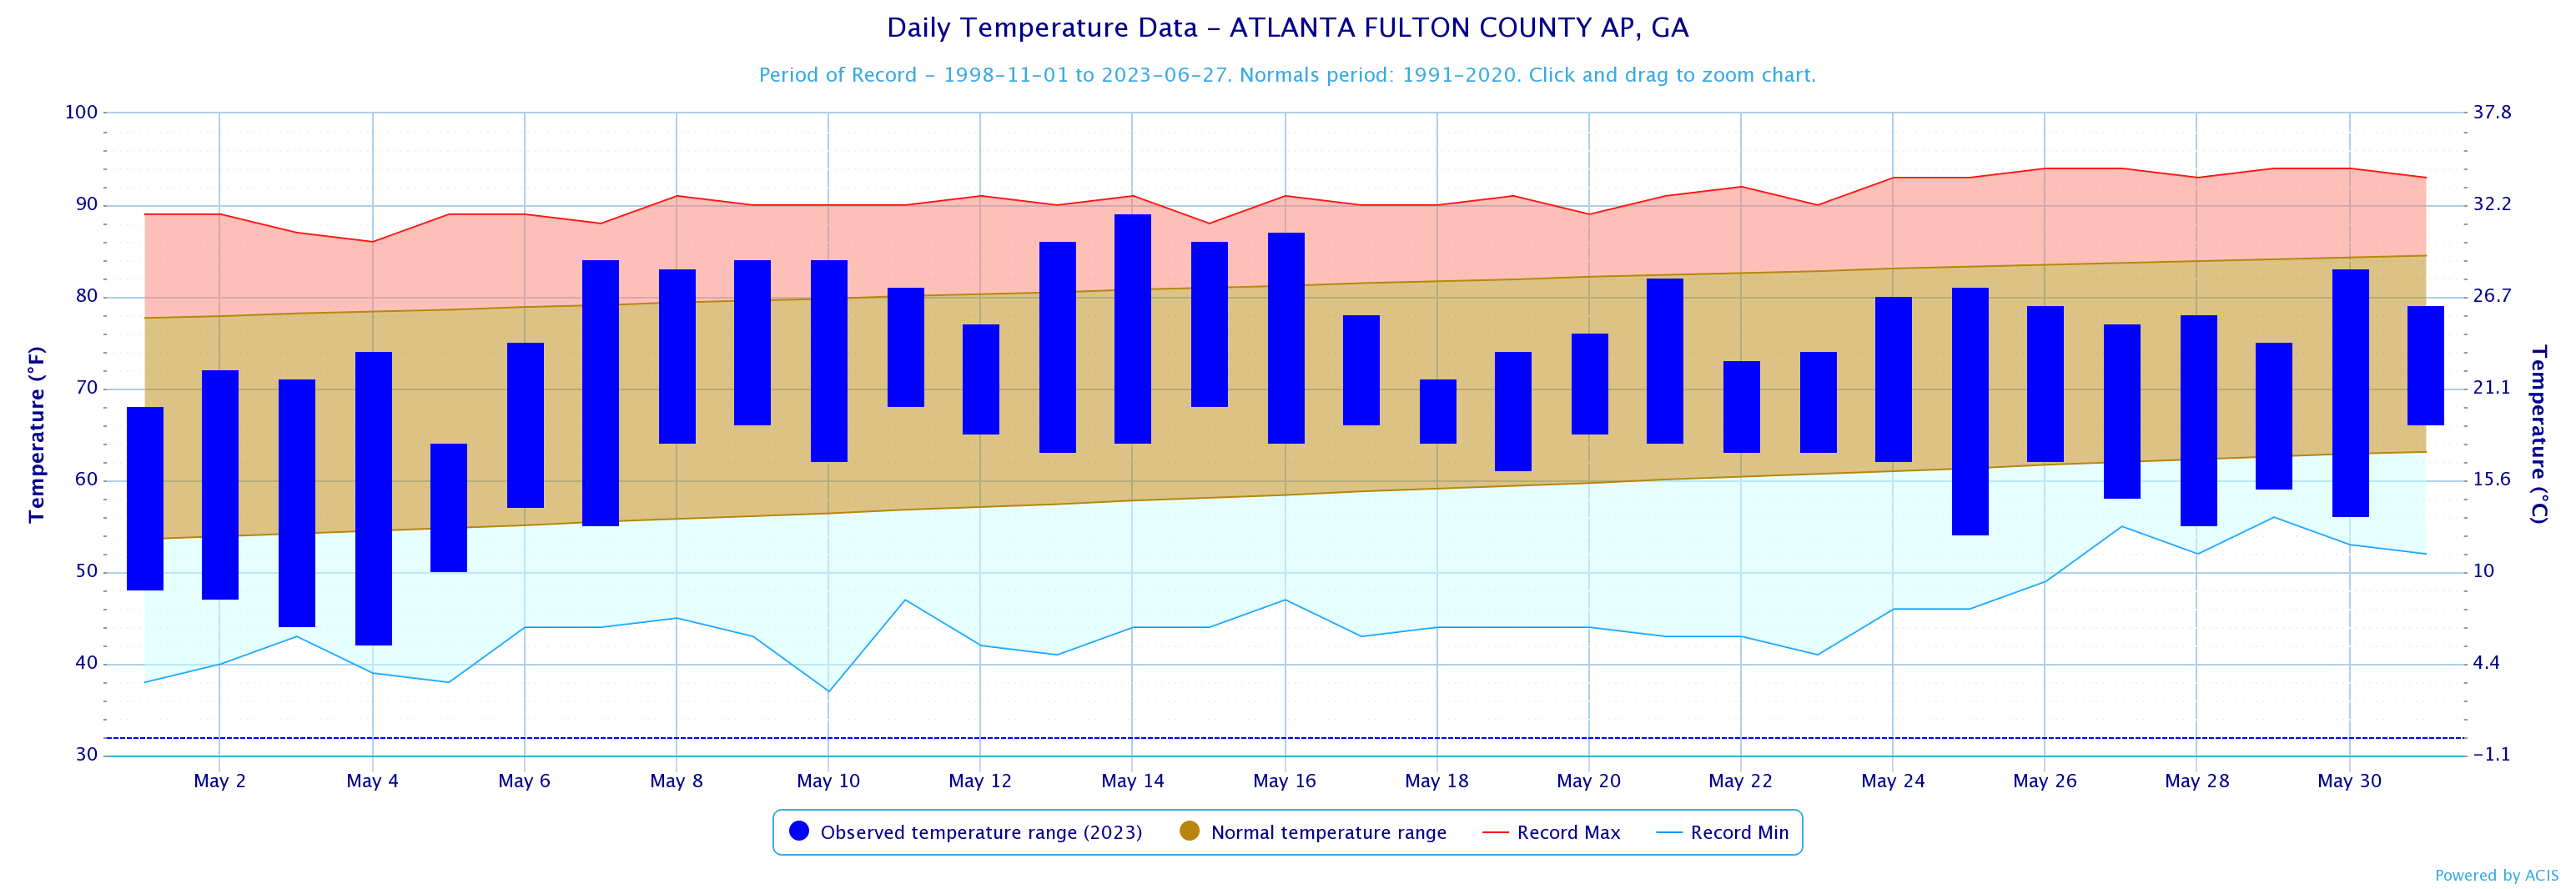
Fulton Co Arpt
68.9
69.8
-0.9
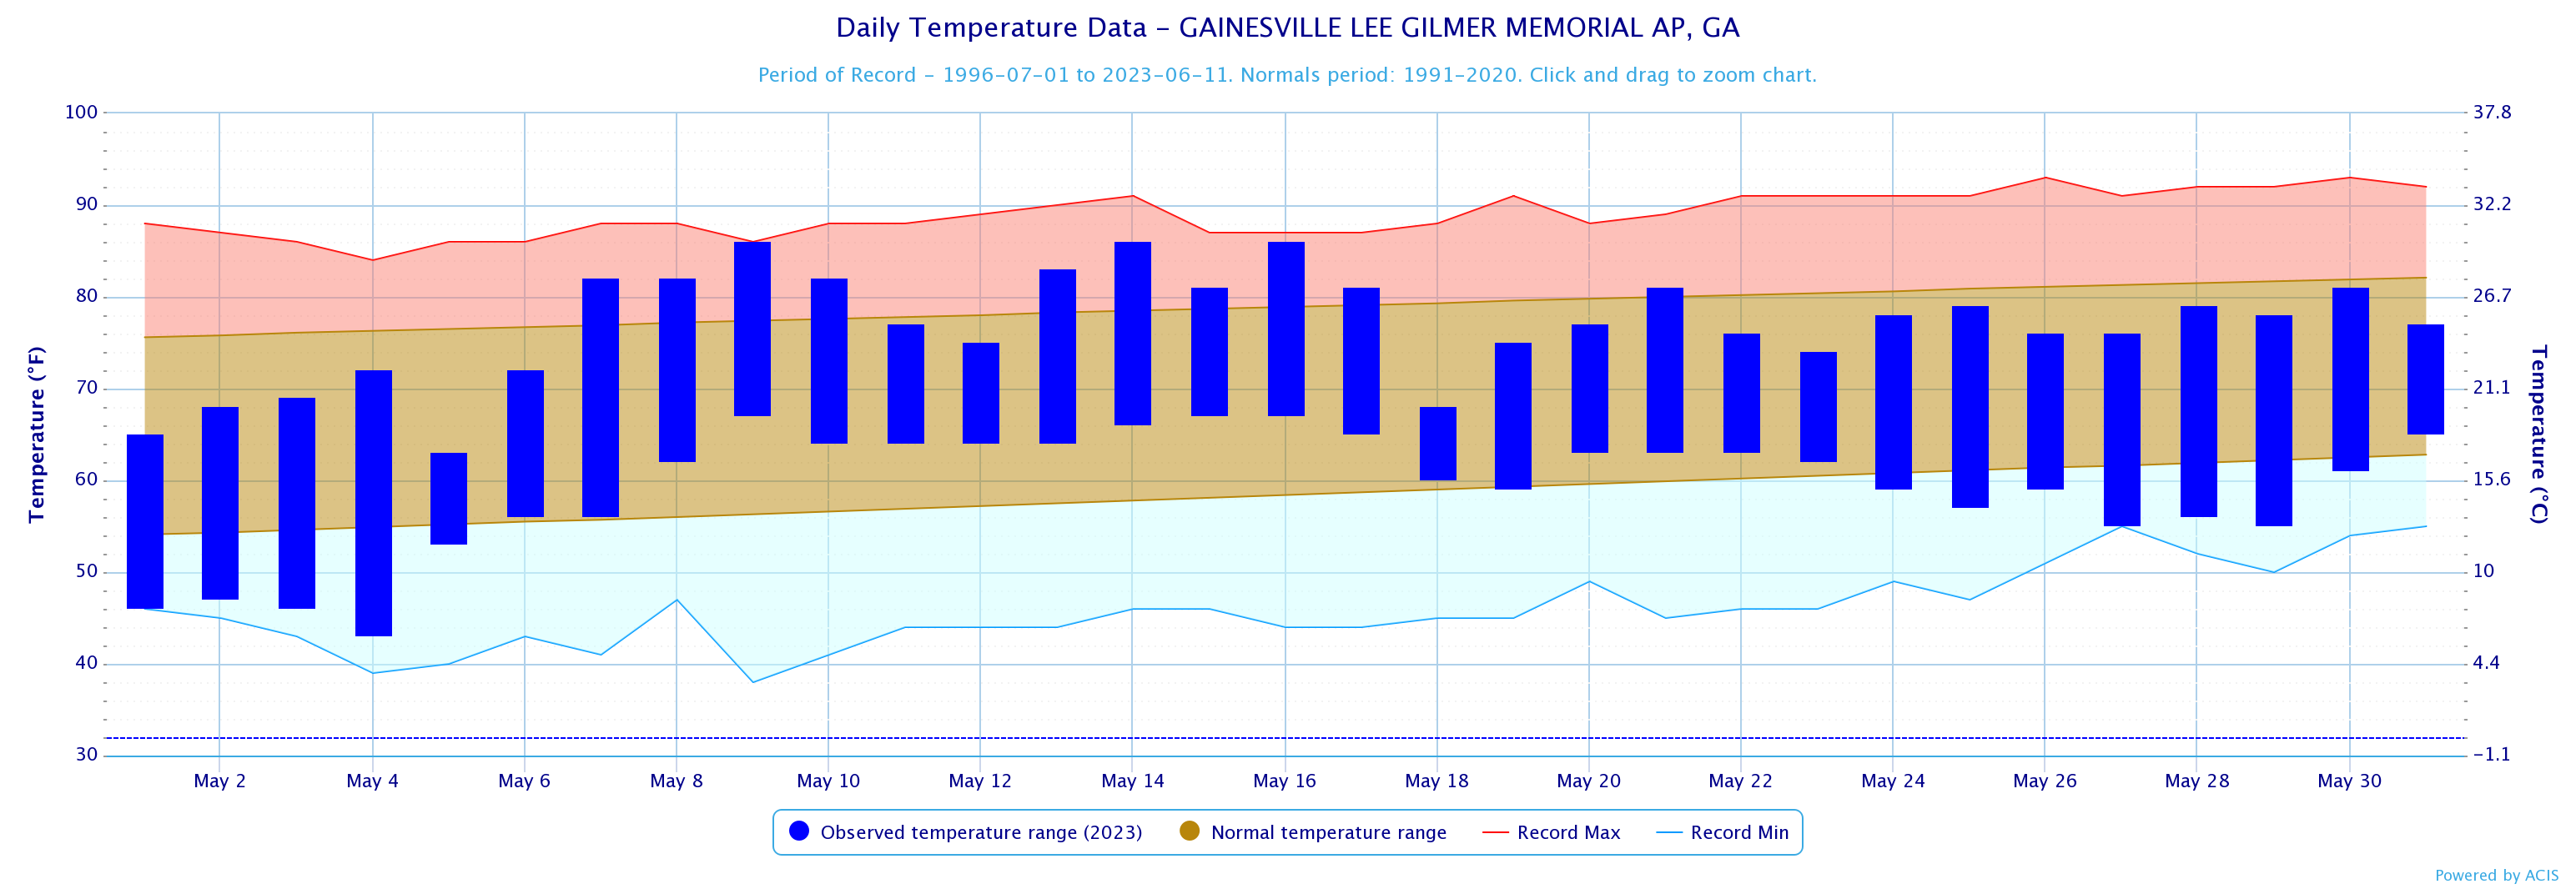
Gainesville
68.0
68.7
-0.7
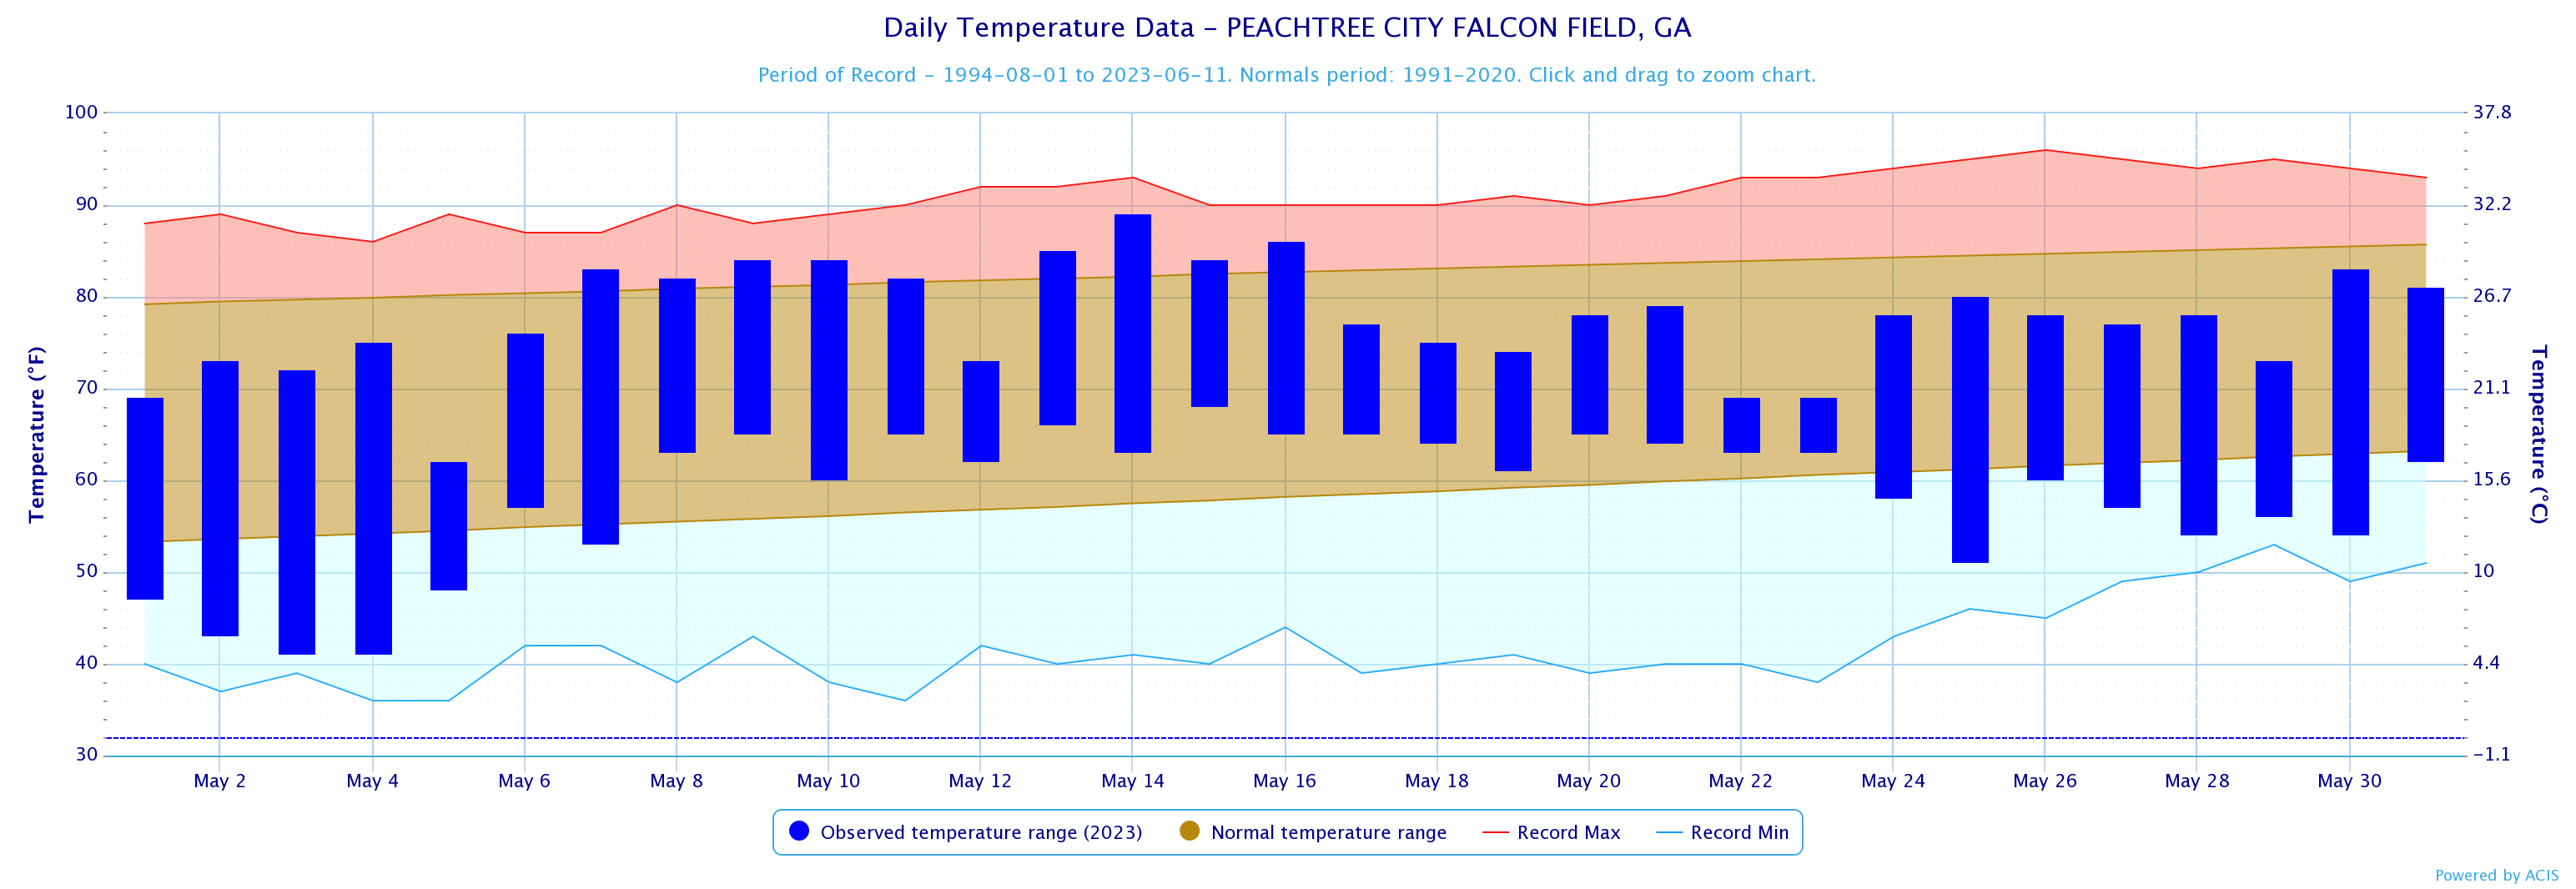
Peachtree City
67.9
70.4
-2.5
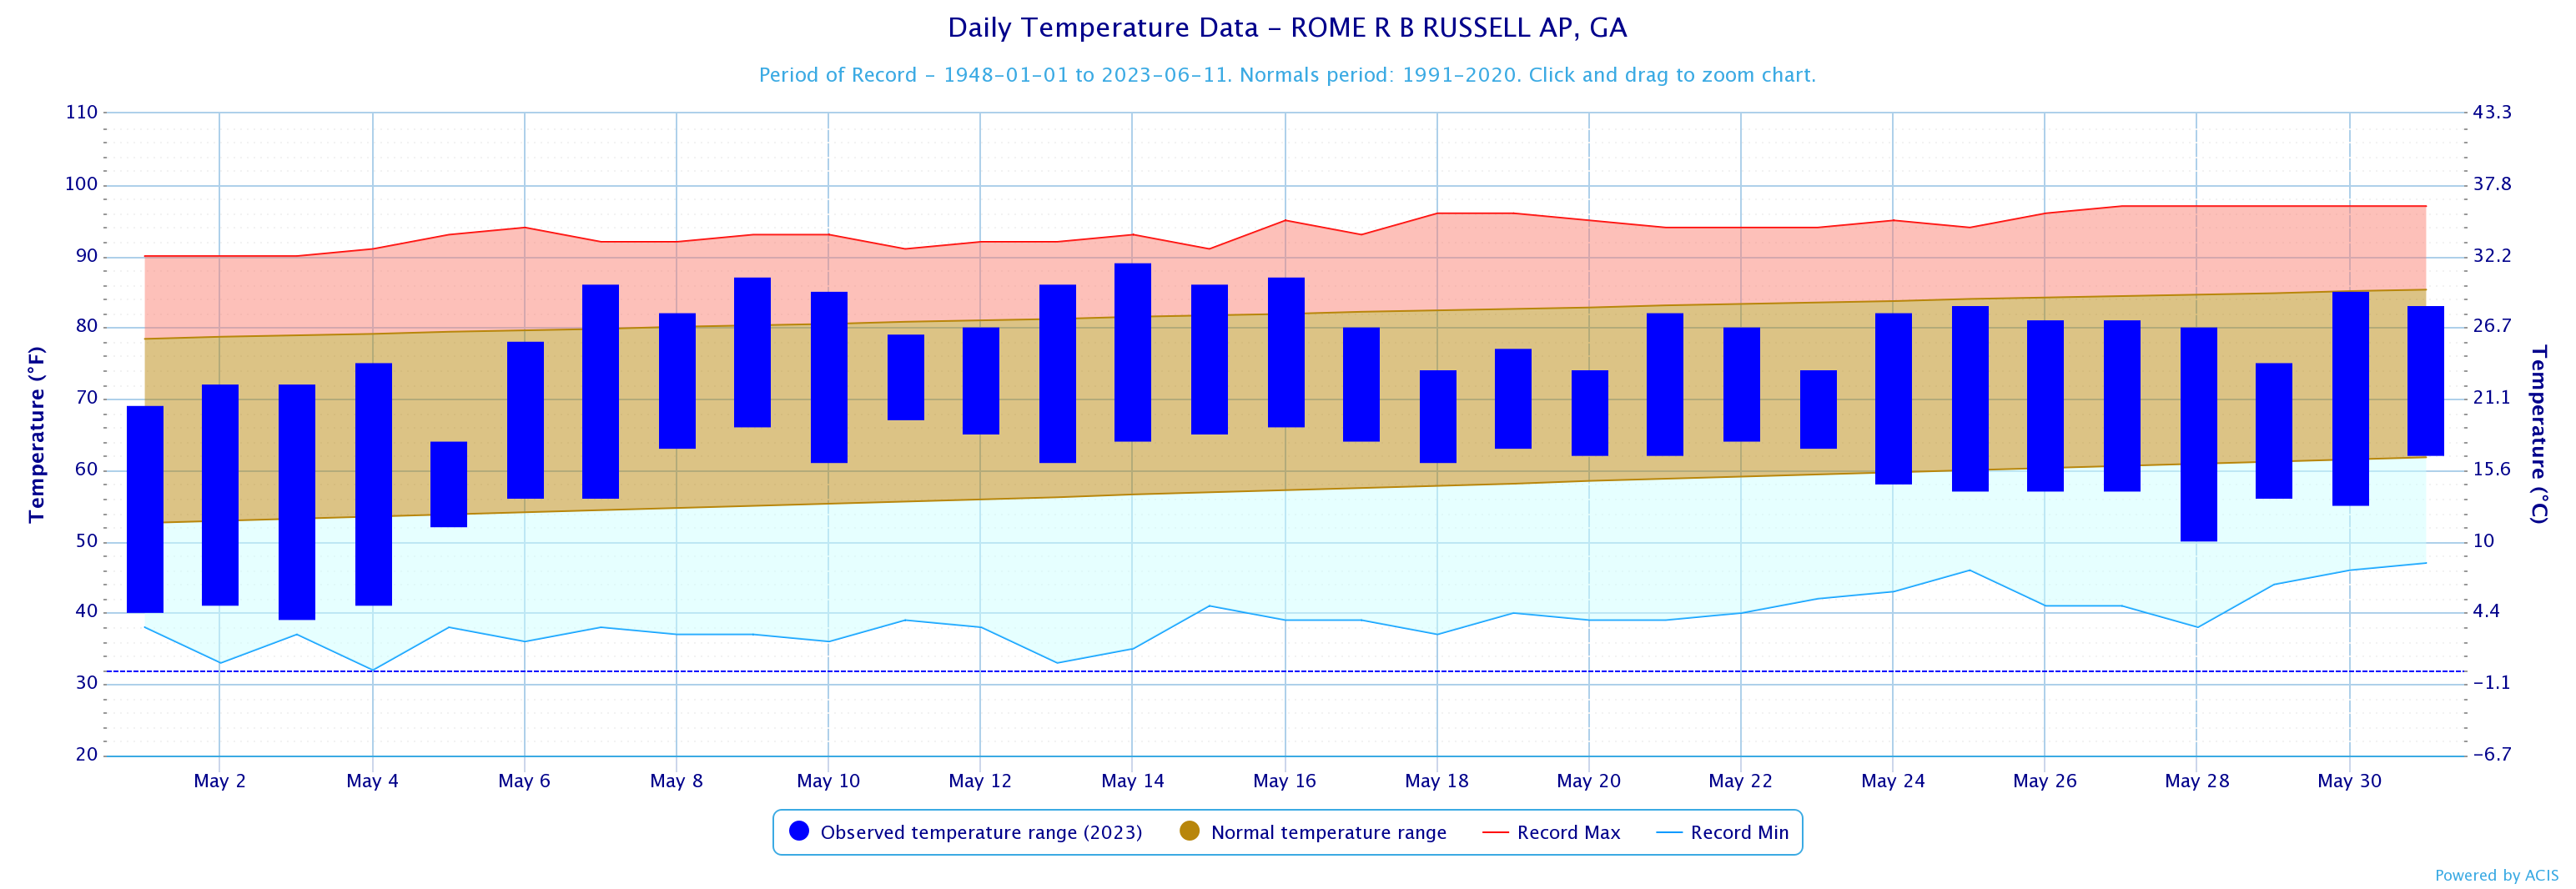
Rome
68.7
69.5
-0.8
May 2023 Temperature Climate Statistics
Minimum Temperature
Min T Date
Athens
89
5/9
38
5/4
Atlanta
90
5/14
48
5/2
Columbus
92
5/14
45
5/2
Macon
92
5/9, 14
41
5/4
Dekalb Peachtree Arpt
89
5/14
41
5/4
Fulton Co Arpt
89
5/14
42
5/4
Gainesville
86
5/9, 14, 16
43
5/4
Peachtree City
89
5/14
41
5/3, 4
Rome
89
5/14
39
5/3
May 2023 Precipitation Climate Statistics
Average Precipitation
From Normal)
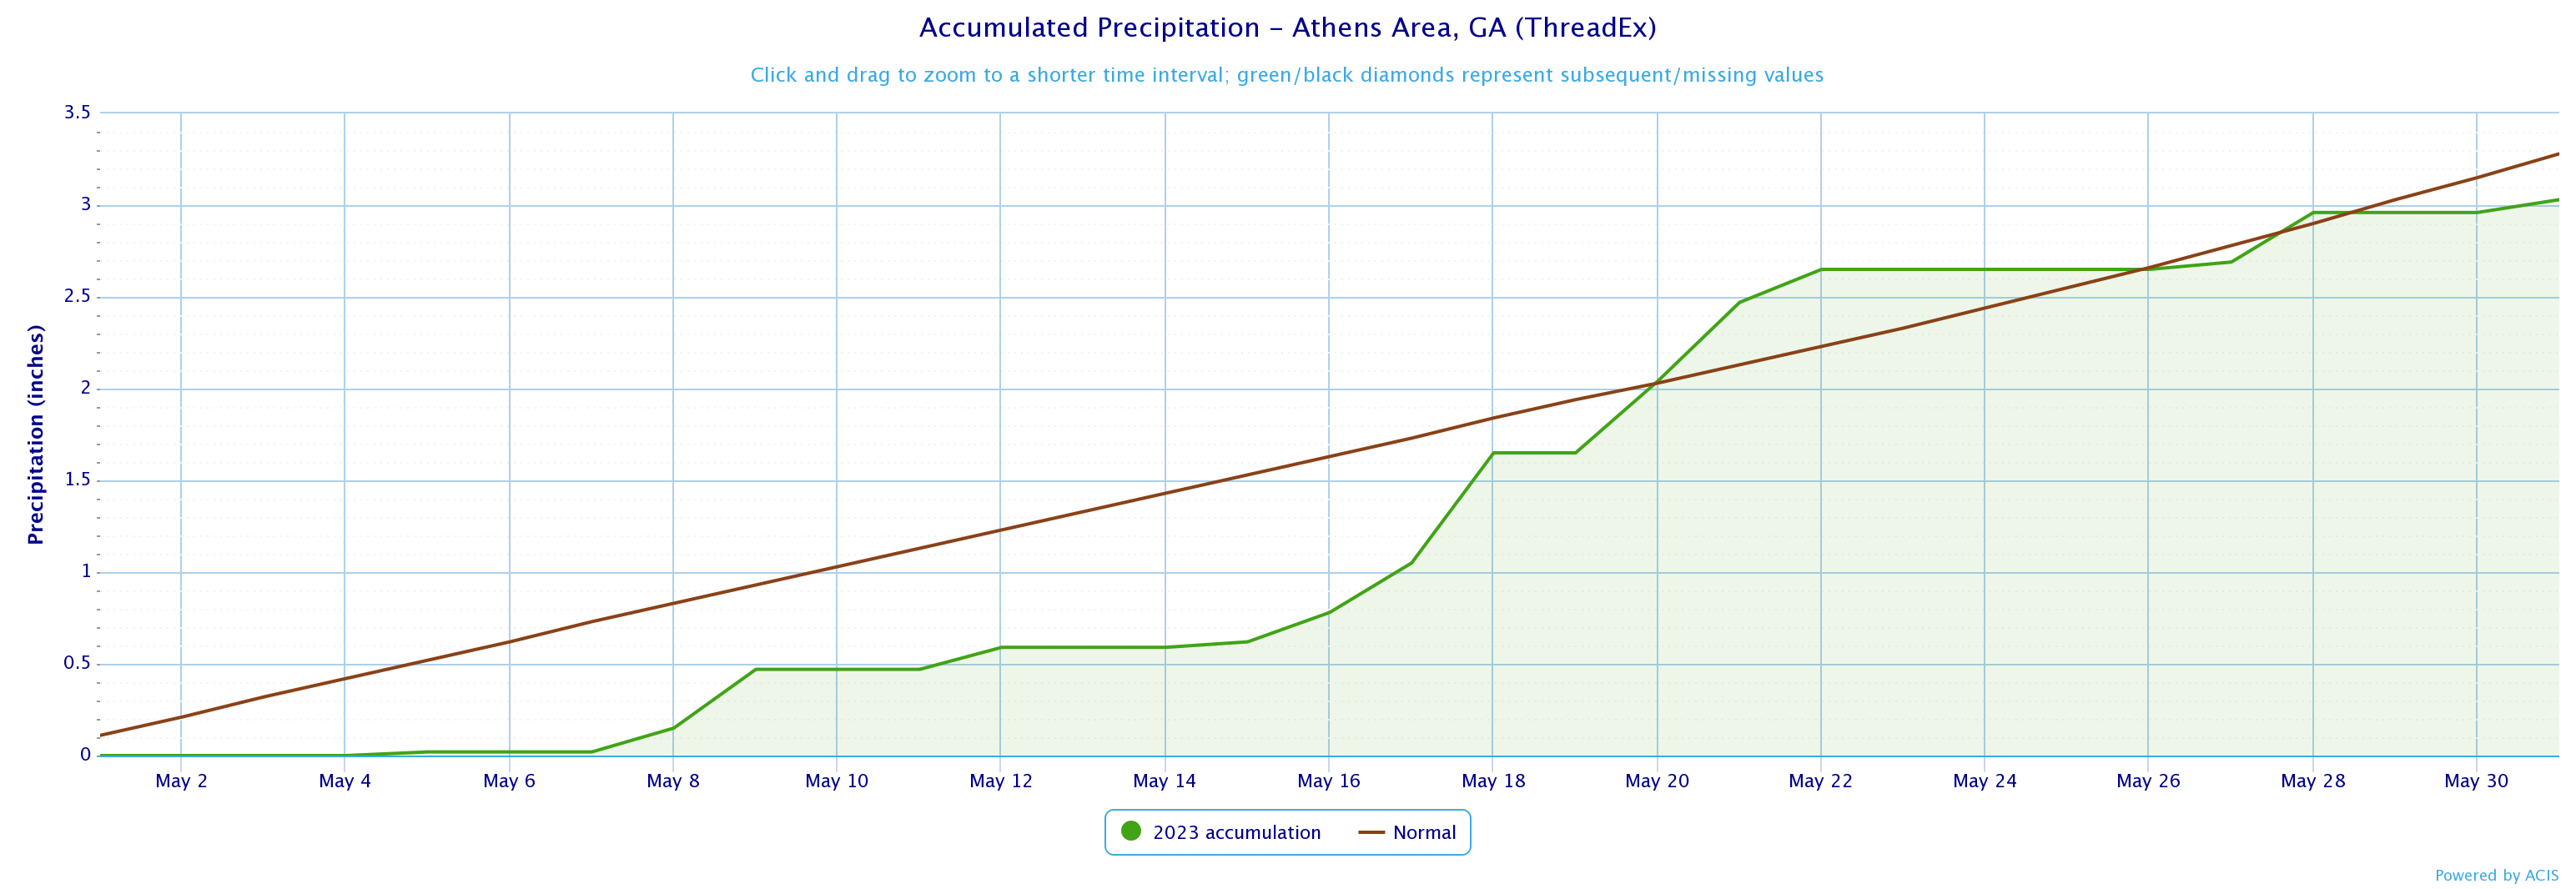
Athens
3.03
3.28
-0.25
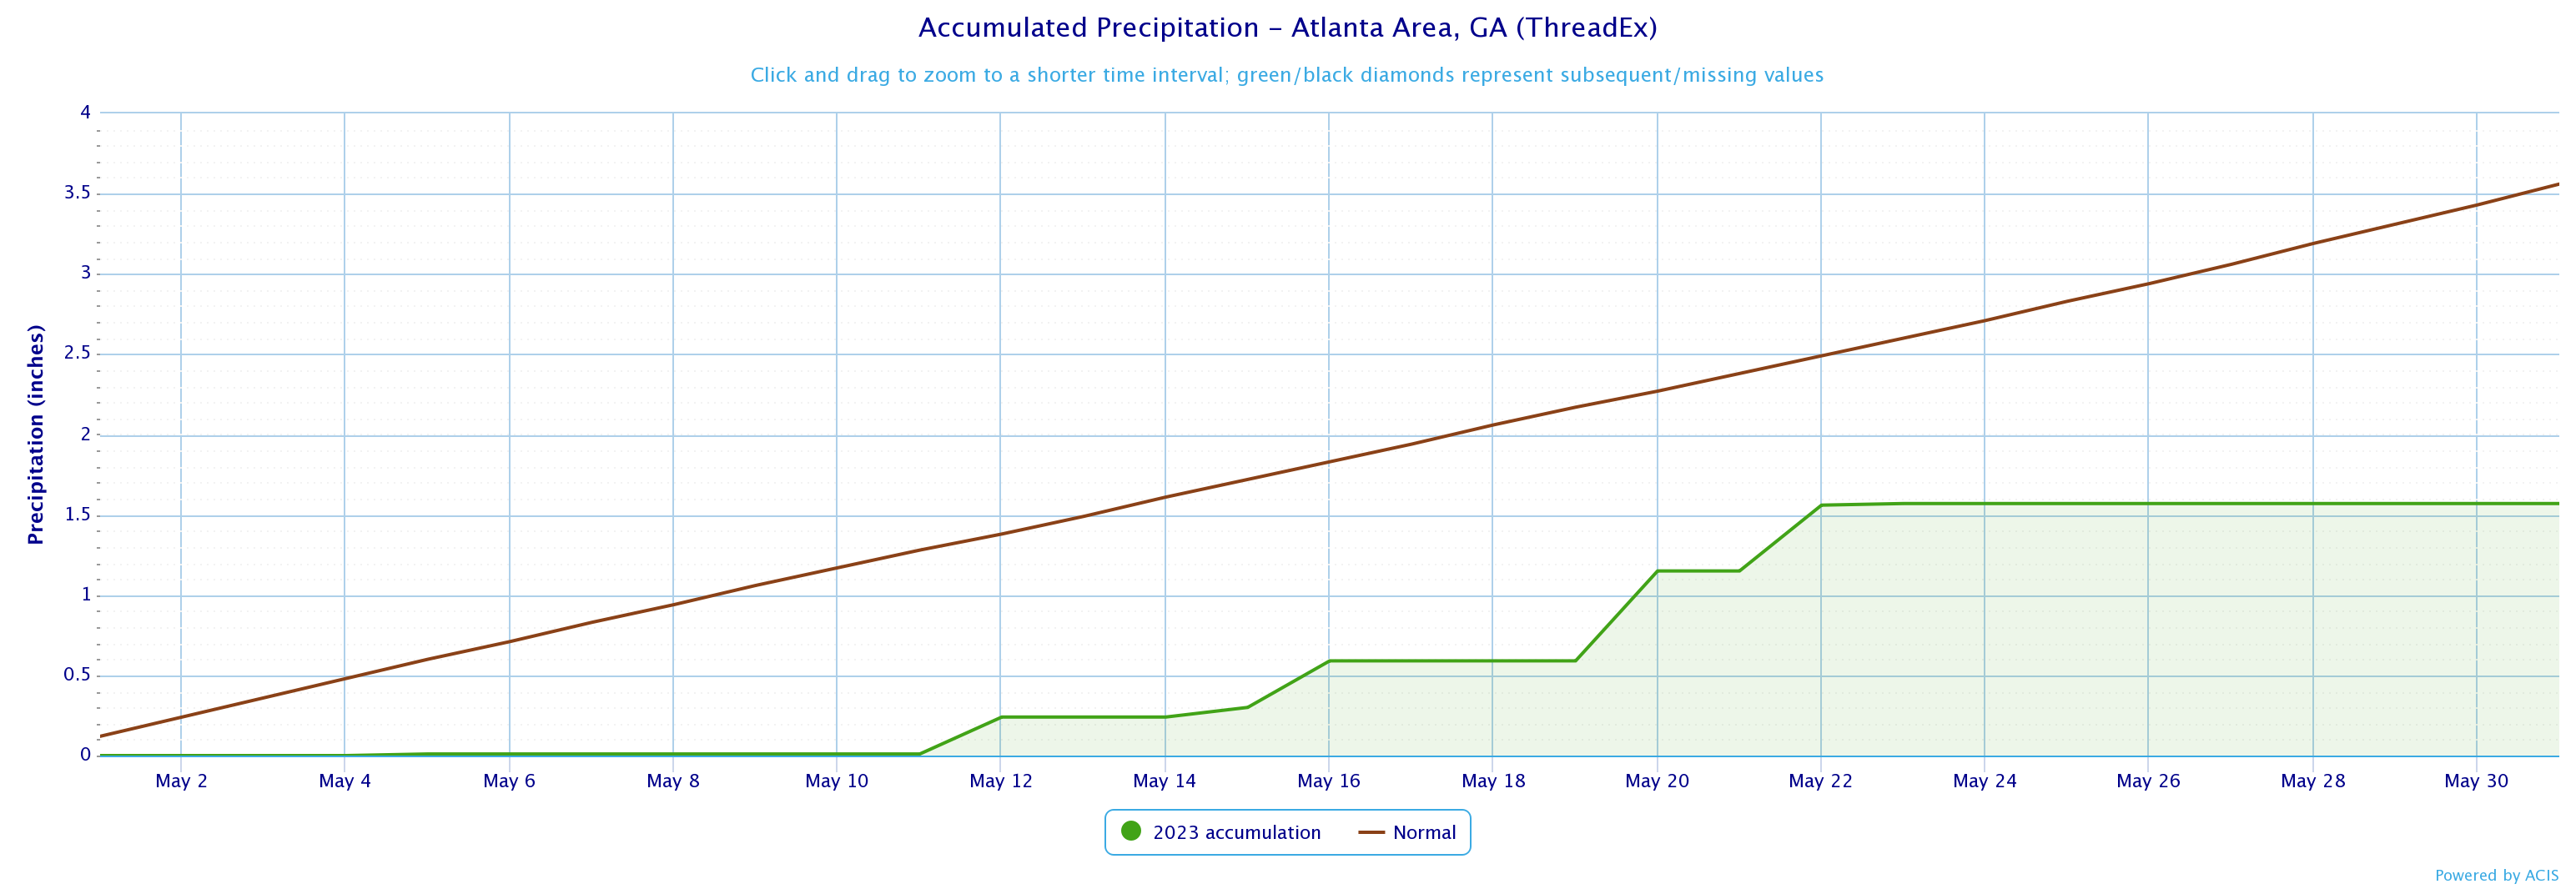
Atlanta
1.57
3.56
-1.99
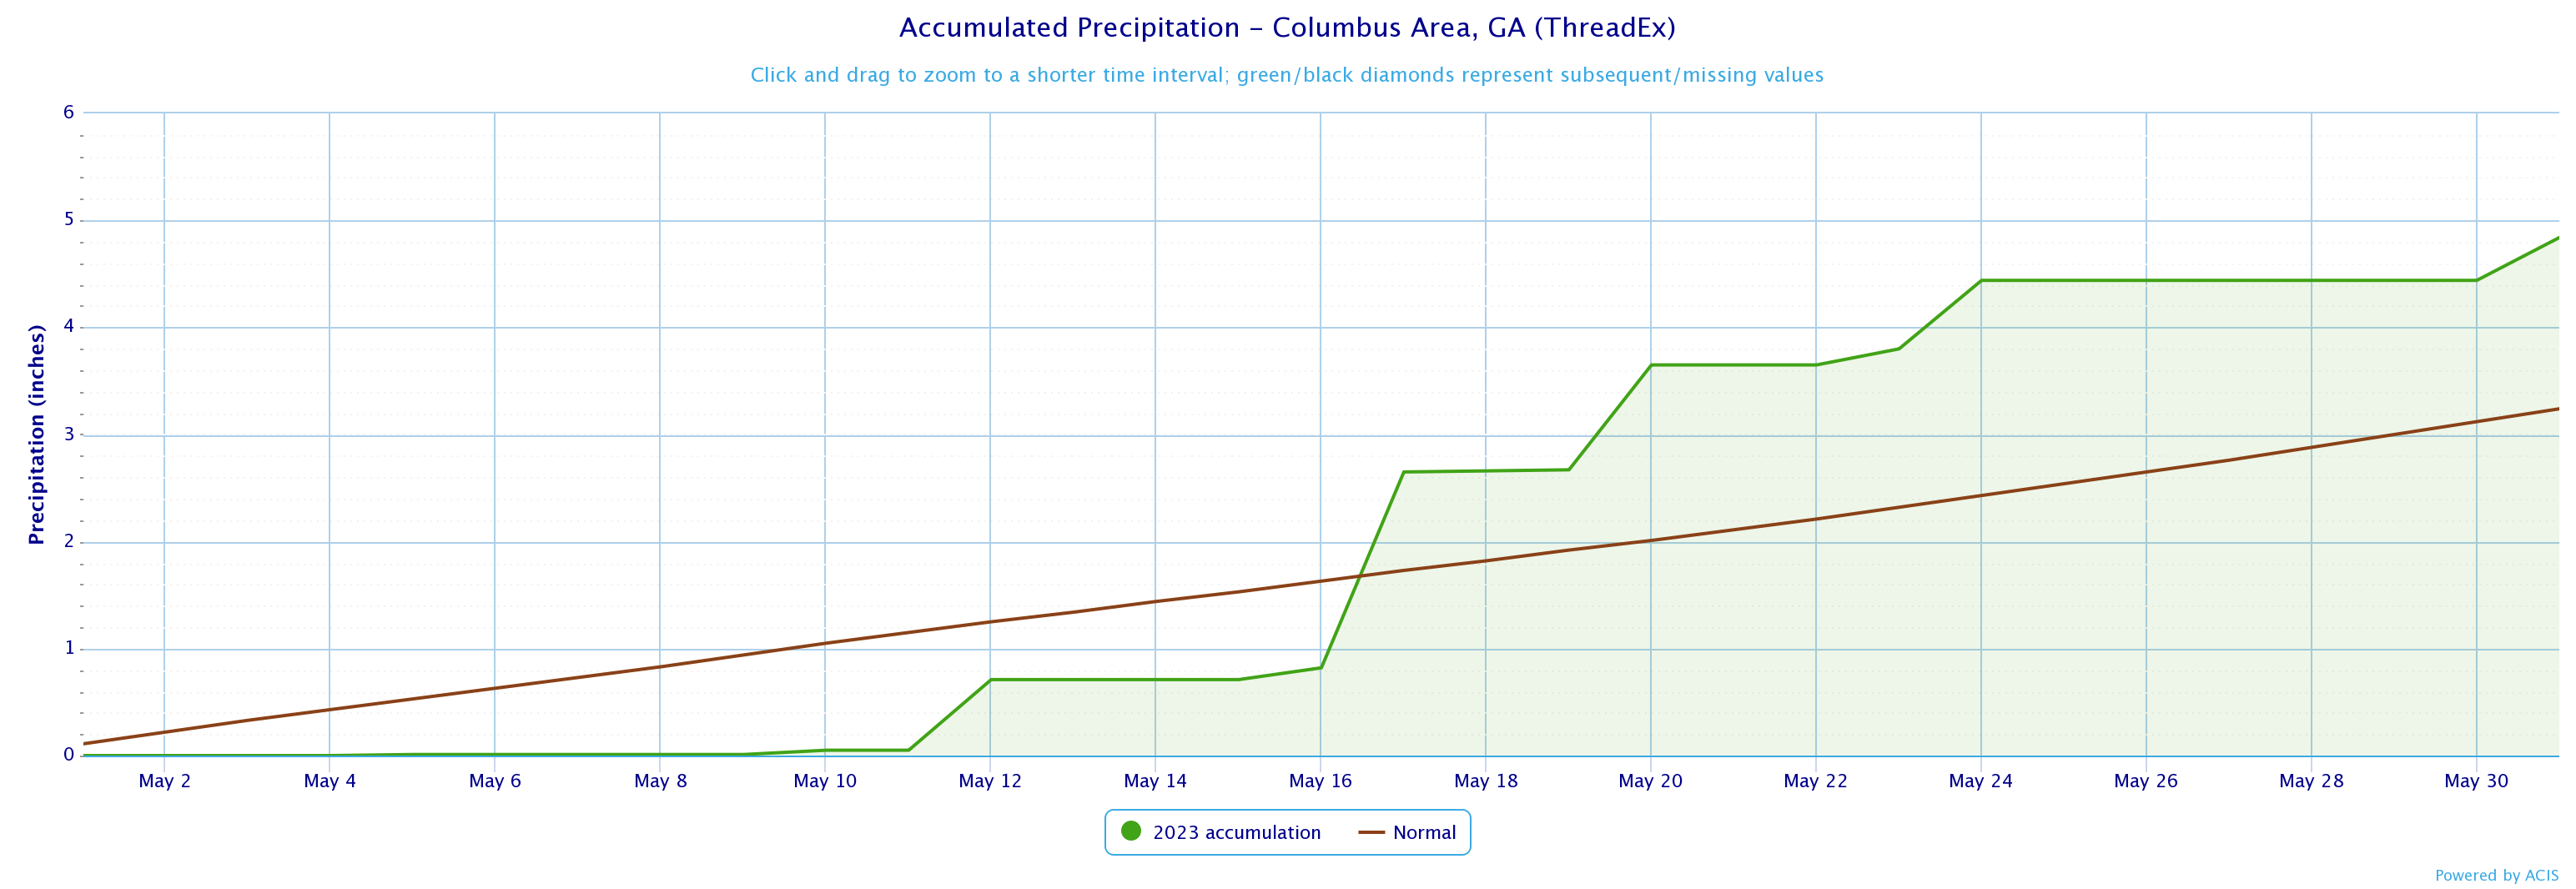
Columbus
4.84
3.24
1.60
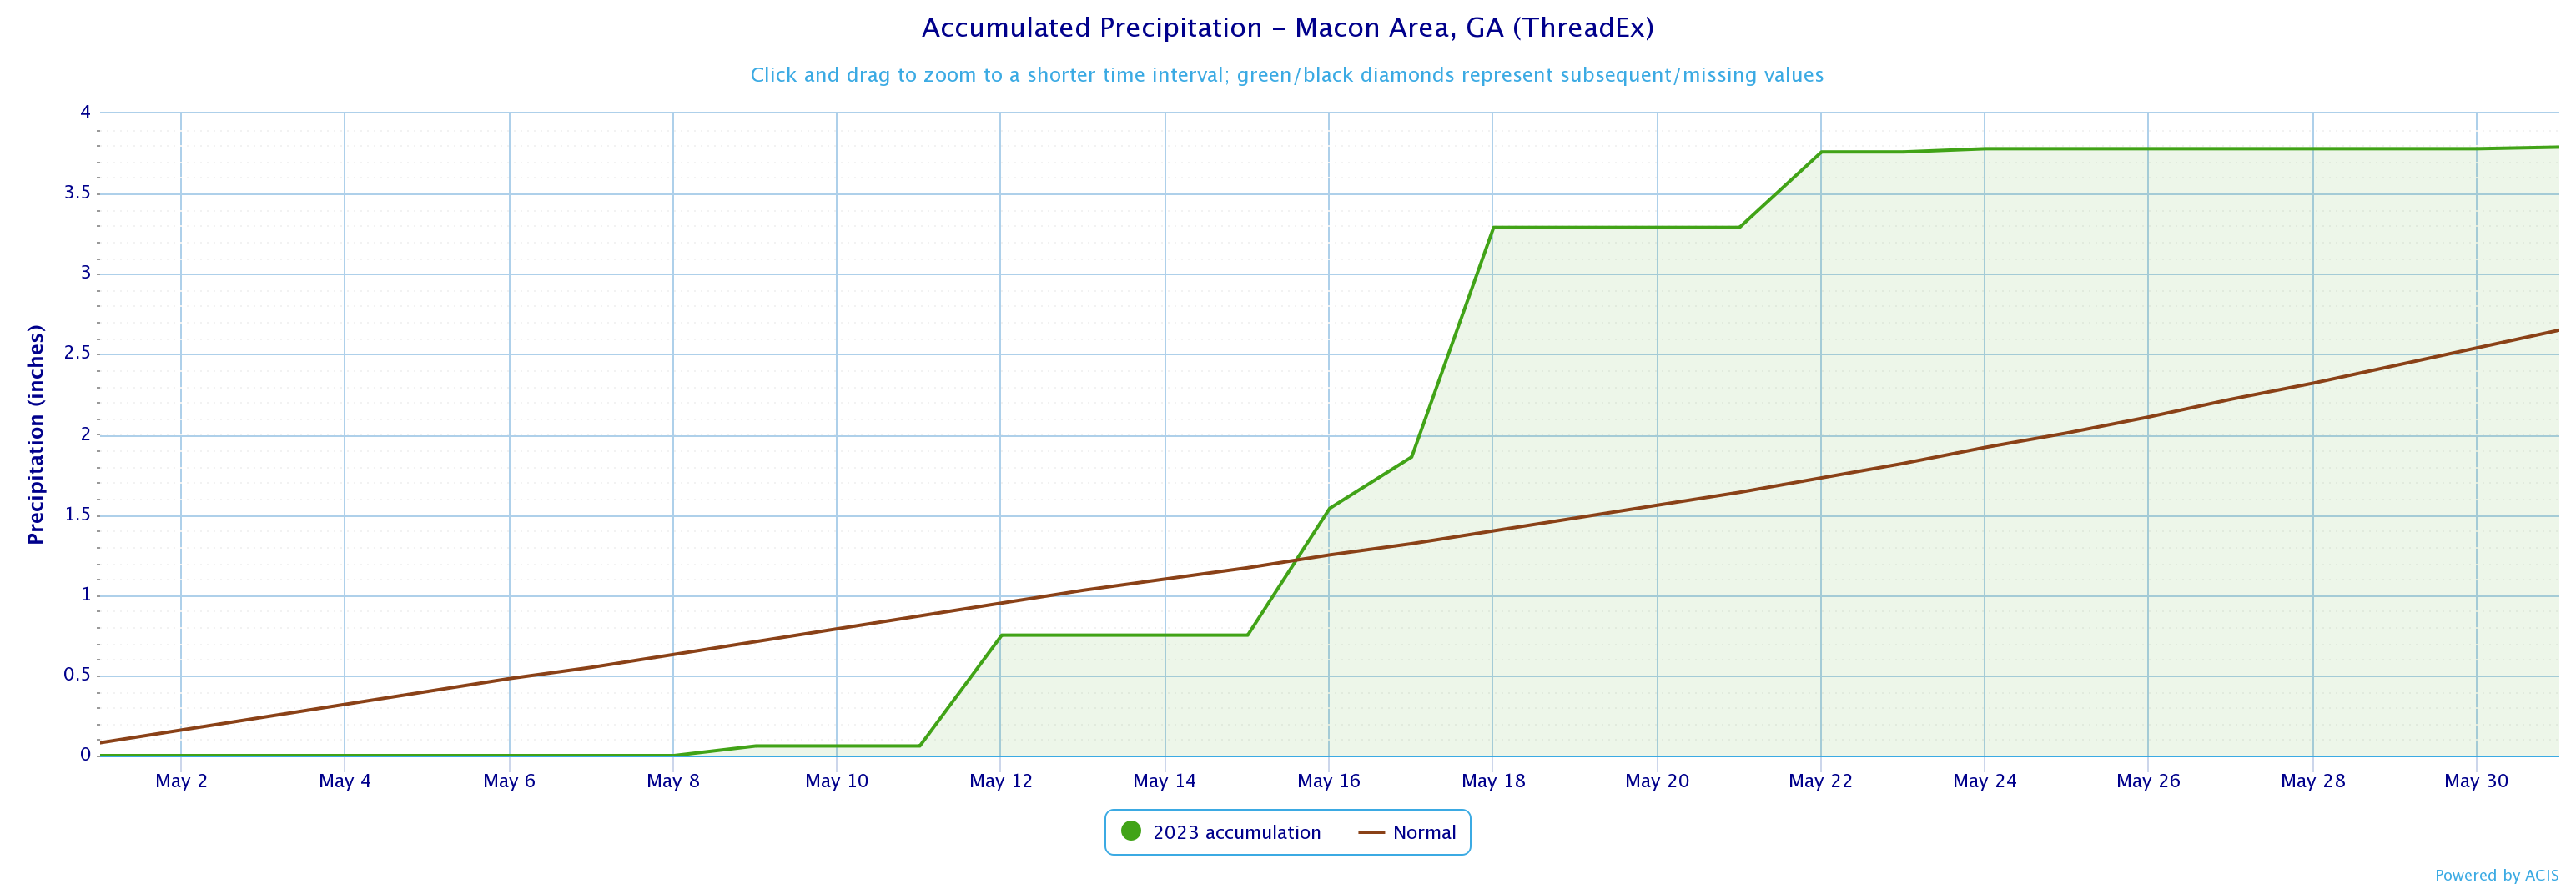
Macon
3.79
2.65
1.14
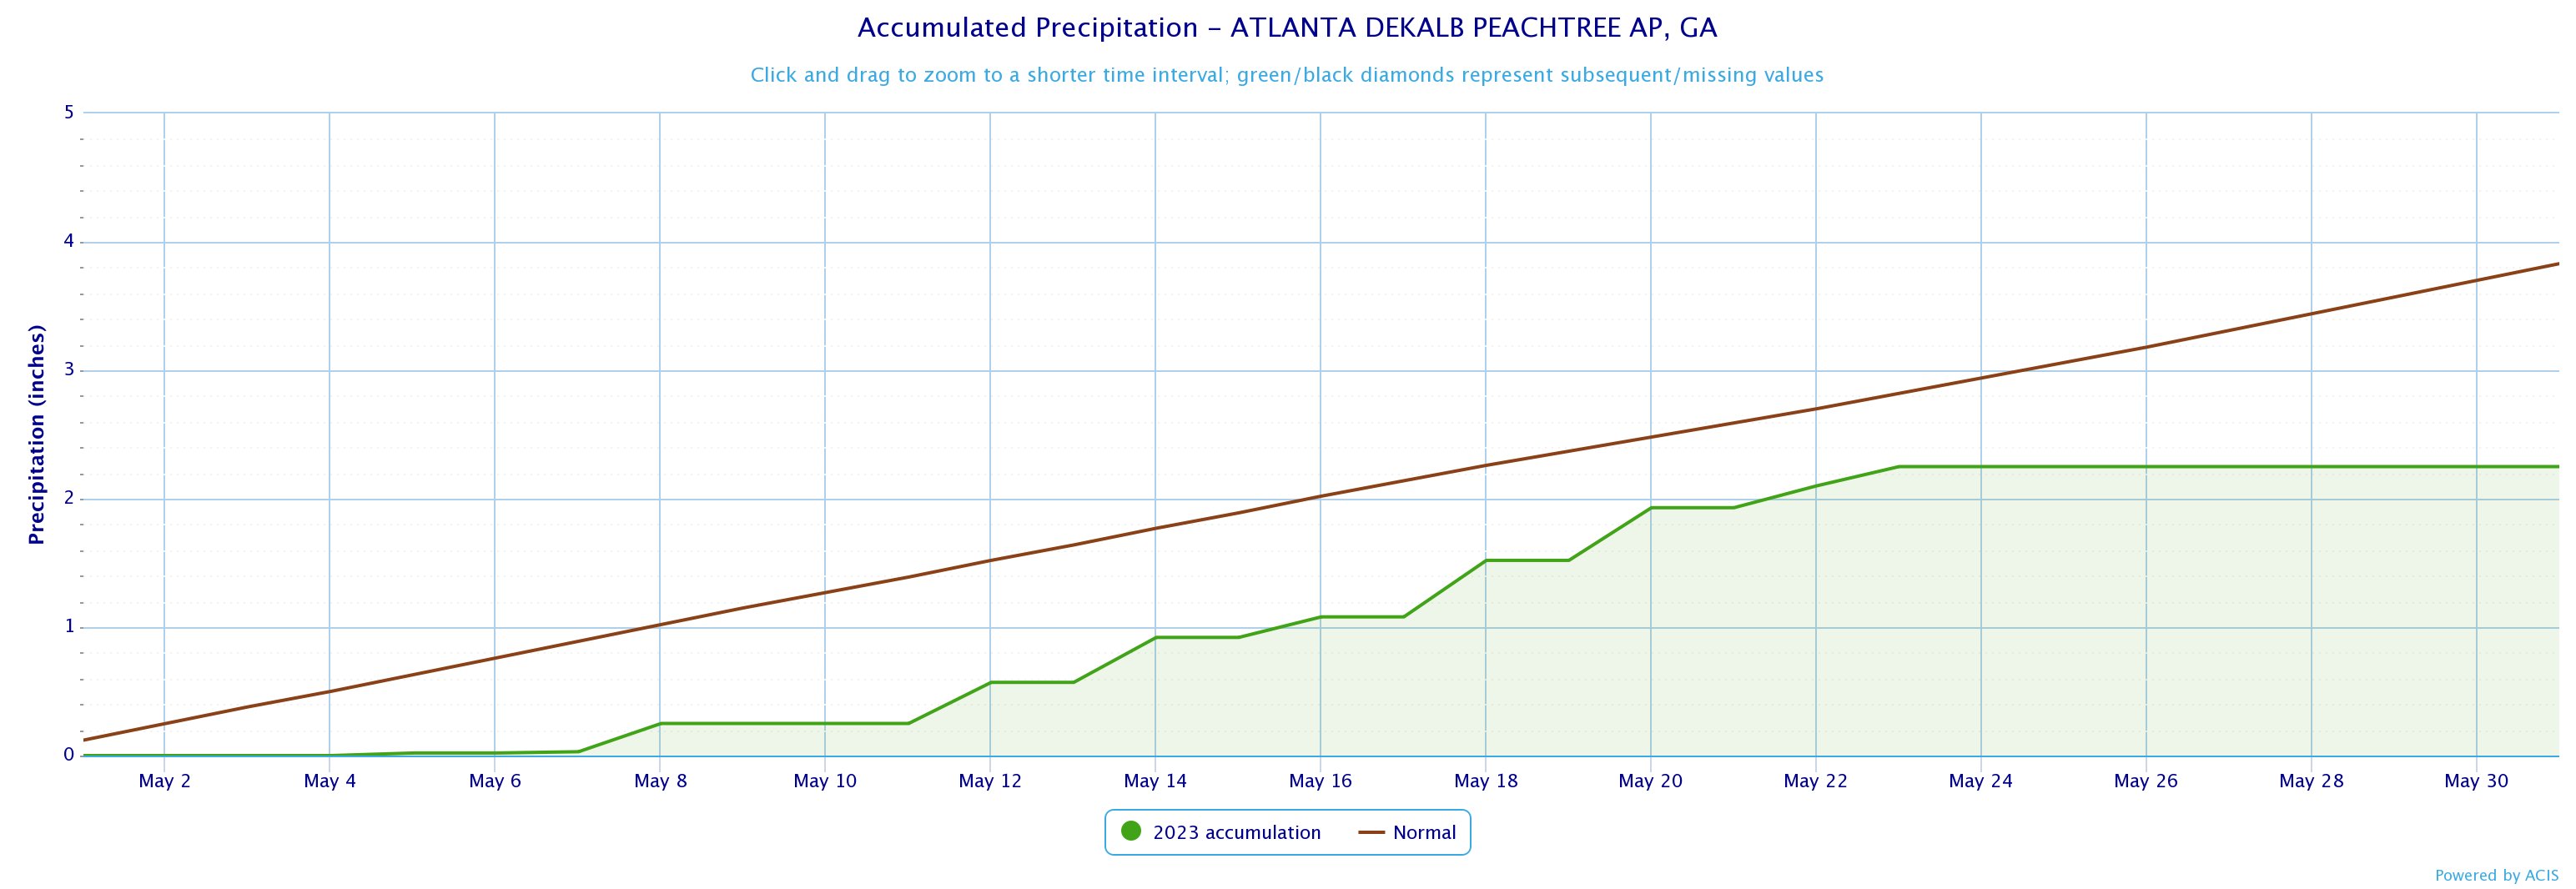
Dekalb Peachtree Arpt
2.25
3.83
-1.58
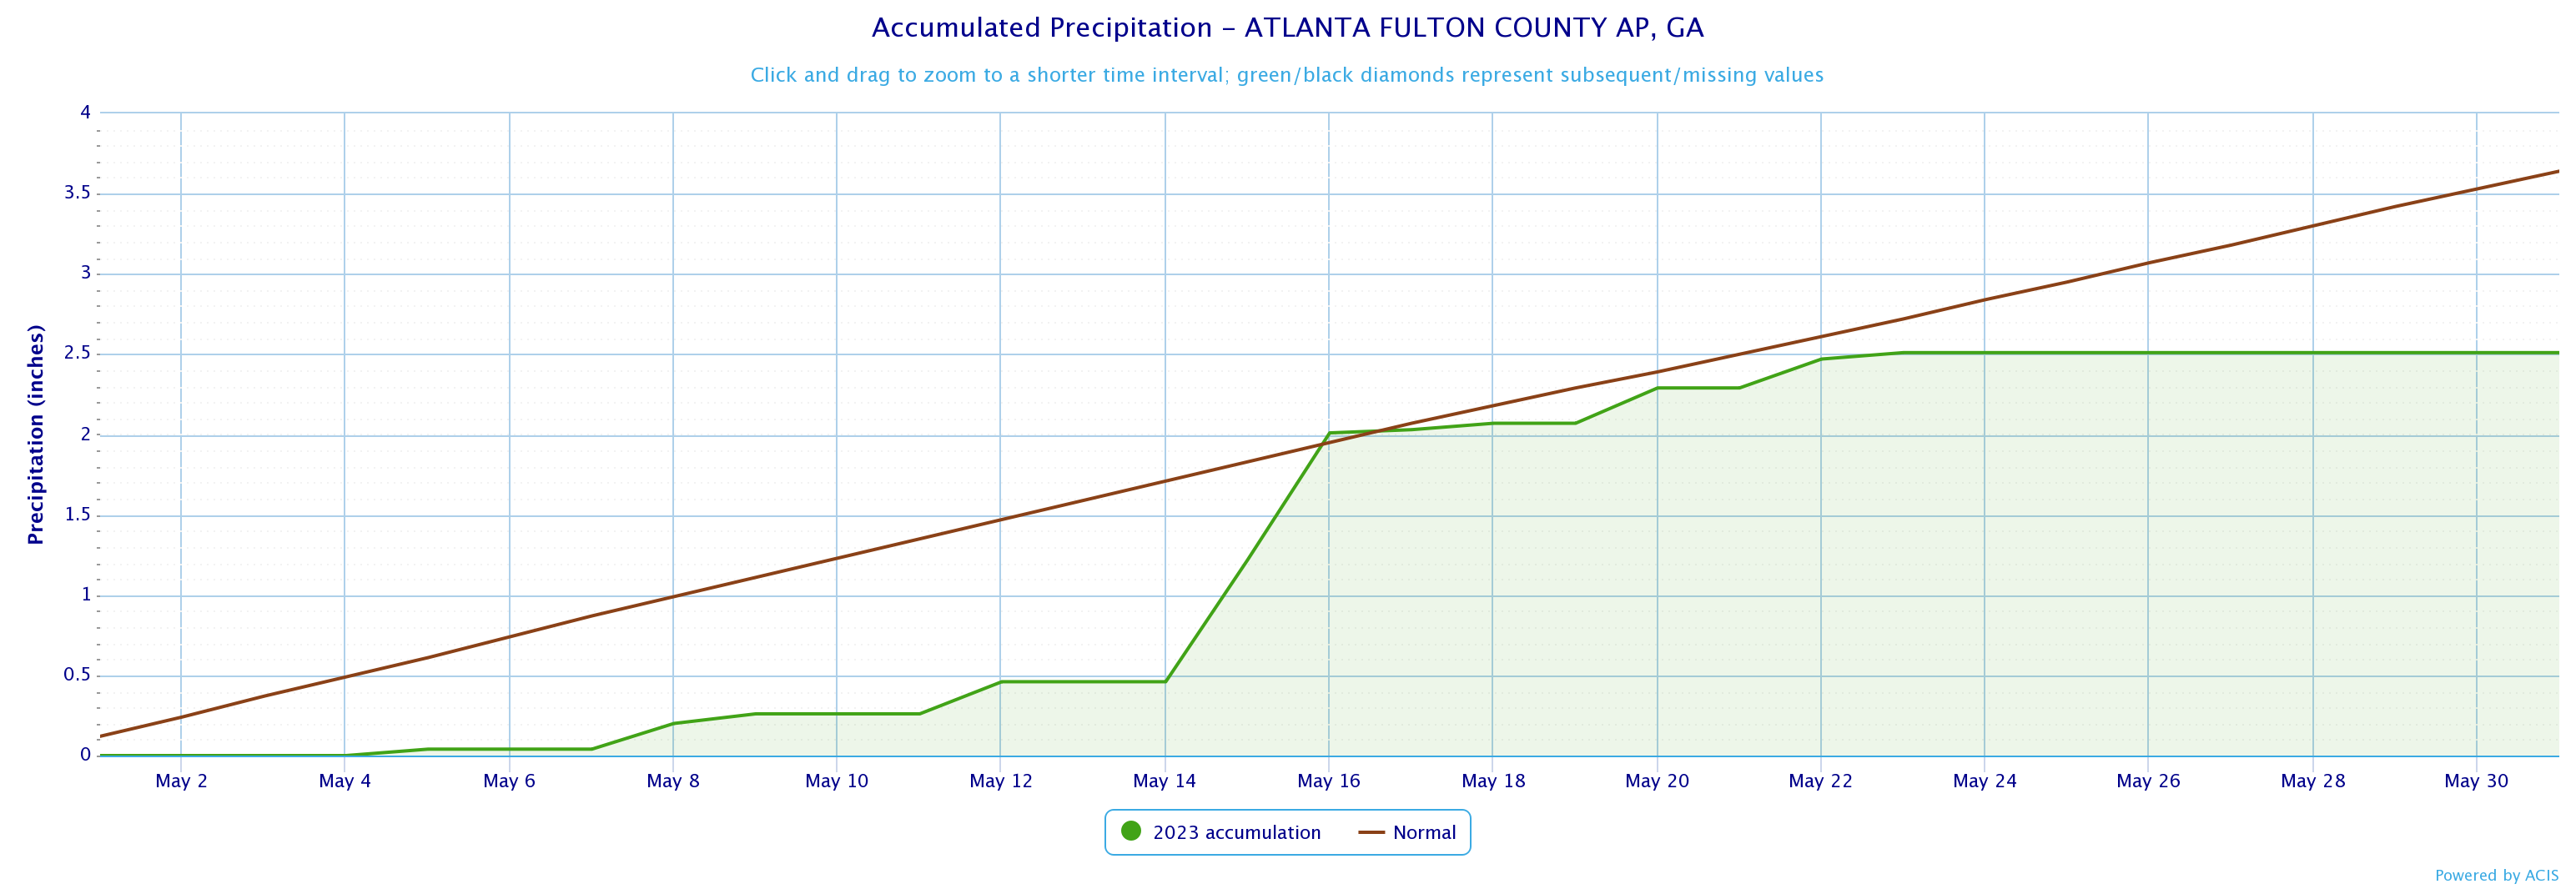
Fulton County Arpt
2.51
3.64
-1.13
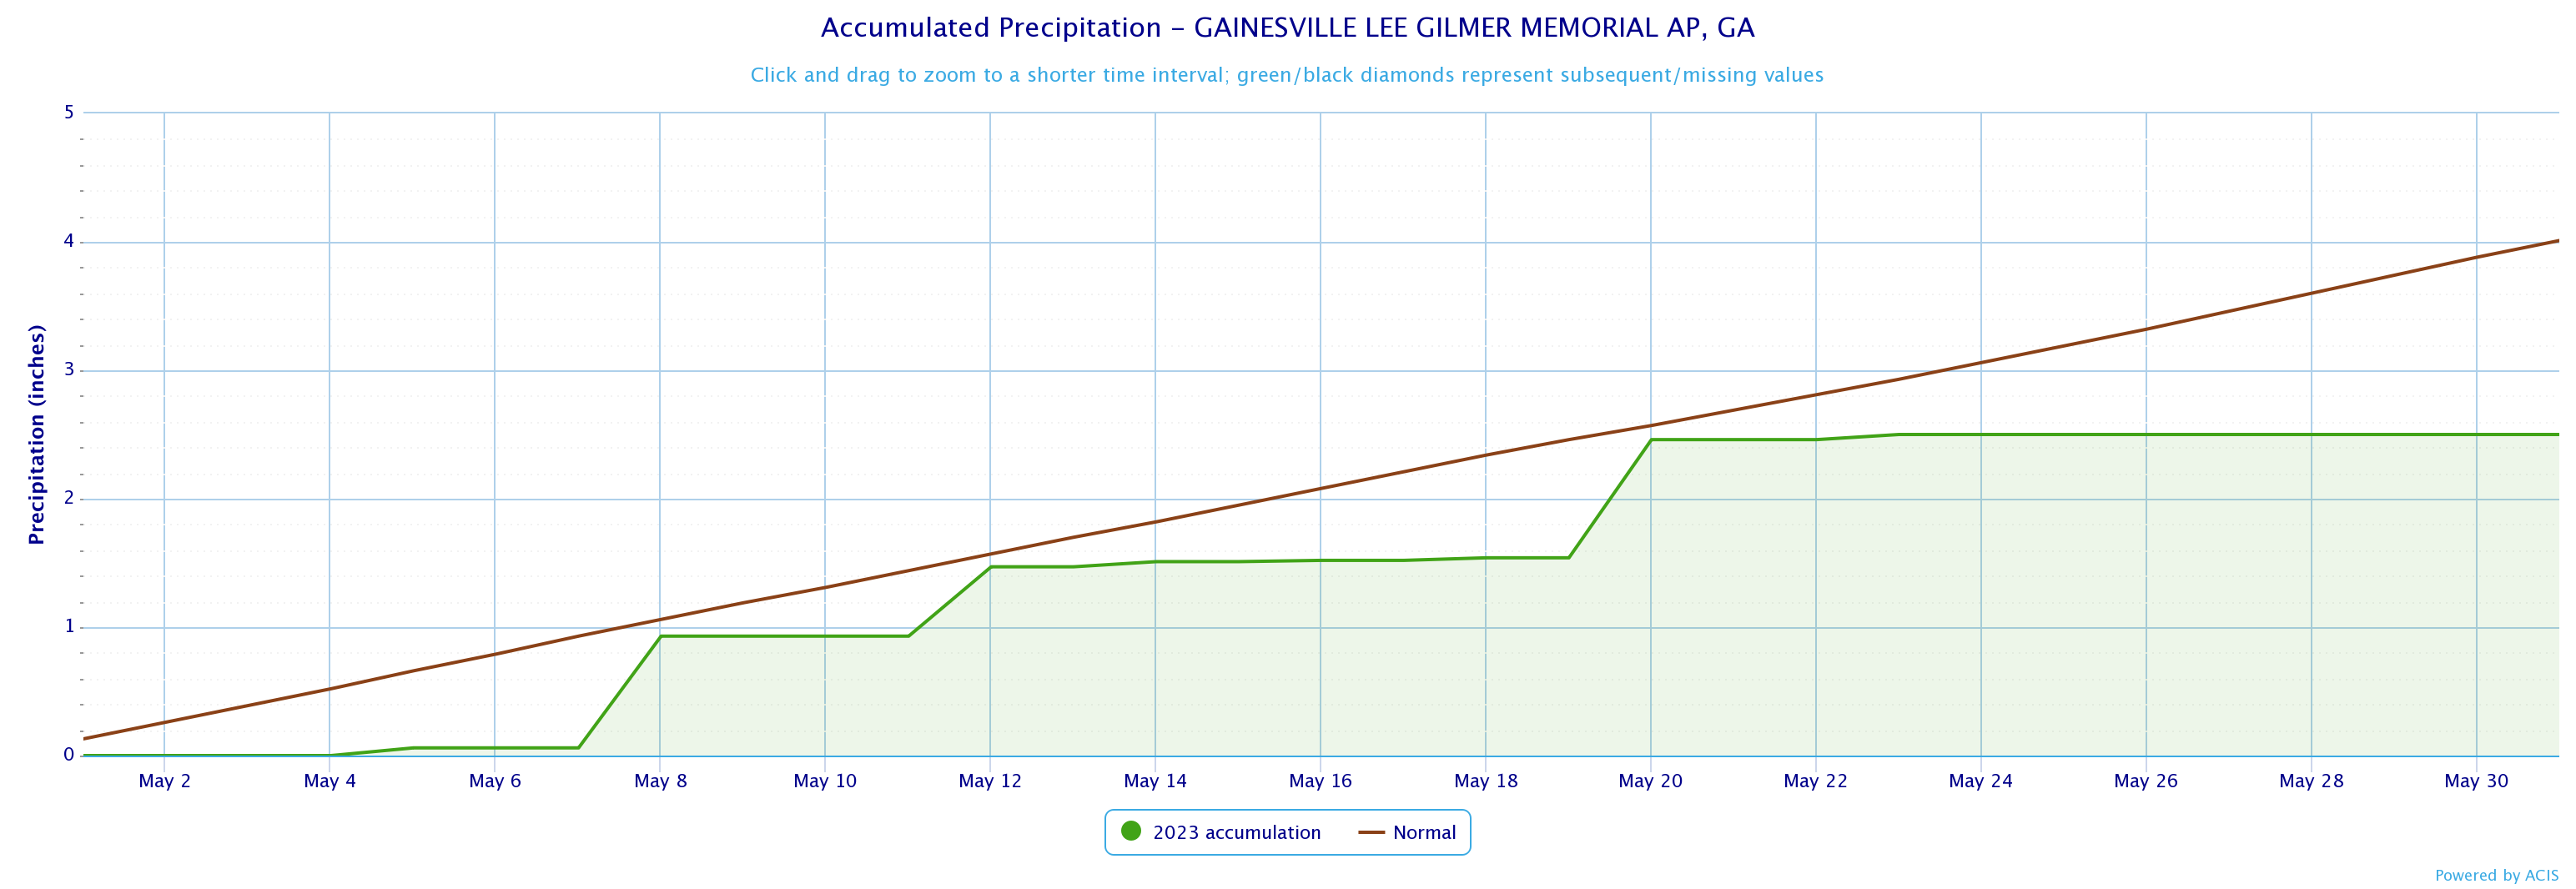
Gainesville
2.50
4.01
-1.51
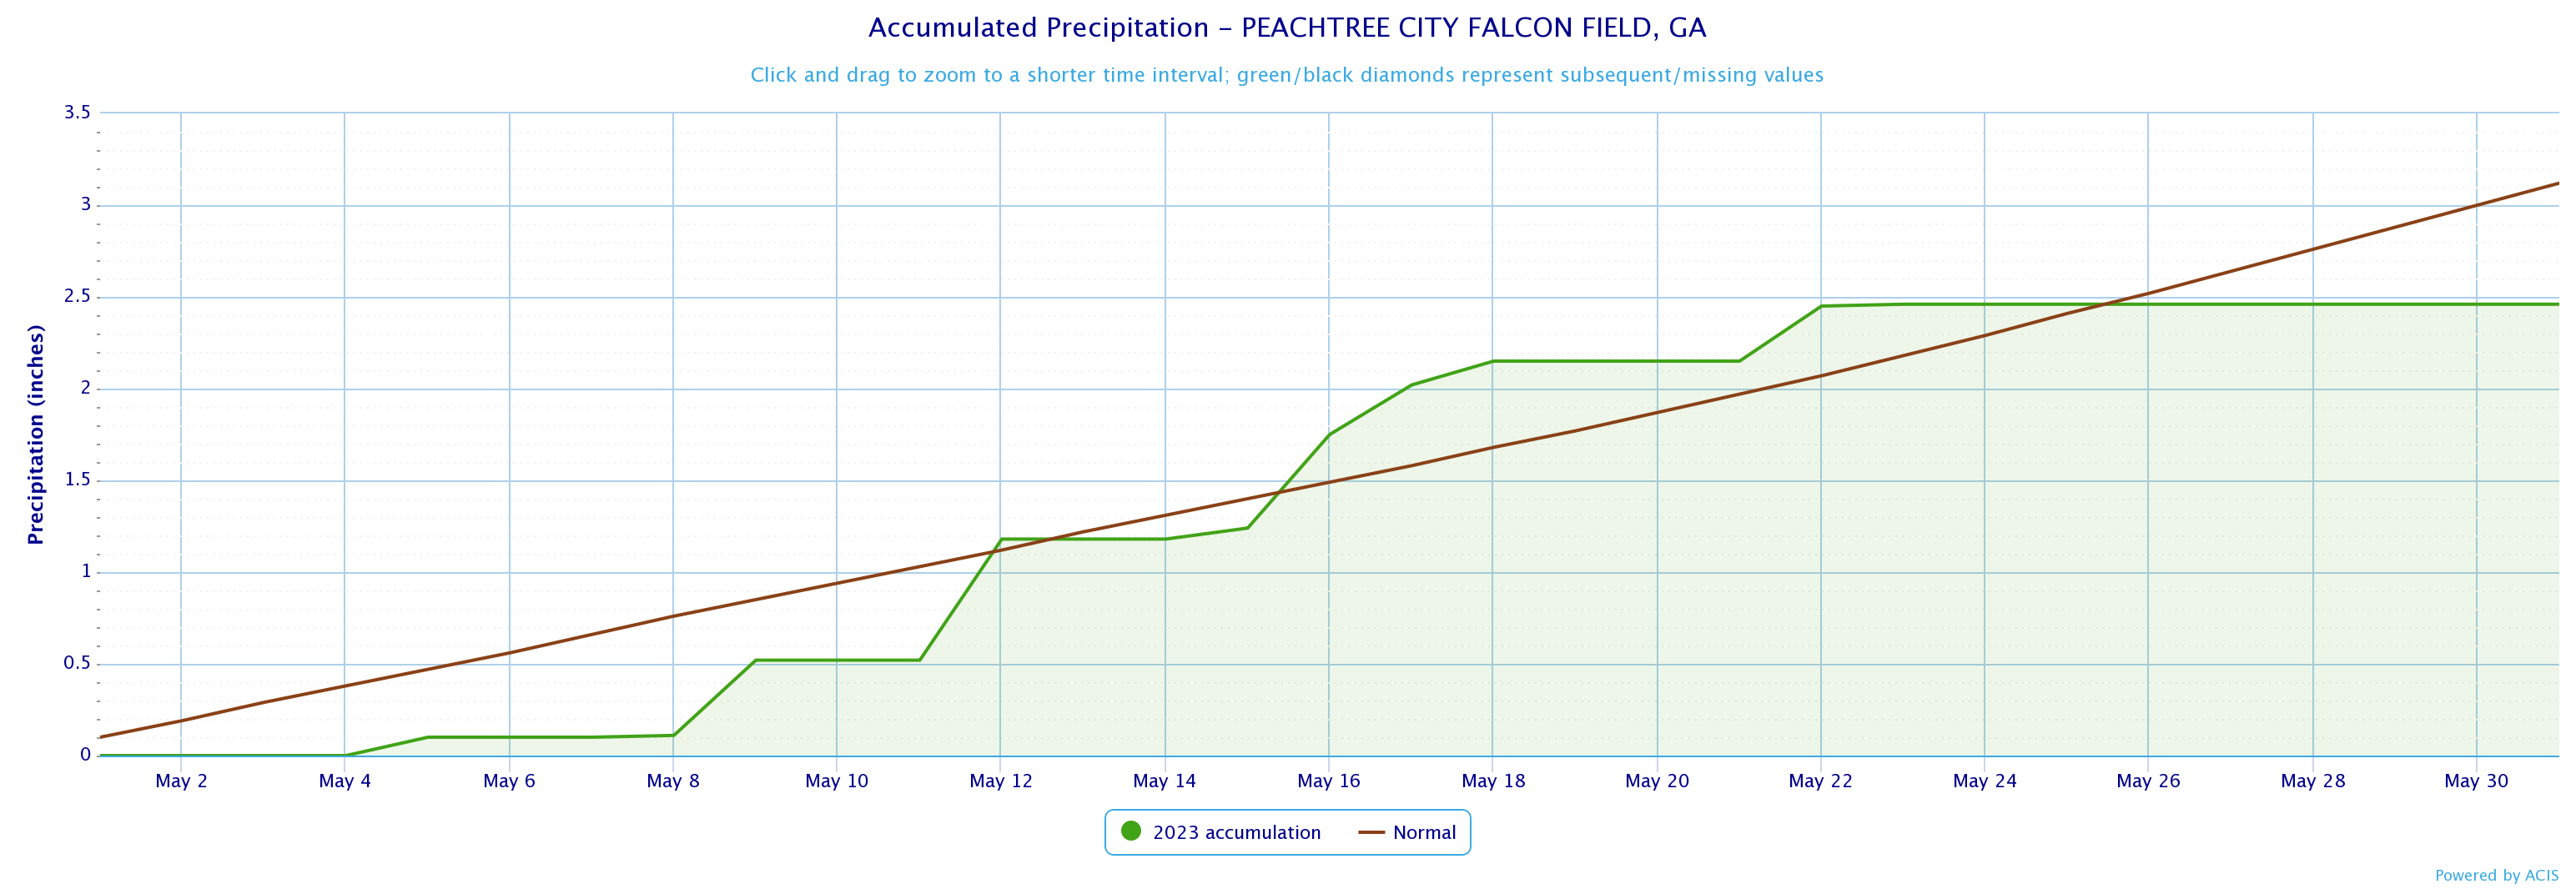
Peachtree City
3.01
3.12
-0.11
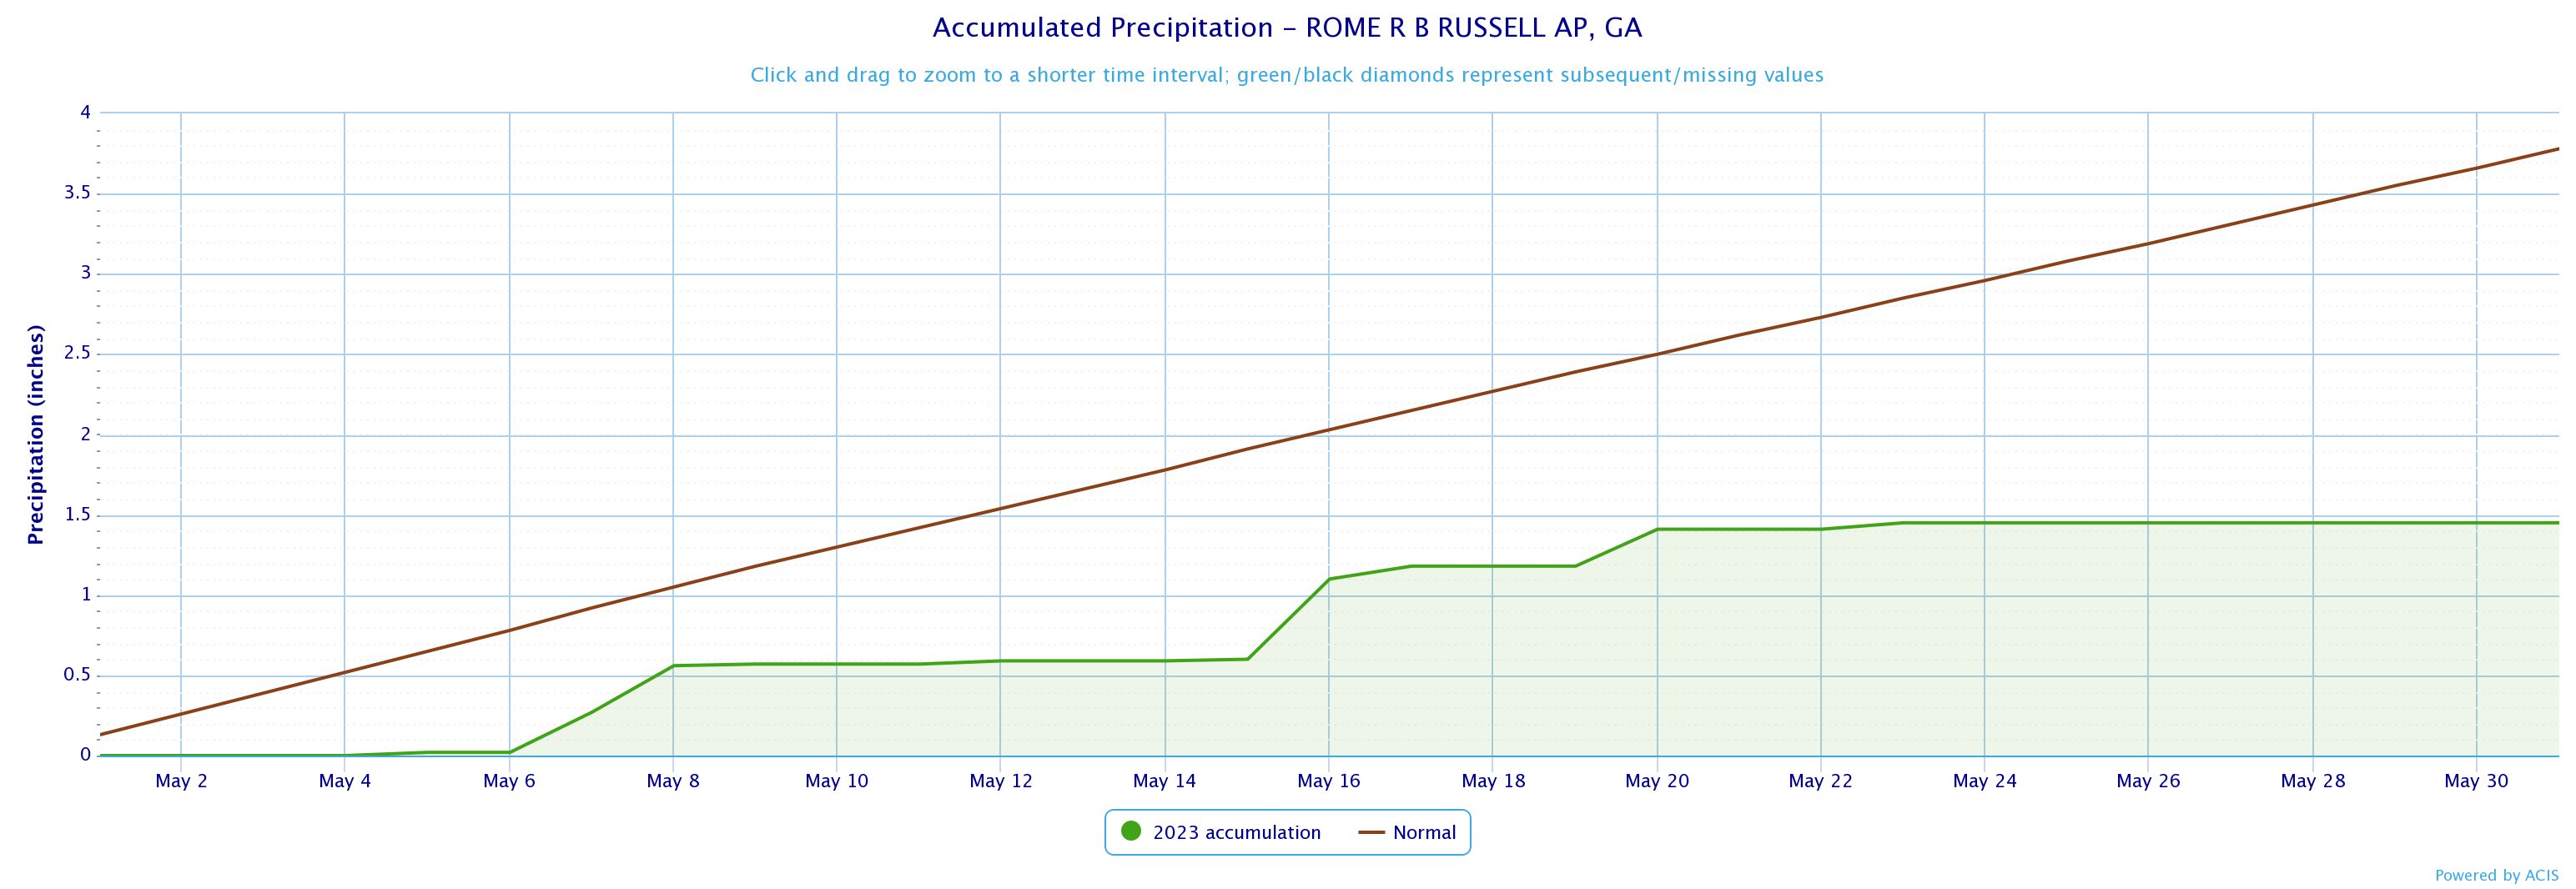
Rome
1.45
3.78
-2.33
May 2023 Precipitation Climate Statistics
Athens
1.05
5/1
Atlanta
1.15
5/1
Columbus
1.94
5/16
Macon
1.69
5/17
Dekalb Peachtree Arpt
0.99
5/1
Fulton Co Arpt
1.51
5/15
Gainesville
0.92
5/20
Peachtree City
2.46
5/1
Rome
0.58
5/16
Click the links below to explore the temperature and precipitation data across north and central Georgia for the month of May 2023.
Temperature Maps
Precipitation Maps
Temperature Graphs
Precipitation Graphs
Temperature and precipitation records at our 4 main climate sites are located below.
May 2023 Climate Records
Date
Type
Location
Records set over a 24 hour period
5/18
Daily Rainfall
Macon
1.43 Inches of rain fell over 24 hours. This breaks the old record of 1.38 inches set in 1908.
No significant weather outbreaks occurred across north and central Georgia this past May.
The June climate outlook is below.
June Outlook