| Precious Month | Next Month |
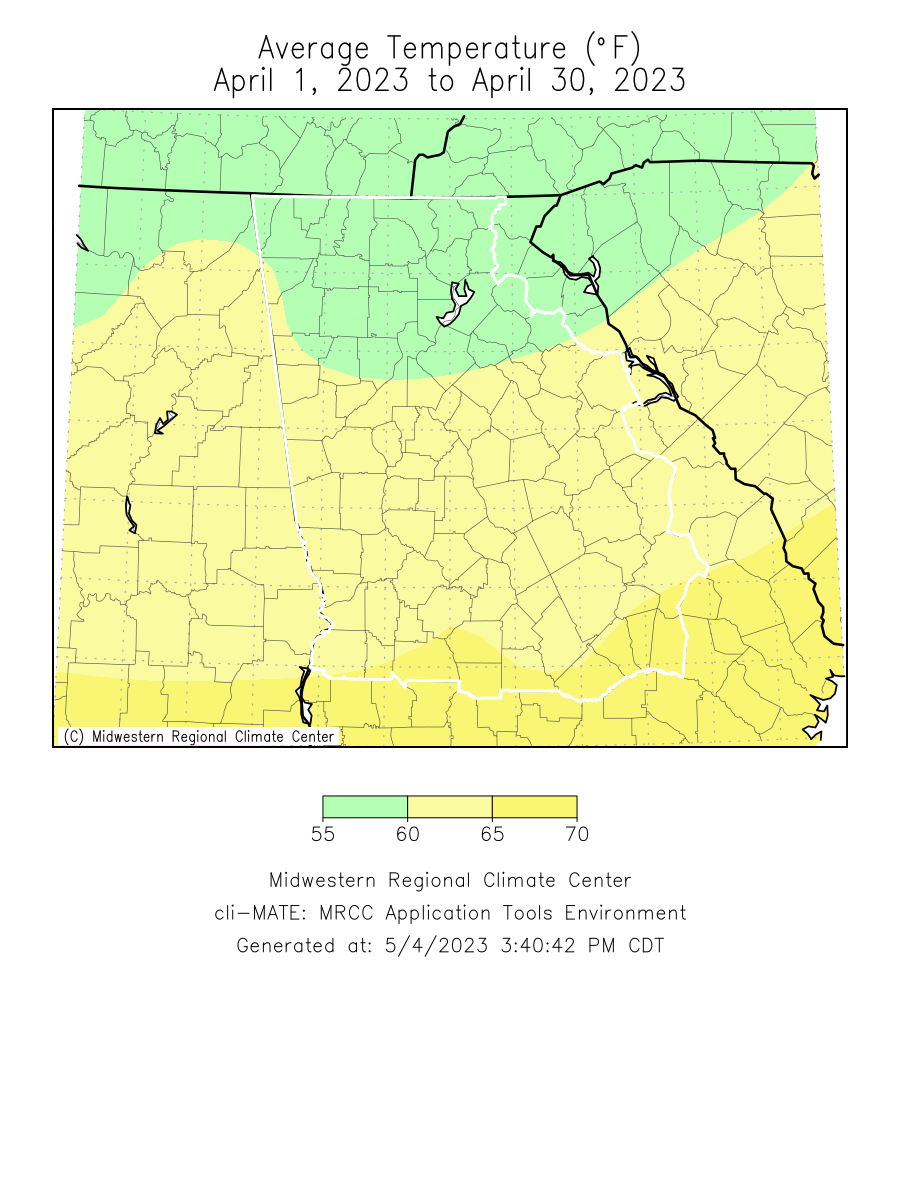
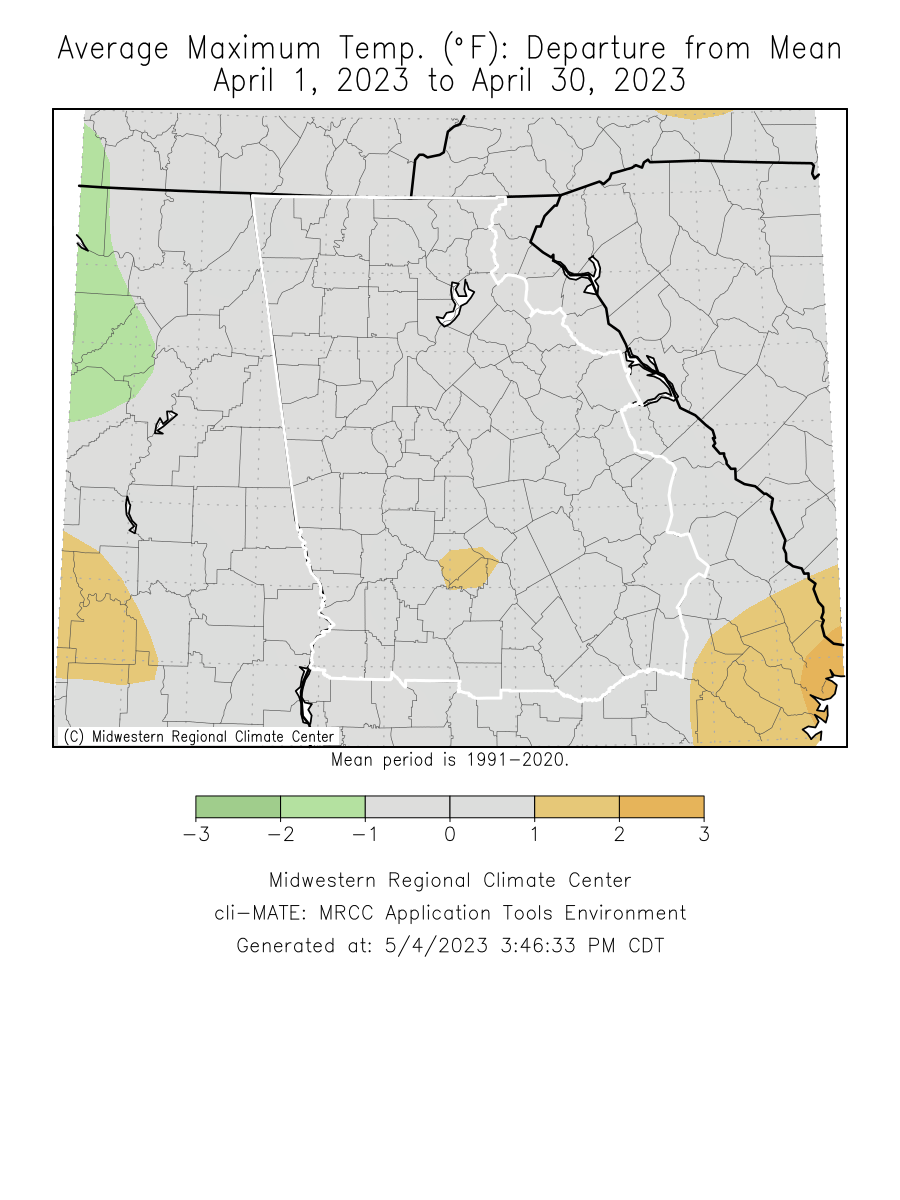
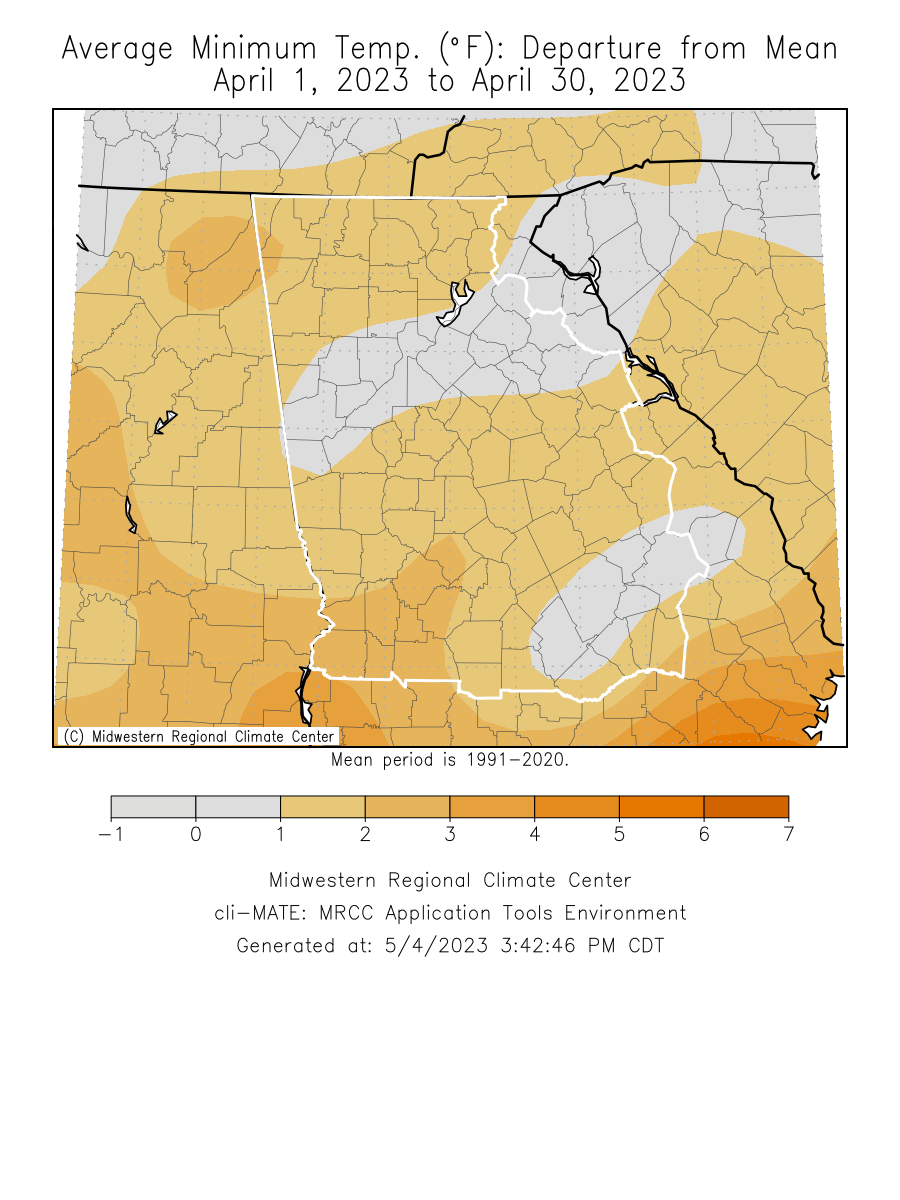
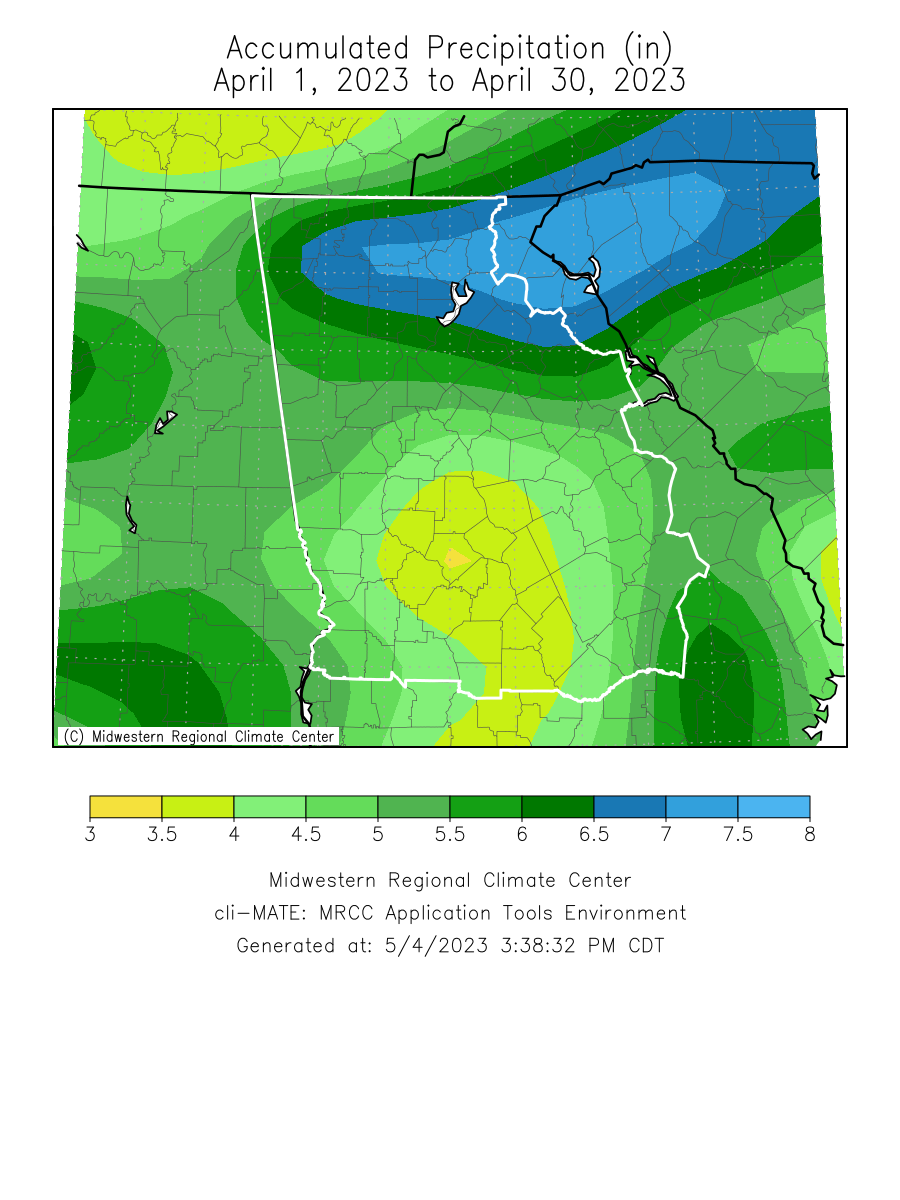
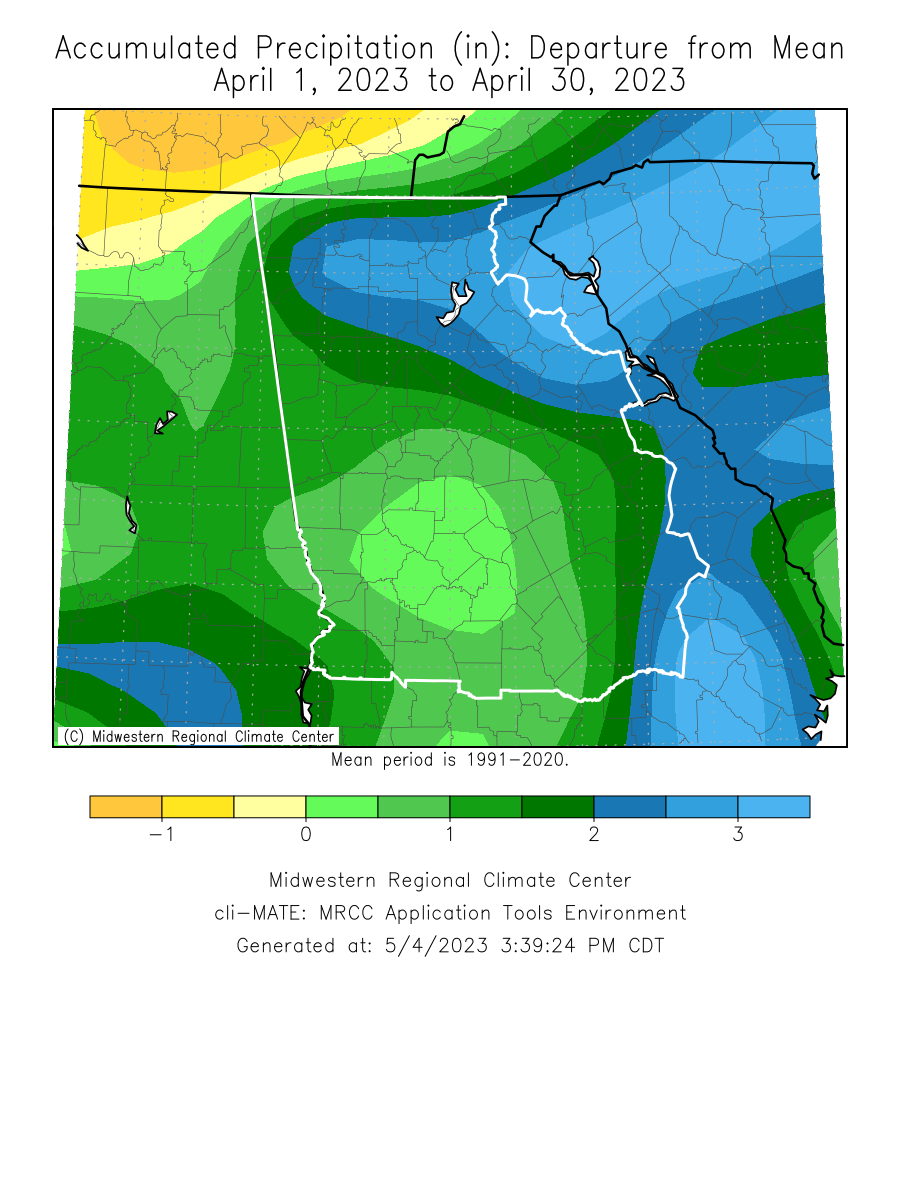
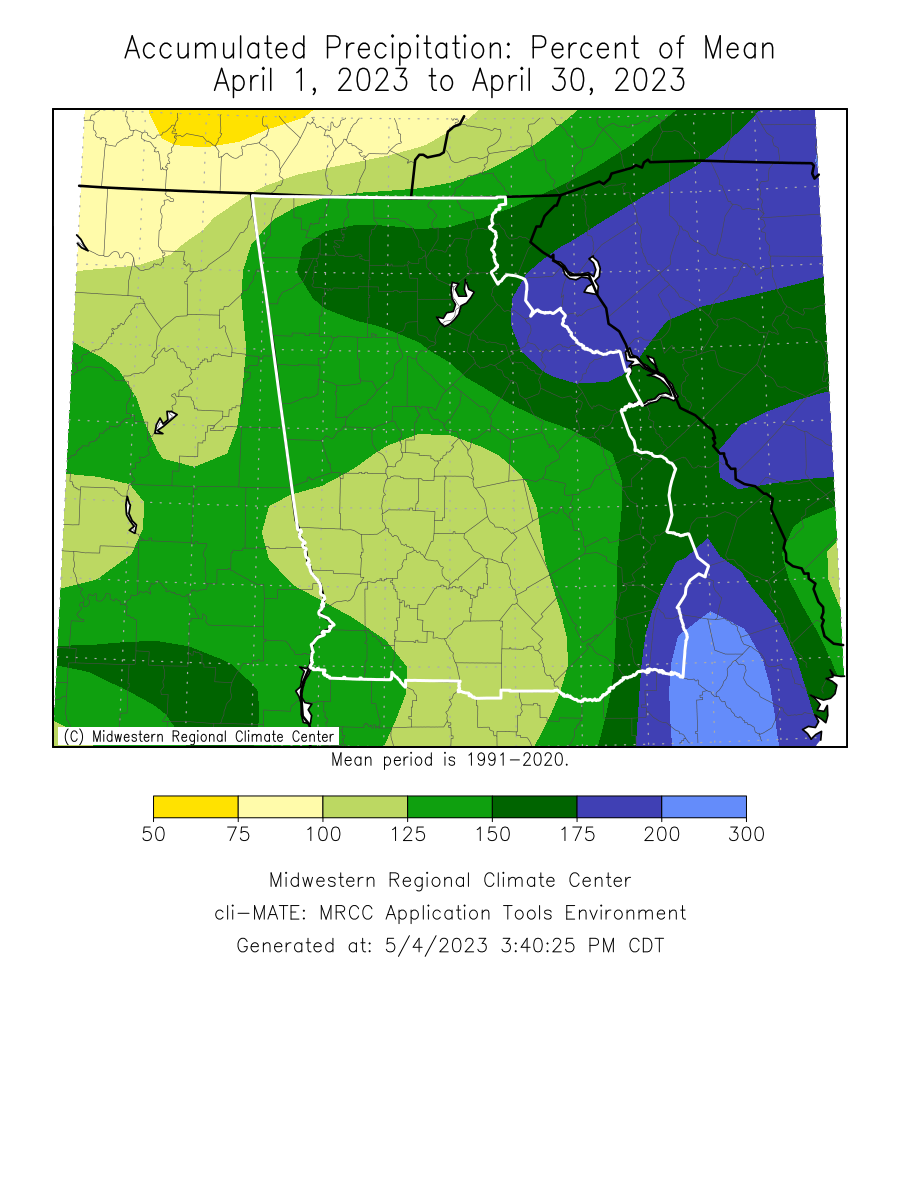
Temperatures through the month of April were within 1 degree of normal. Precipitation through the month of April was around one and a half an inch above normal.
Climate Site Maximum Temperature Max T Date Climate Site Total Precipitation DFN (Departure Climate Site Maximum Daily Precip (in inches) 4/5 Data prepared by NWS Peachtree City/Atlanta April 1st Northern Georgia Thunderstorms A line of strong storms that were the remnants of a severe weather outbreak across the Midwest moved into northern Georgia during the morning hours of April 1st. These storms primarily posed a wind threat, causing multiple downed trees along with heavy rain and frequent lightning. Despite the hour, CAPE values ahead of the storm ranged from 1000-1500 J/Kg with dew points in the 60s. This complex of storms contained a number of mesocyclones as it moved south with at least one confirmed tornado just north of Atlanta near Woodstock. Based on the Climate Prediction Center's outlook for May, North Georgia has a 33% to 40% chance for below normal temperatures while central Georgia has an equal chance for above or below normal temperatures. For precipitation, central Georgia has an 33% to 40% chance for above normal precipitation while southern Georgia has a 40% to 50% chance for above normal precipitation. Data prepared by NWS Peachtree City/Atlanta
Overview
Climate Graphics
Records
Events
May Outlook
Below are the overview stats for April 2023 for our 9 climate sites.
April 2023 Climate Averages
Climate Site
April Temp (°F)
Average Temp
Departure from normal
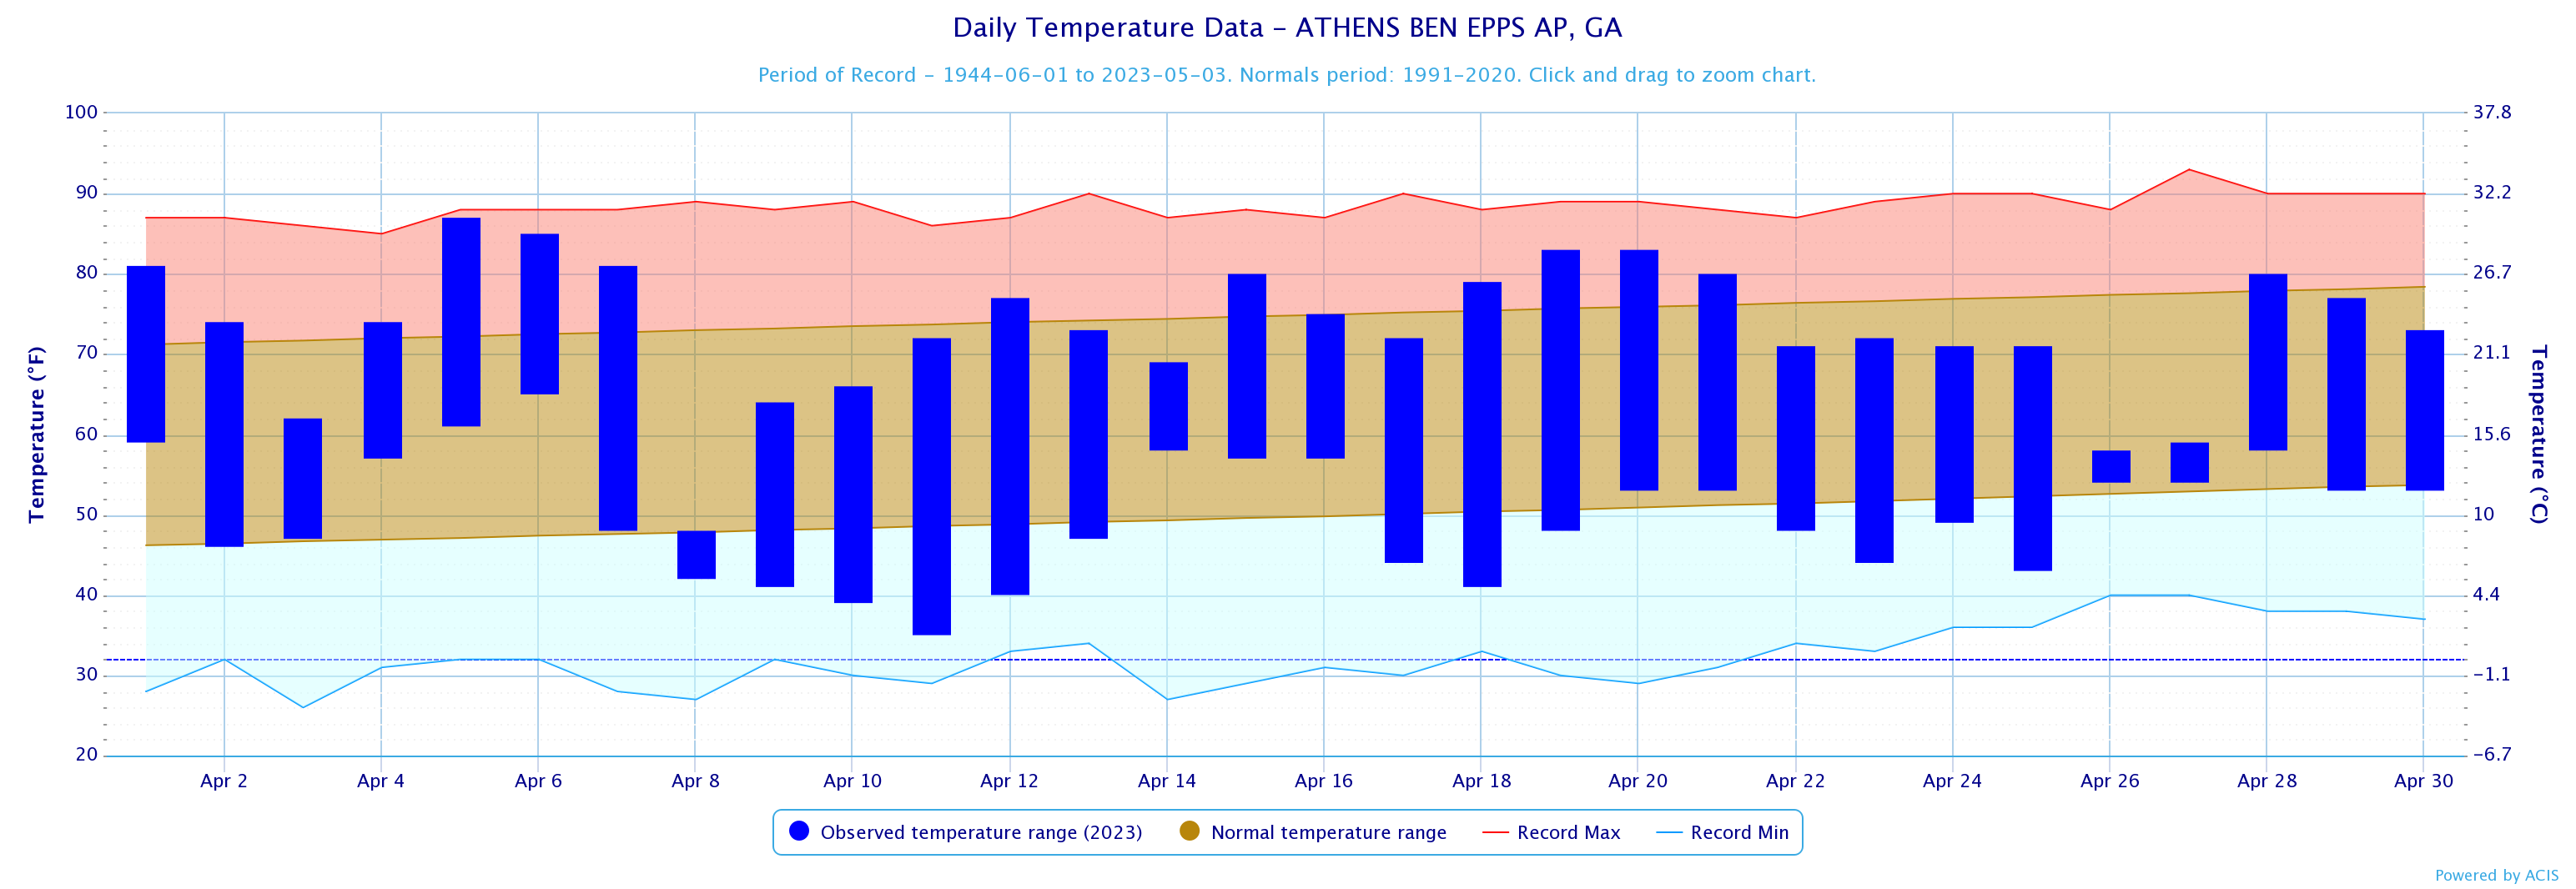
Athens
61.5
62.3
-0.8
Atlanta
63.5
63.2
0.3
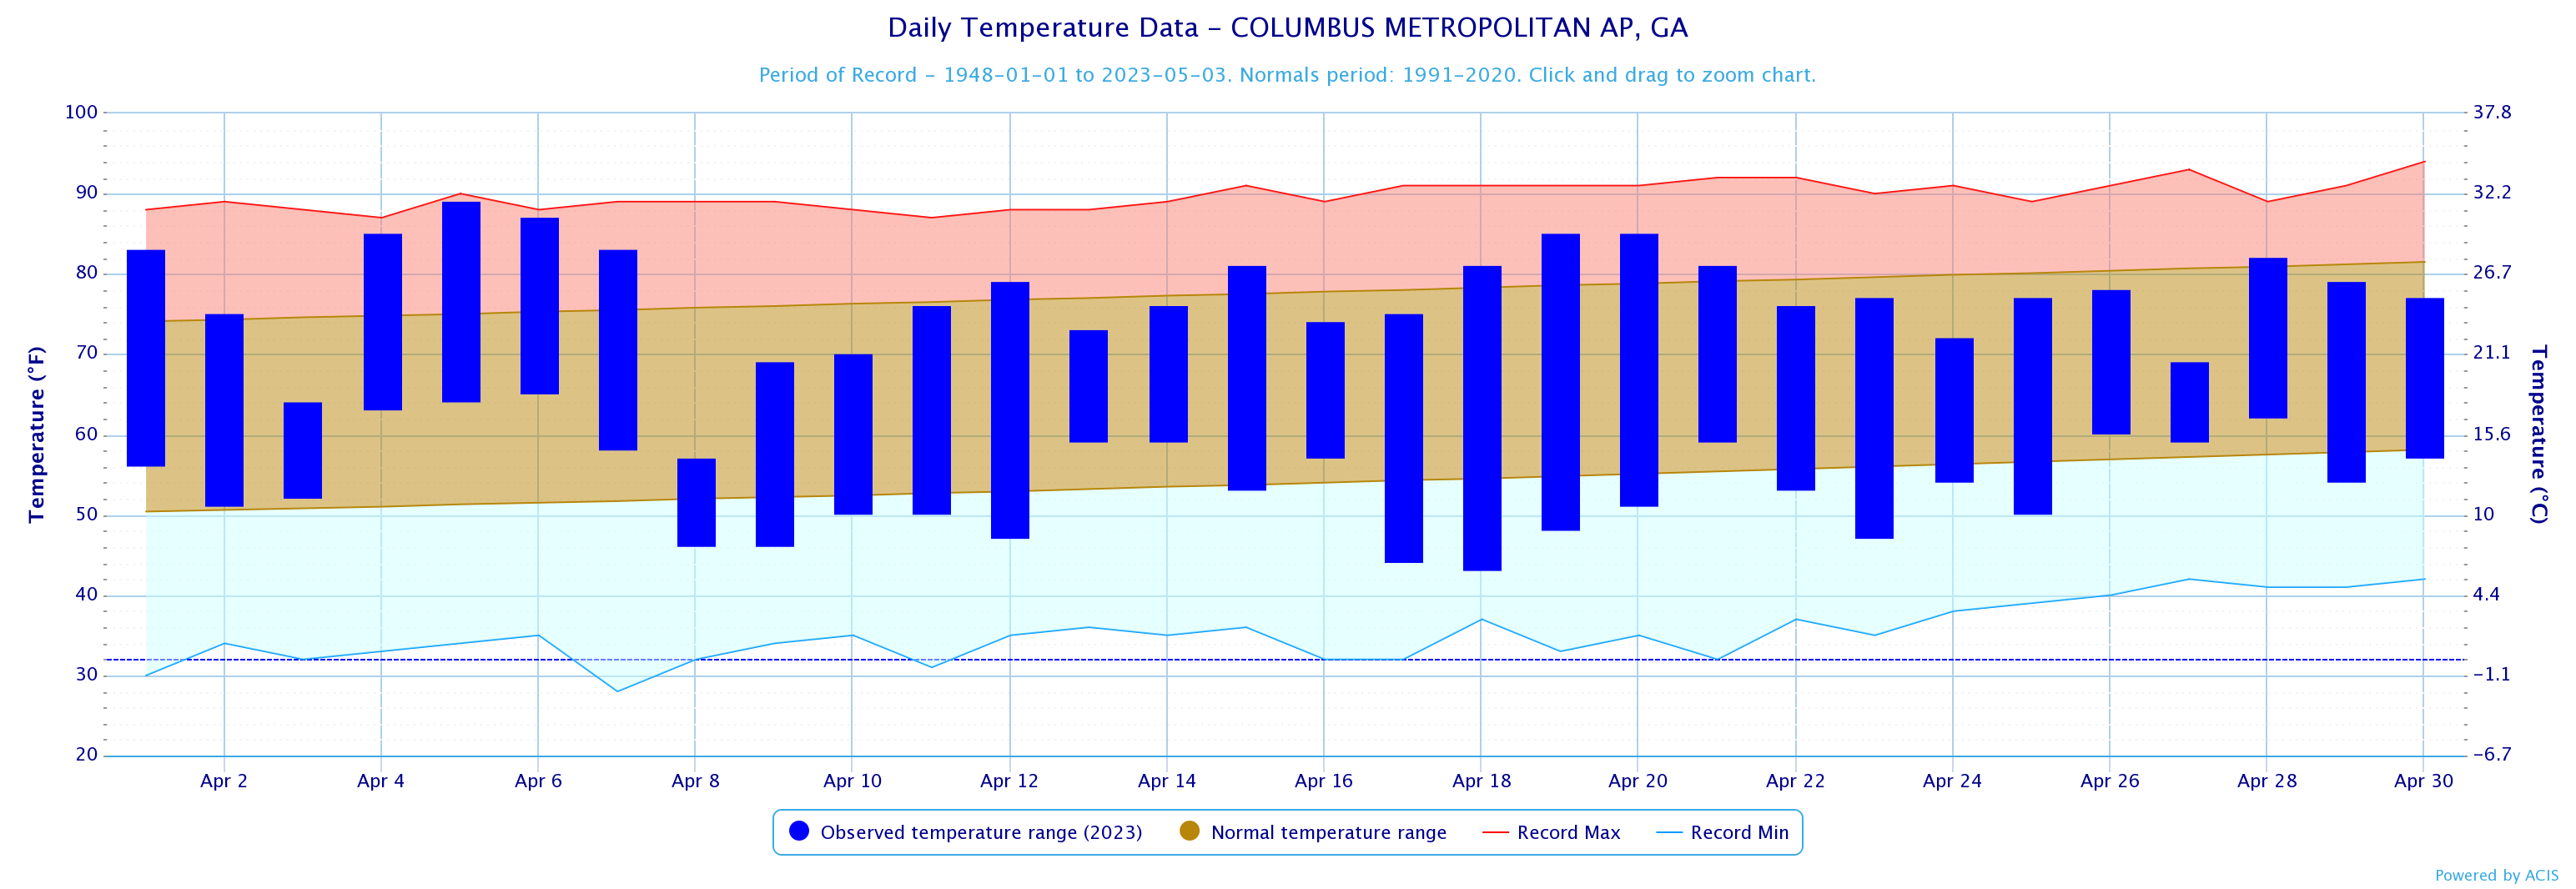
Columbus
65.5
65.8
-0.3
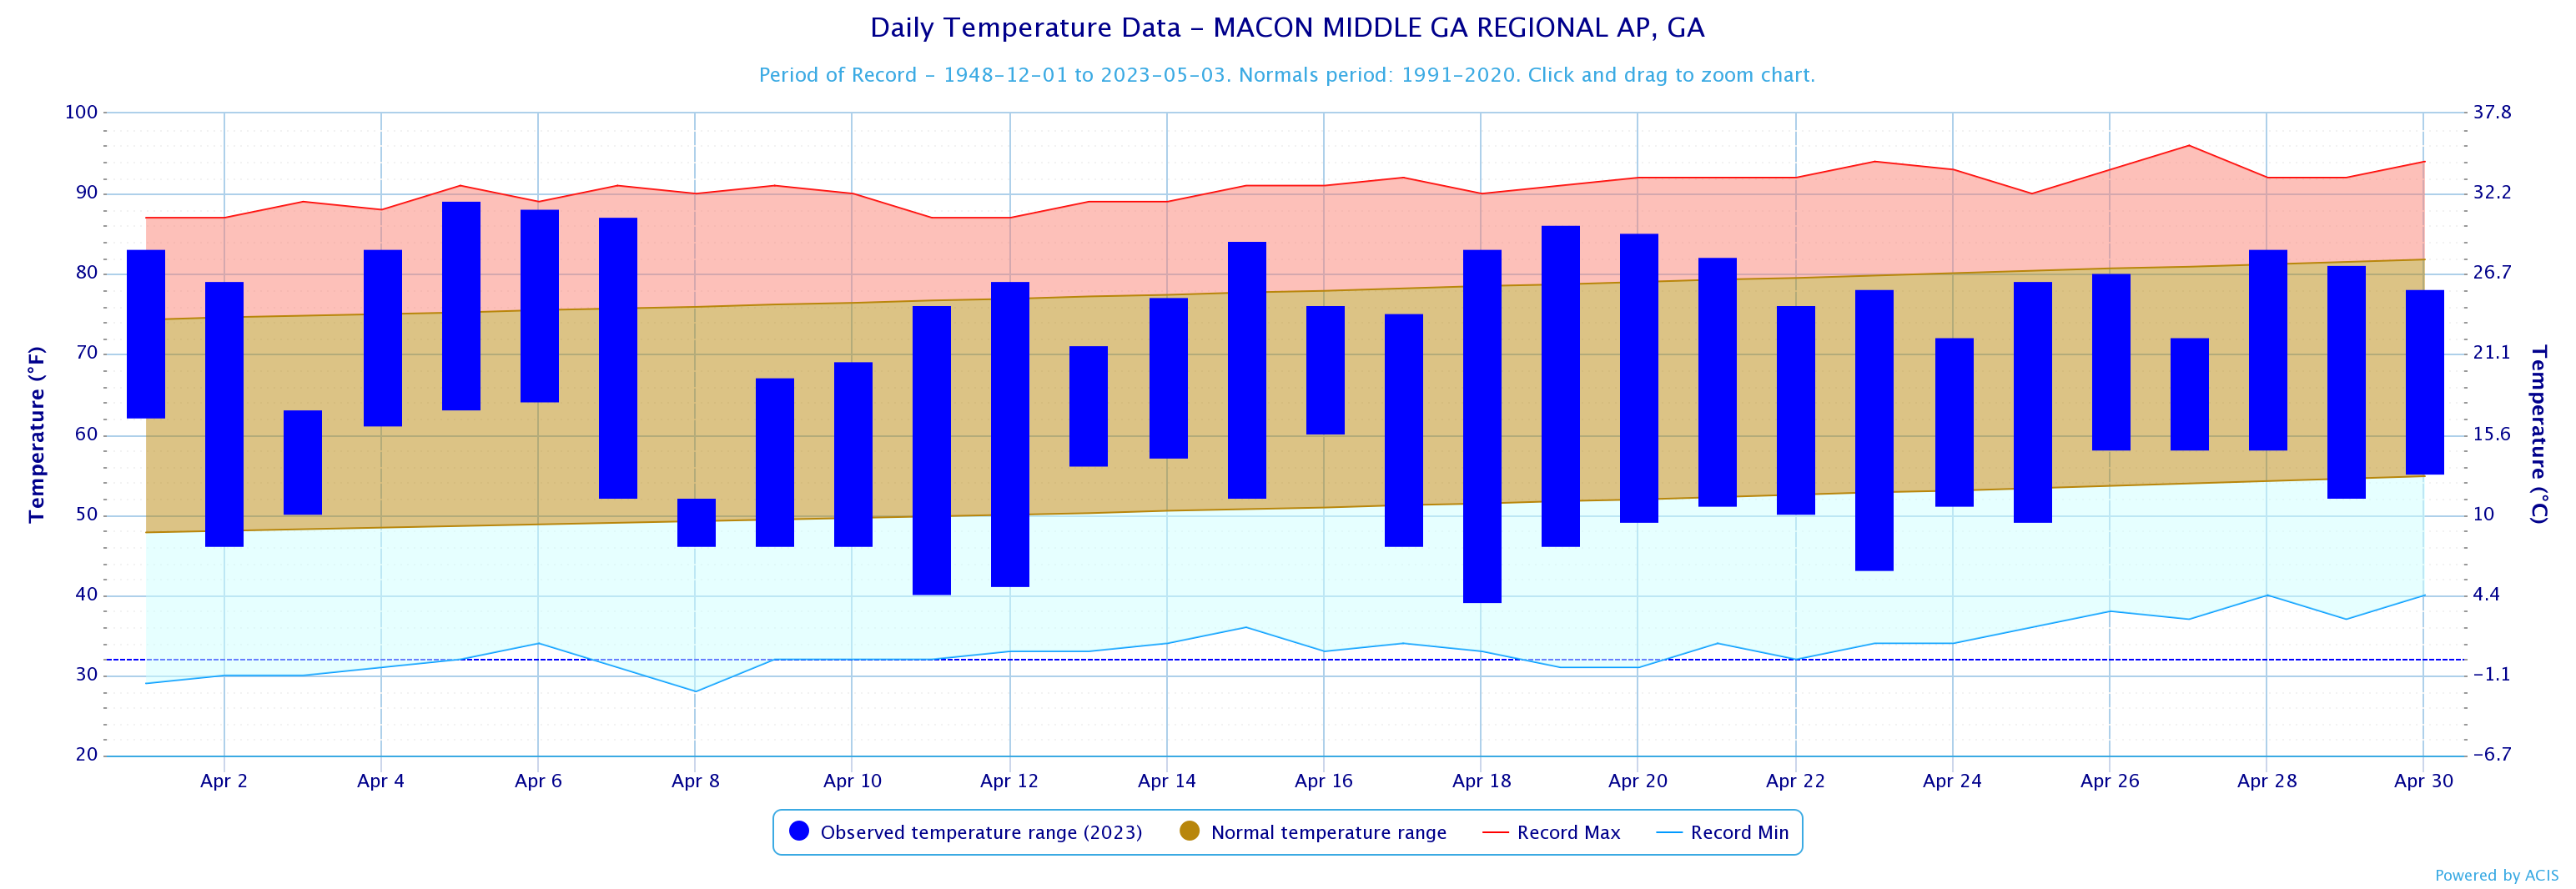
Macon
64.7
64.5
0.2
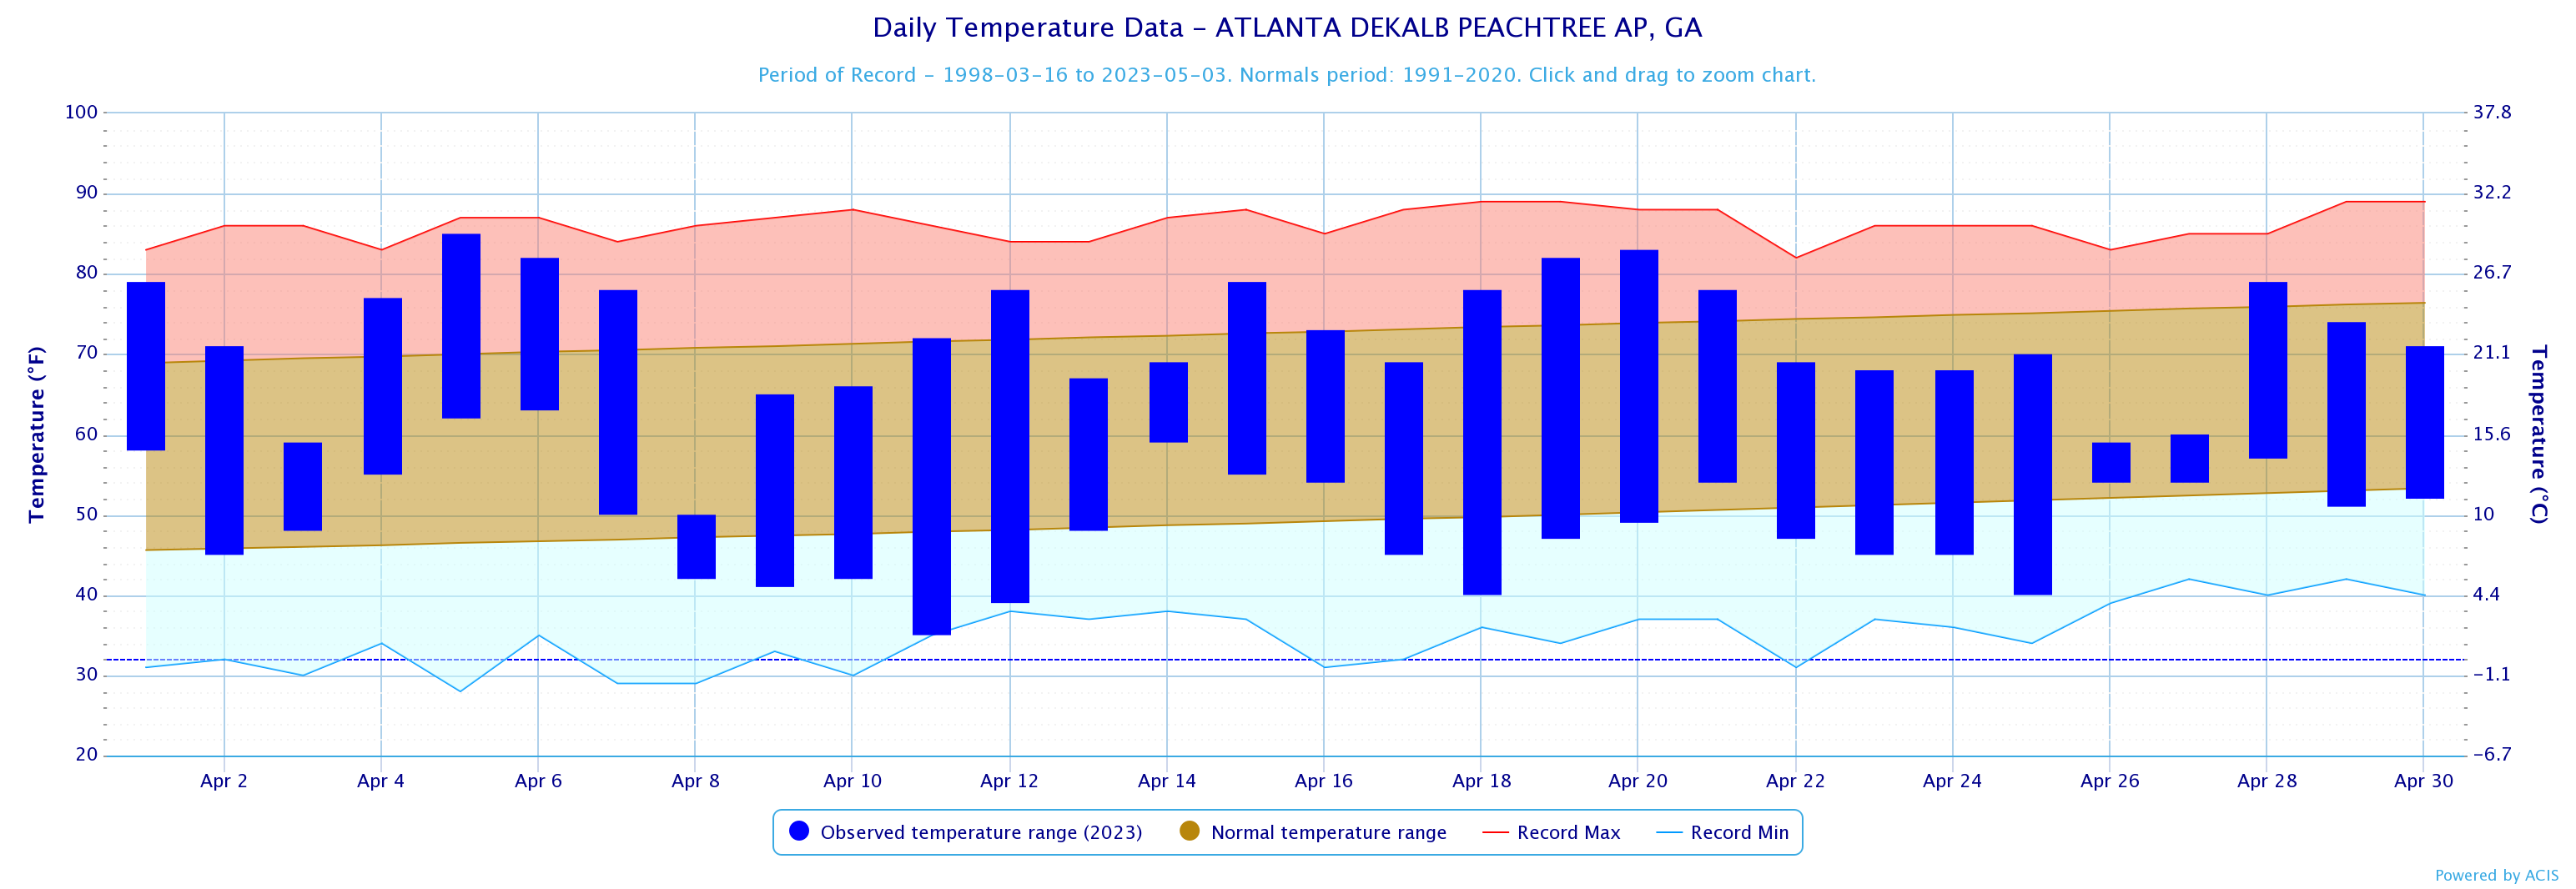
Dekalb Peachtree Arpt
60.6
60.9
-0.3
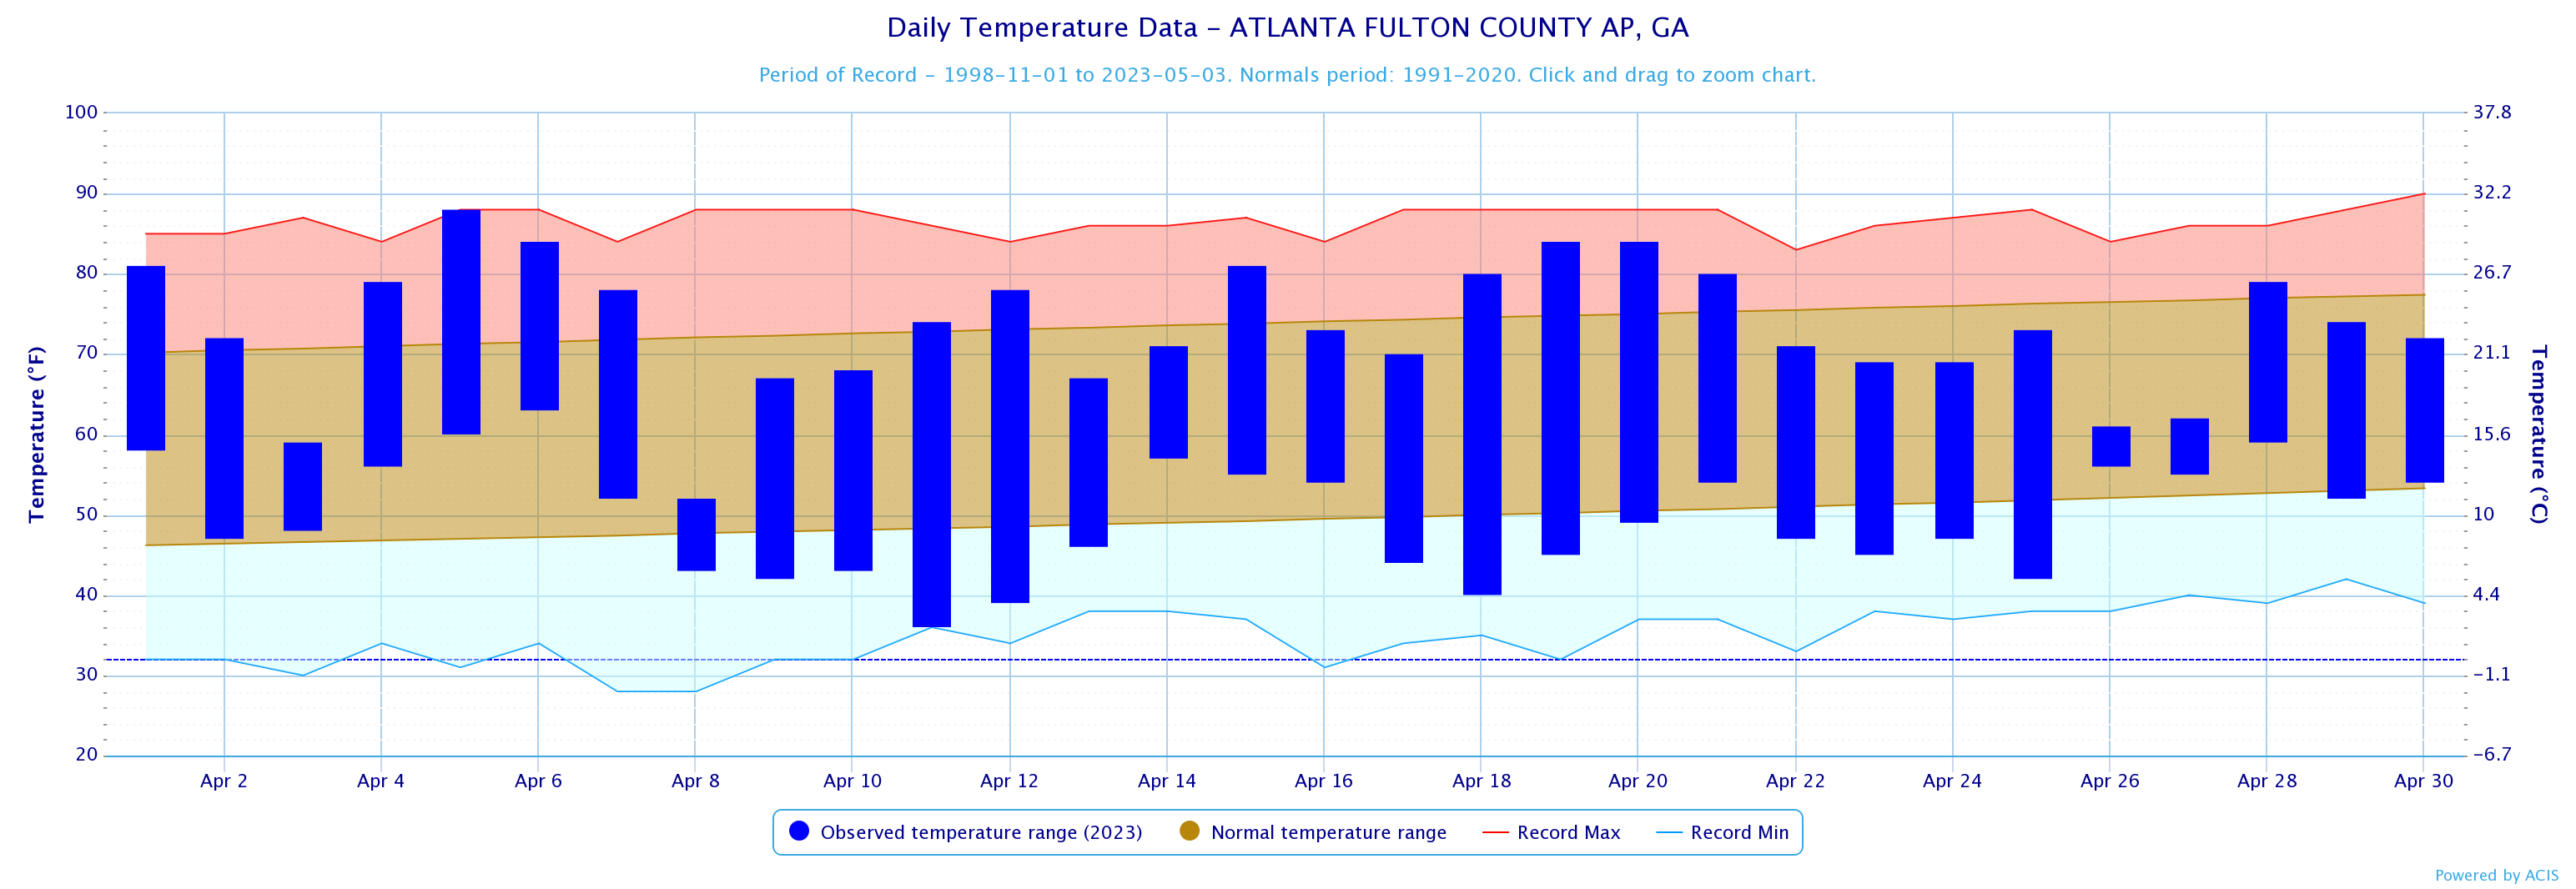
Fulton Co Arpt
61.5
61.7
-0.2
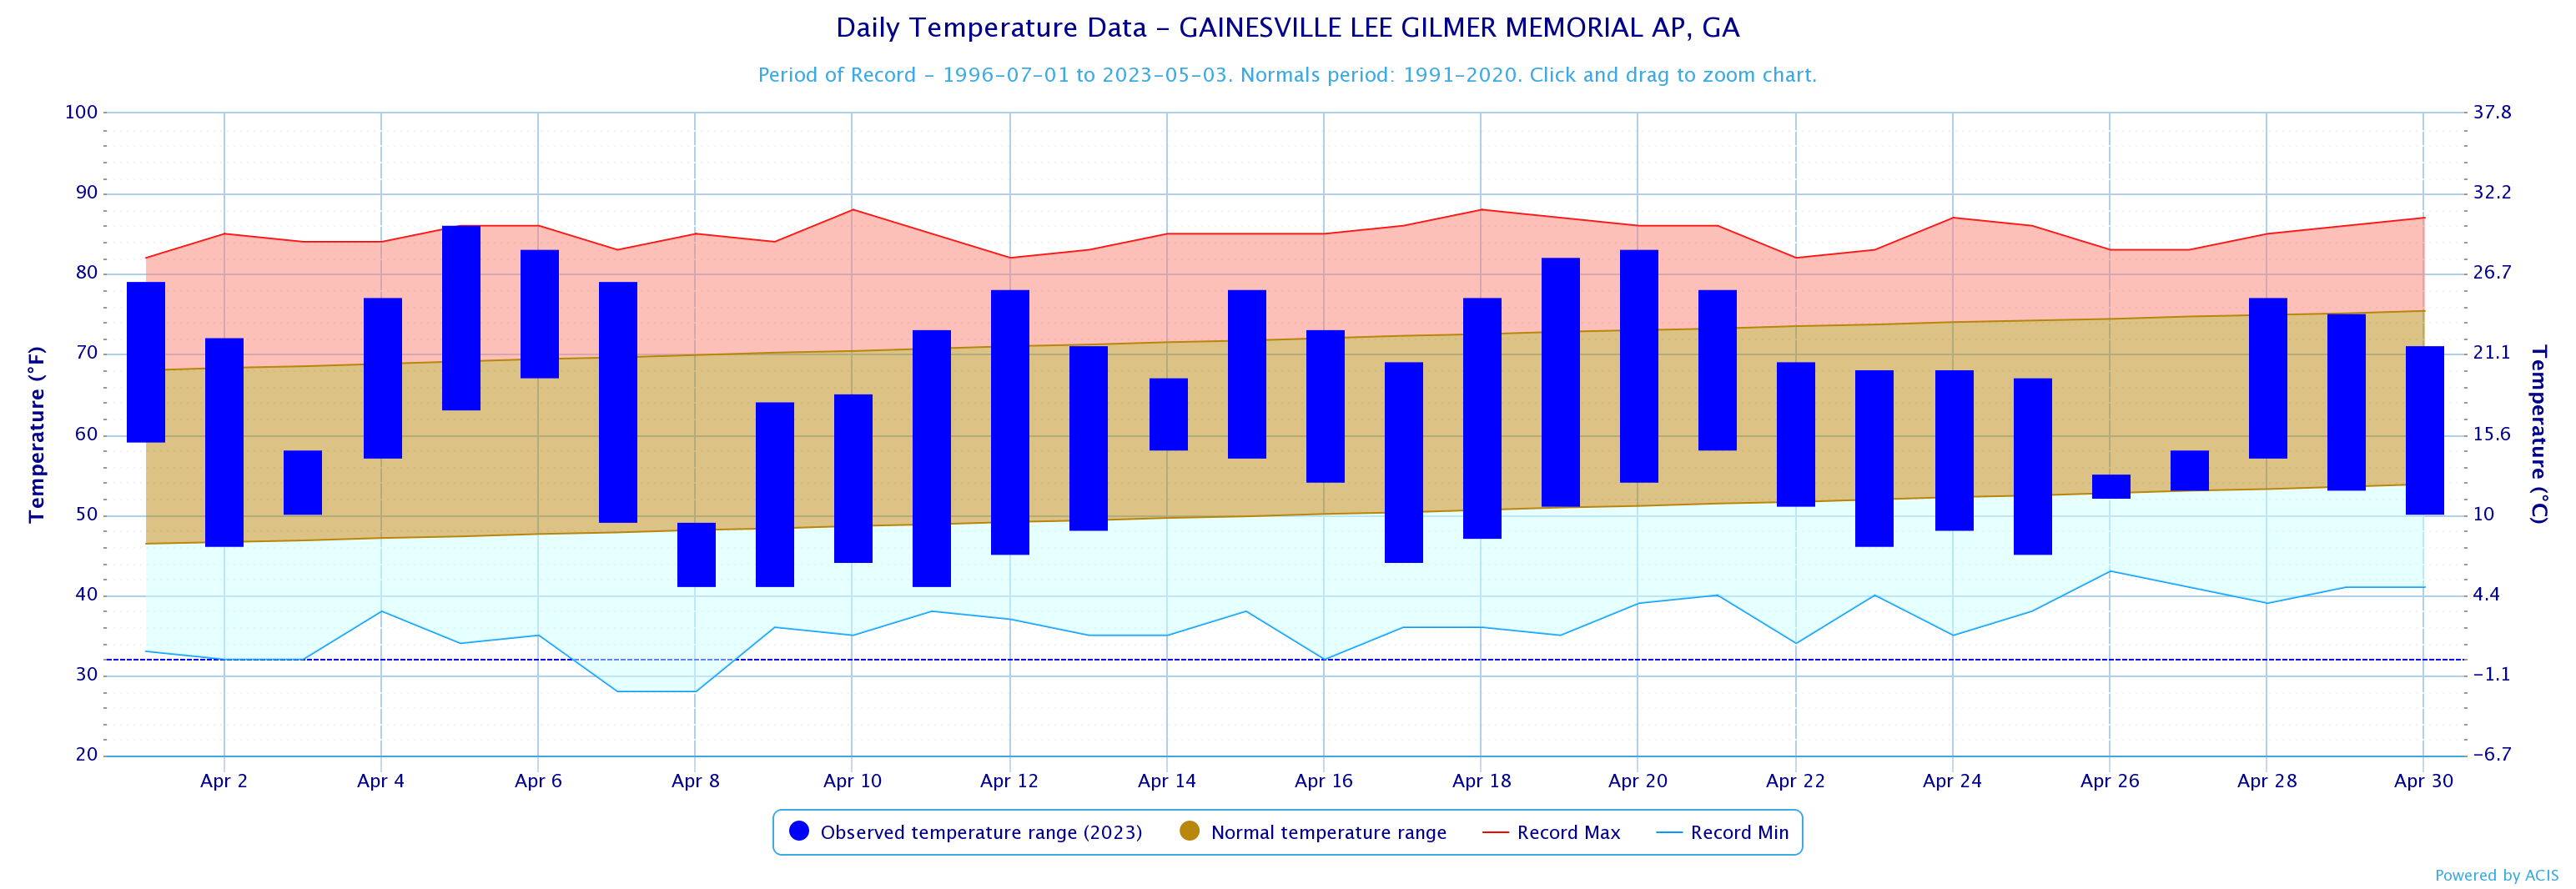
Gainesville
61.3
60.9
0.4
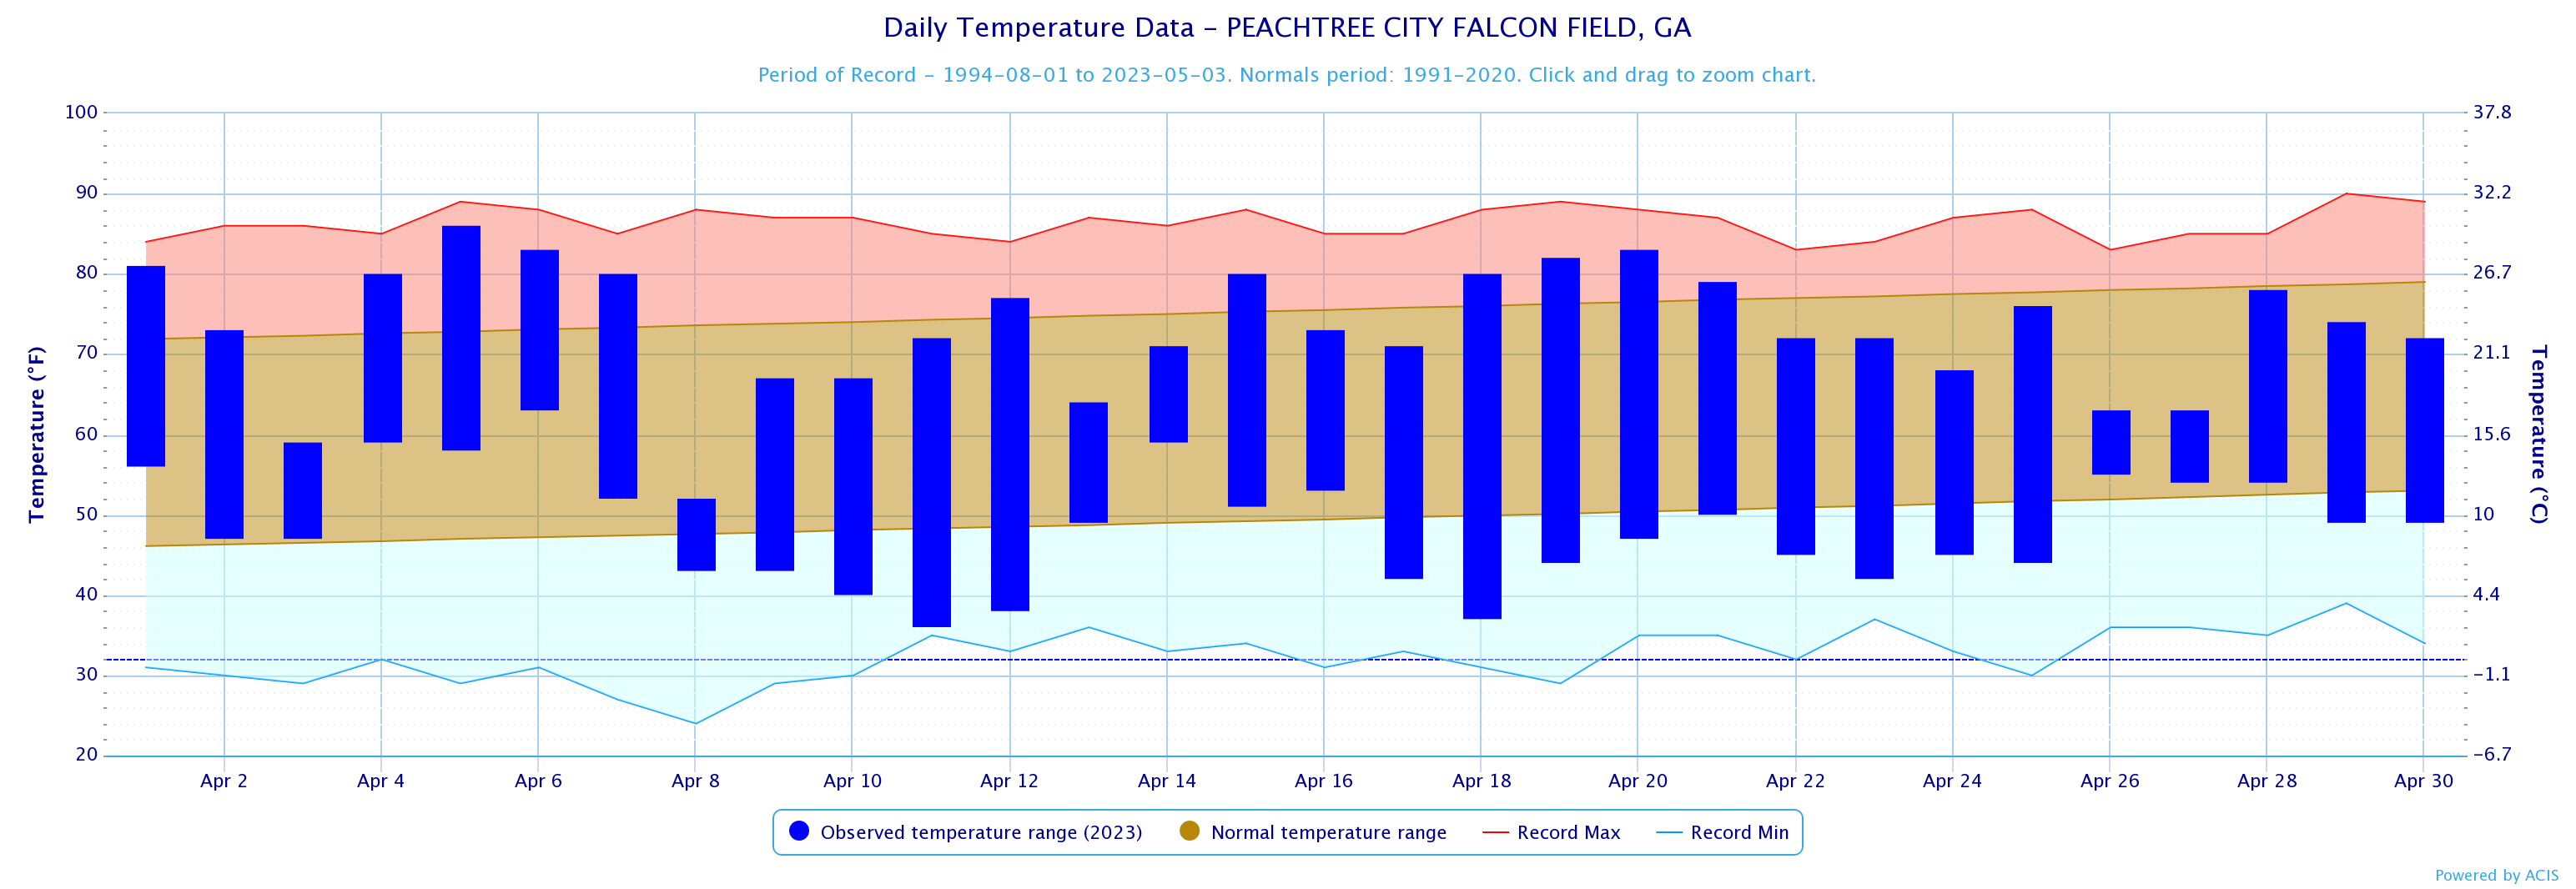
Peachtree City
60.8
62.4
-1.6
Rome
61.4
61.4
0.0
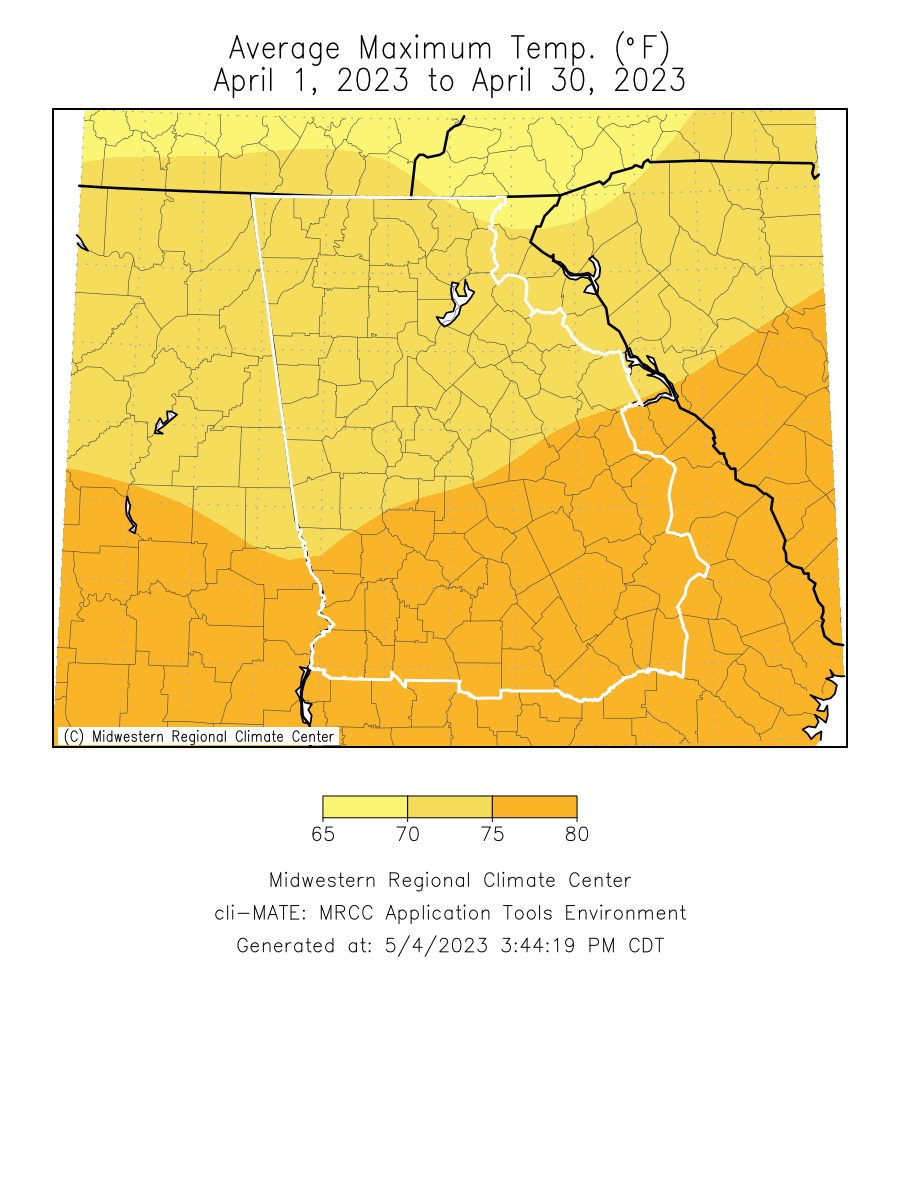
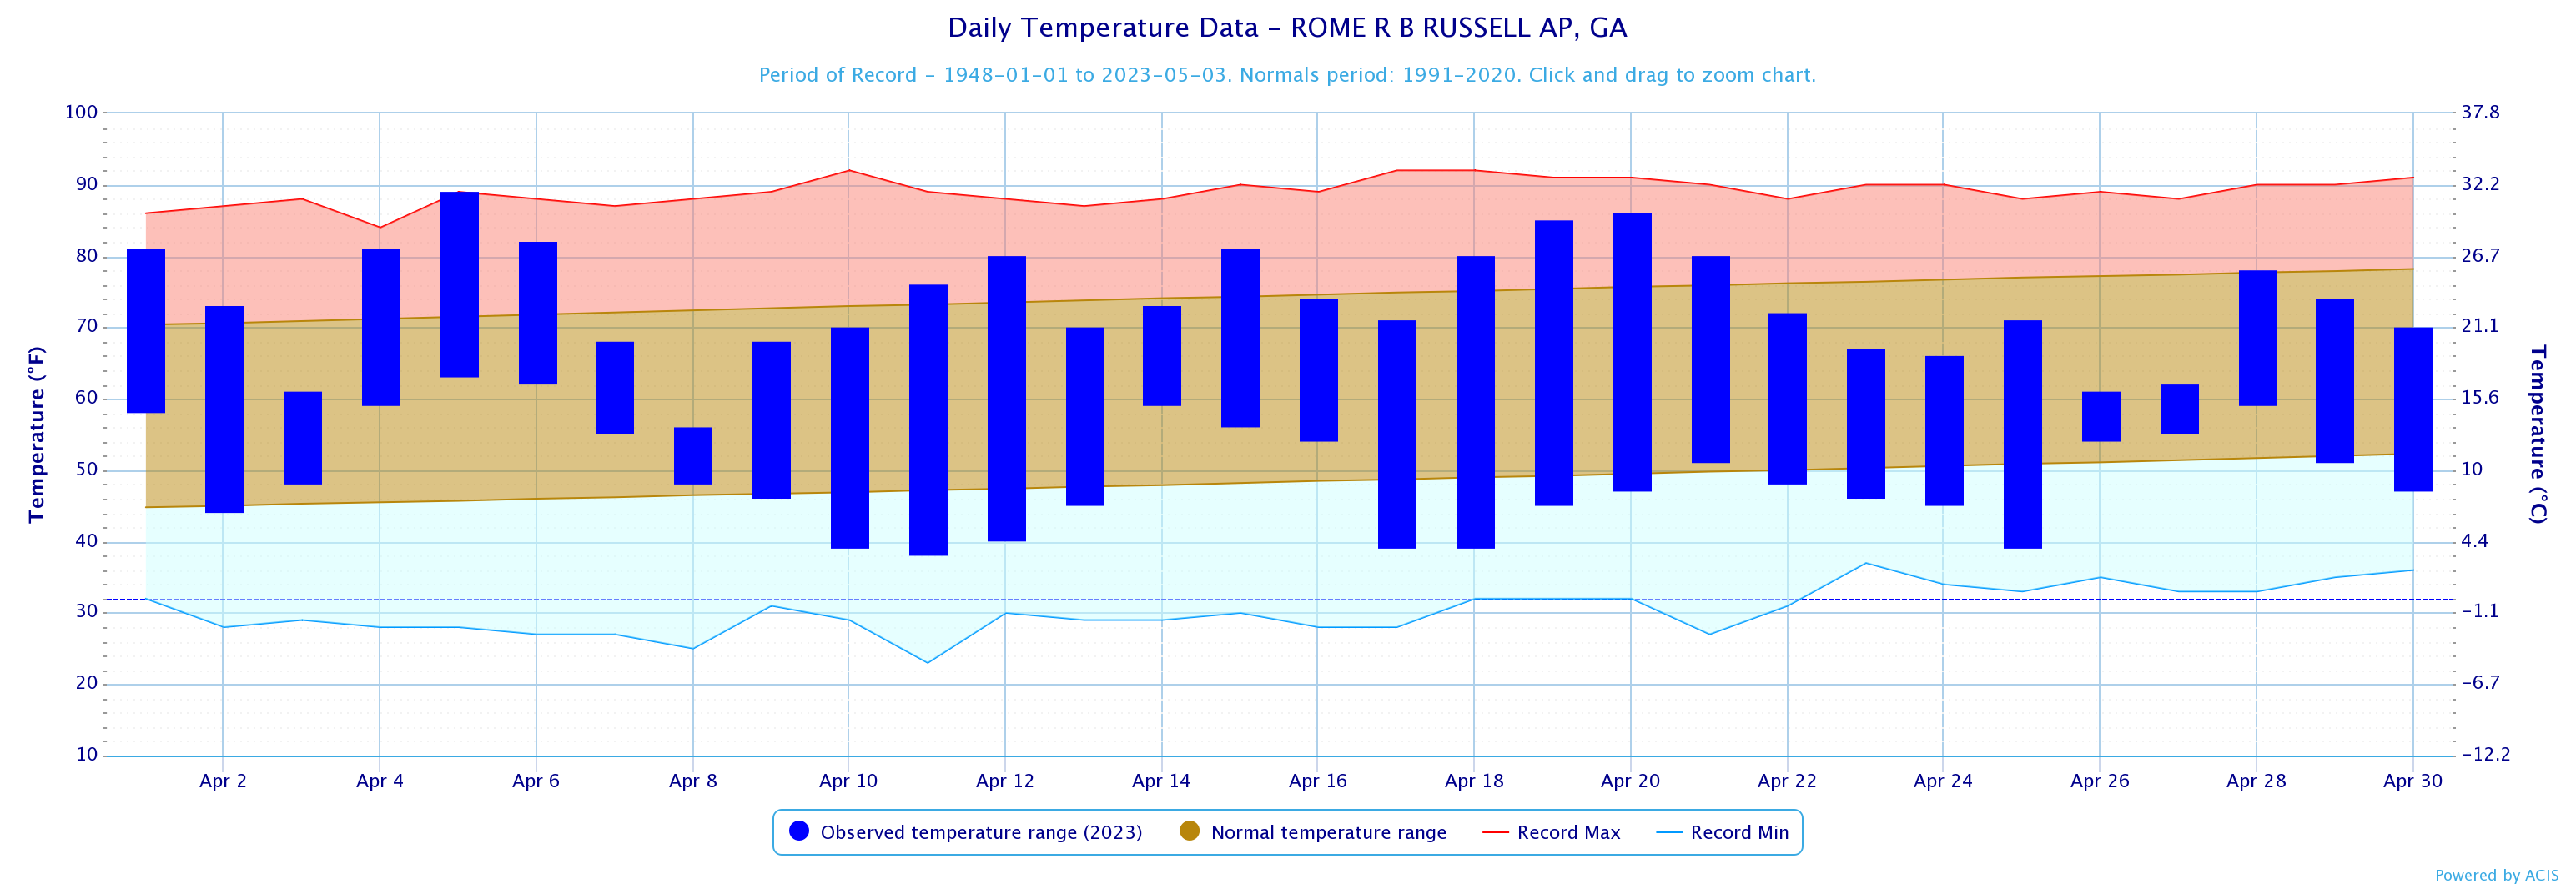
April 2023 Temperature Climate Statistics
Minimum Temperature
Min T Date
Athens
87
4/5
35
4/11
Atlanta
87
4/5
44
4/9
Columbus
89
4/5
43
4/18
Macon
89
4/5
39
4/10
Dekalb Peachtree Arpt
85
4/5
35
4/11
Fulton Co Arpt
88
4/5
36
4/11
Gainesville
86
4/5
41
4/9
Peachtree City
86
4/5
36
4/11
Rome
89
4/5
38
4/11
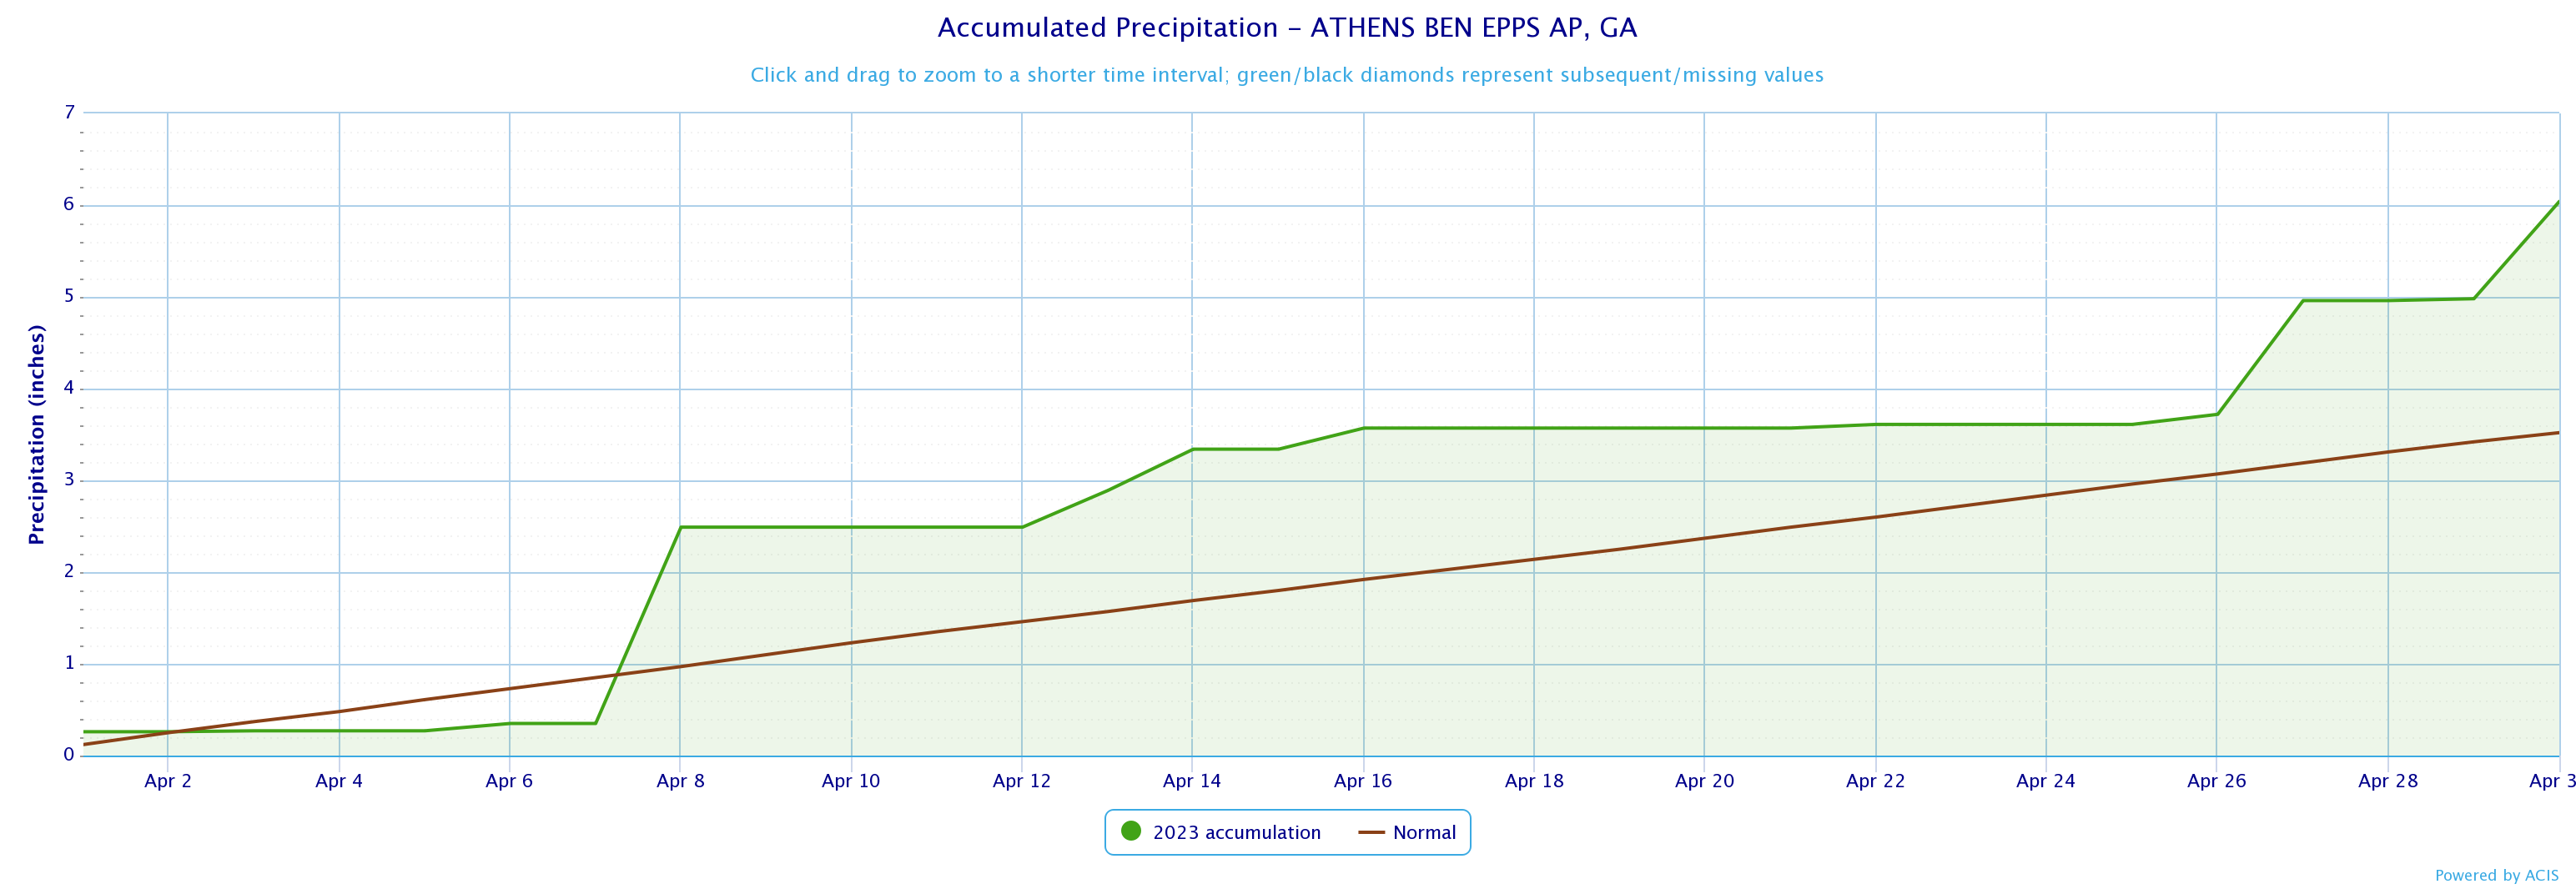
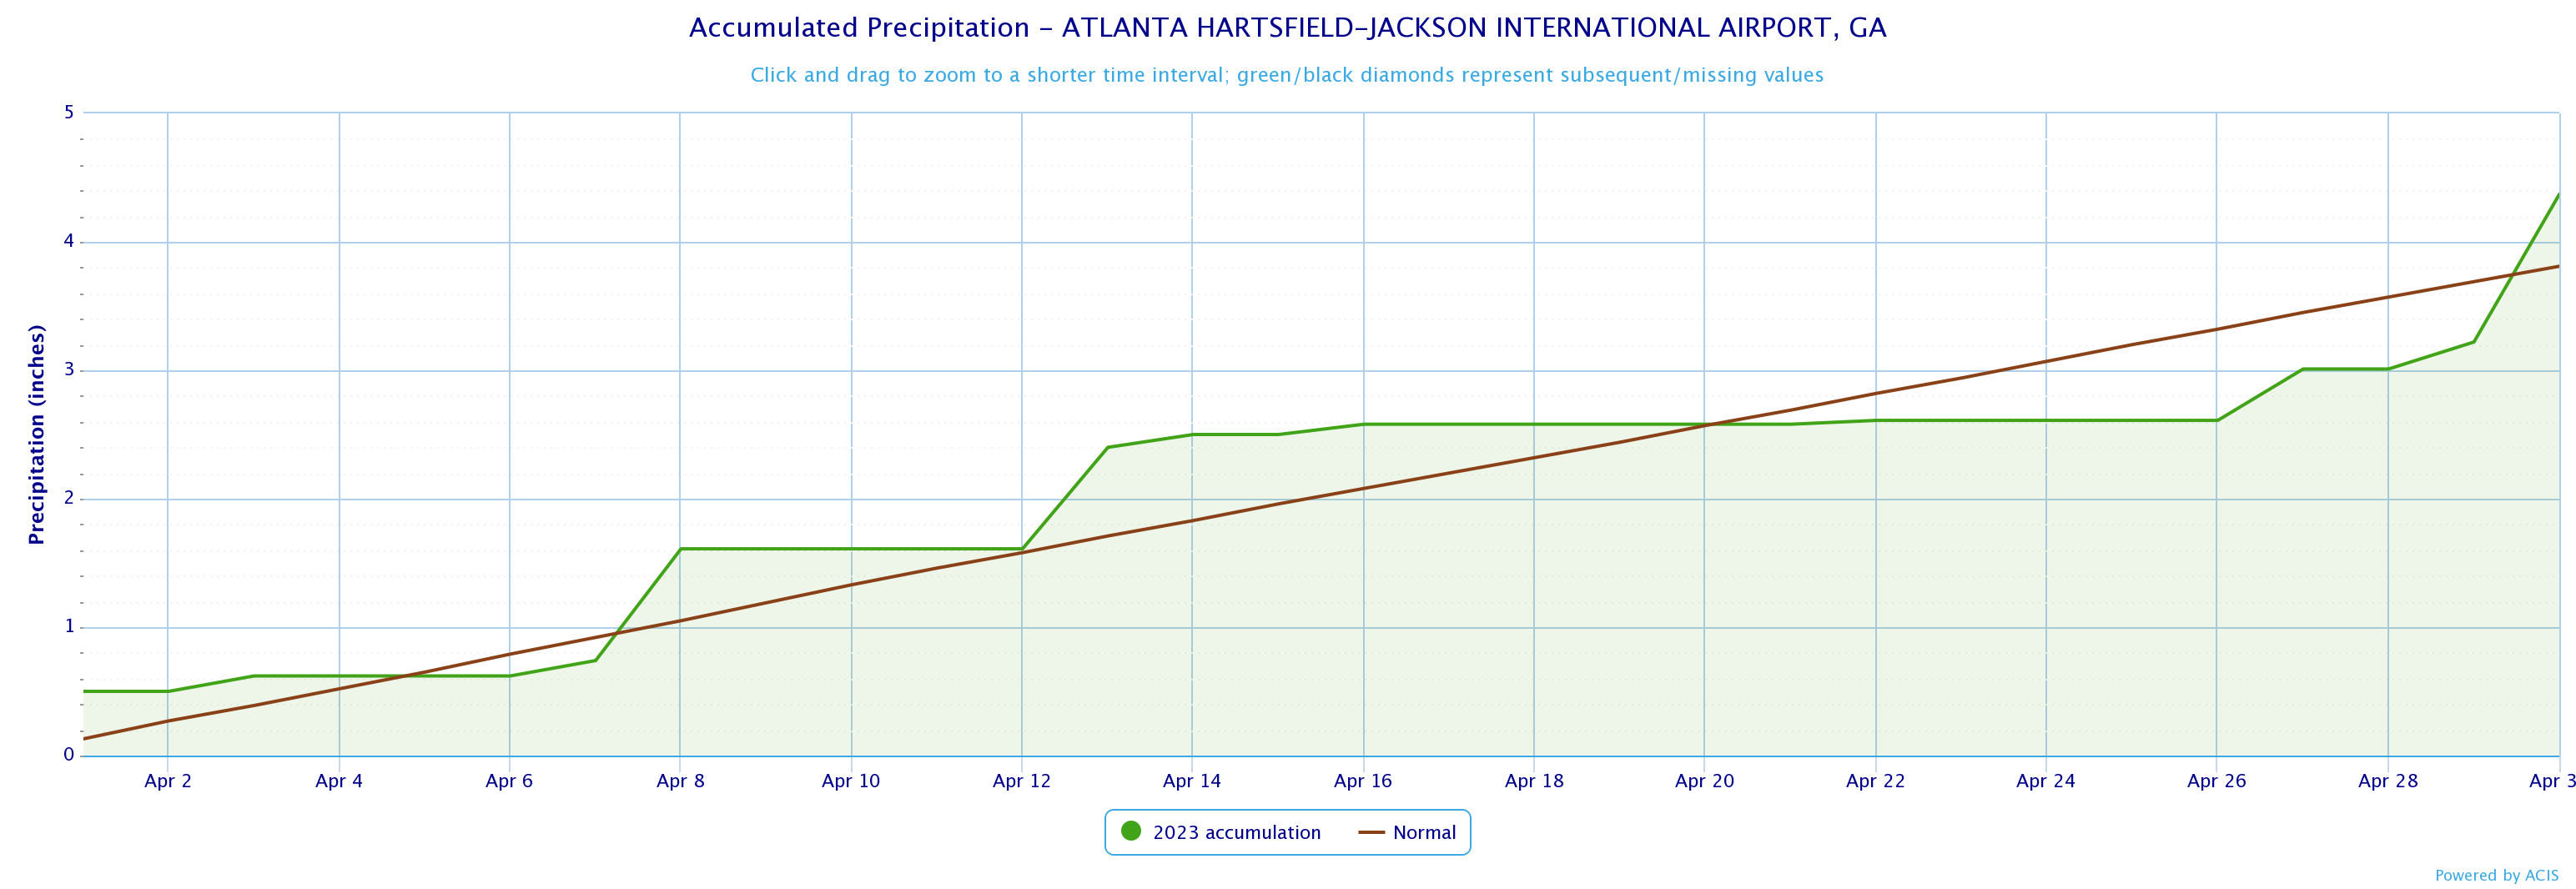
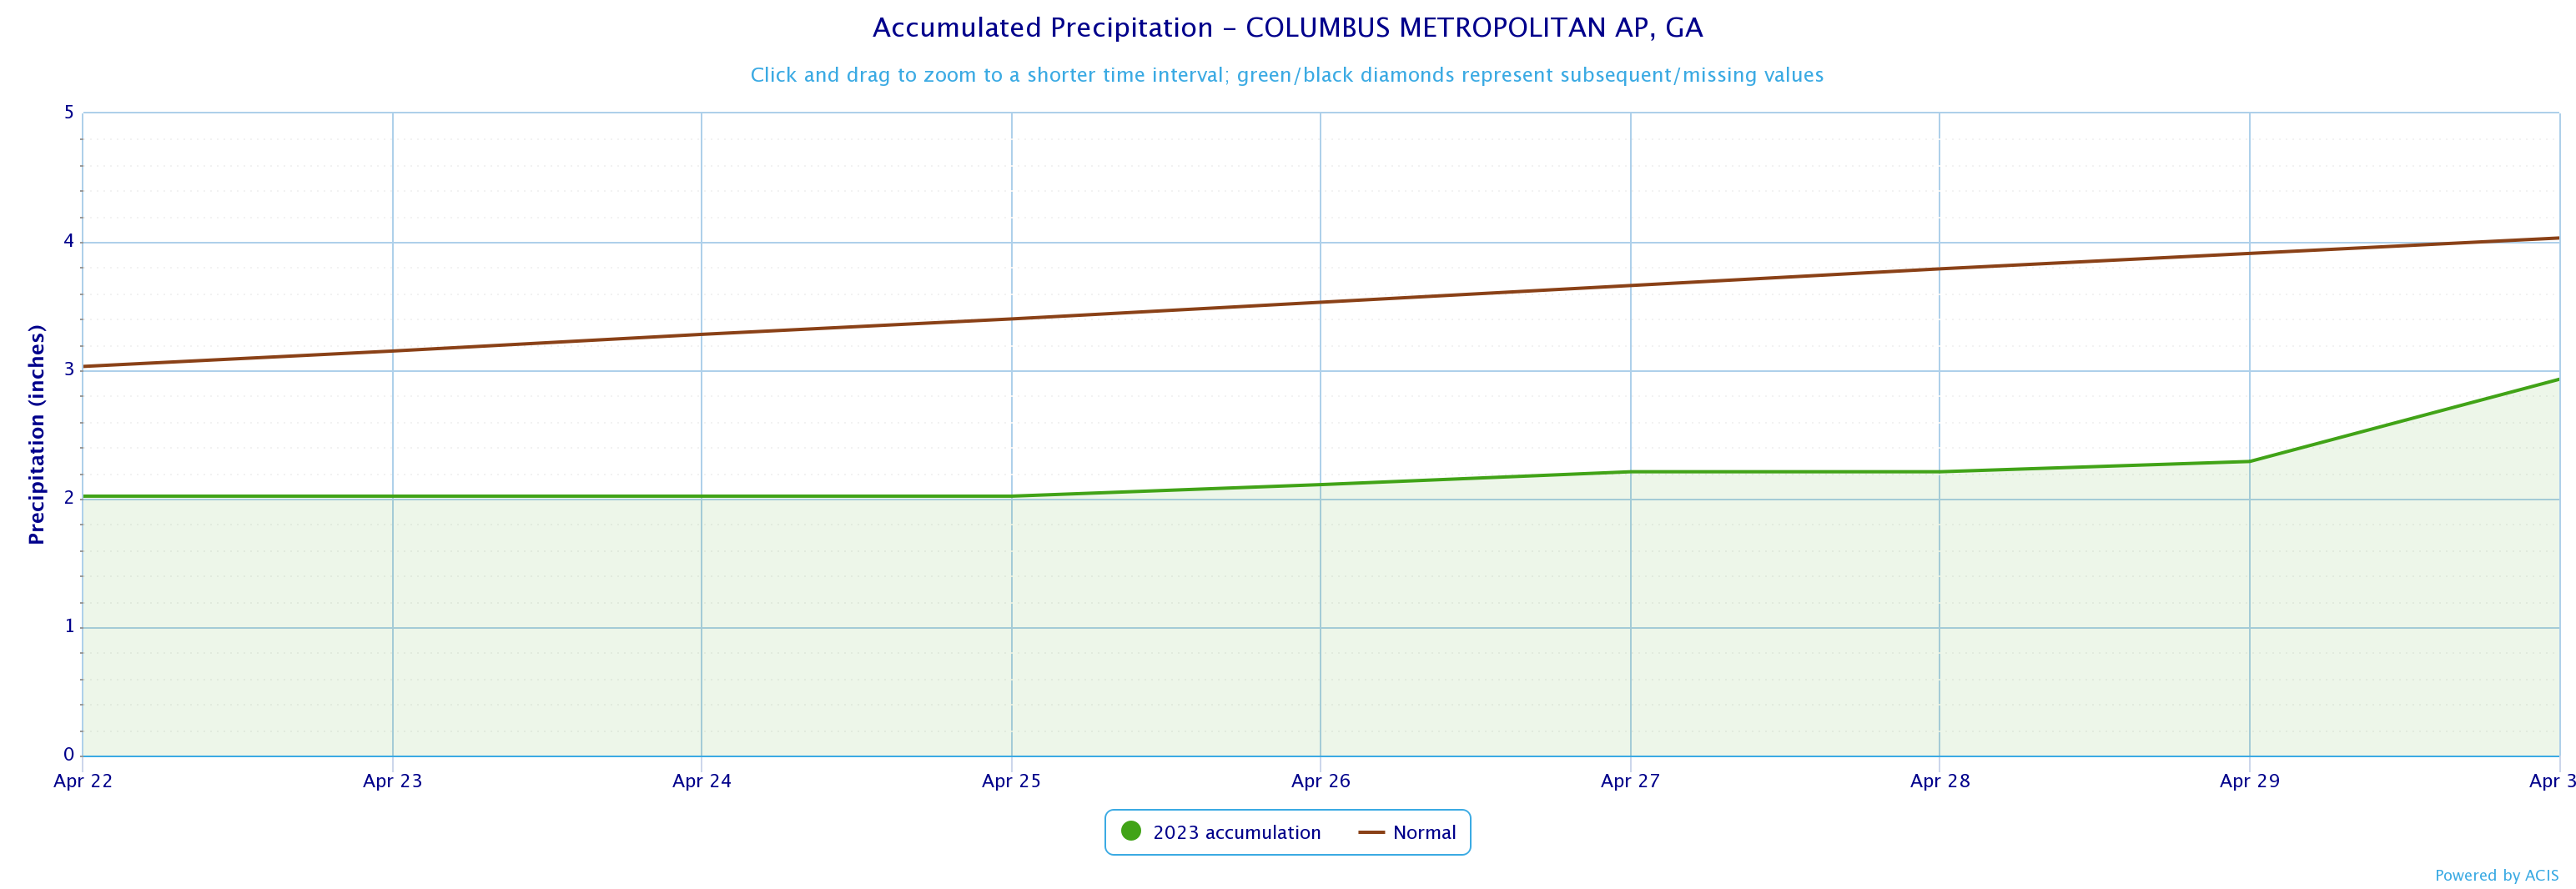
April 2023 Precipitation Climate Statistics
Average Precipitation
From Normal)
Athens
6.04
3.52
2.52
Atlanta
4.37
3.81
0.56
Columbus
2.93
4.03
-1.10
Macon
2.96
3.62
-0.66
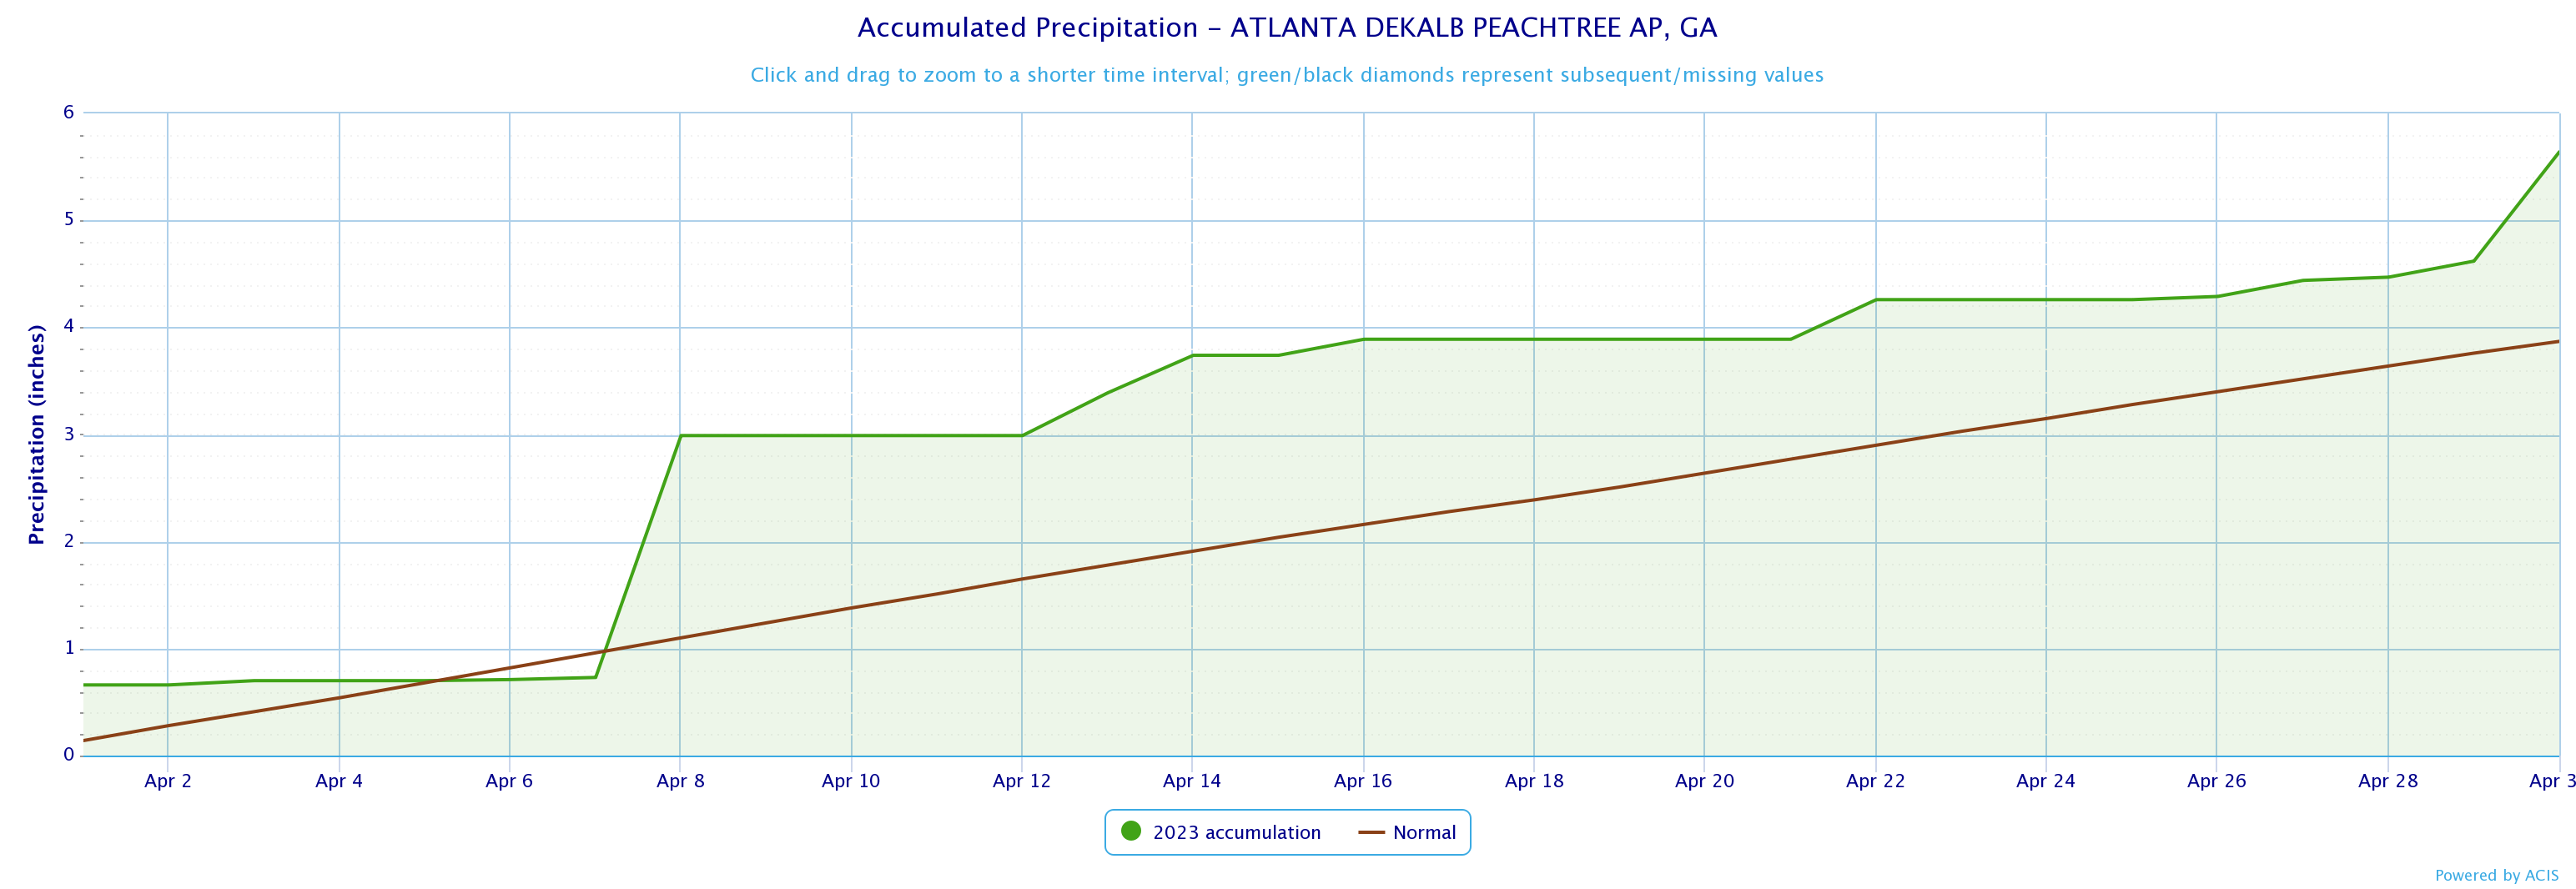
Dekalb Peachtree Arpt
5.64
3.87
1.77
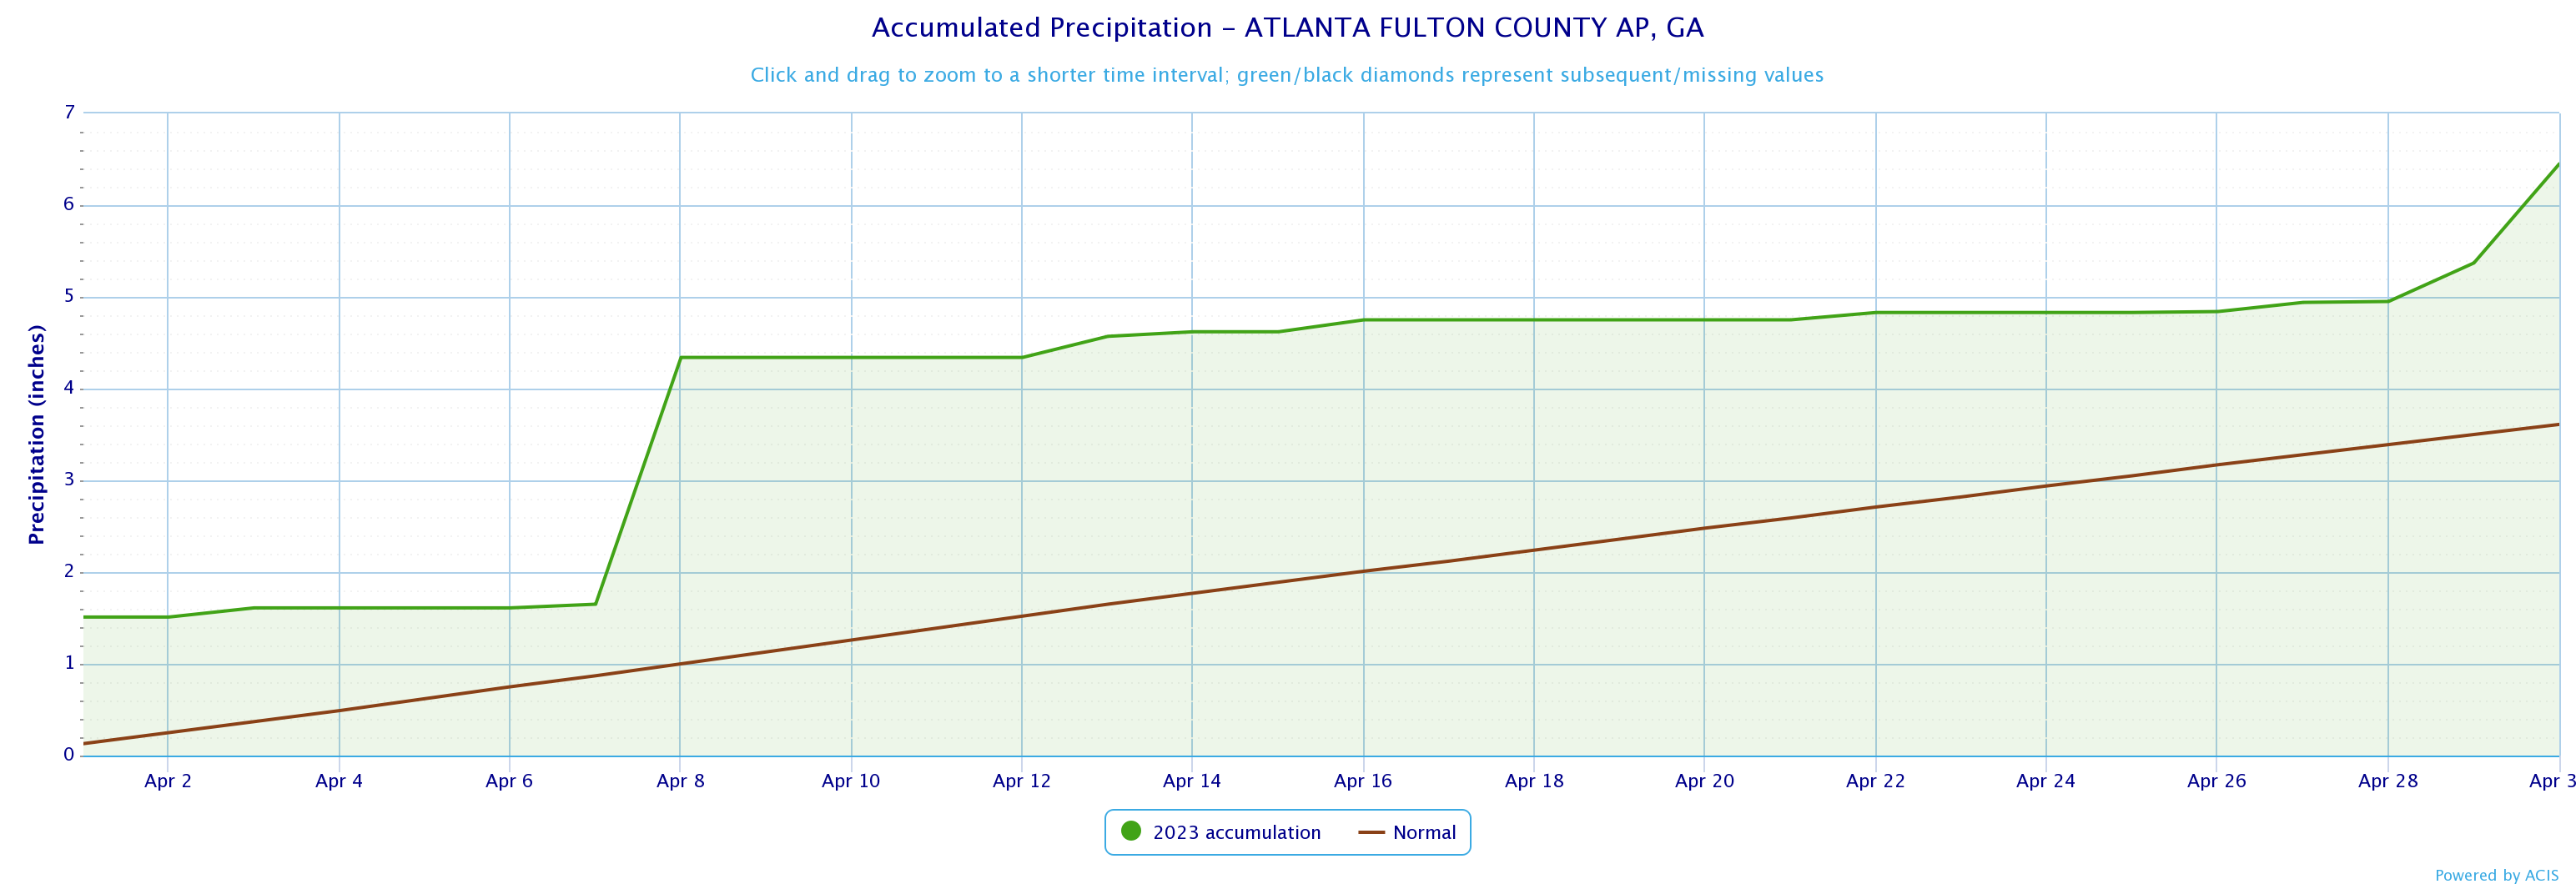
Fulton County Arpt
6.45
3.61
2.84
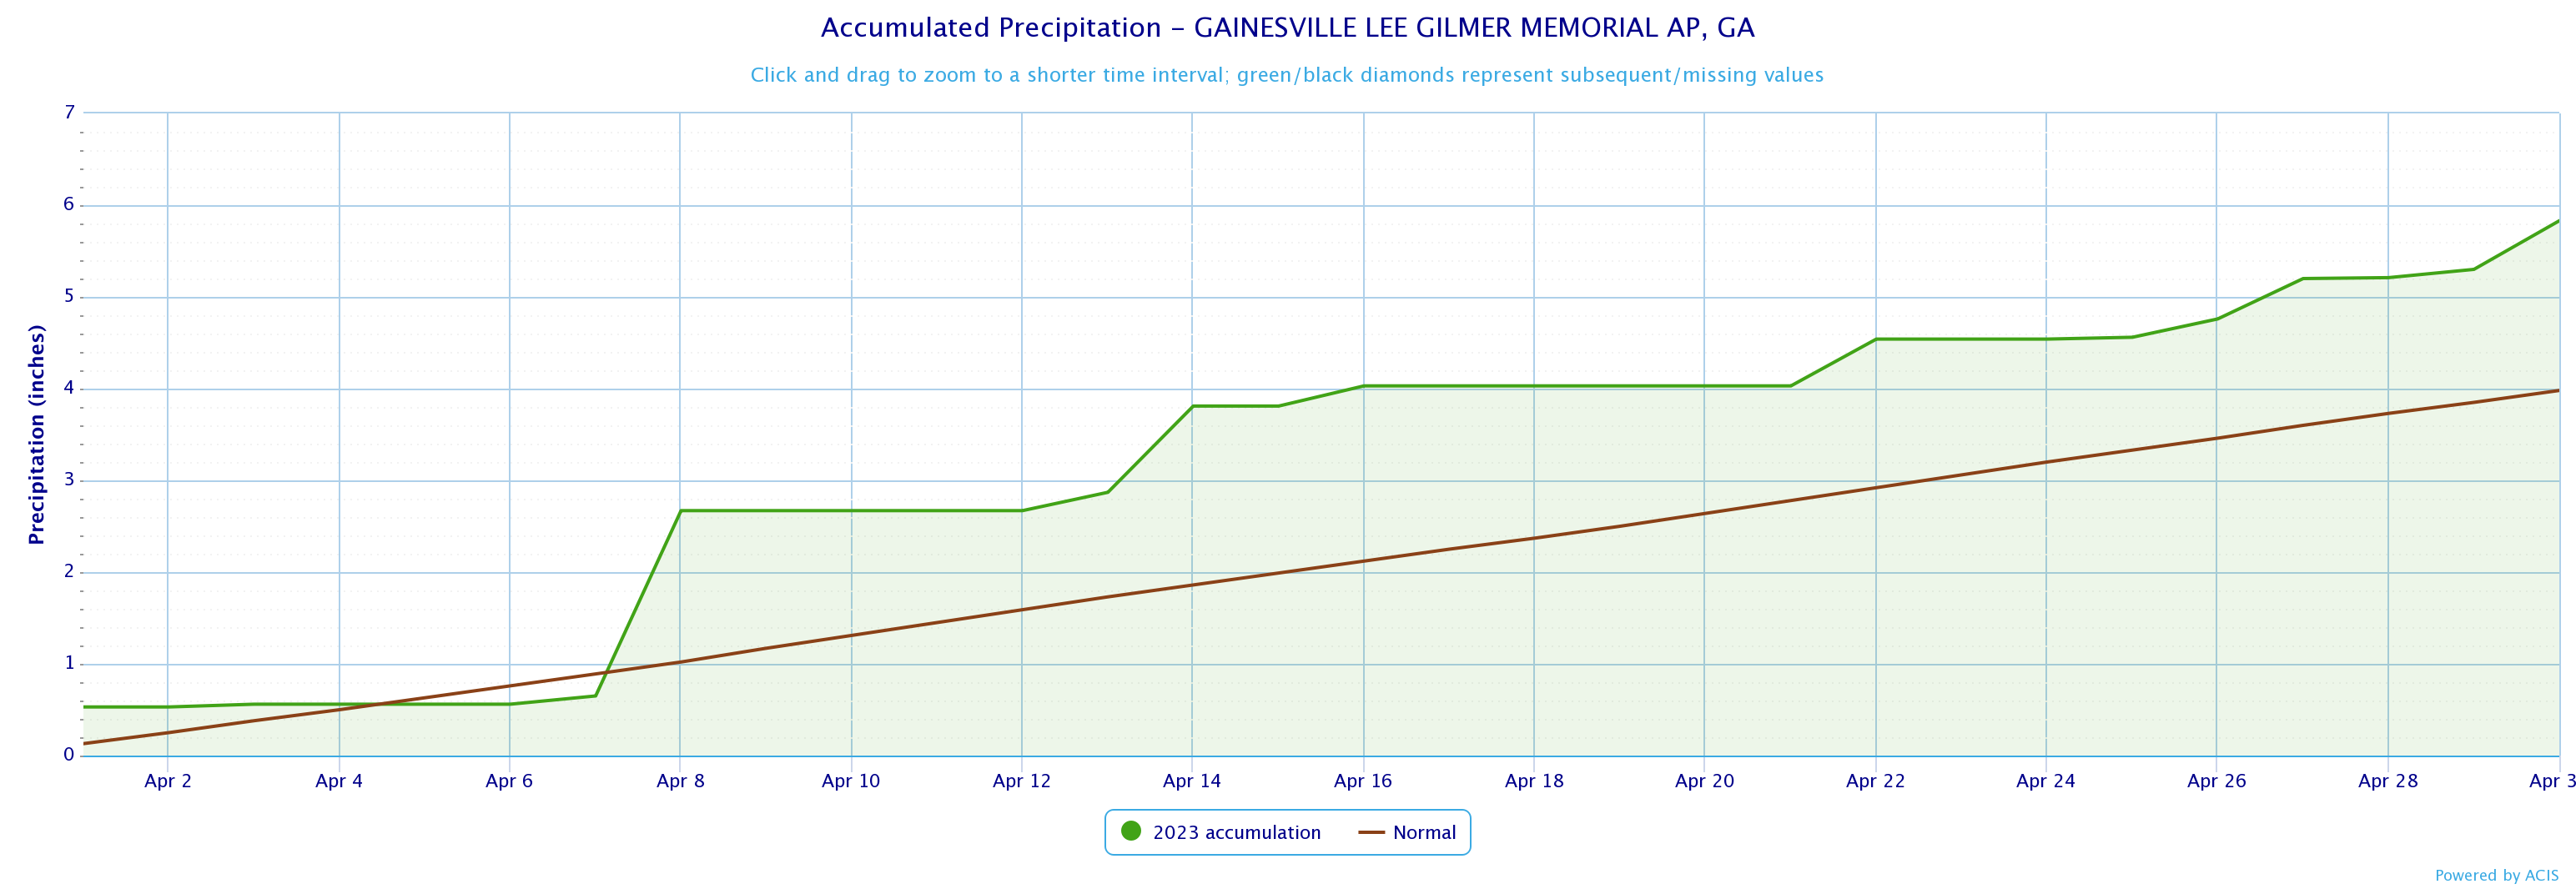
Gainesville
5.83
3.98
1.85
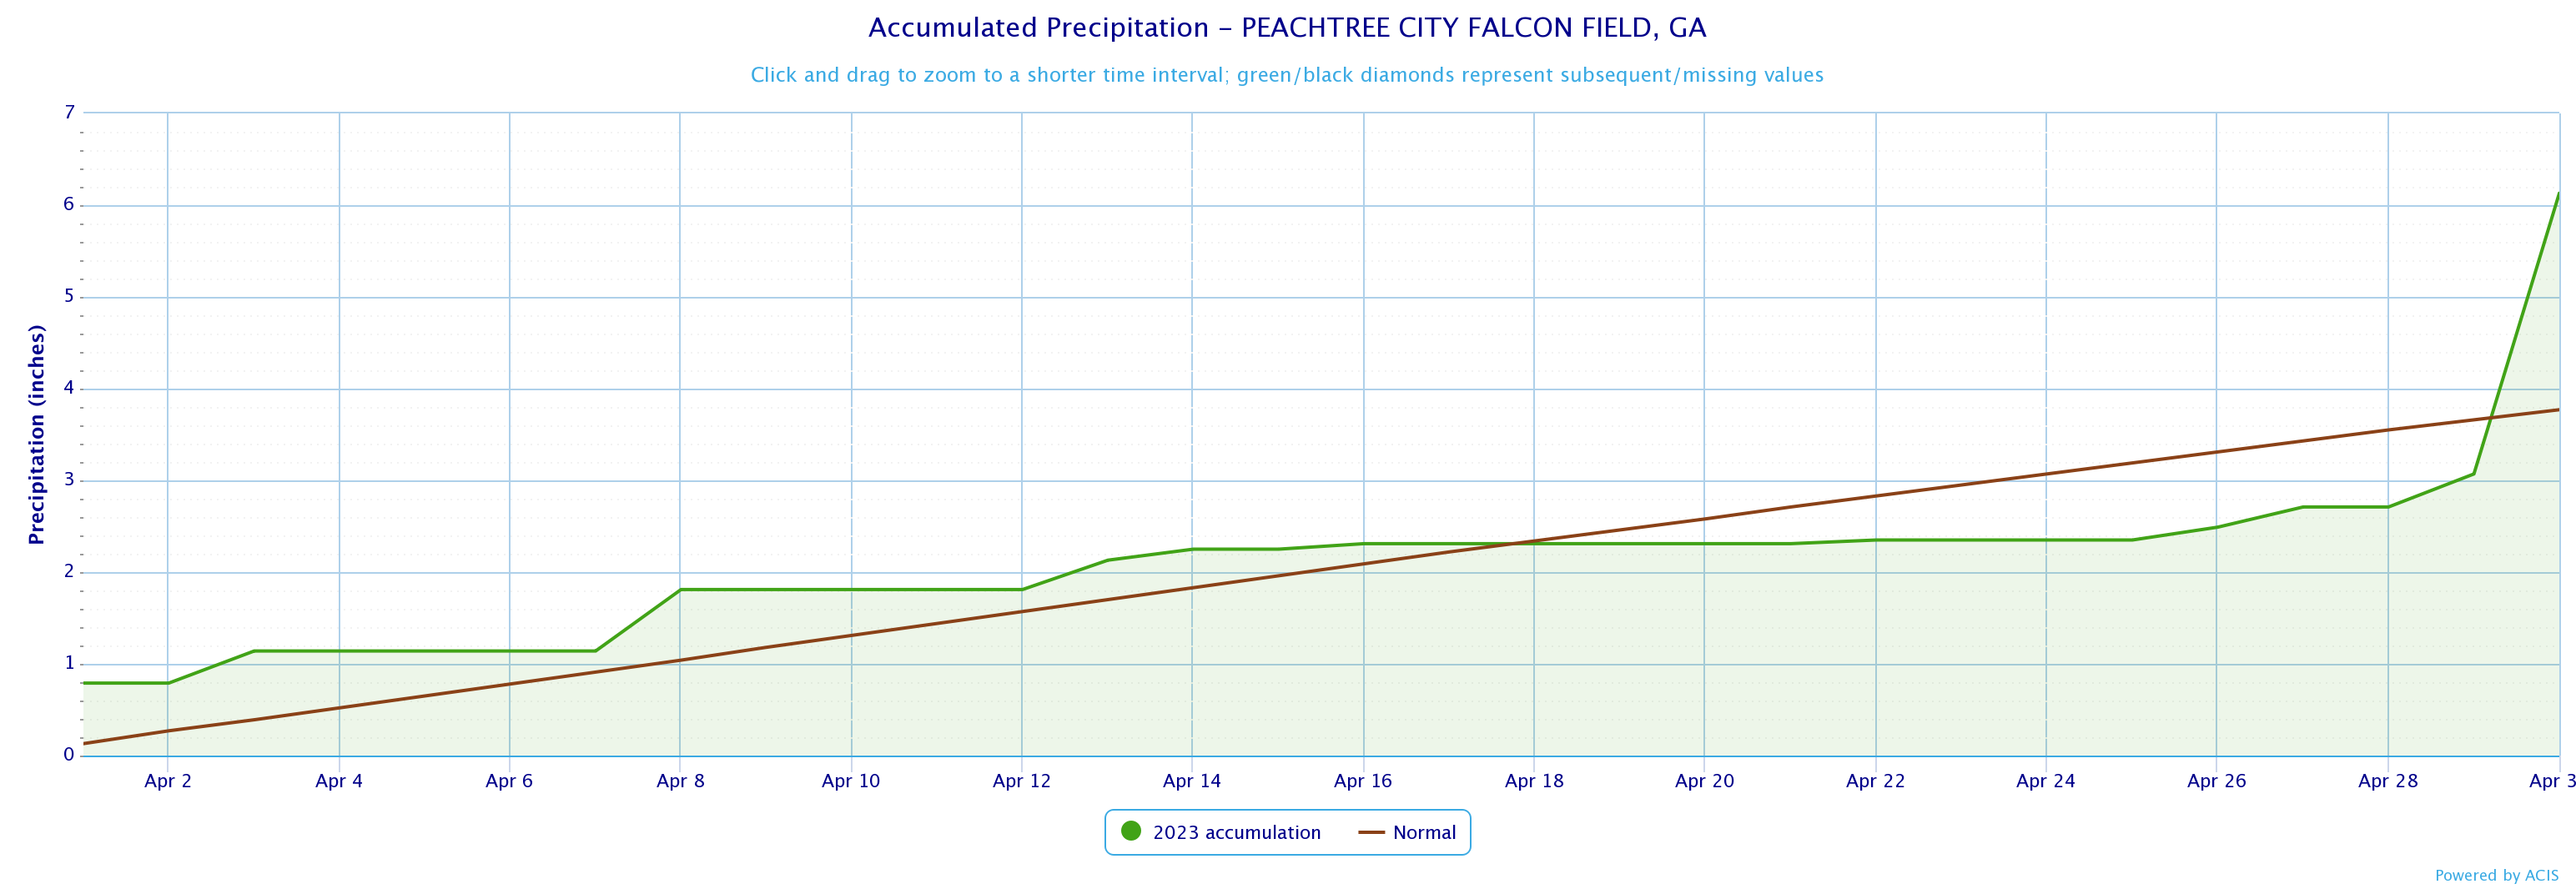
Peachtree City
6.13
3.77
2.36
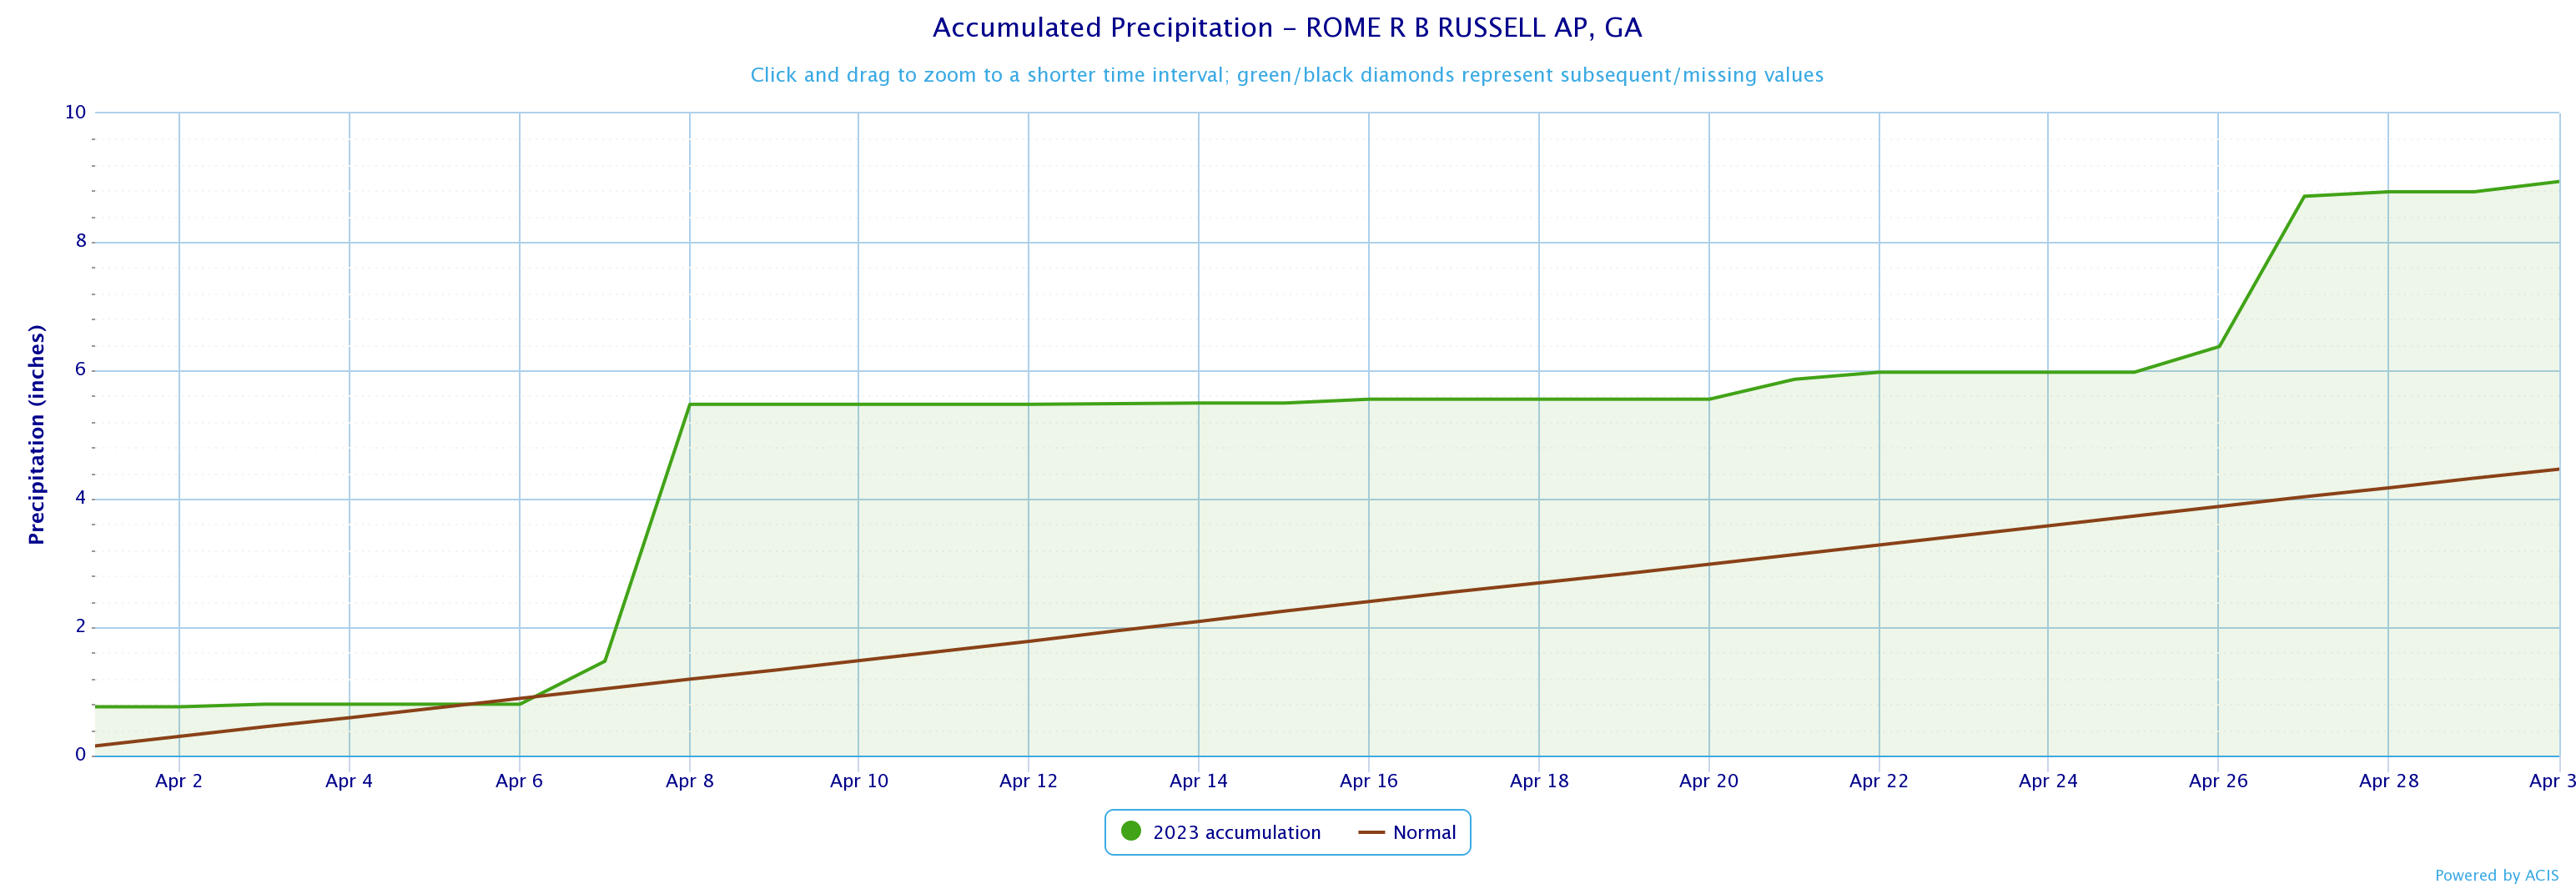
Rome
8.34
4.46
3.86
April 2023 Precipitation Climate Statistics
Athens
2.14
4/8
Atlanta
1.36
4/30
Columbus
0.72
4/30
Macon
1.19
4/8
Dekalb Peachtree Arpt
2.26
4/8
Fulton Co Arpt
2.69
4/8
Gainesville
2.02
4/8
Peachtree City
3.42
4/30
Rome
4.00
4/8
Click the links below to explore the temperature and precipitation data across north and central Georgia for the month of April 2023.
Temperature Maps
Precipitation Maps
Temperature Graphs
Precipitation Graphs


Temperature and precipitation records at our 4 main climate sites are located below.
April 2023 Climate Records
No Records were broken during the month of April
Larger events that occurred across north and central Georgia this past April can be found here.

The May climate outlook is below.
May Outlook