| Previous Month | Next Month |
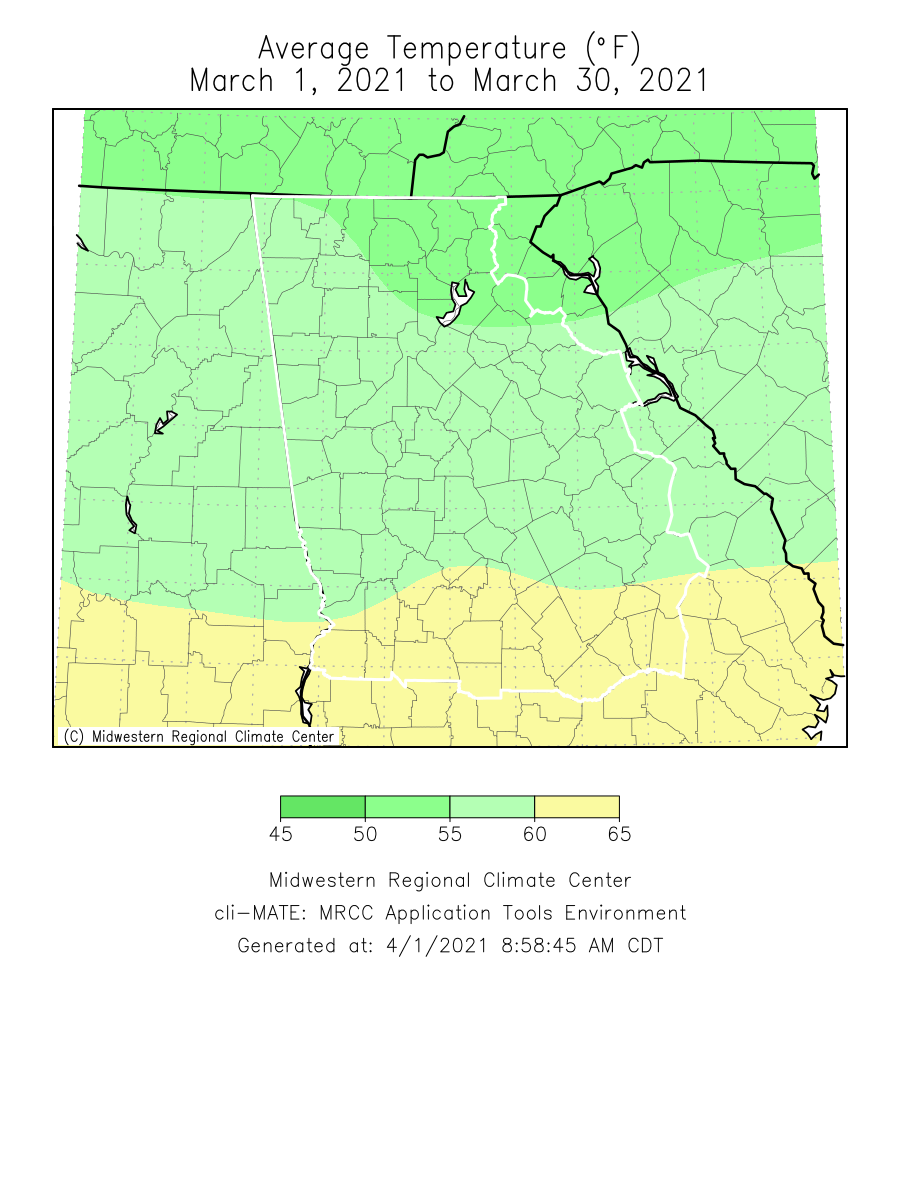
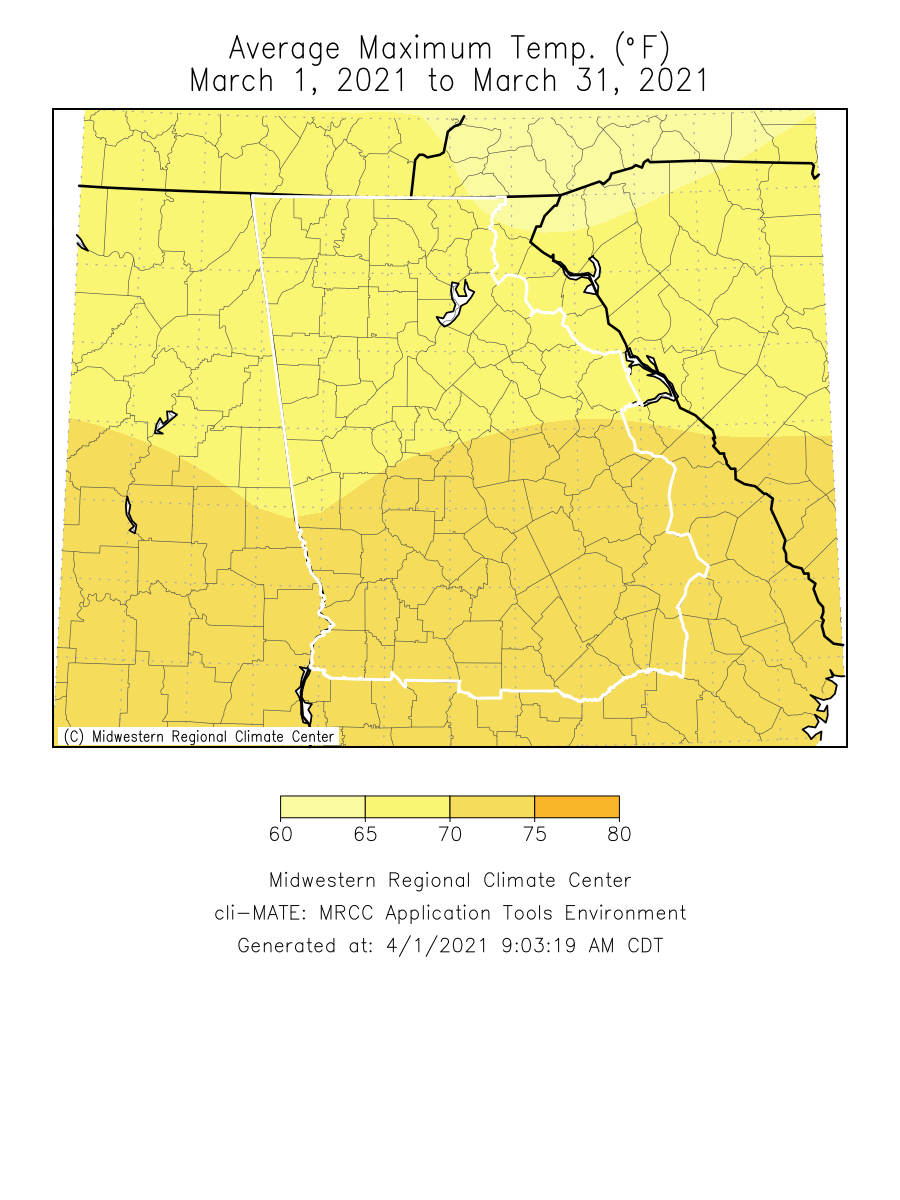
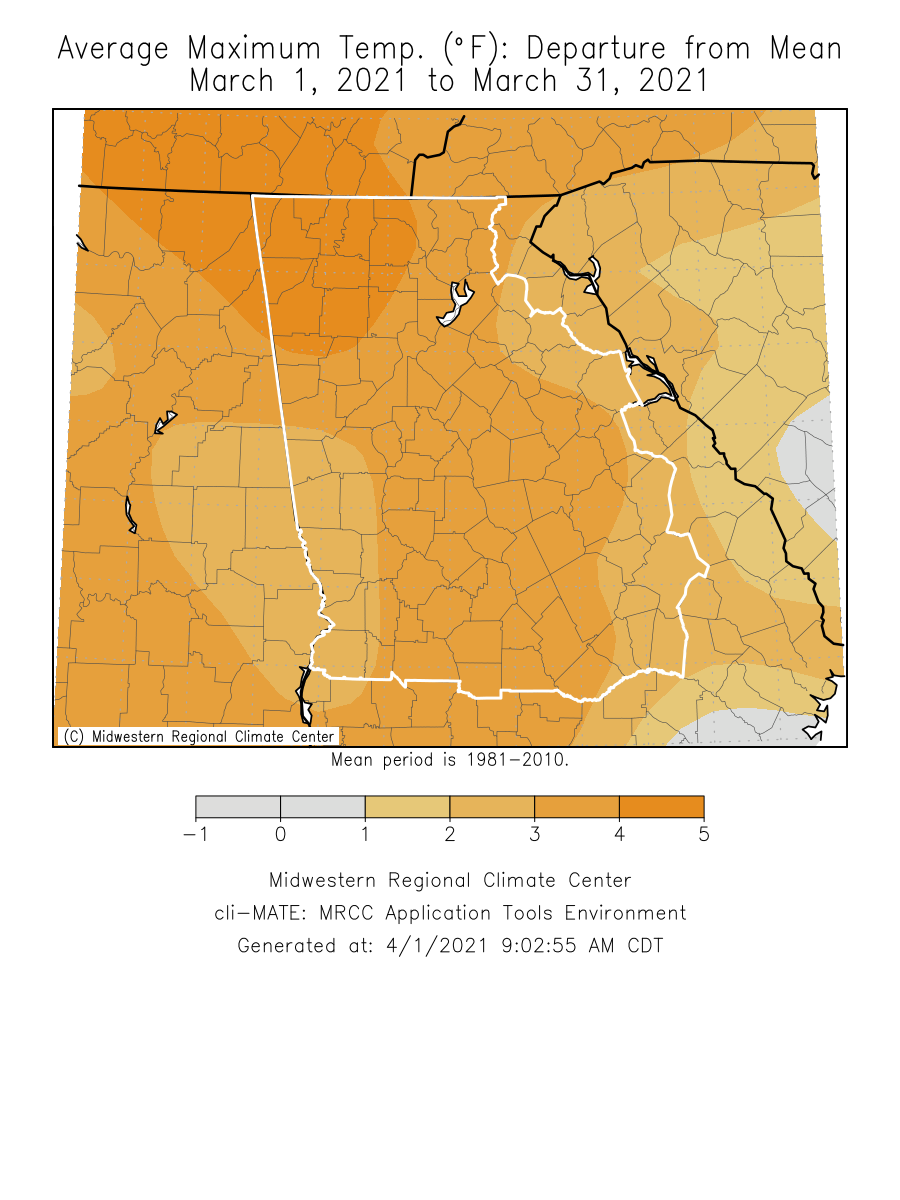
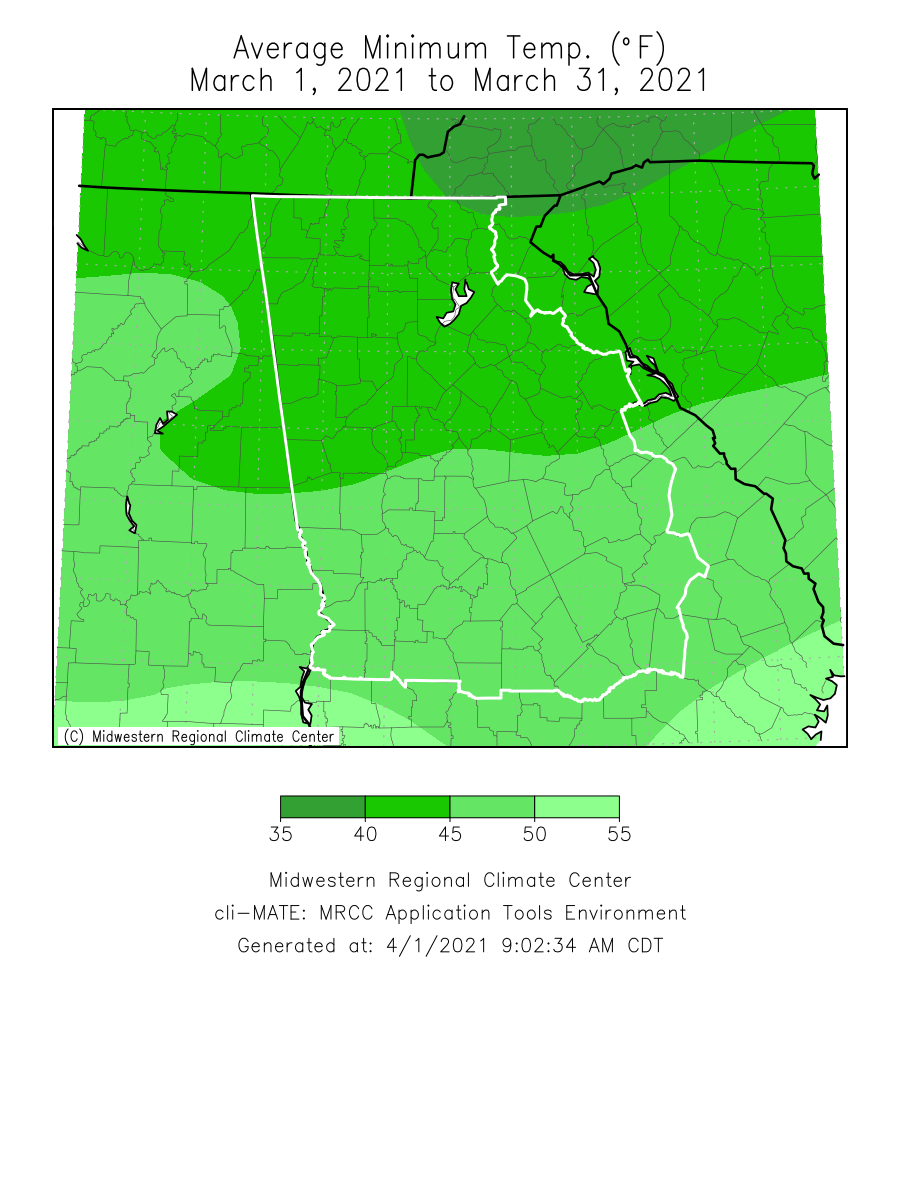
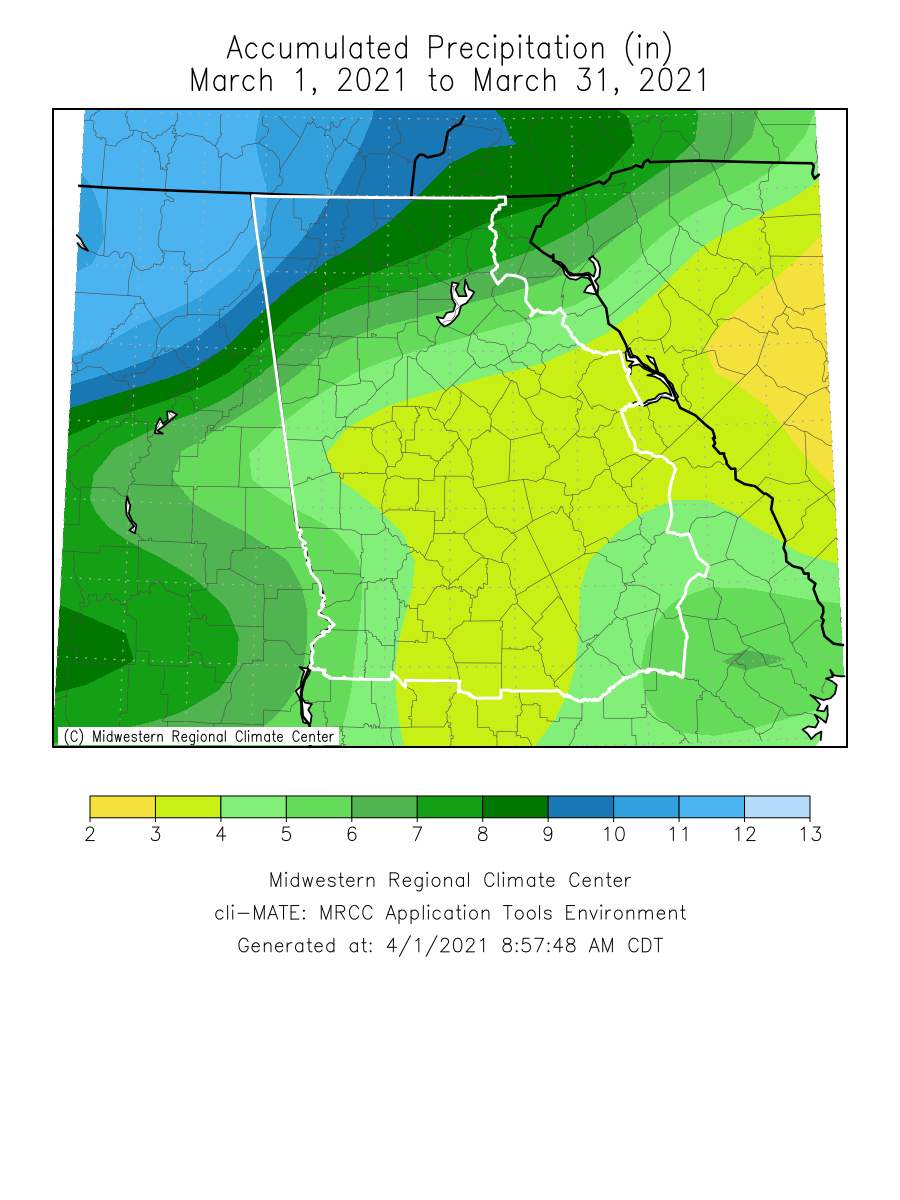
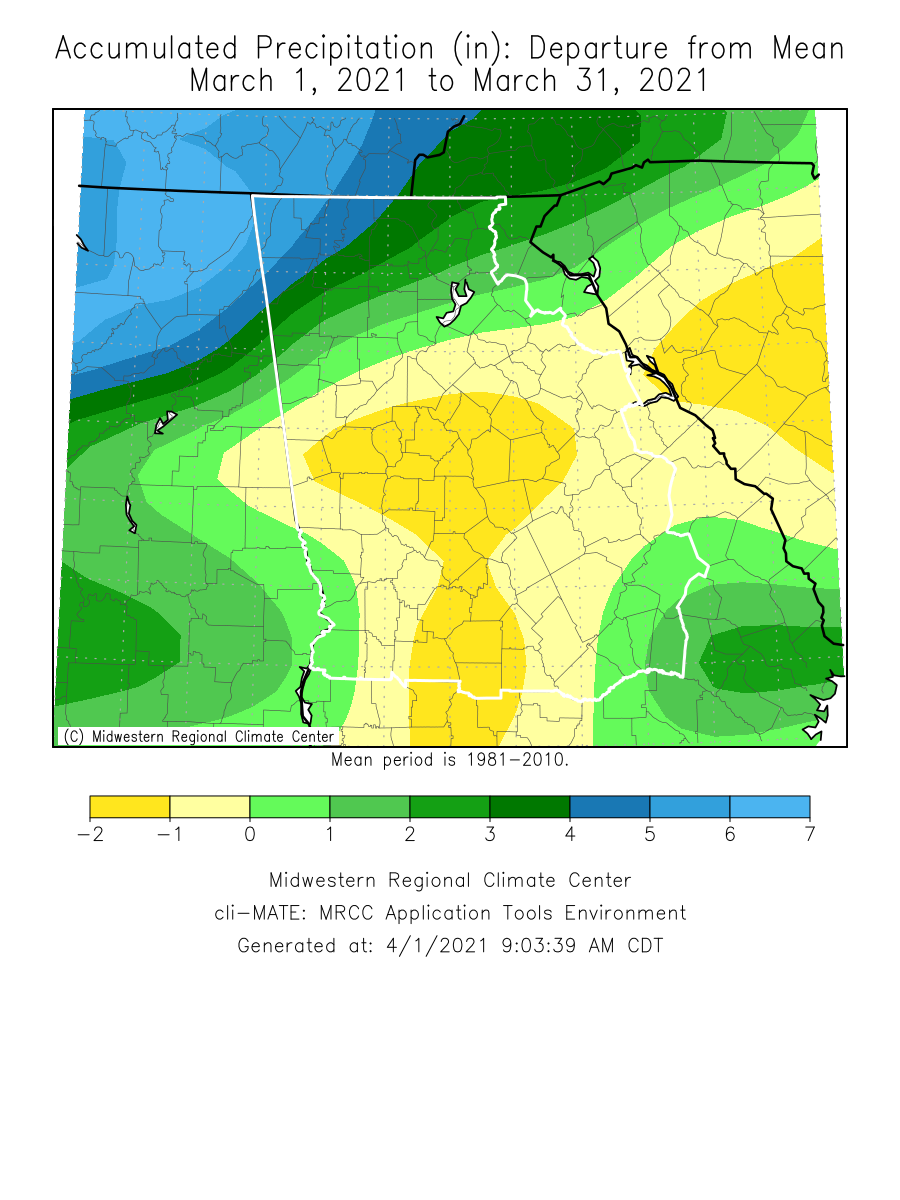
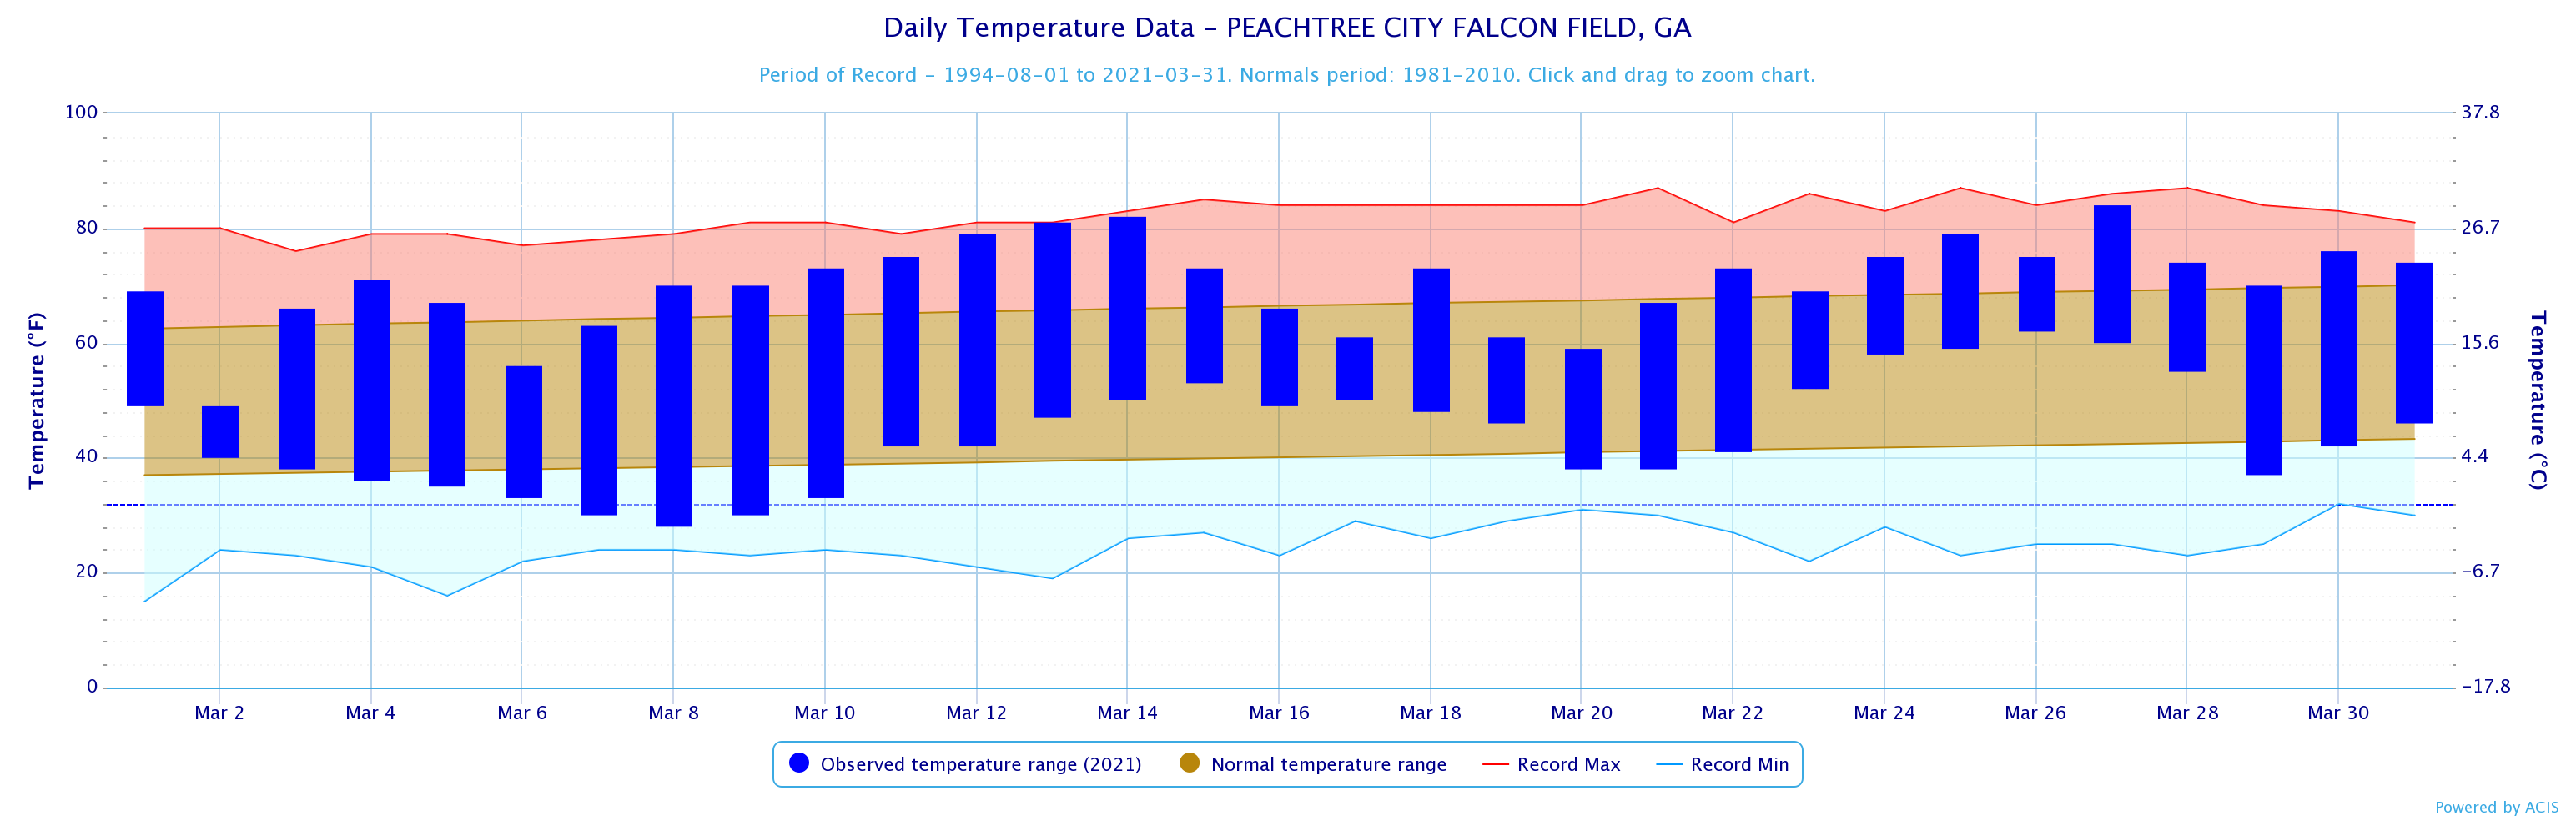
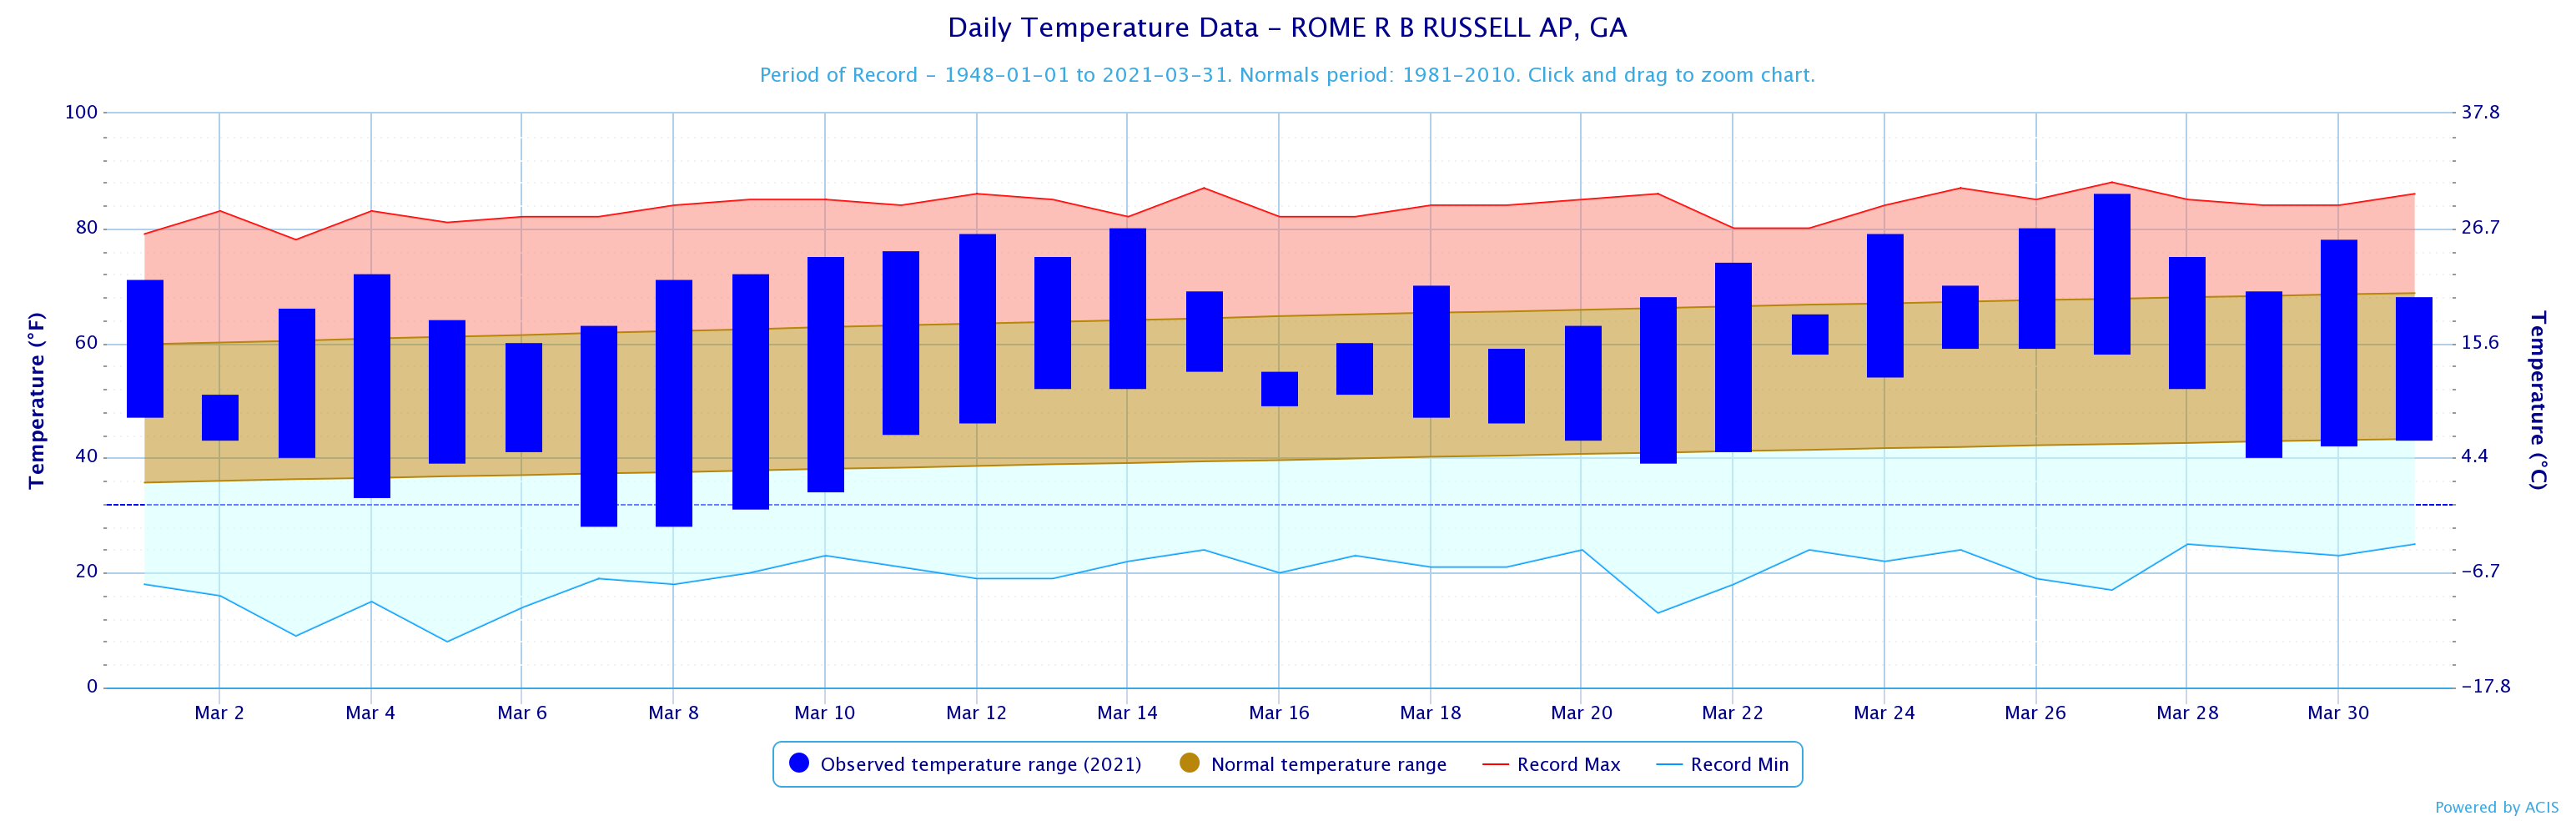
Temperatures through the month of March were 3 to 5 degrees above normal. Precipitation through the month of March was around generally within 1 inch of normal.
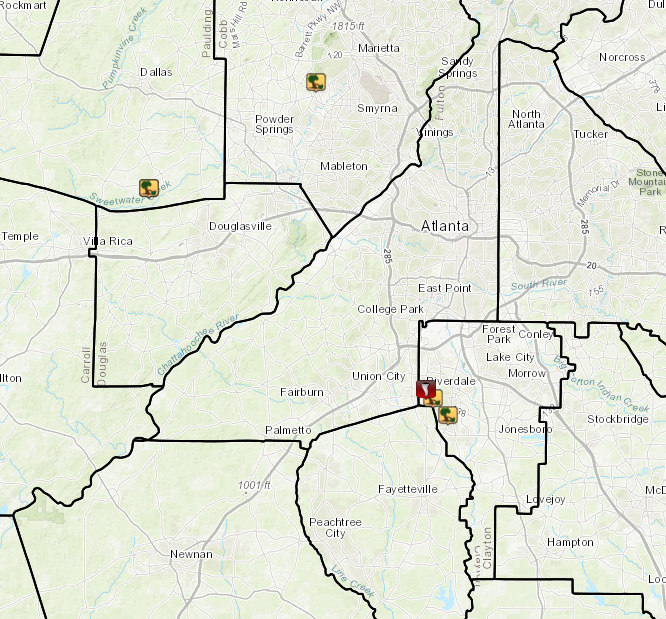
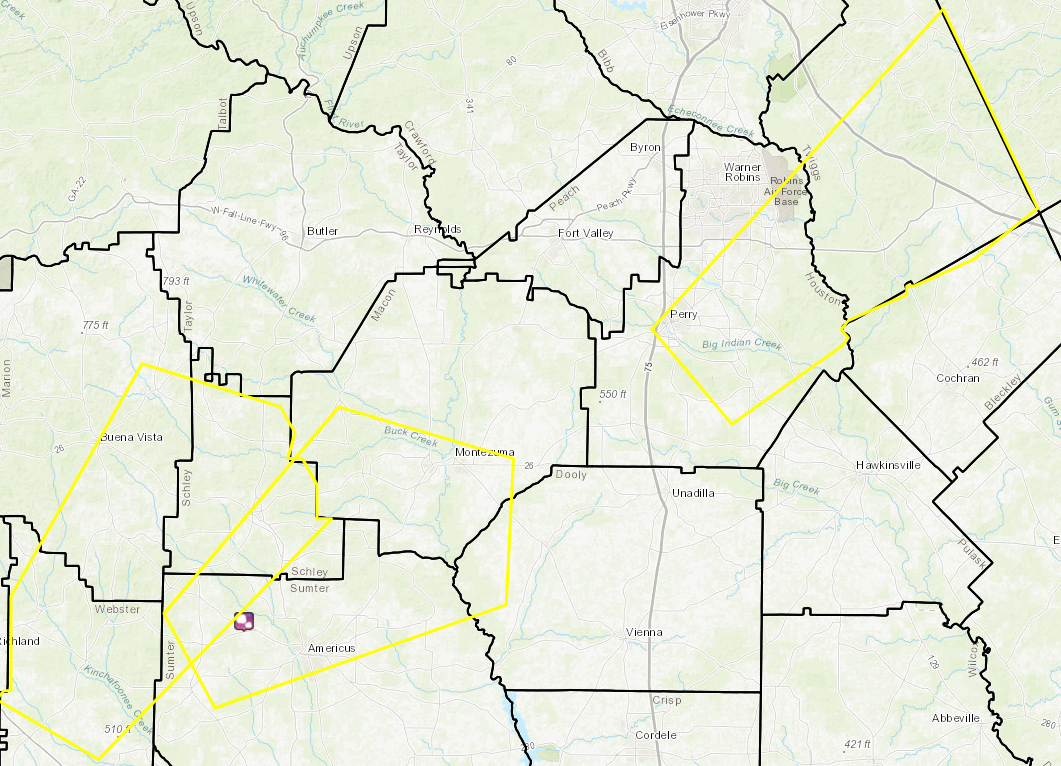
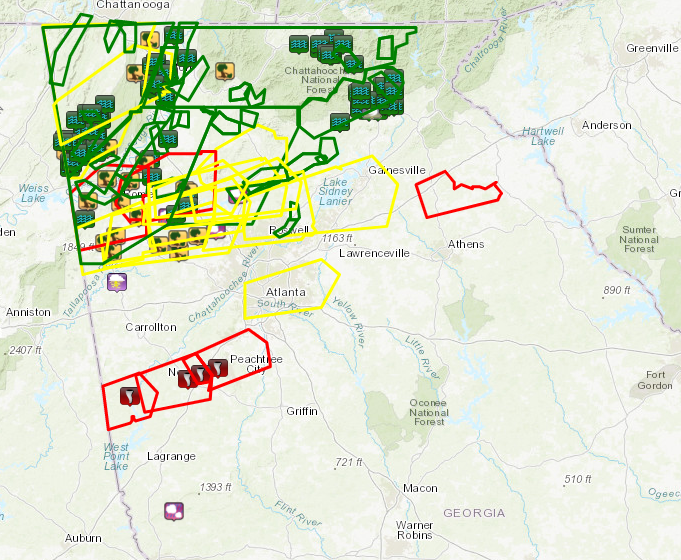
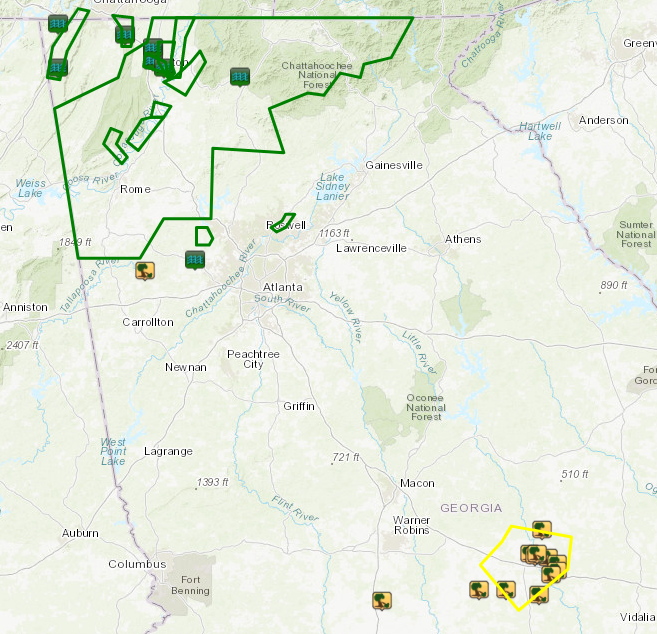
Athens and Atlanta set a daily temperature record during the month of March. For more information, please see the Records tab. *Indicates a daily record was set *Indicates a daily record was set Data prepared by NWS Peachtree City/Atlanta March 2021 Warnings and Local Storm Reports March 1st: A line of strong storms spawned a brief tornado and resulted in a few severe weather reports in Clayton, Paulding and Cobb counties. March 17th: A few strong storms produced quarter sized hail across central Georgia. March 25-26th: A severe weather outbreak spawned multiple tornadoes, severe thunderstorms and flash flooding across the northern part of the CWA. For more information on this large scale event please see the event page that provides the most up to date information on the events that took place. For more information on the Heard, Coweta and Fayette County Tornado please see the Newnan EF-4 page. The Public Information Statement for the storm surveys that were conducted can be found here. March 31st: Heavy rain combined with soils that had already been heavily saturated created a quick response that resulted in widespread flash flooding across northern Georgia. Based on the Climate Prediction Center's outlook for April, all of north and central Georgia has a 40% to 50% chance for above normal temperatures. For precipitation, far northern Georgia has a 20% to 40% chance of below normal precipitation. Central Georgia has a 40% to 60% chance of below normal precipitation. Data prepared by NWS Peachtree City/Atlanta.
Overview
Climate Graphics
Records
Events
April Outlook
Below are the overview stats for March 2021 for our 10 climate sites.
March 2021 Climate Averages
Climate Site
March Temp (°F)
Average Temp
Departure from normal
58.8
54.3
+4.5
59.1
54.3
+4.8
60.9
57.8
+3.1
60.2
57.8
+2.4
57.3
51.7
+5.6
56.6
51.7
+4.9
57.4
53.6
+3.8
56.4
52.7
+3.7
57.2
52.7
+4.5
57.4
52.7
+4.7
March 2021 Temperature Climate Statistics
Climate Site
Maximum Temperature
Max T Date
Minimum Temperature
Min T Date
Athens
85
3/27
30
3/7
Atlanta
82
3/27
35
3/7
Columbus
84
3/27
33
3/8
Macon
85
3/14, 25, 27
28
3/8
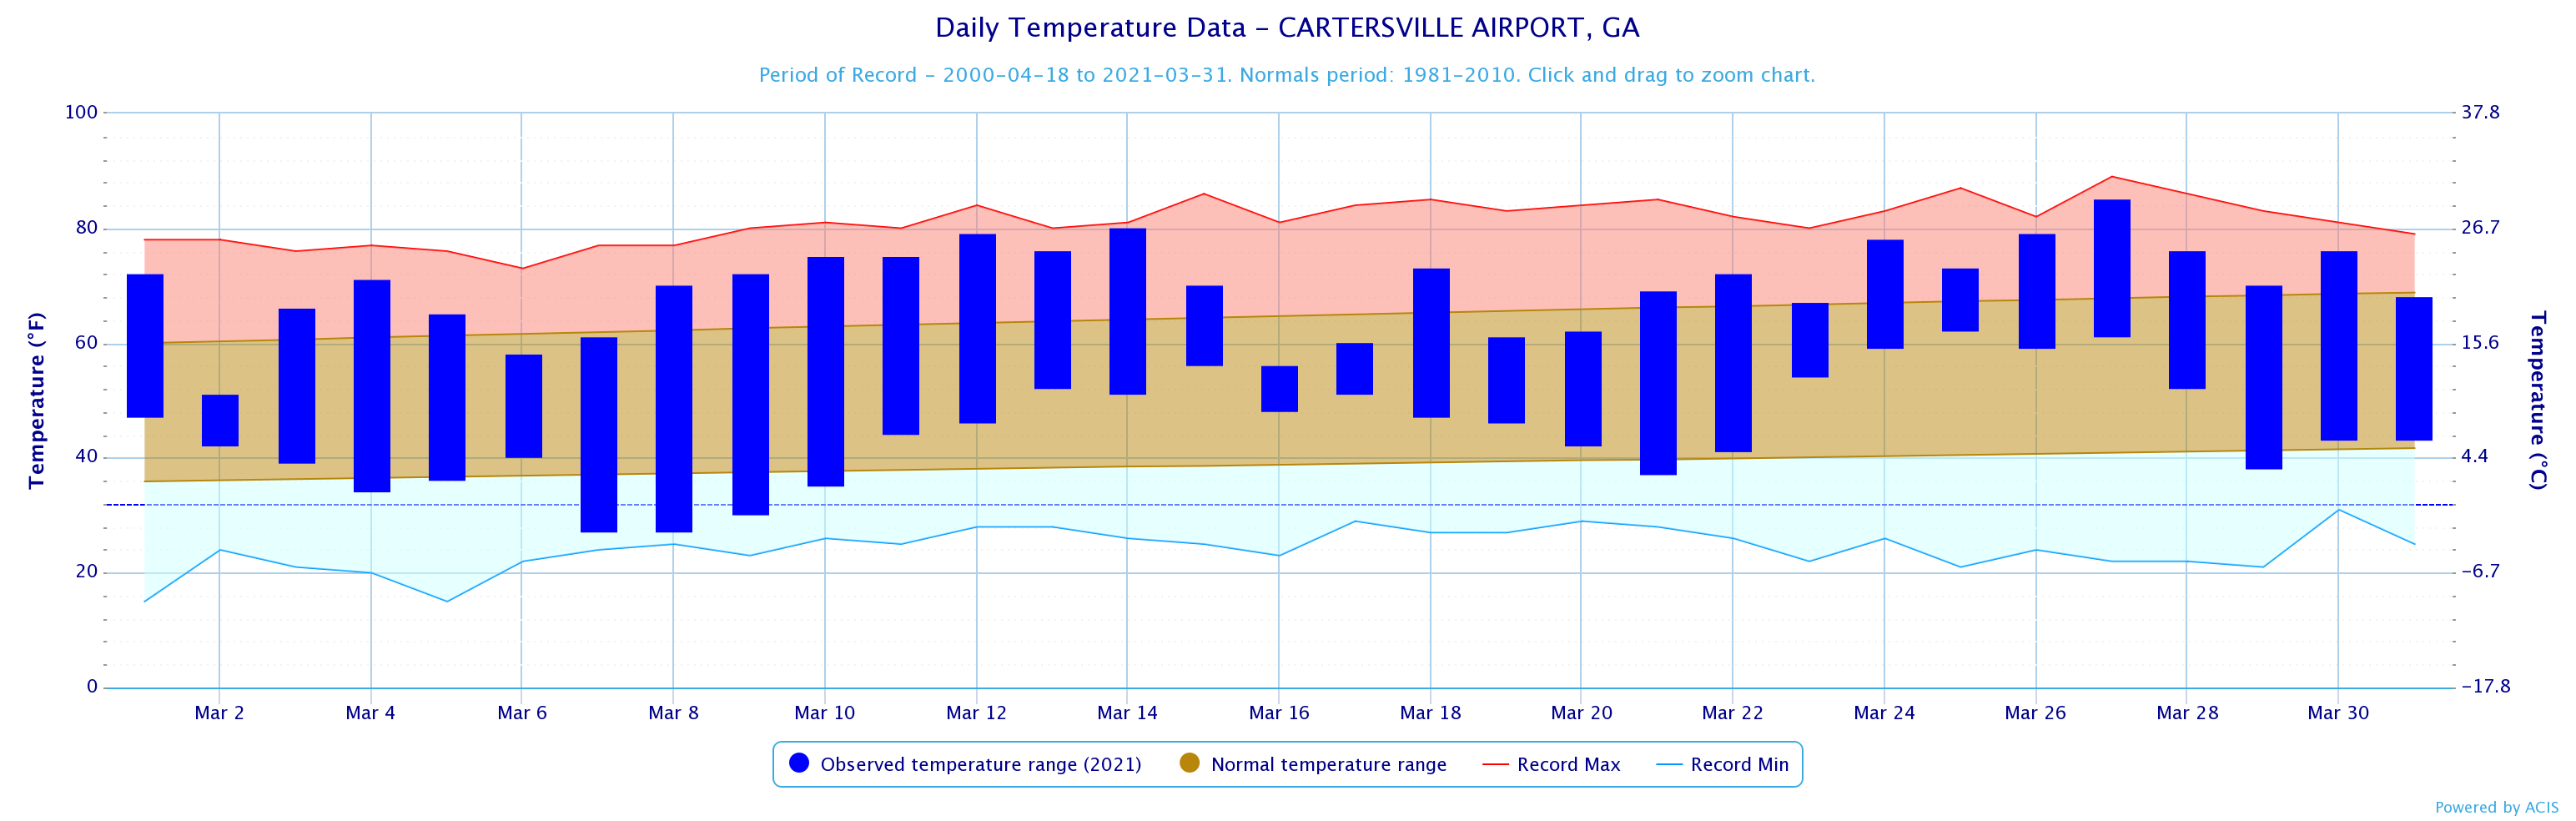
Cartersville
85
3/27
27
3/7
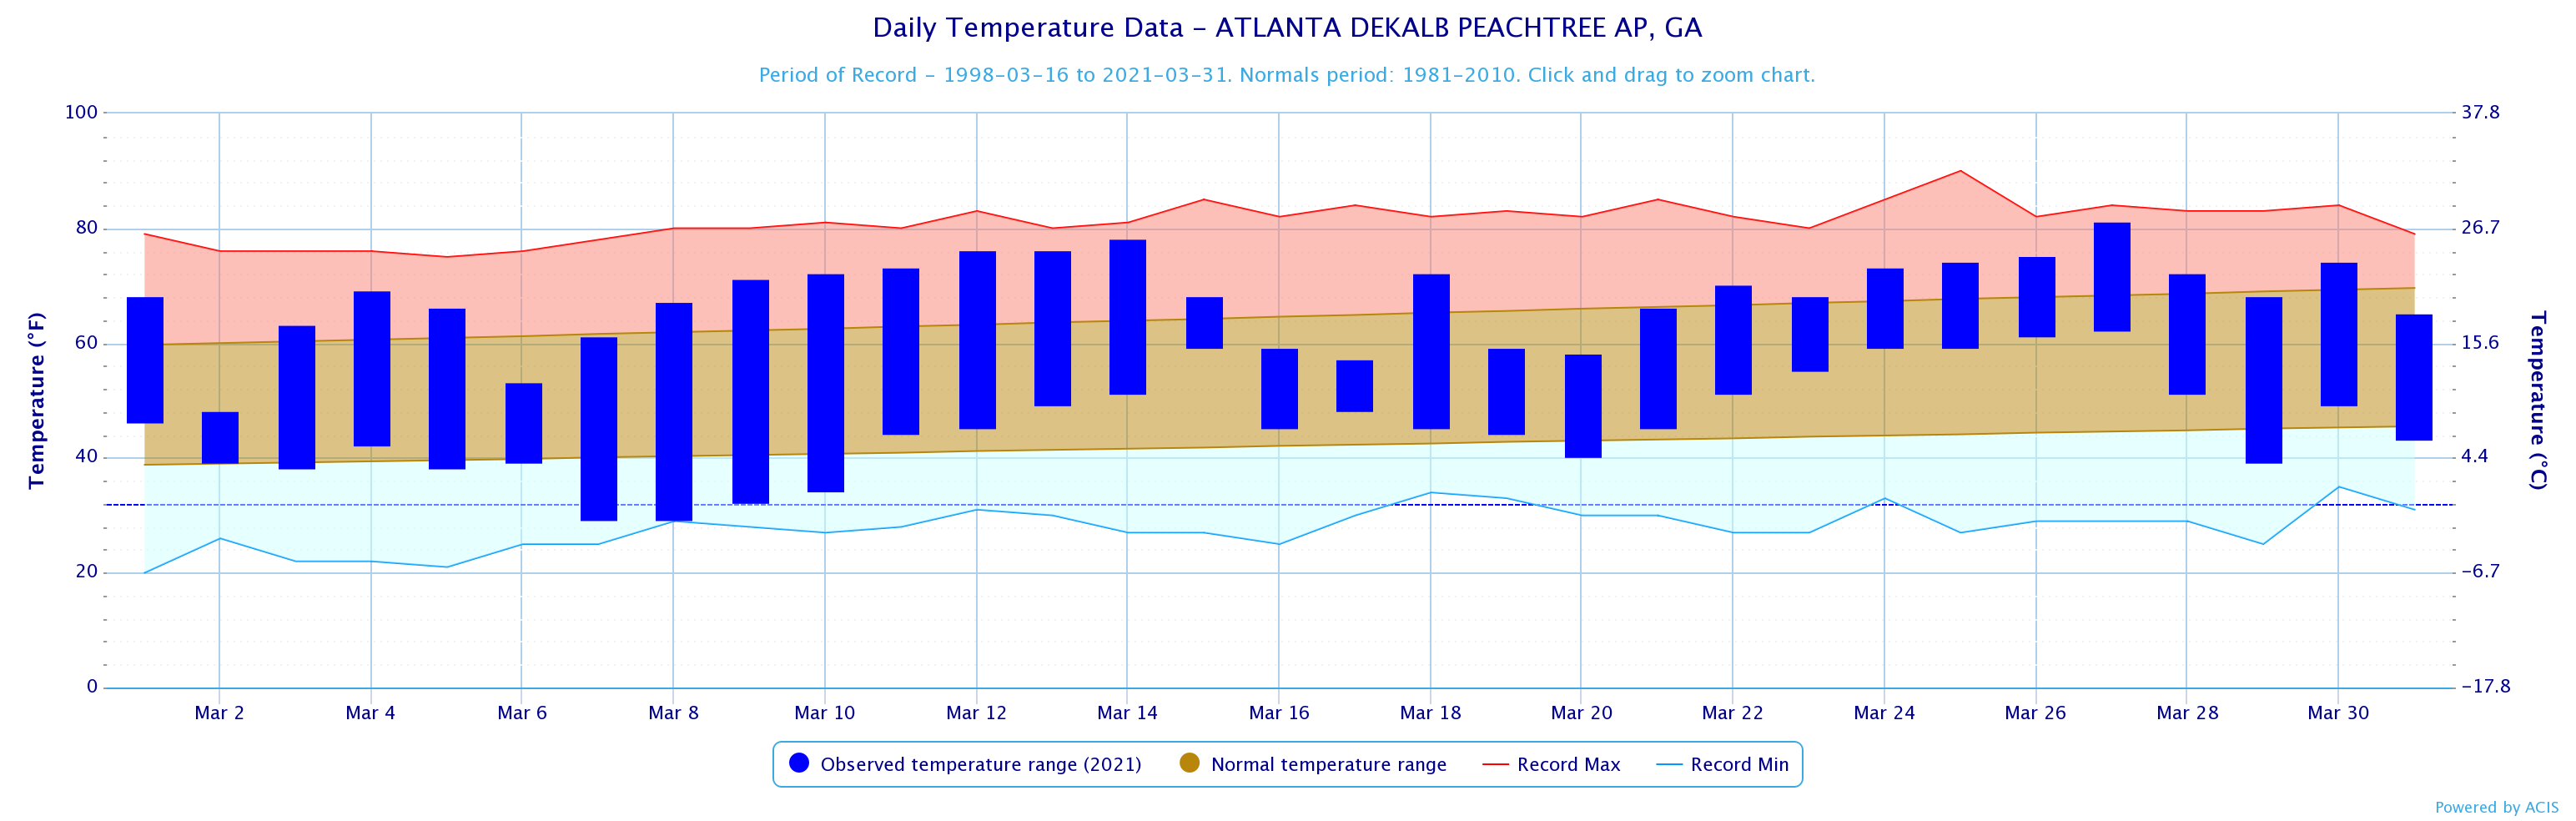
Dekalb Peachtree Arpt
81
3/27
29
3/7
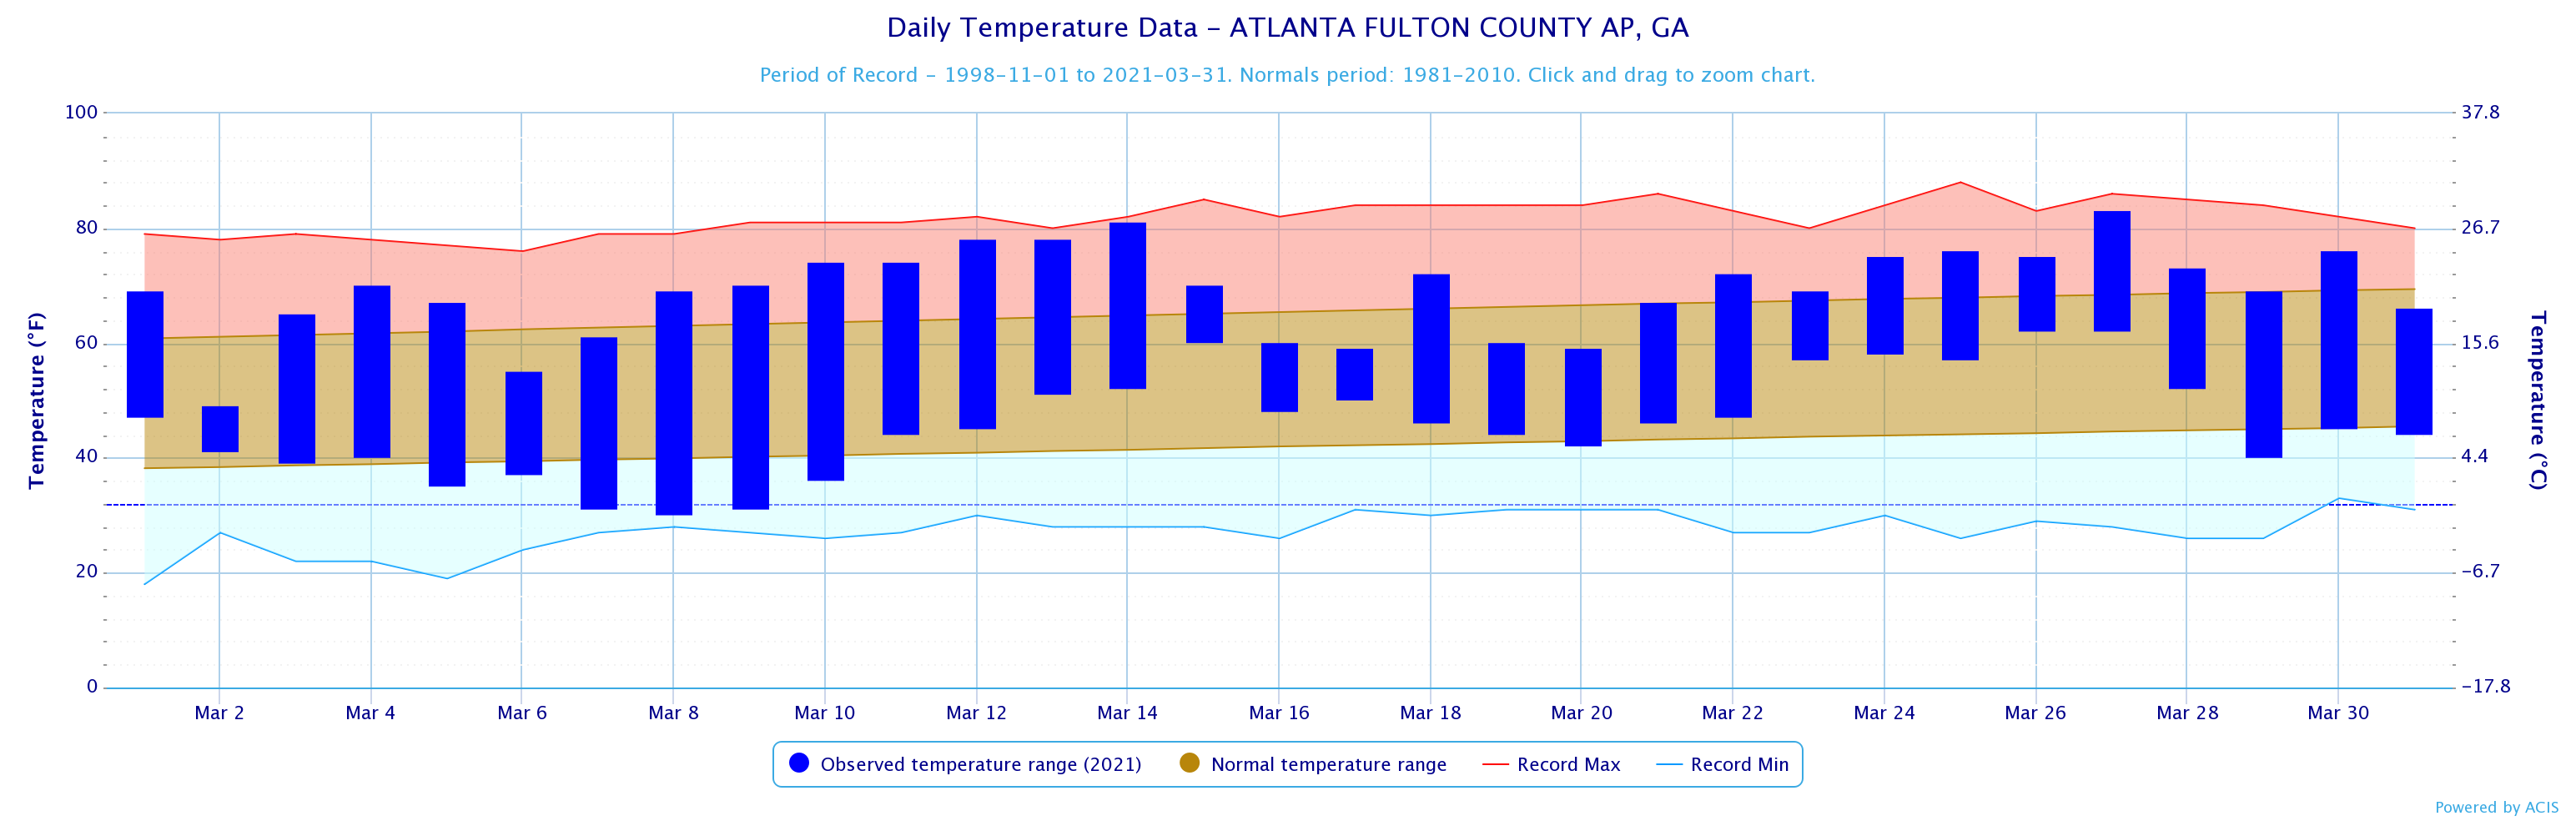
Fulton Co Arpt
83
3/27
30
3/8
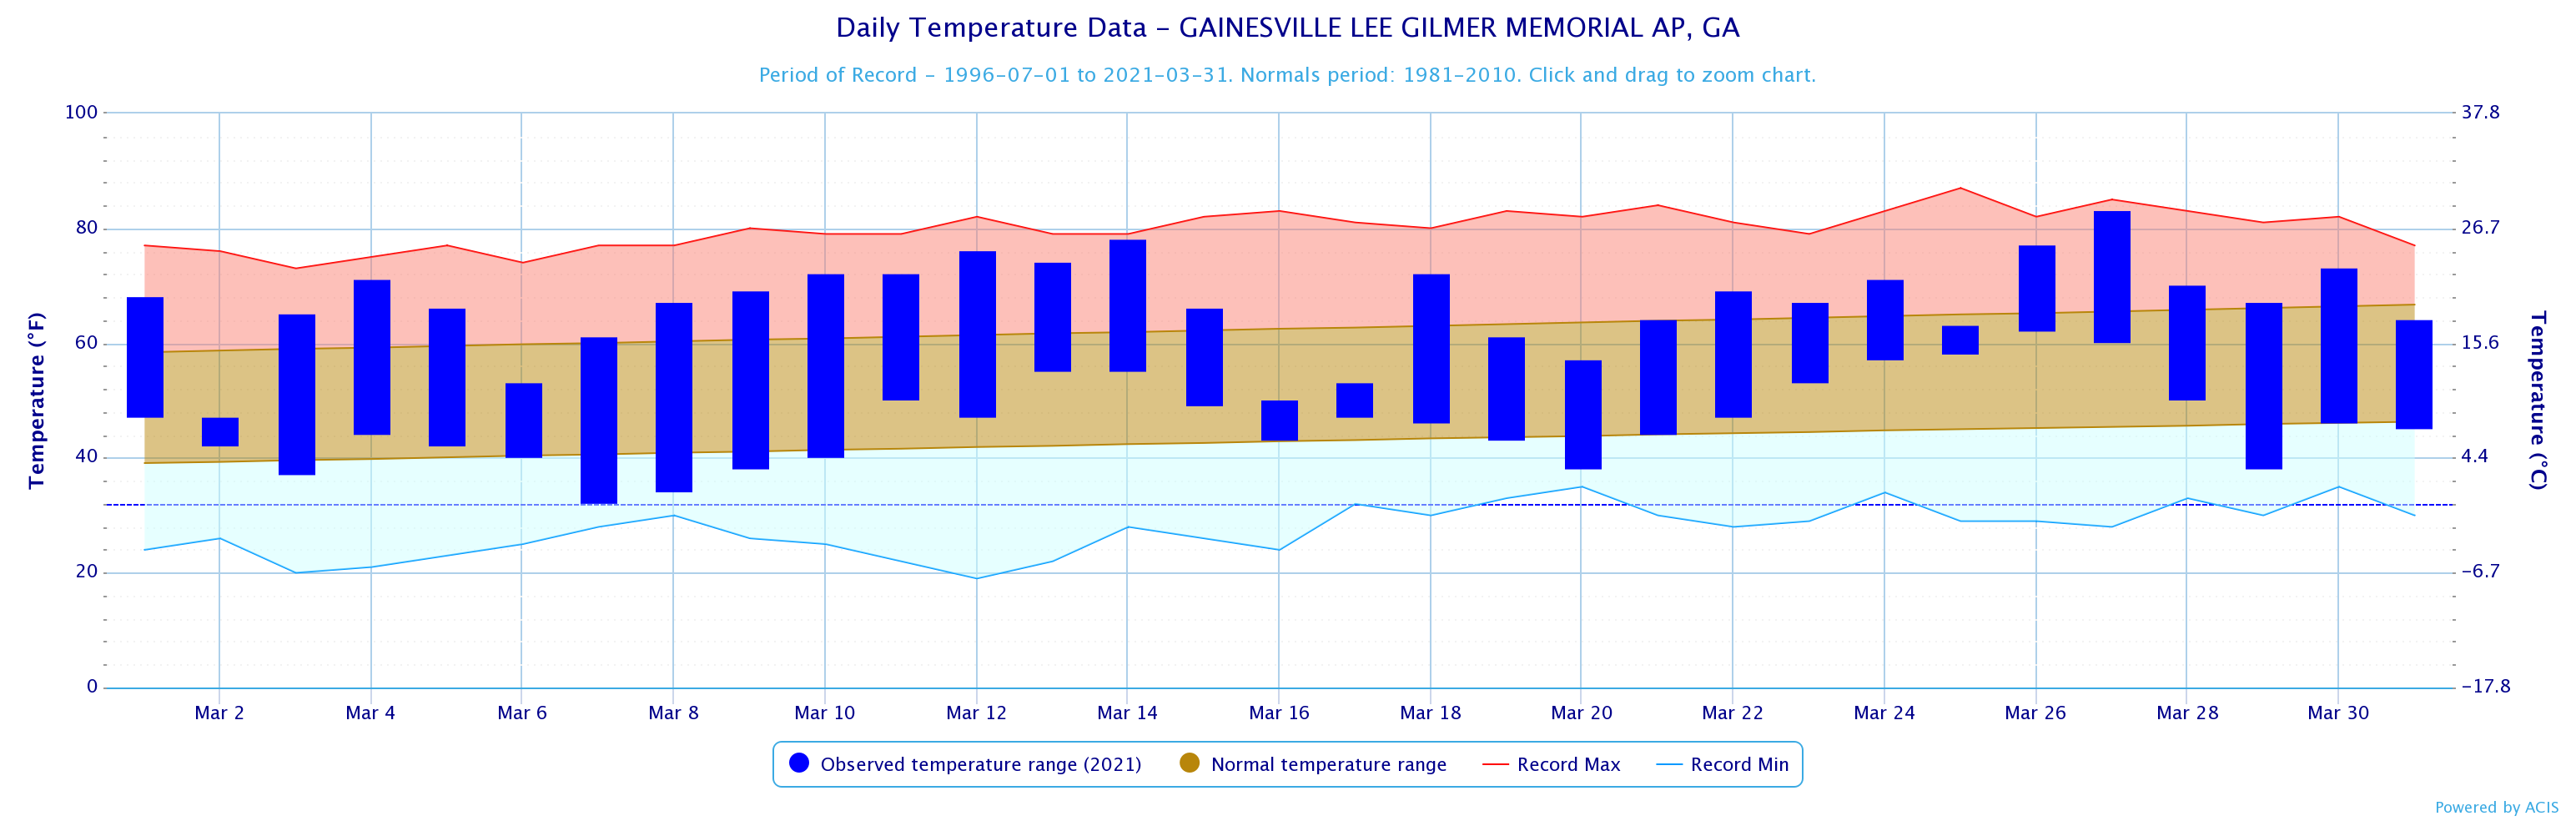
Gainesville
83
3/27
32
3/7
Peachtree City
84
3/27
28
3/8
Rome
86
3/27
28
3/7
March 2021 Precipitation Climate Statistics
Climate Site
Total Precipitation
Normal Precipitation
DFN (Departure
From Normal)
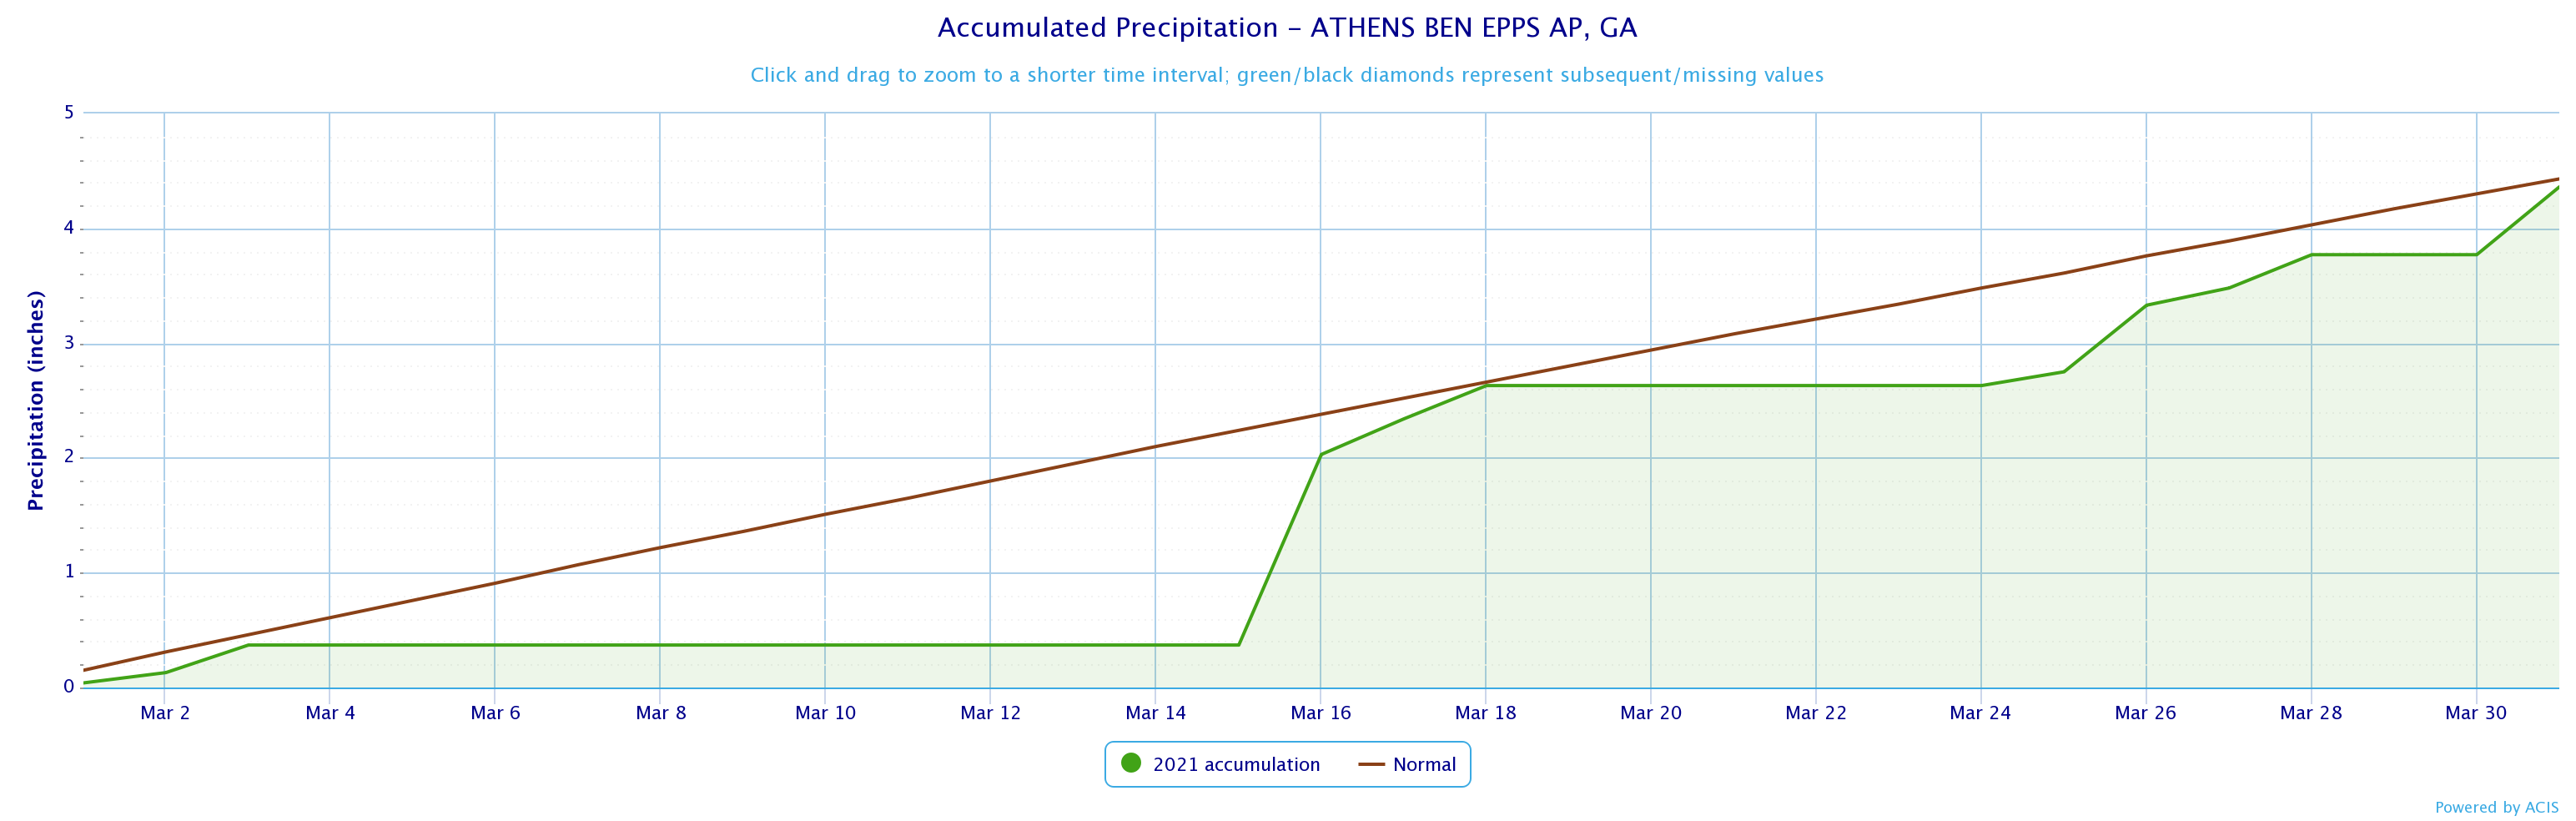
4.36
4.43
-0.07
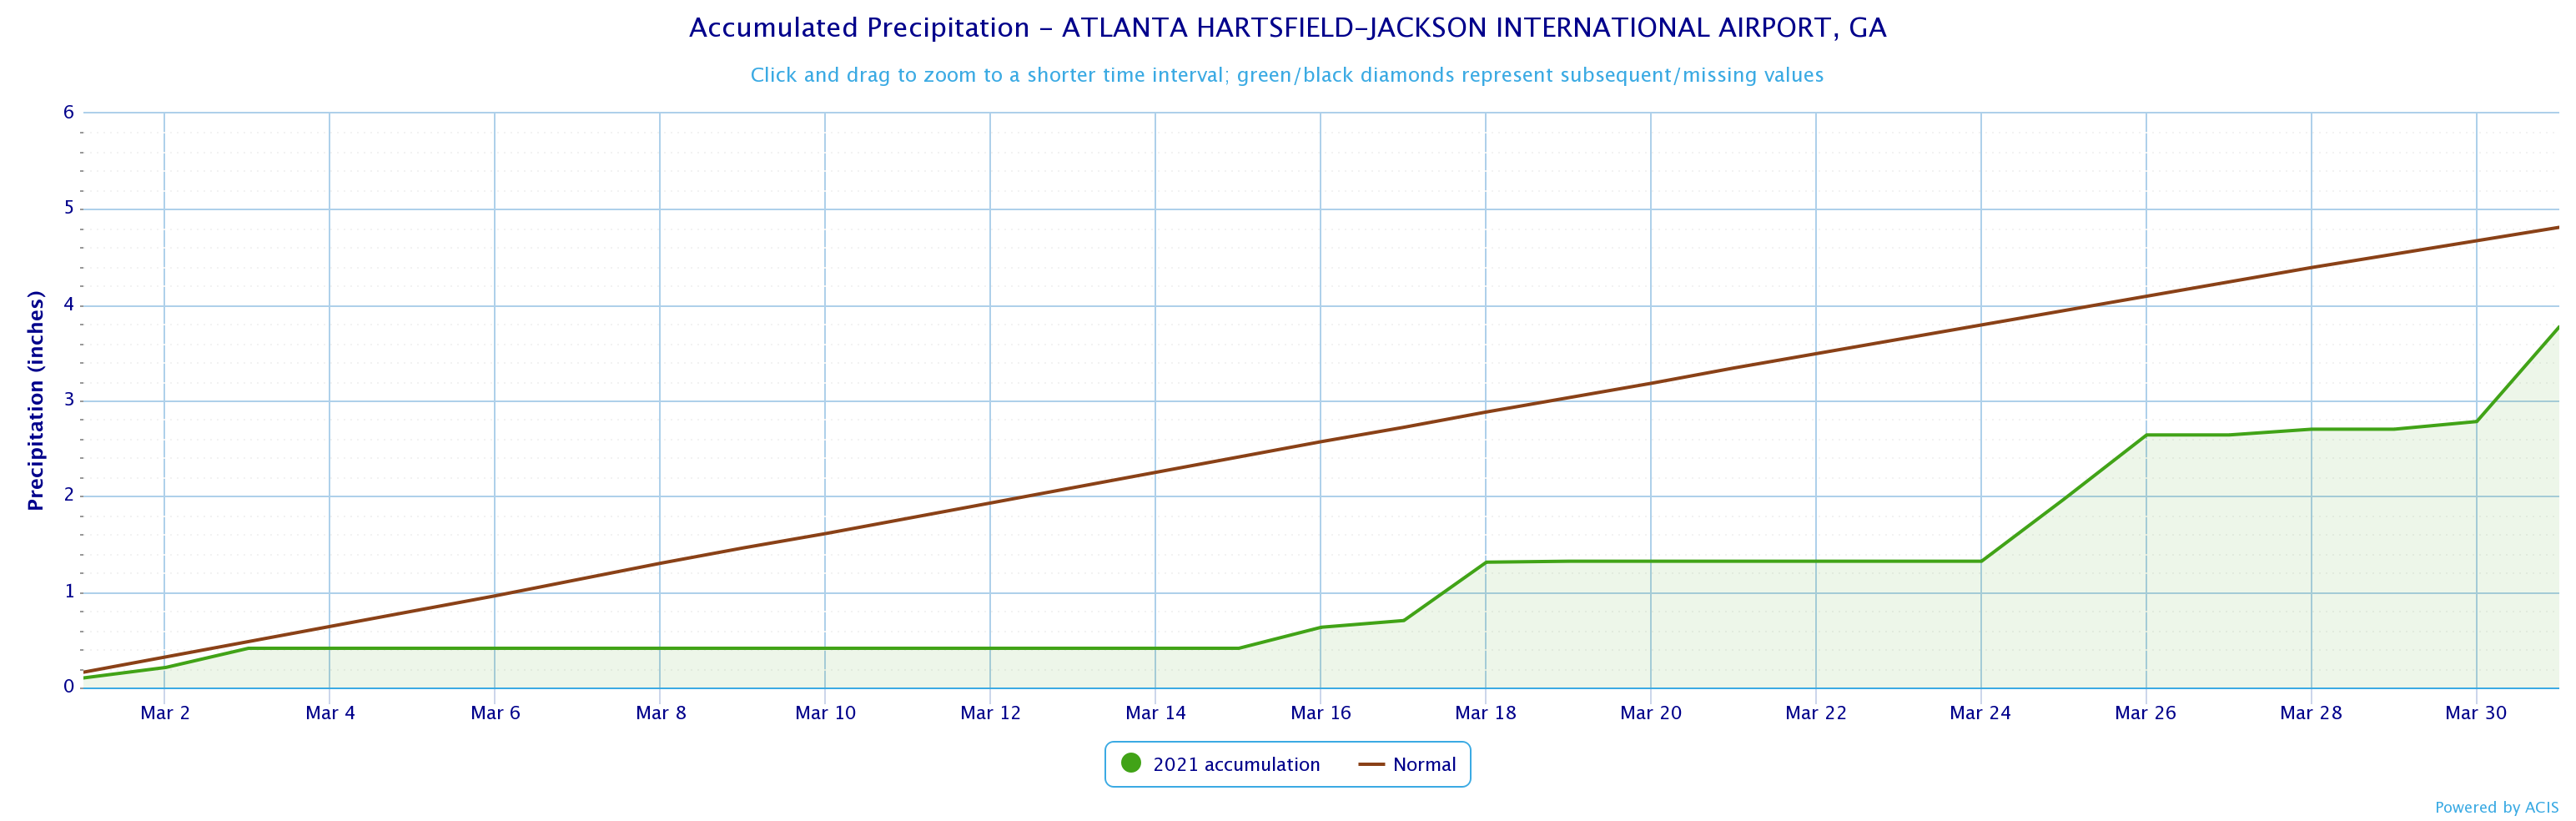
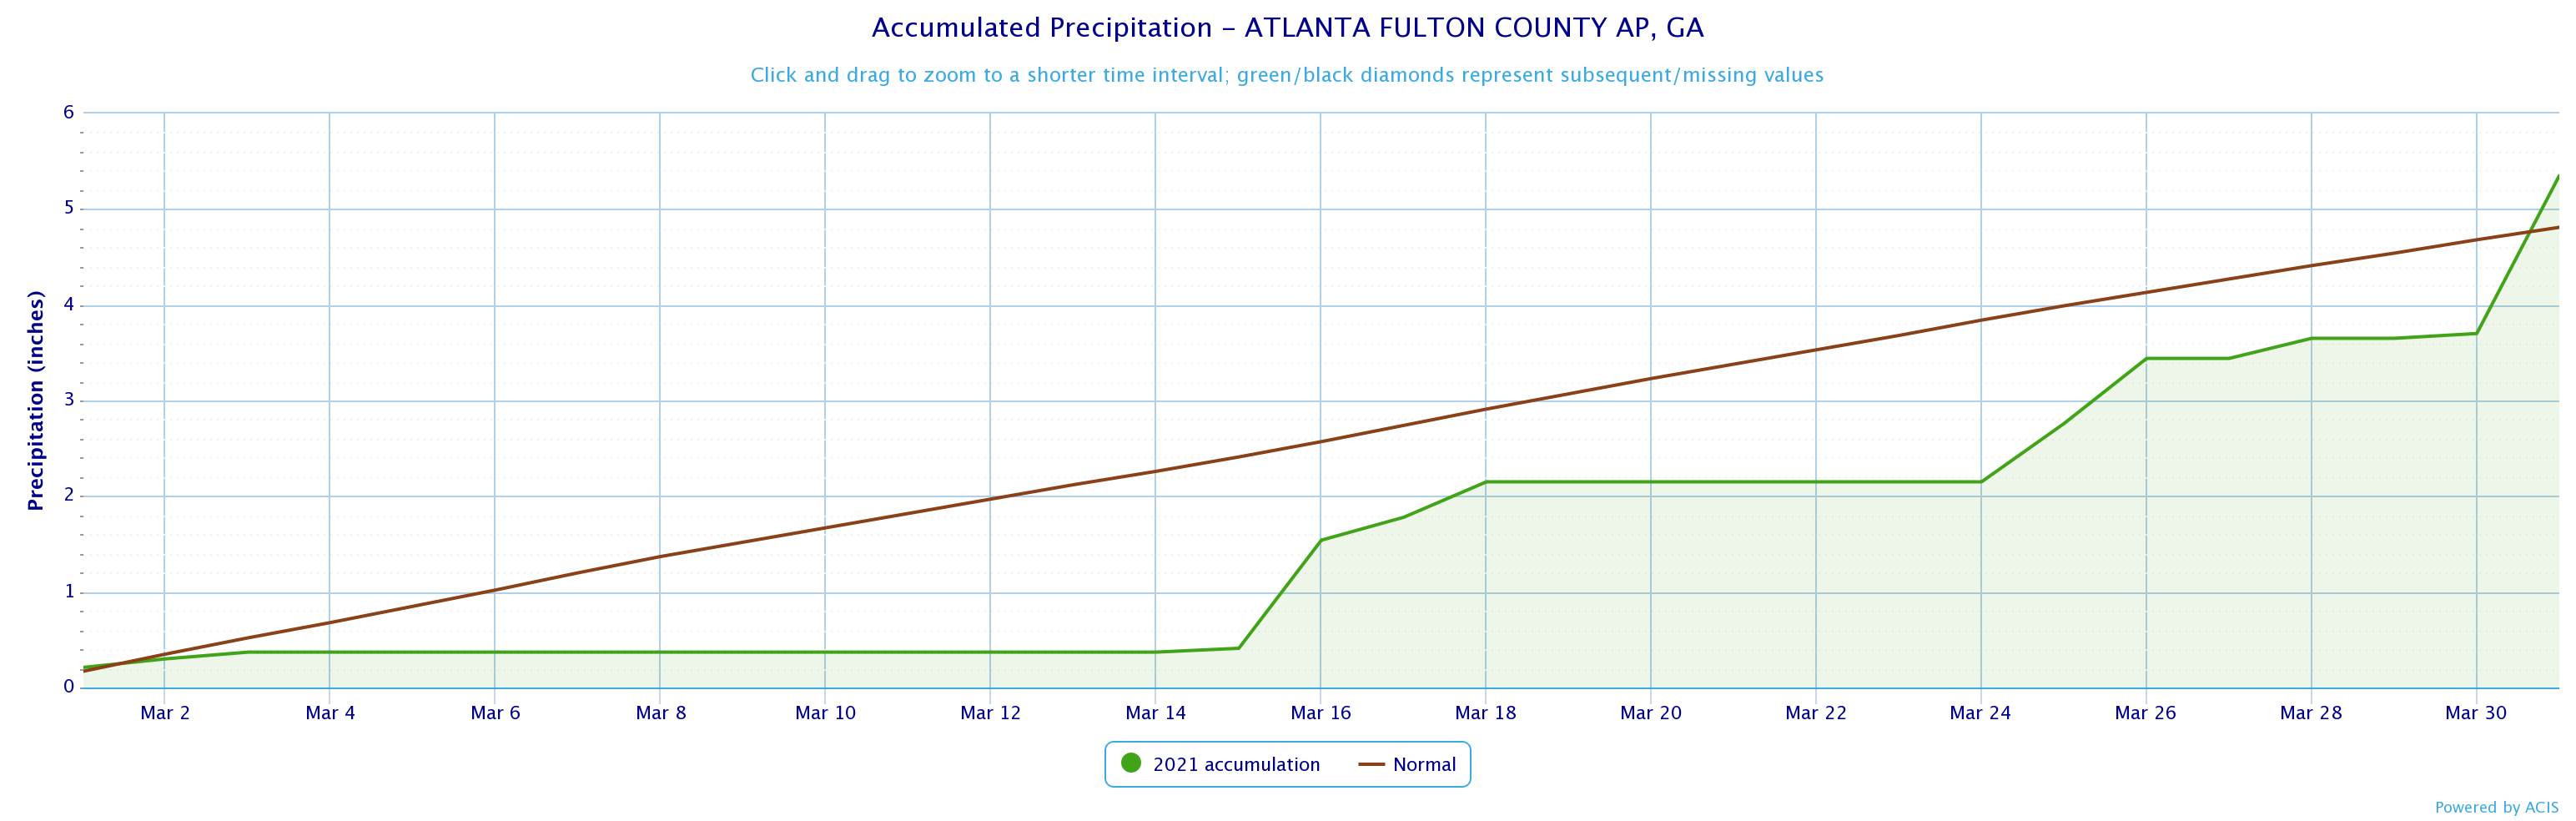
3.77
4.81
-1.04
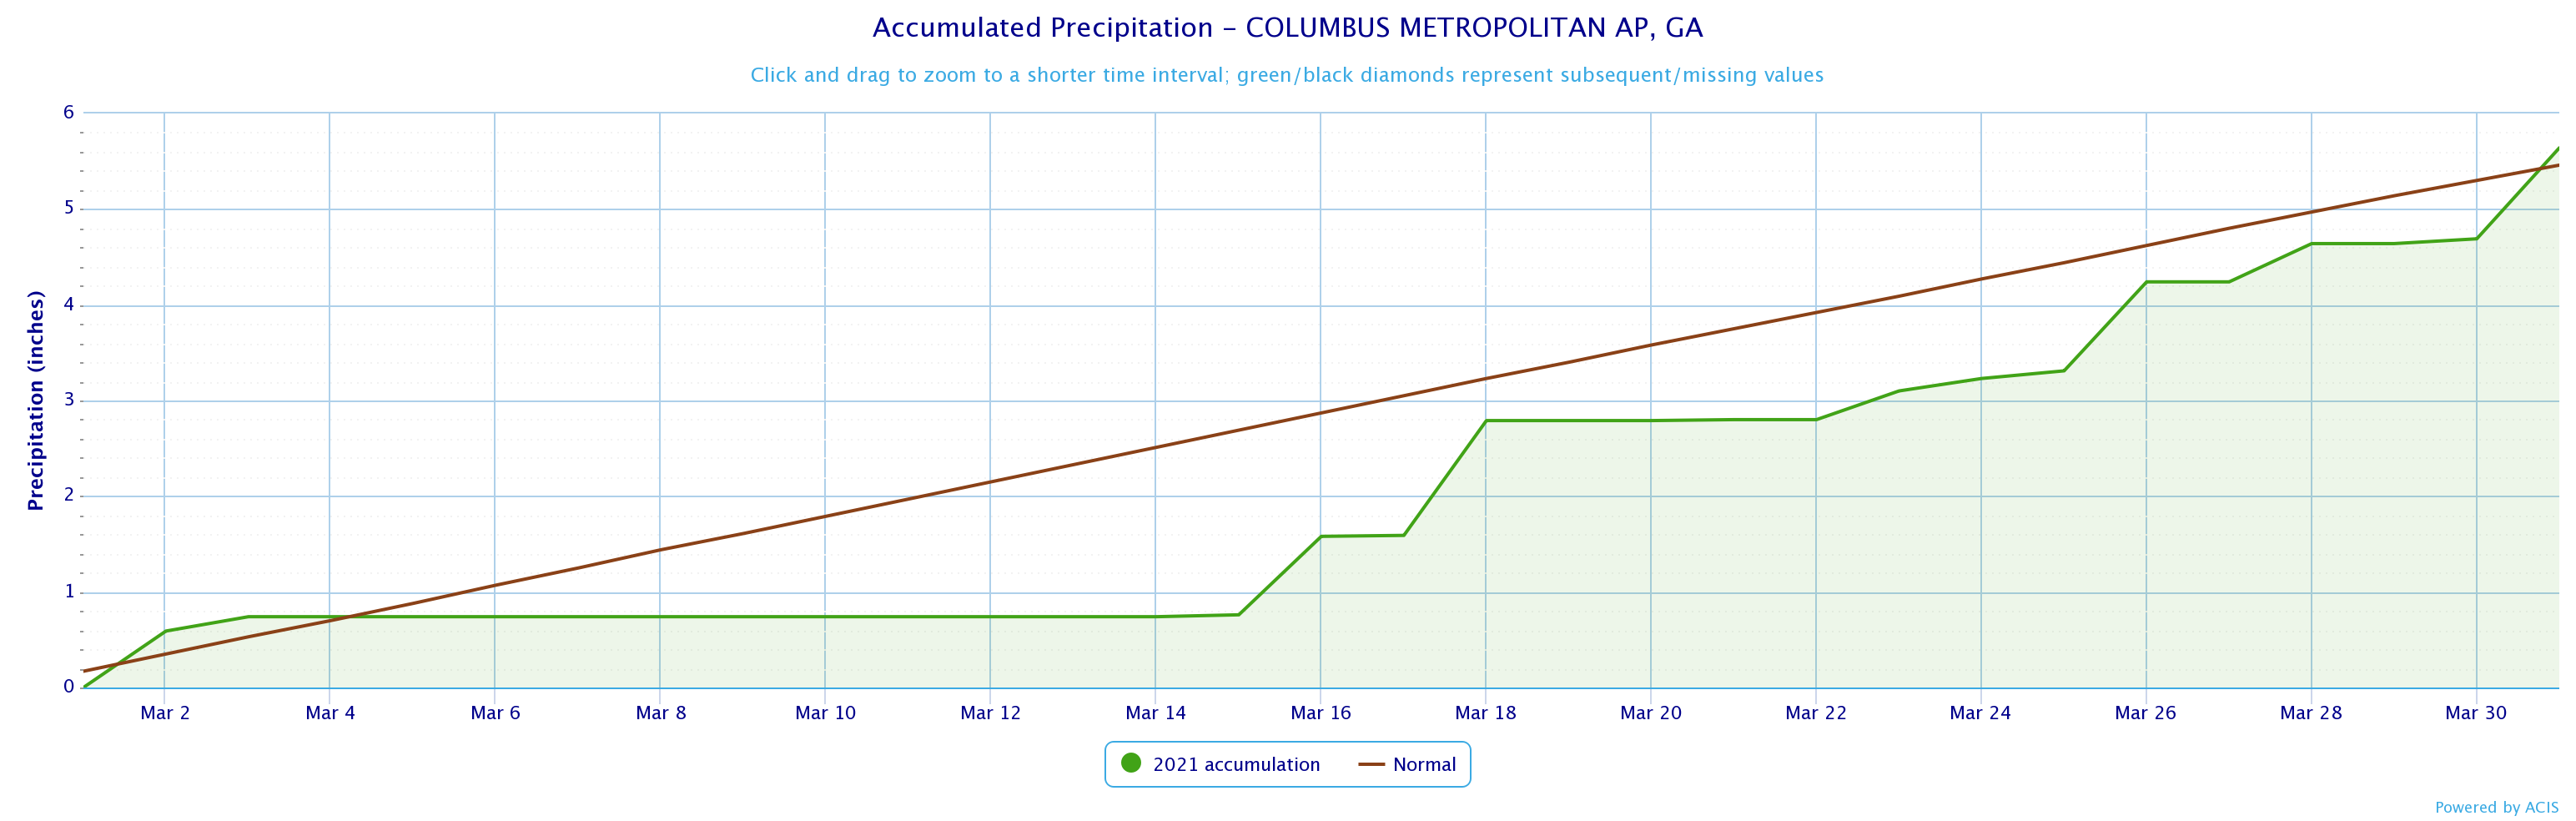
5.46
5.64
-0.18
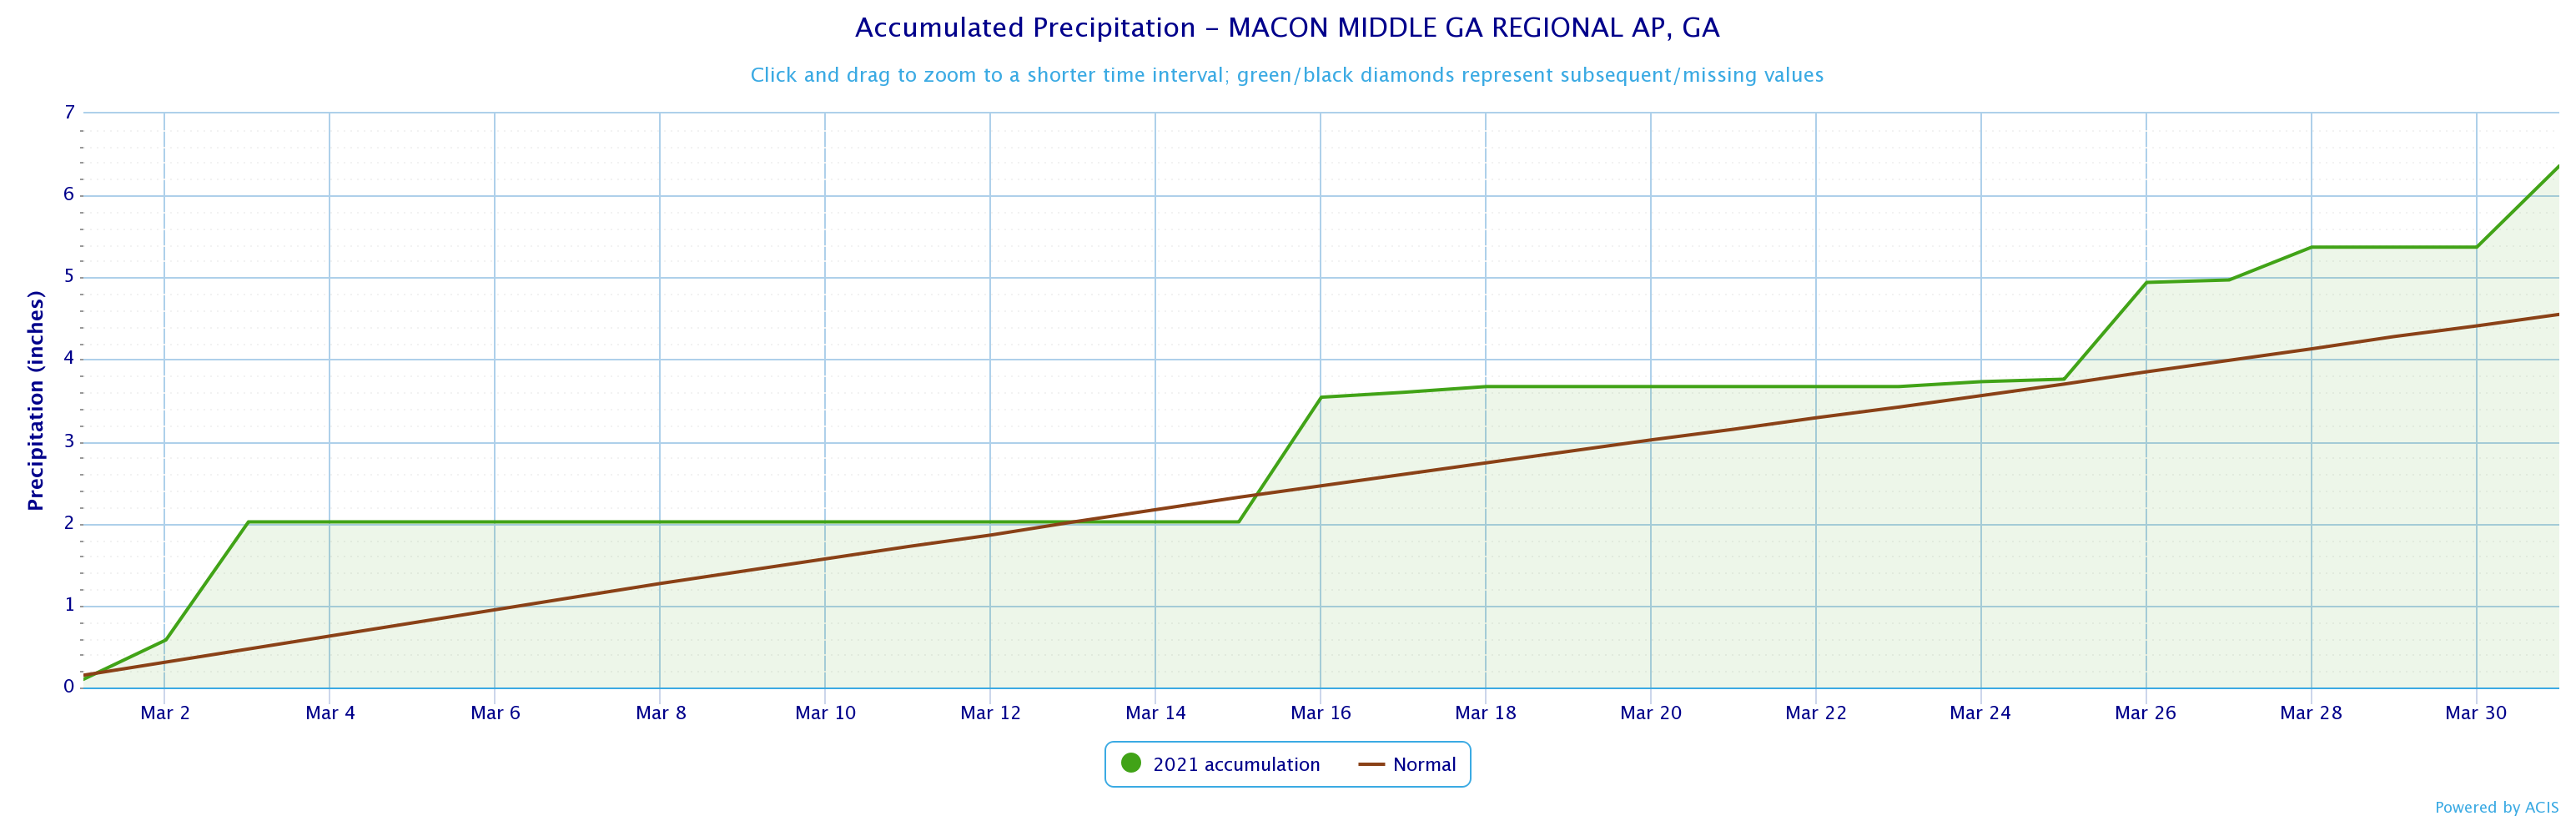
6.36
5.46
+0.90
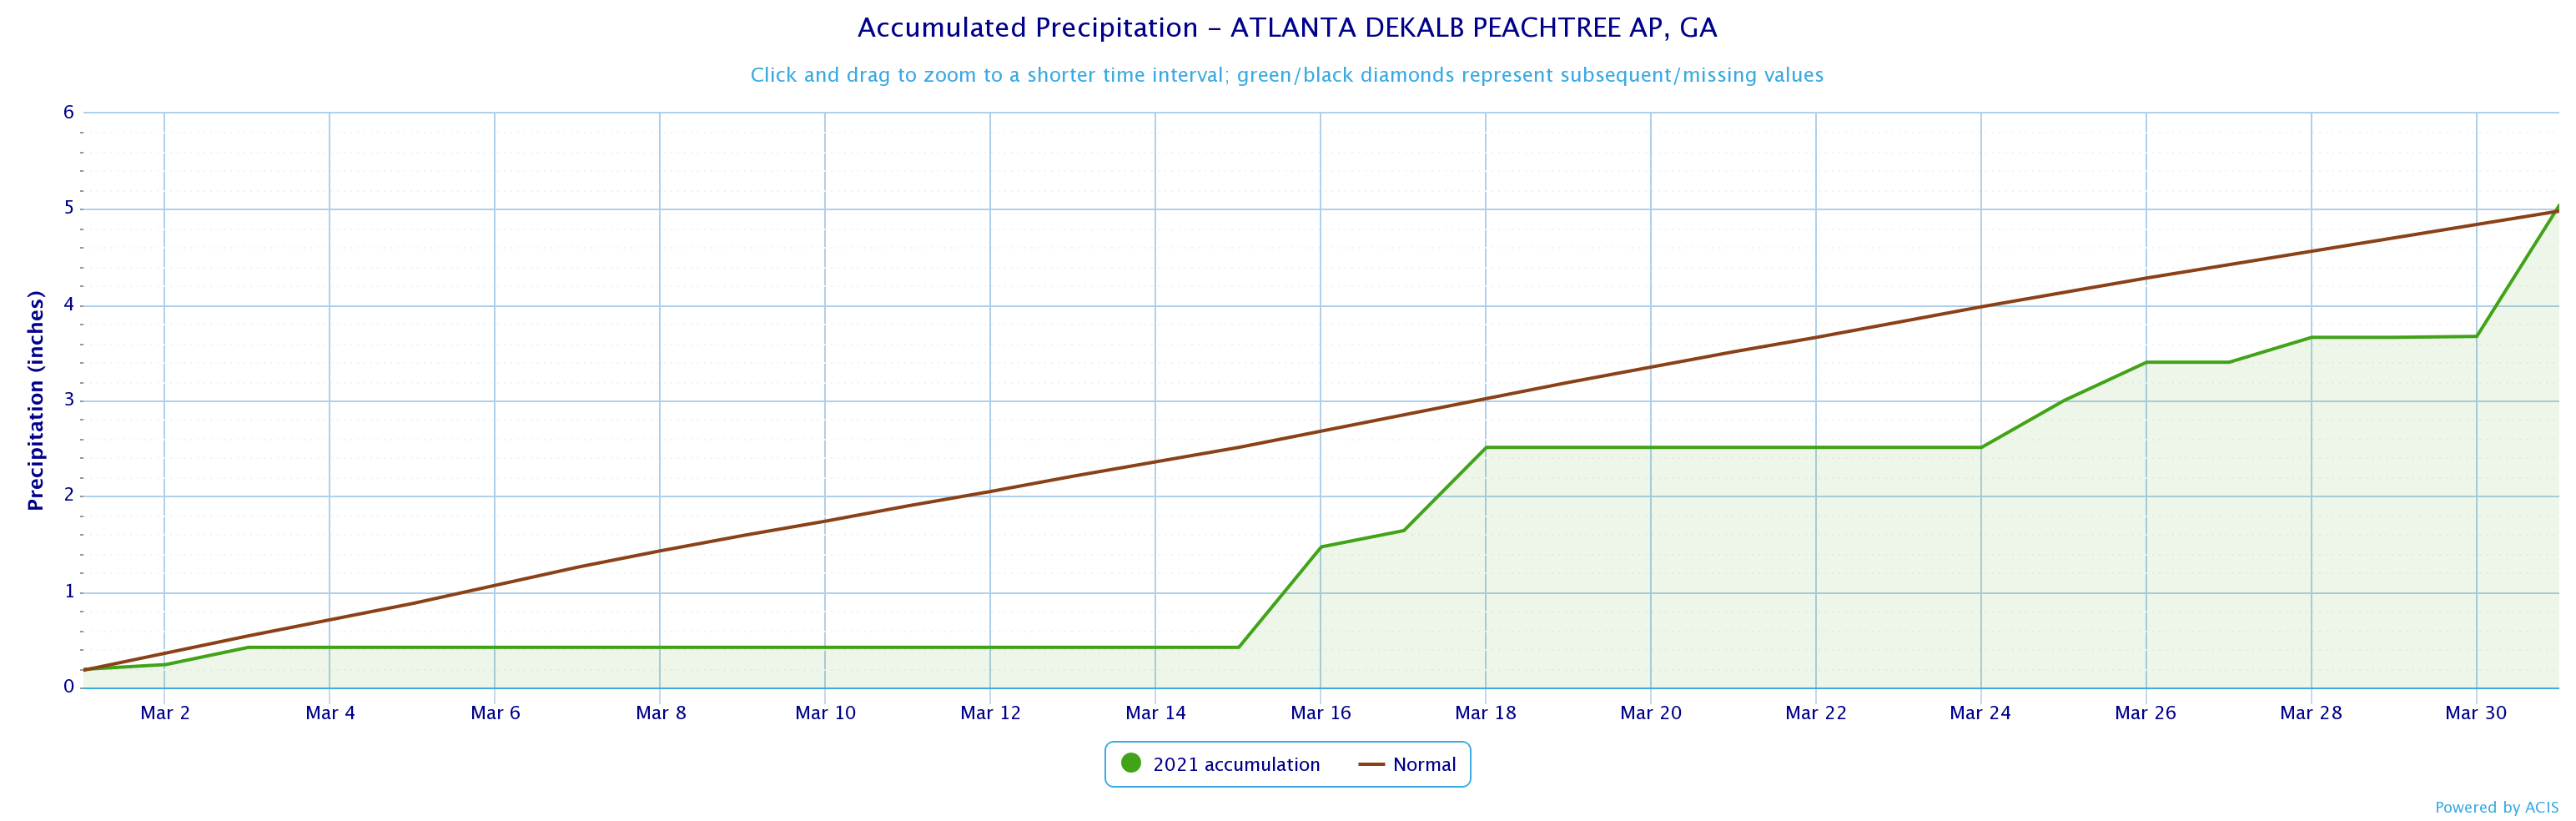
5.19
4.72
+0.47
5.04
4.72
+0.32
5.35
4.81
+0.54
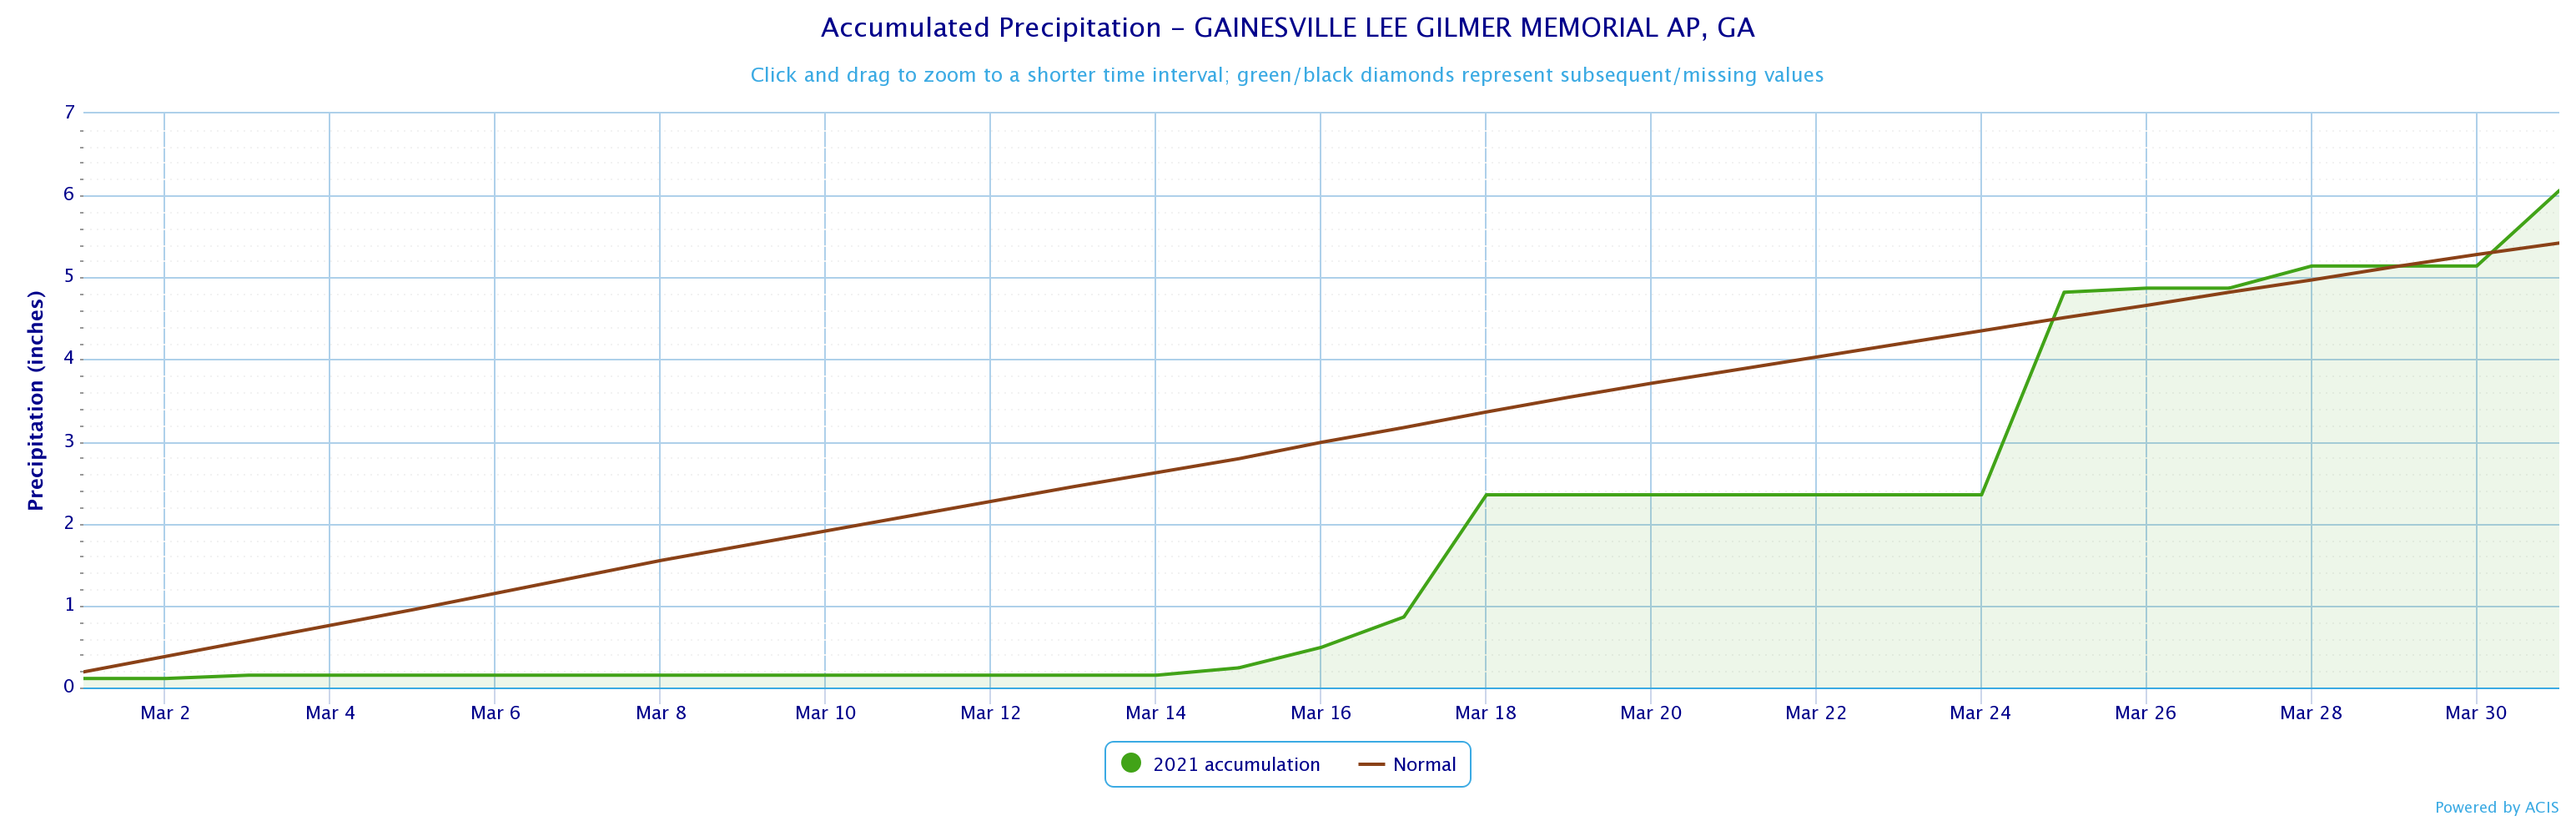
6.06
5.42
+0.64
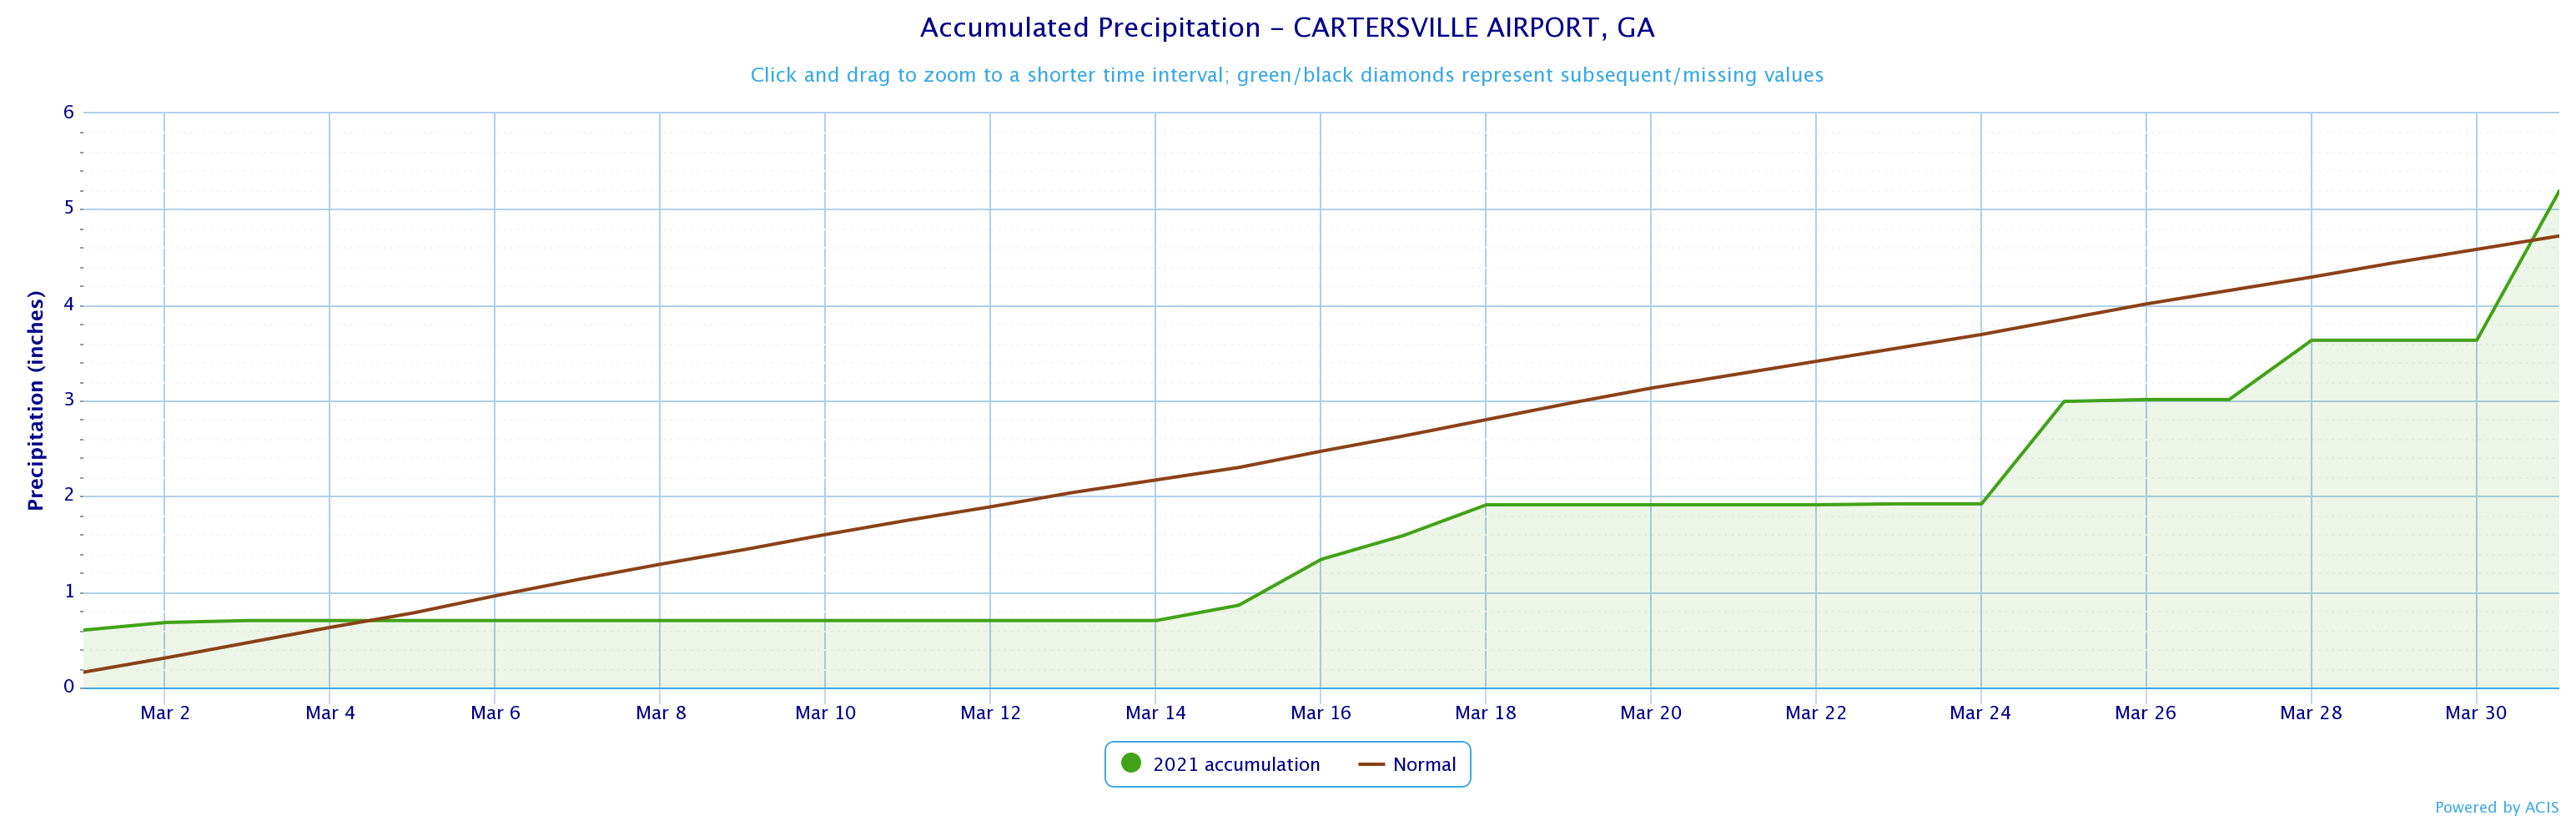
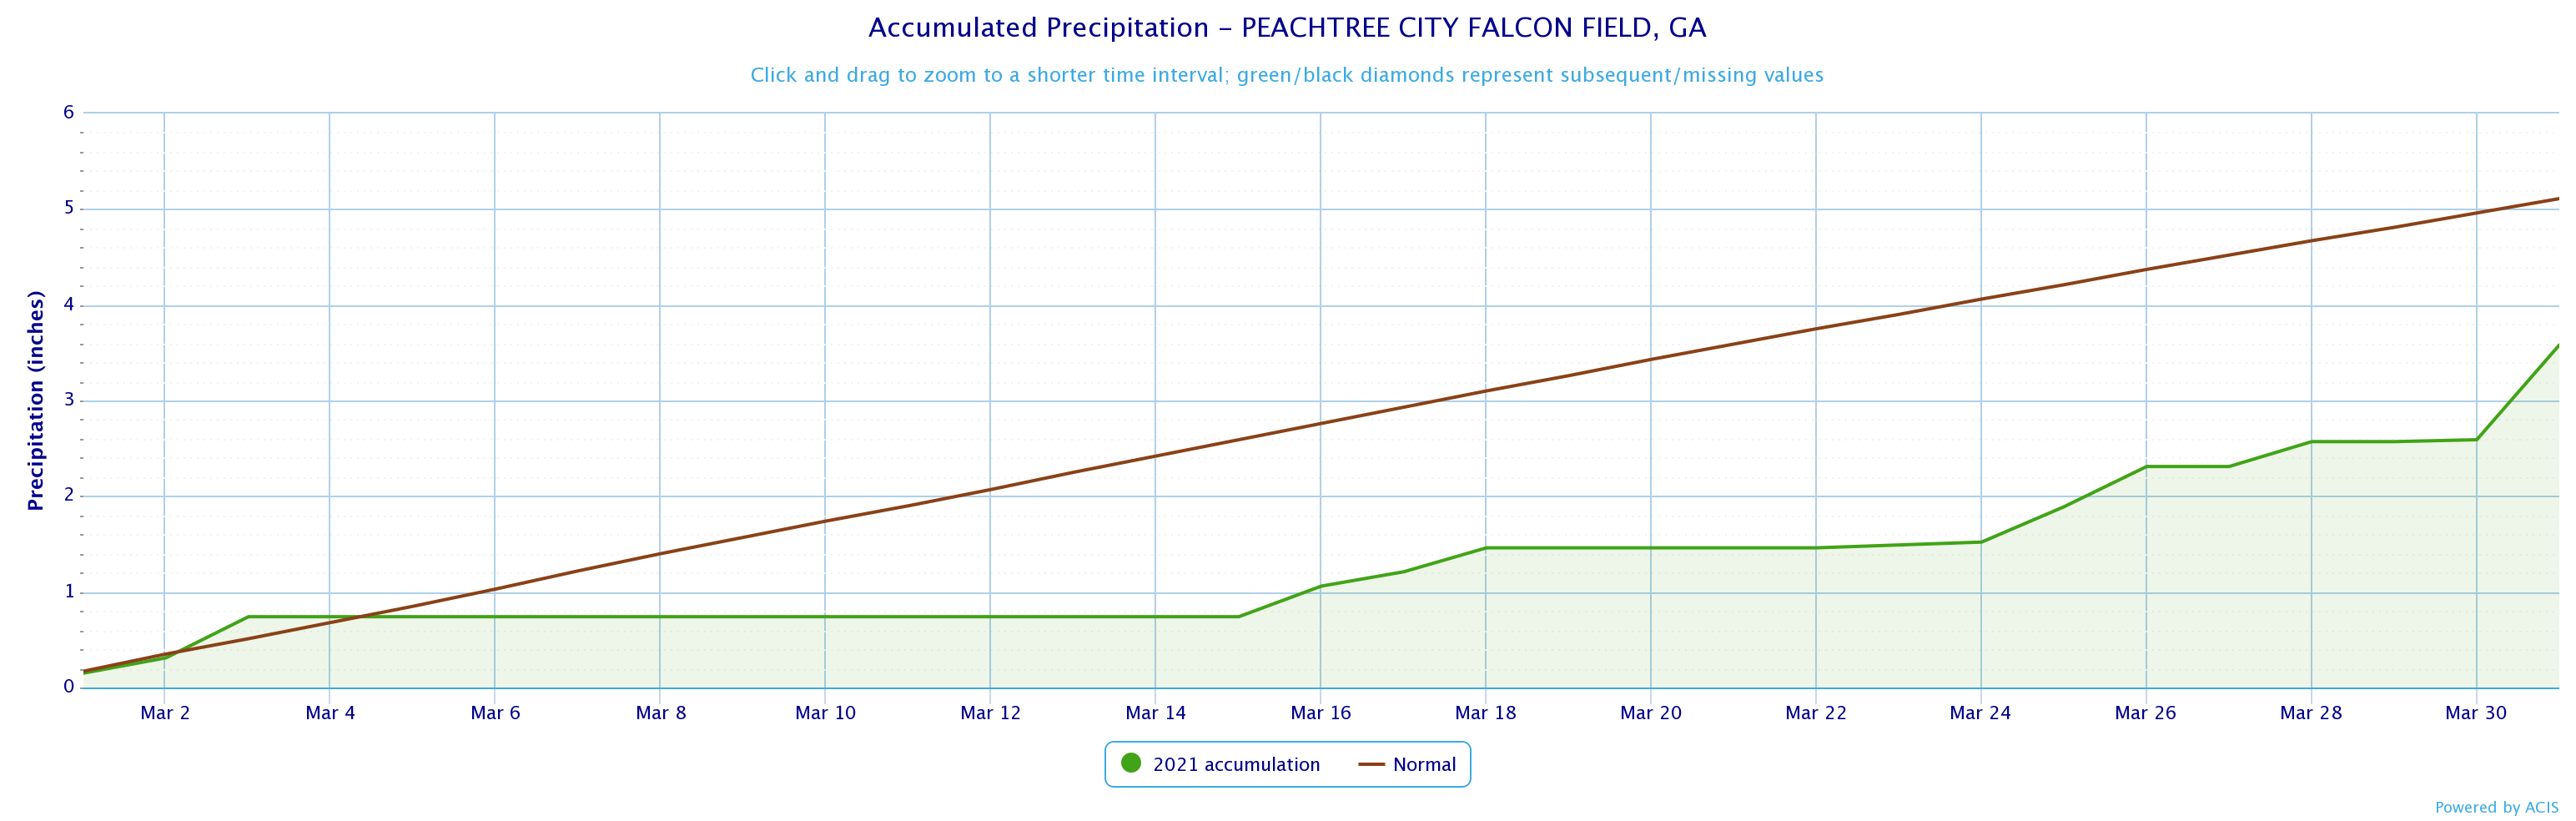
3.58
5.42
-1.84
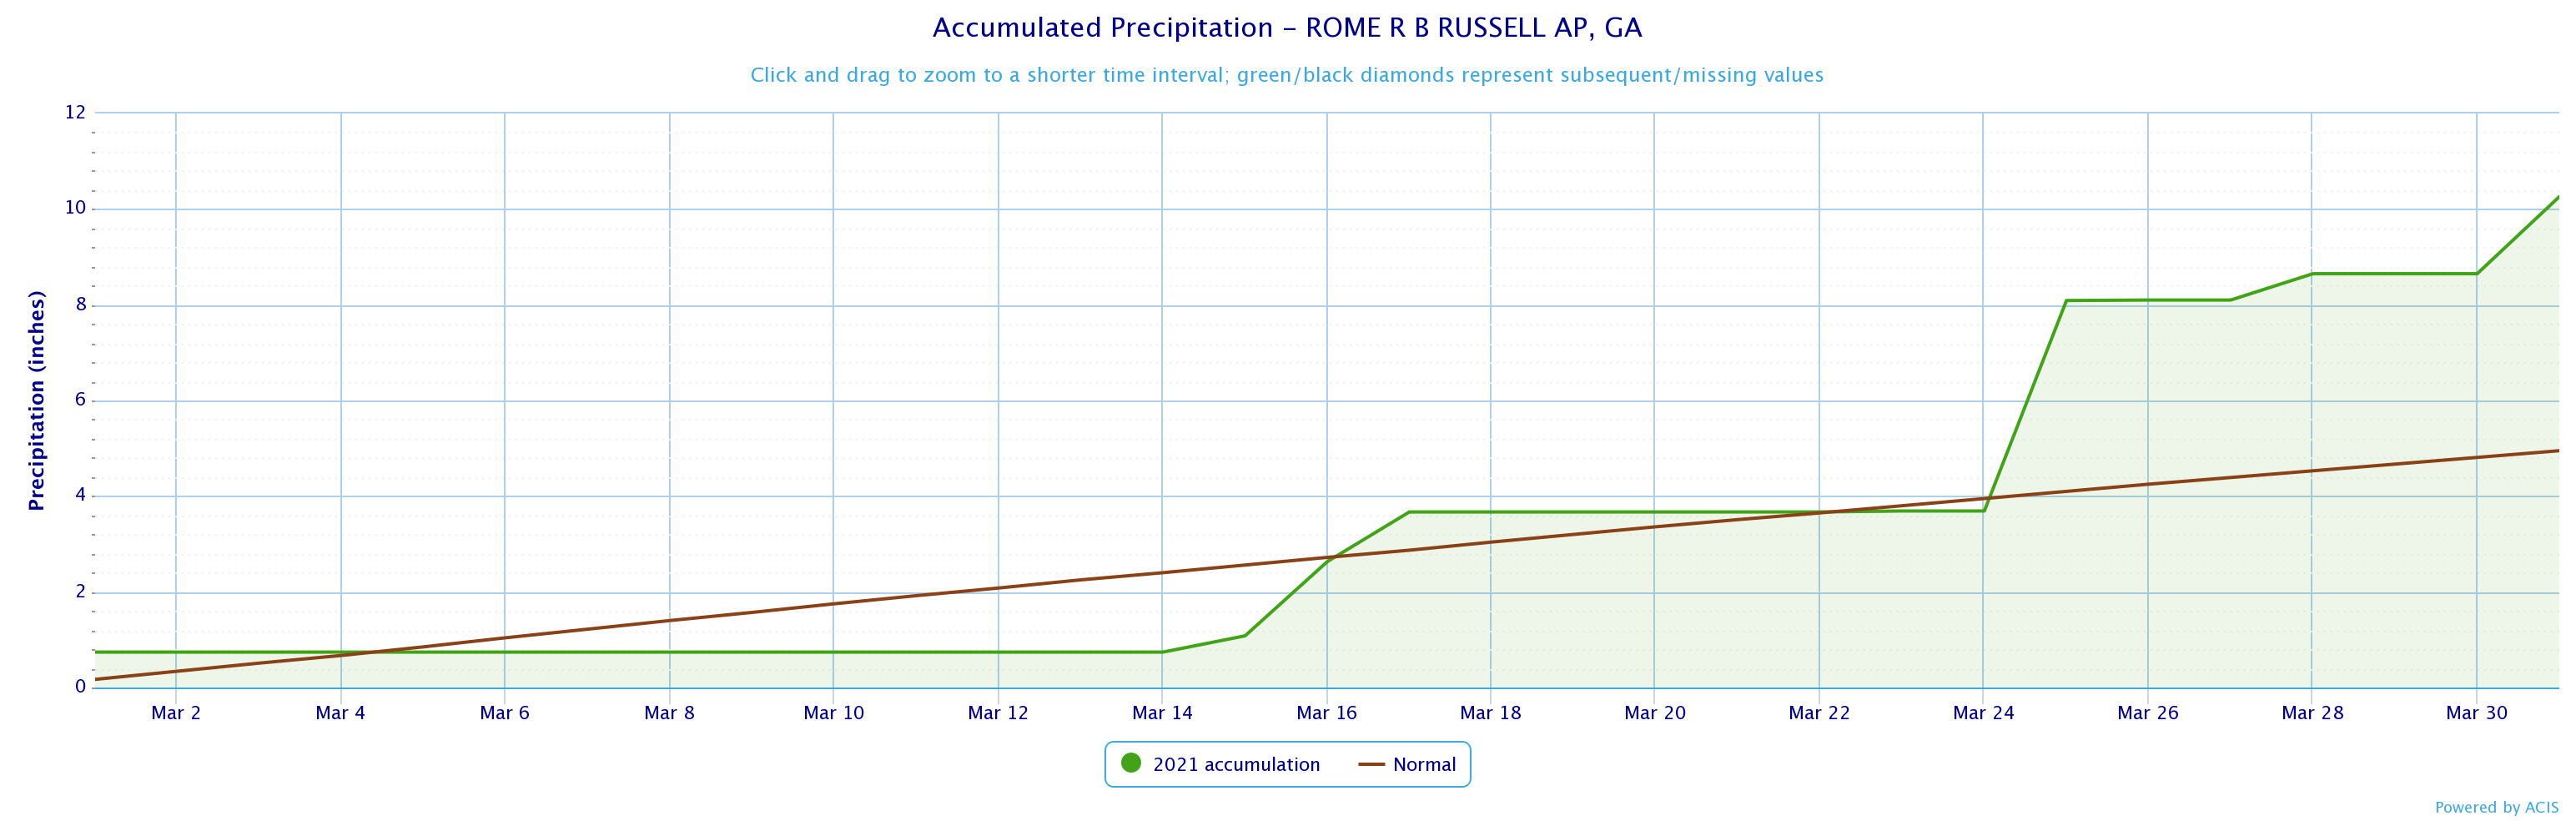
10.26
5.42
+4.84
March 2021 Precipitation Climate Statistics
Climate Site
Maximum Daily Precip
Max P Date
Athens
1.66
3/16
Atlanta
0.99
3/31
Columbus
1.20
3/18
Macon
1.52
3/16
Cartersville
1.56 *
3/31
Dekalb Peachtree Arpt
1.37
3/31
Fulton Co Arpt
1.65
3/31
Gainesville
2.47 *
3/25
Peachtree City
0.99
3/31
Rome
4.40
3/25
Click the links below to explore the temperature and precipitation data across north and central Georgia for the month of March 2021.
Temperature Maps
Precipitation Maps
Temperature Graphs
Precipitation Graphs


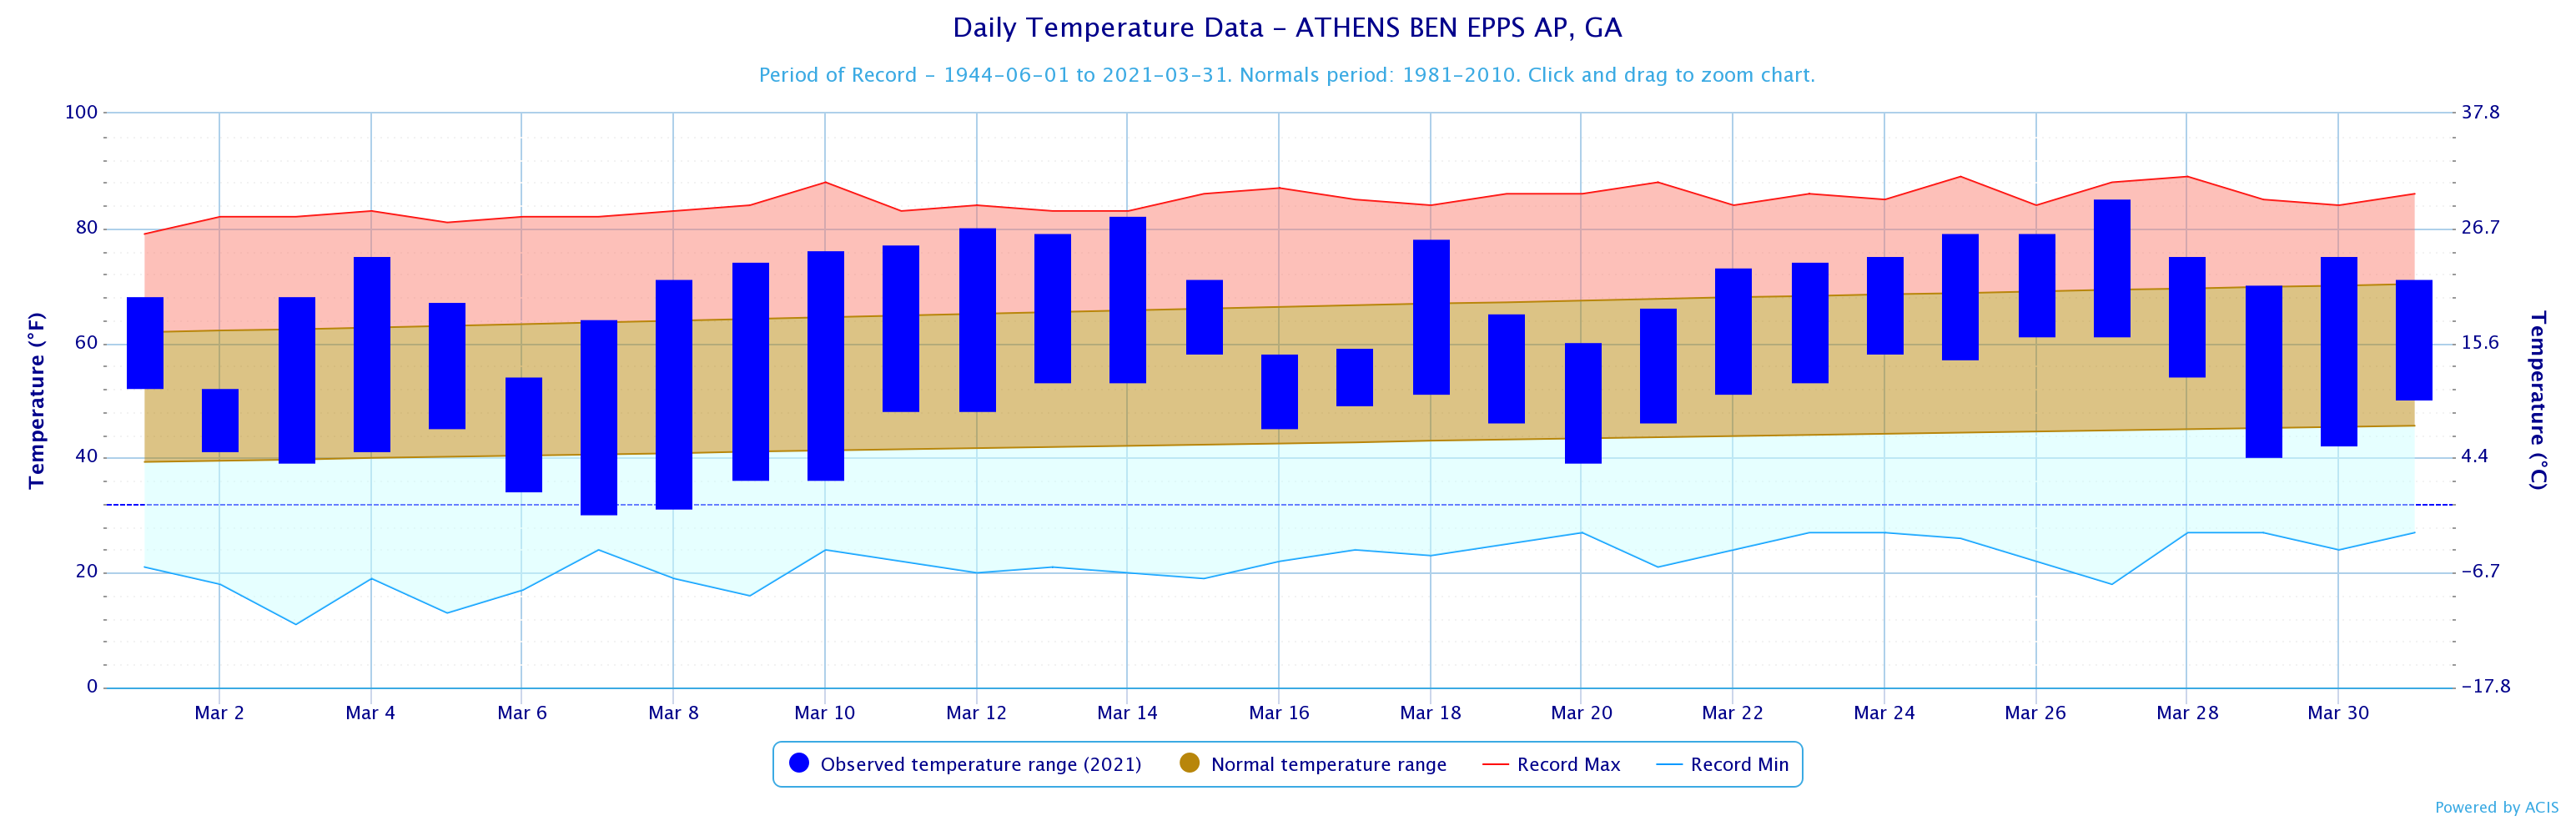
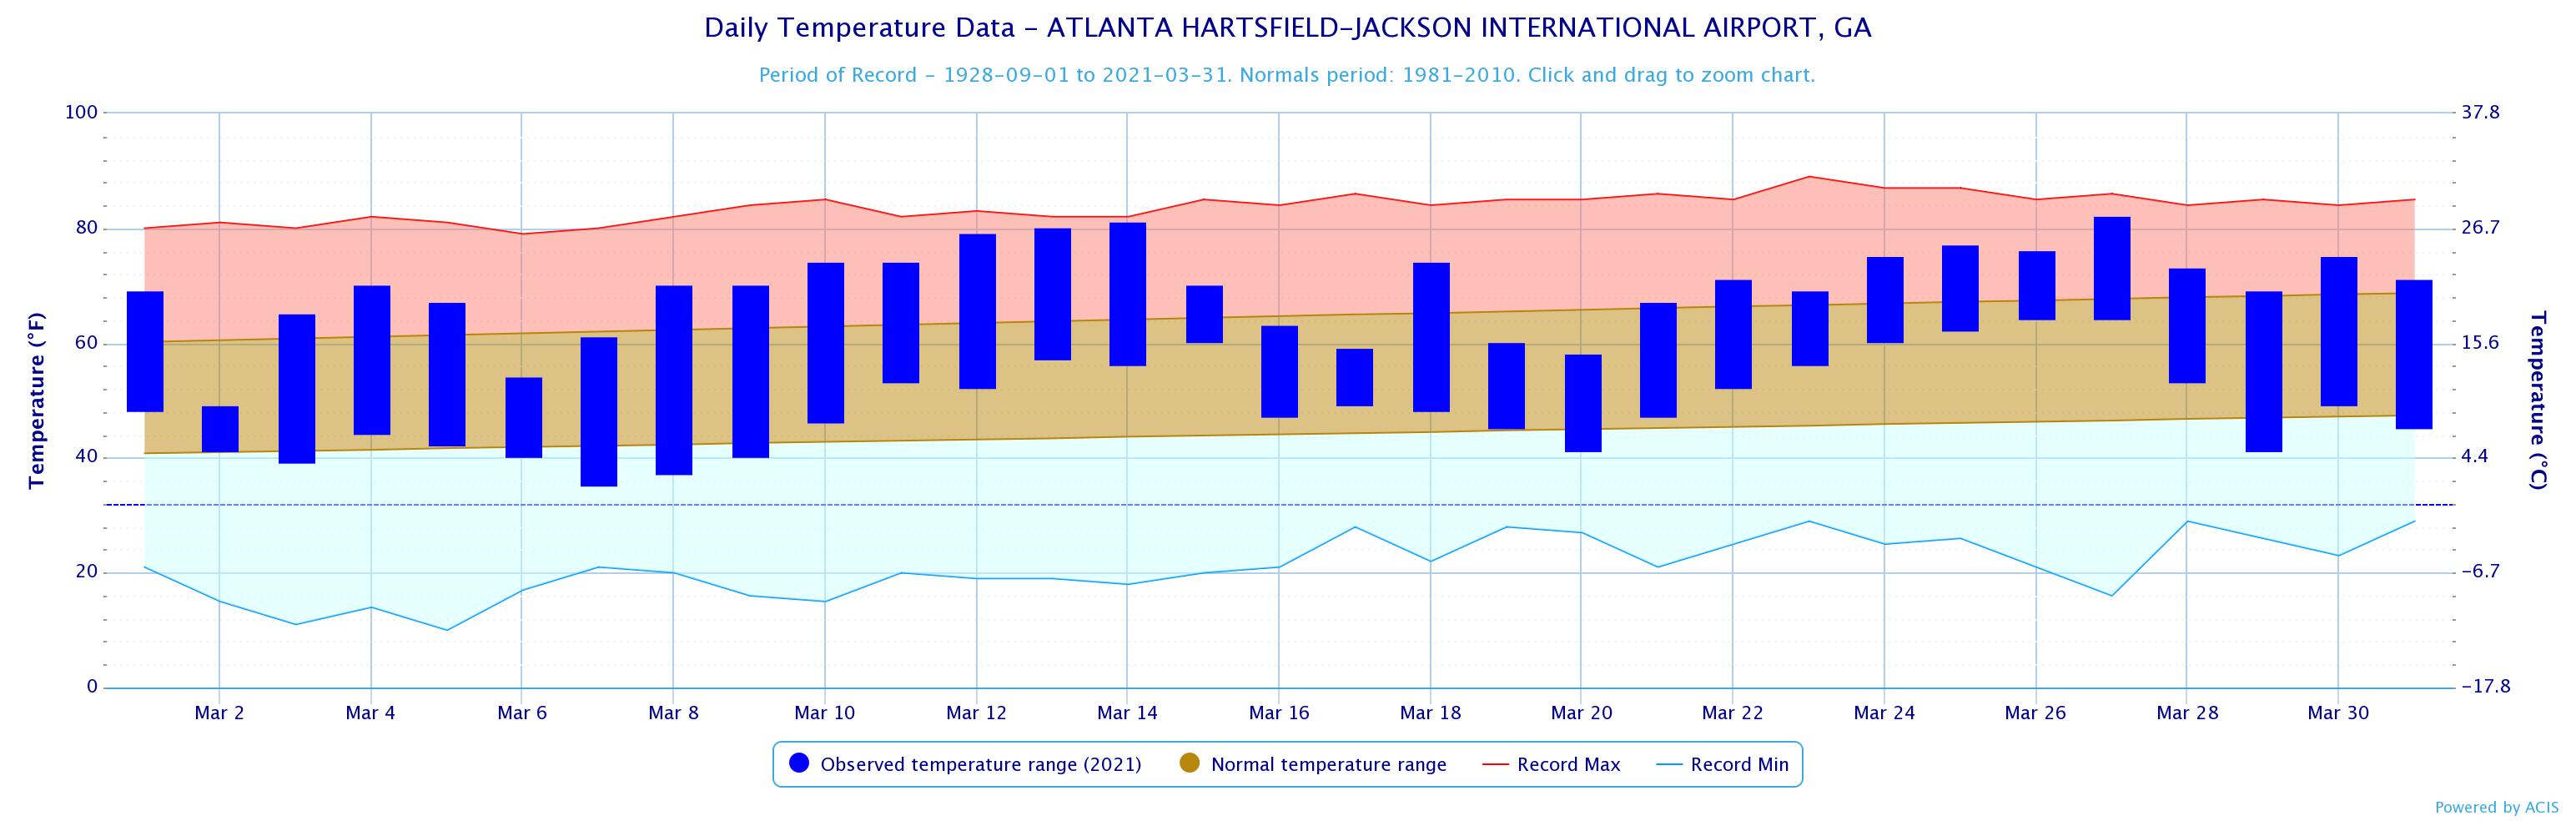
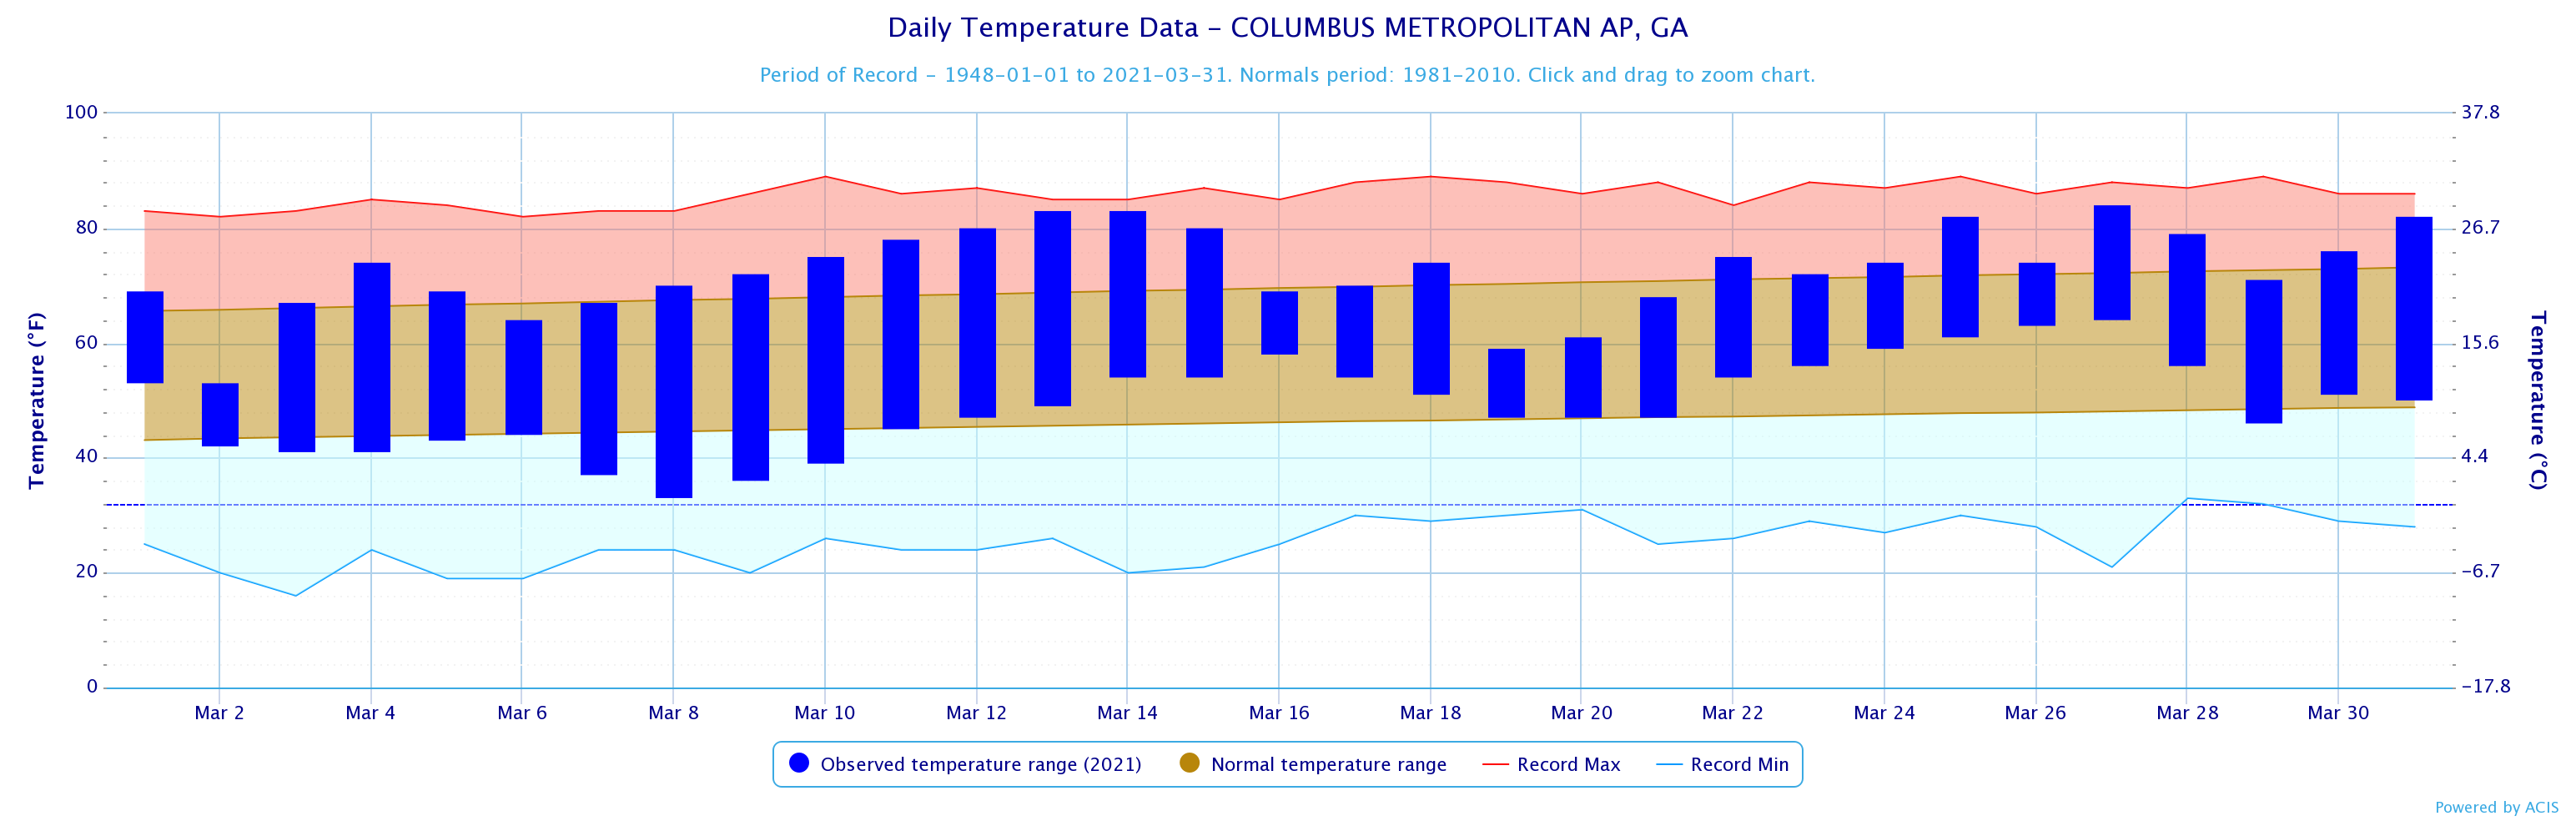
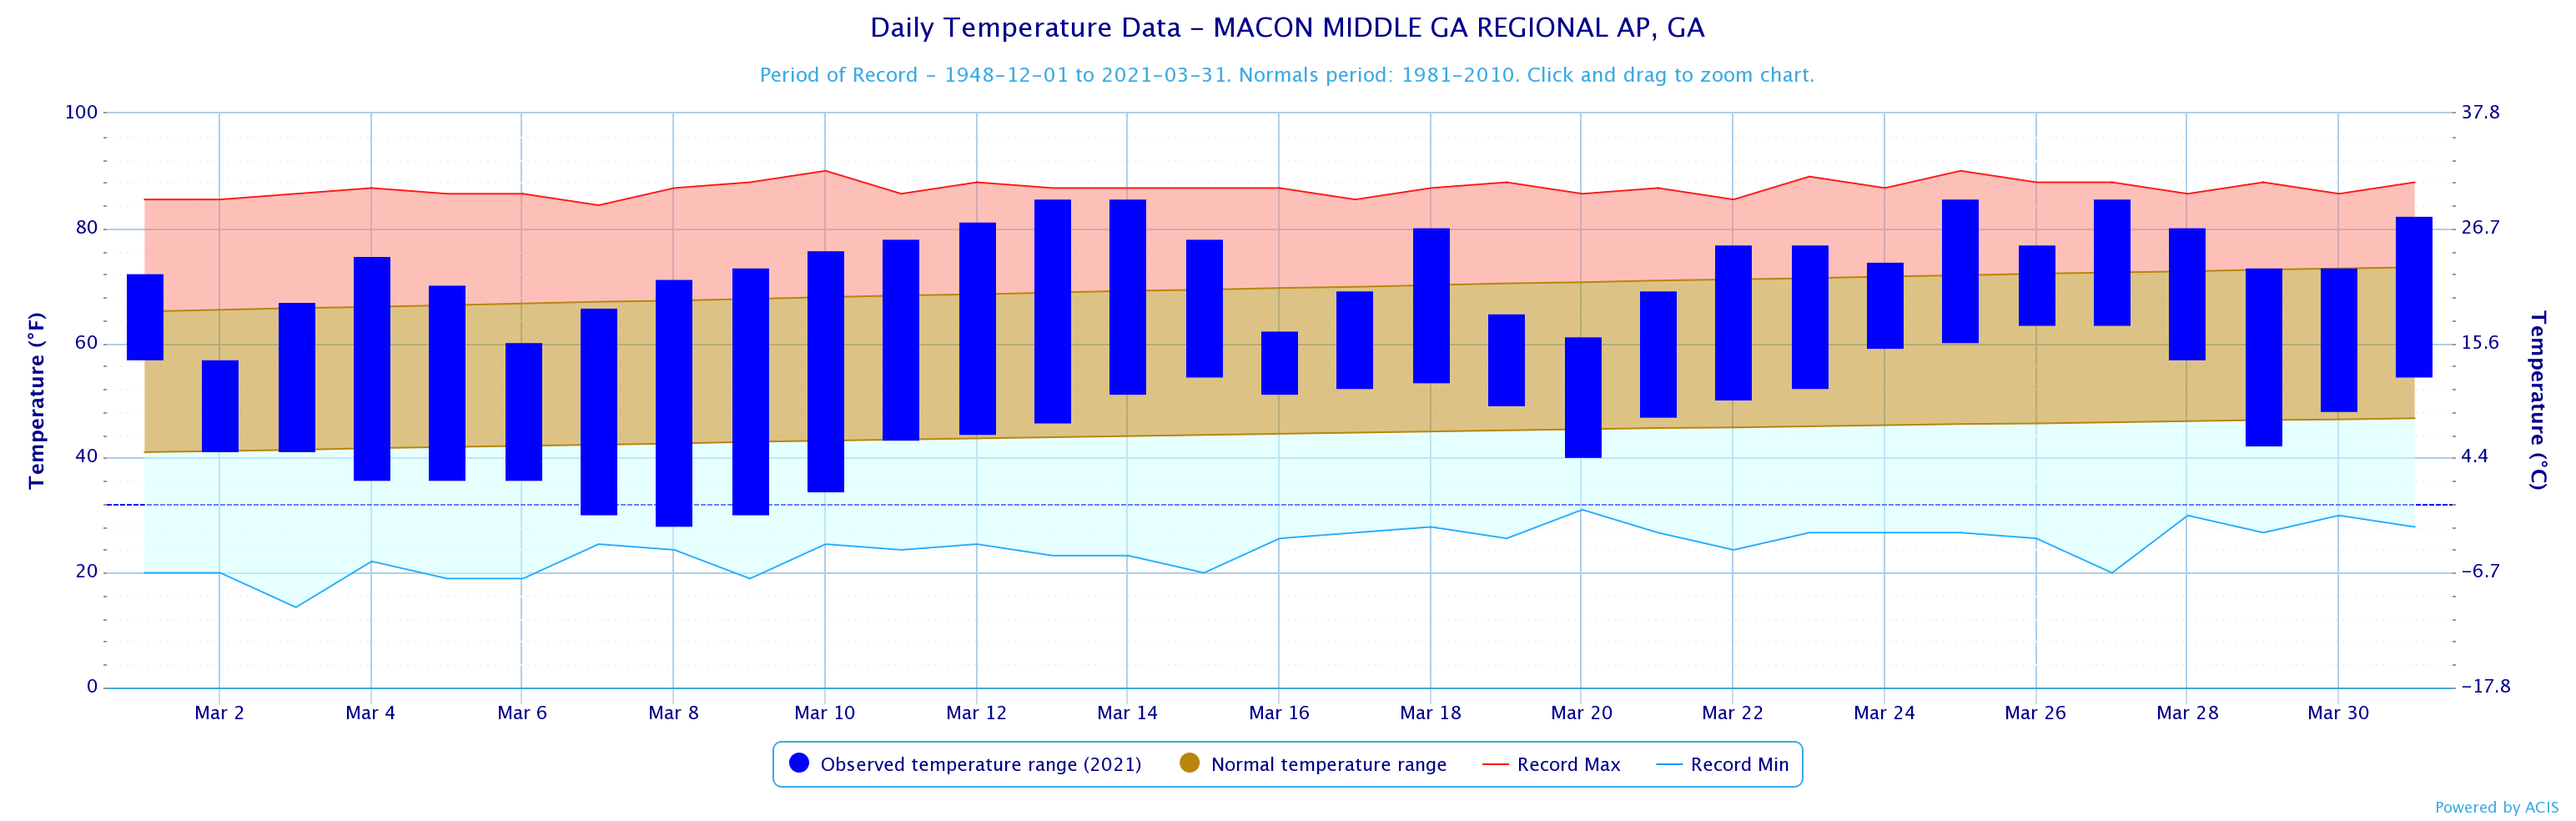
Temperature and precipitation records at our 4 main climate sites are located below.
March 2021 Climate Records
An all time record high of 79°F was set at ATL on 3/1. This breaks the old record of 78°F set in 1981
An all time record high of 81°F was set at AHN on 3/1. This breaks the old record of 79°F set in 1981
Larger events that occurred across north and central Georgia this past March can be found here.
The April climate outlook is below.
April Outlook