| Previous Month | Next Month |
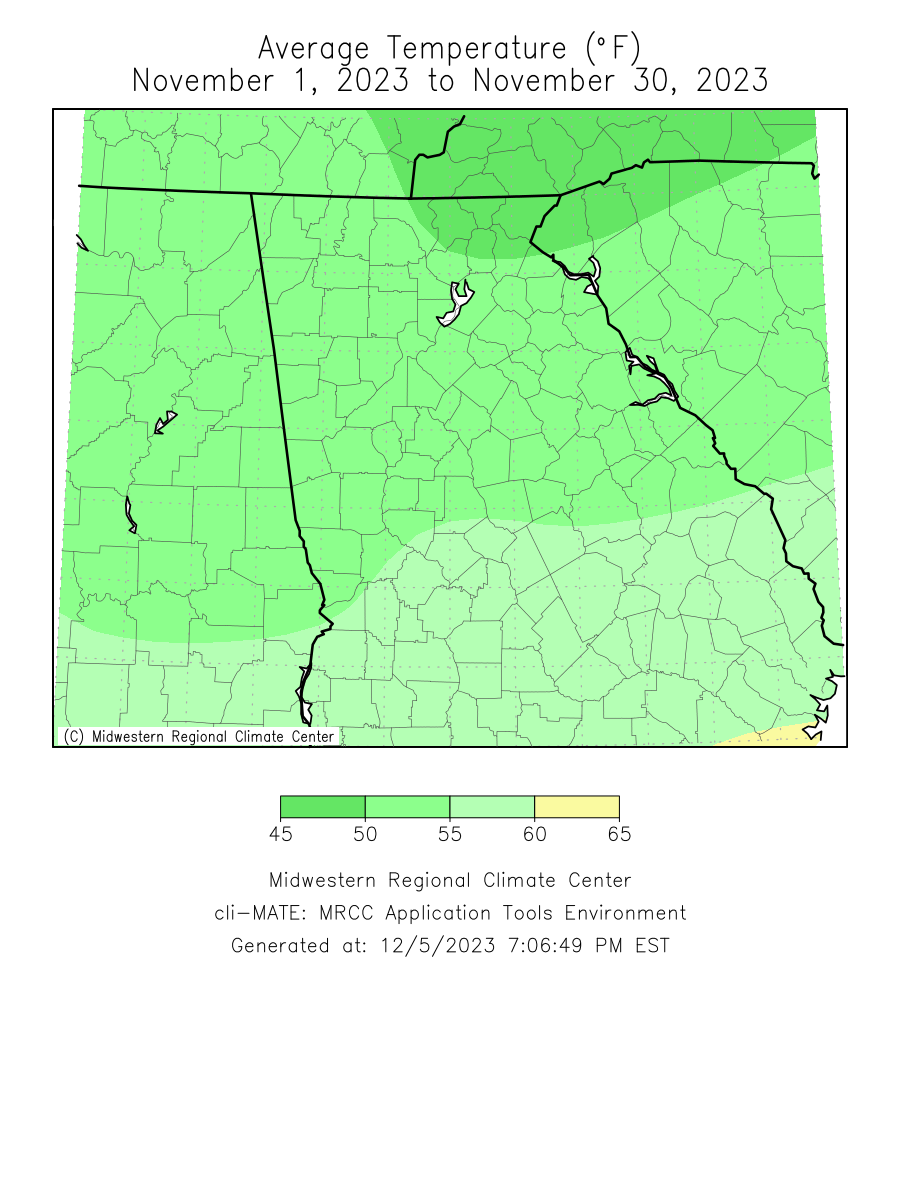
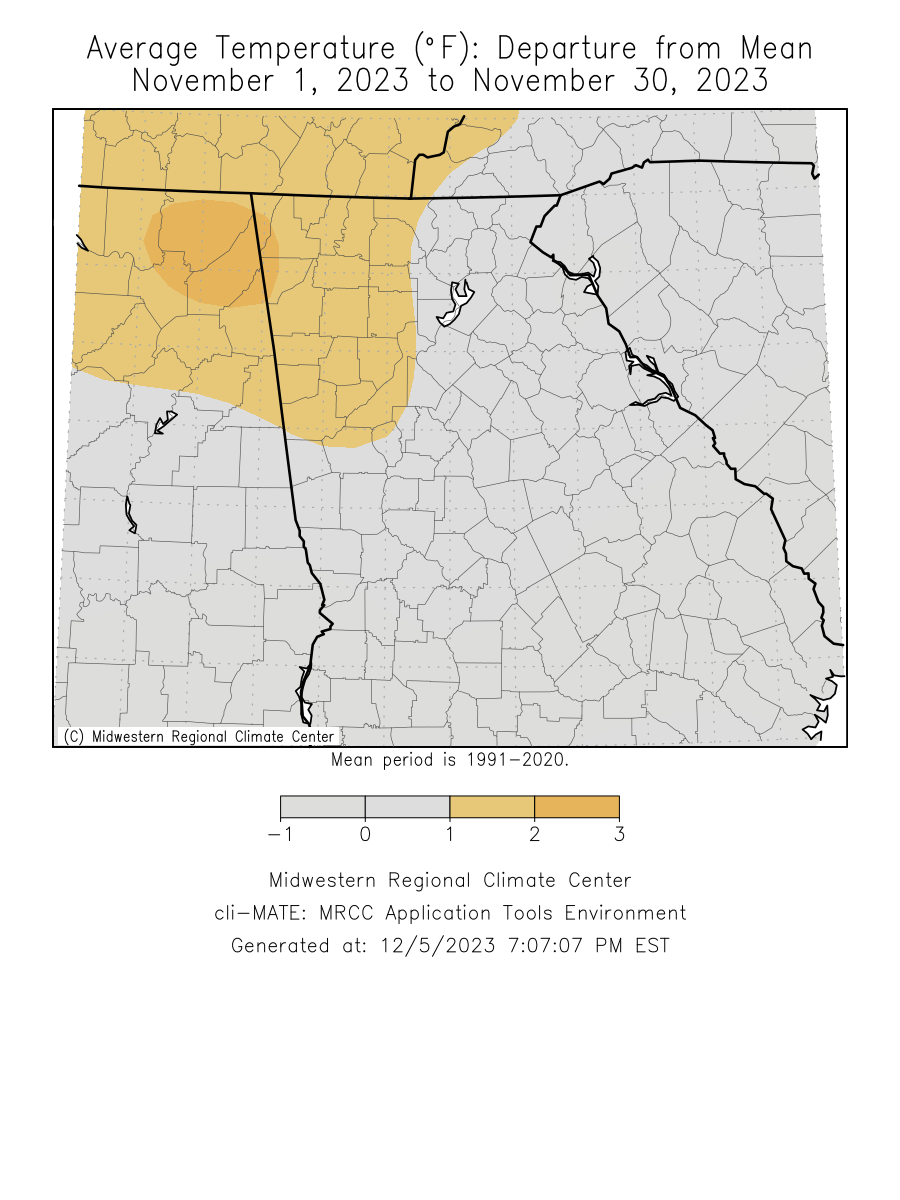
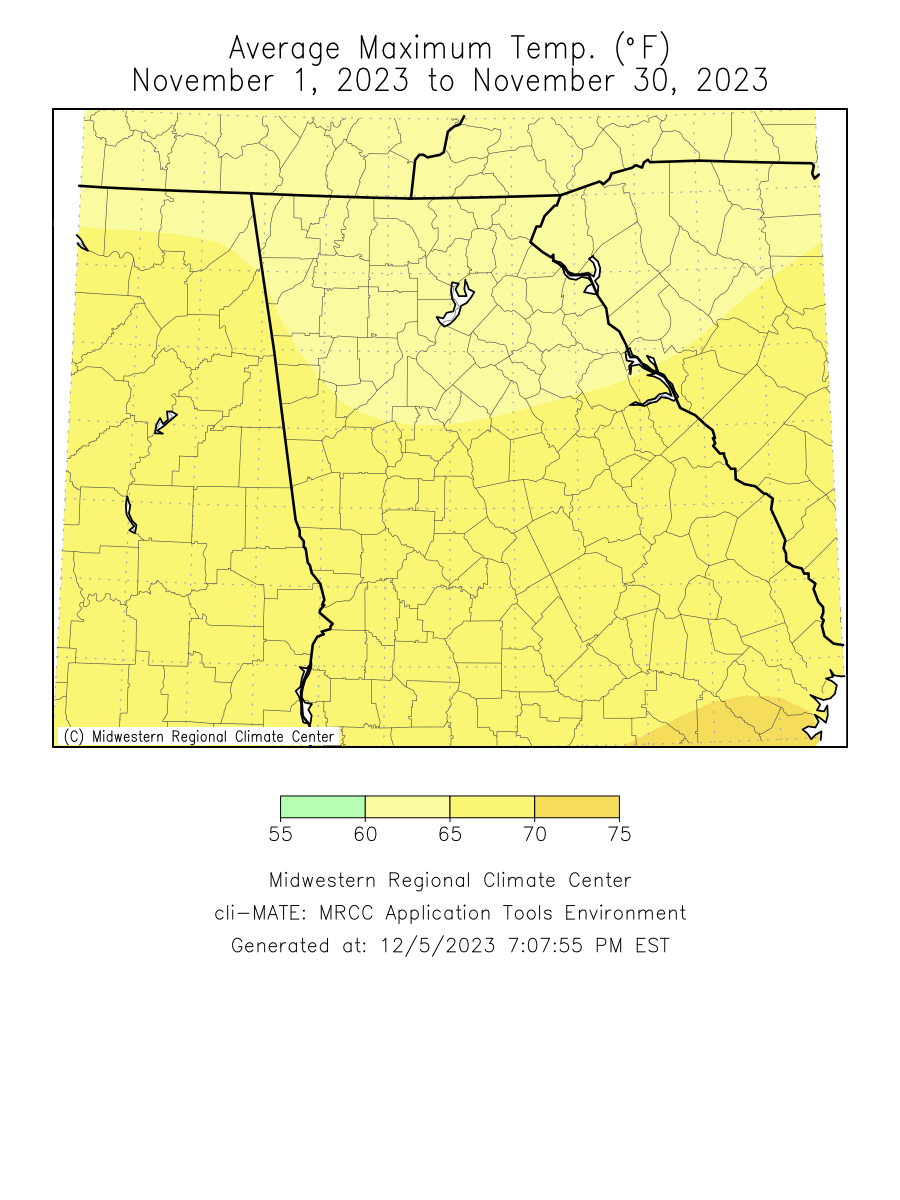
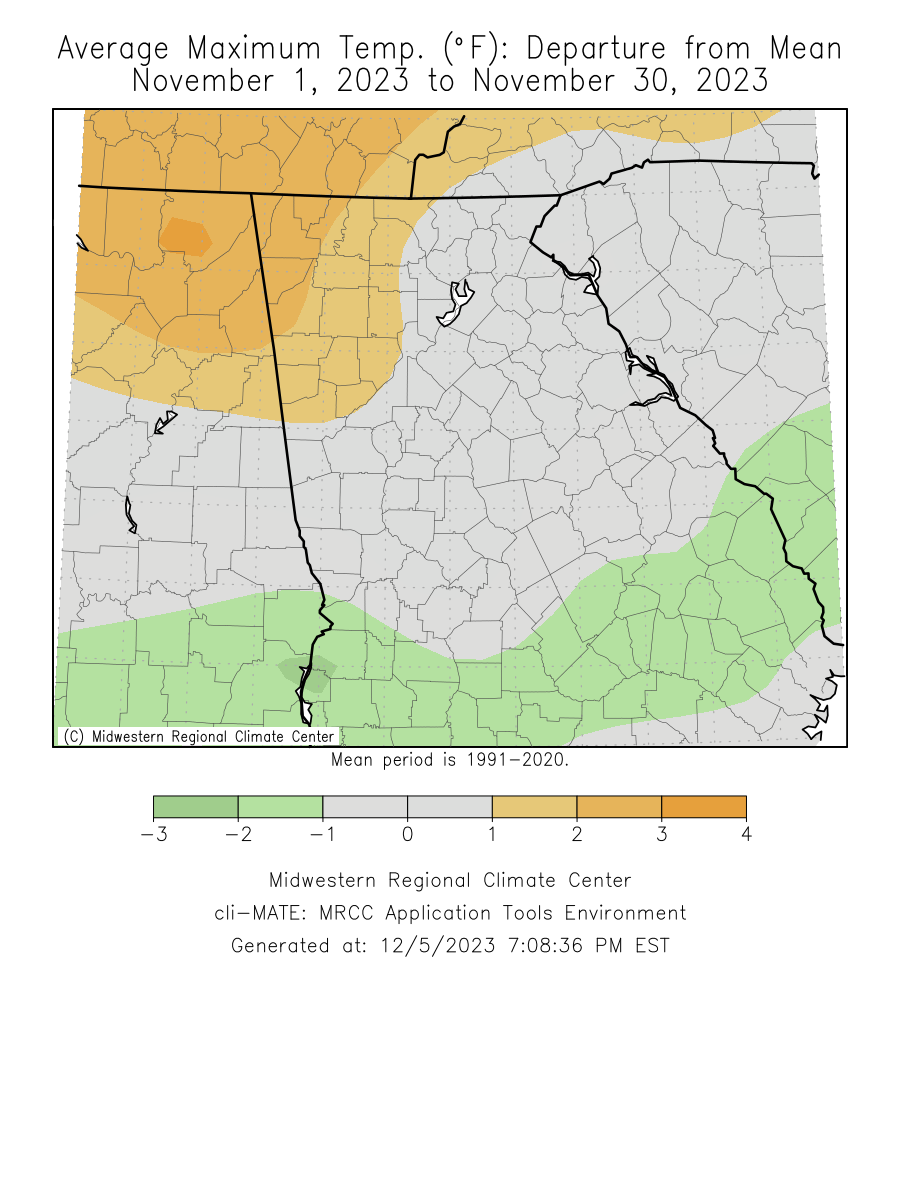
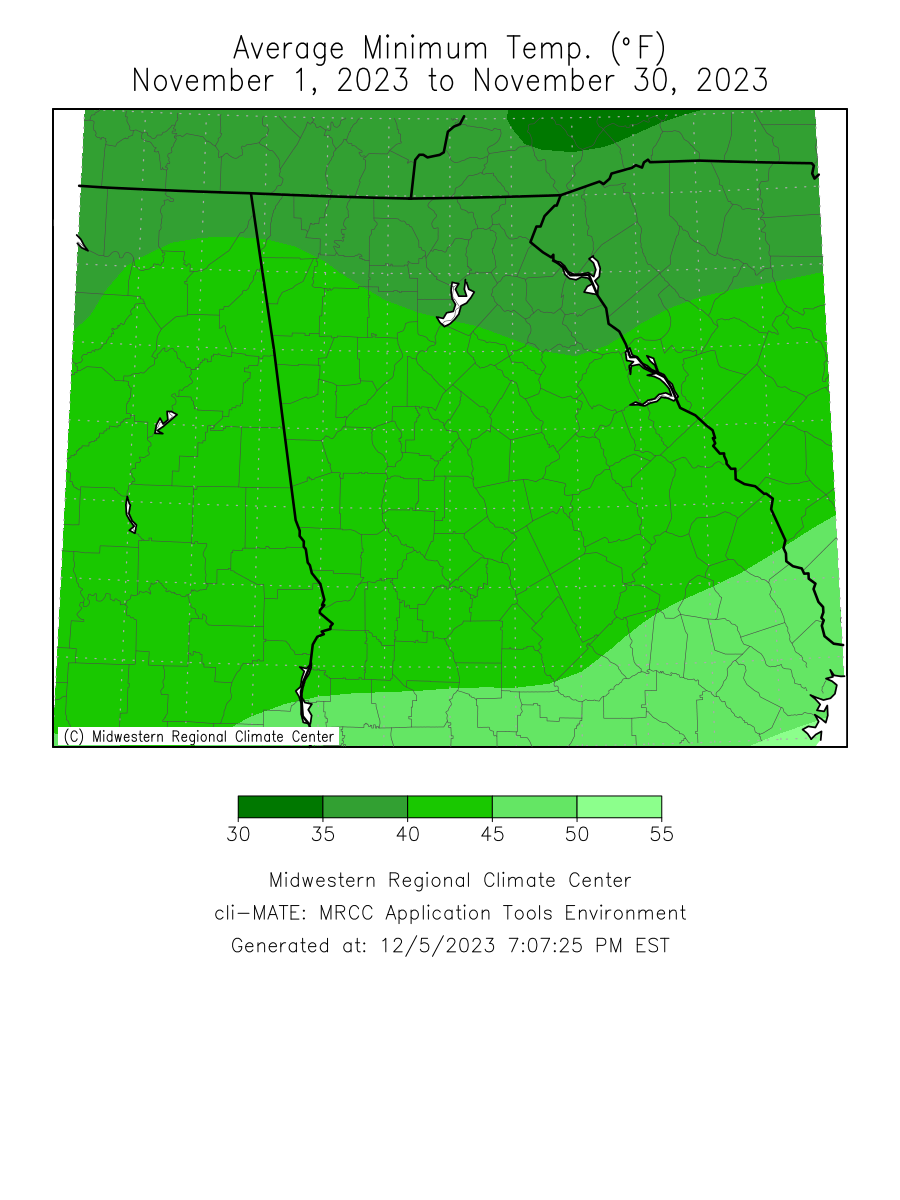
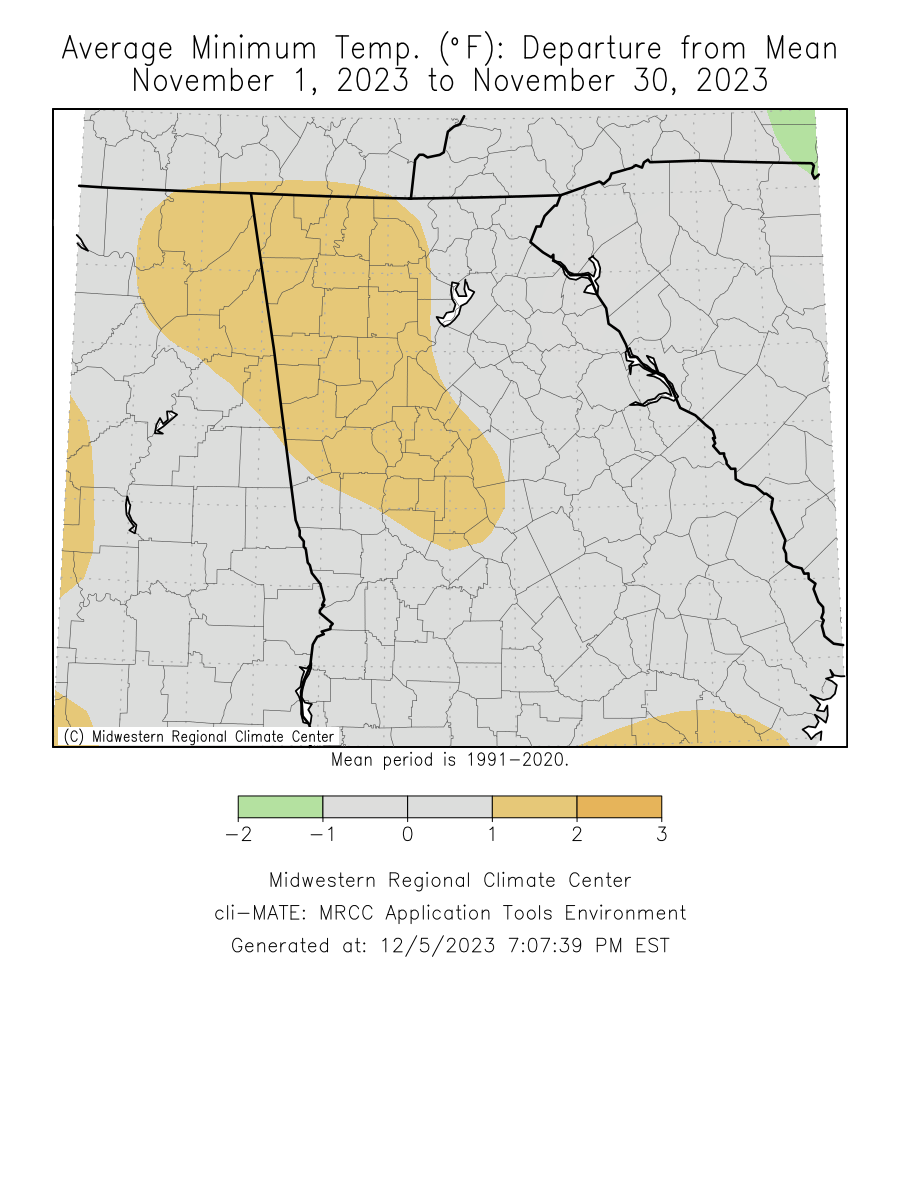
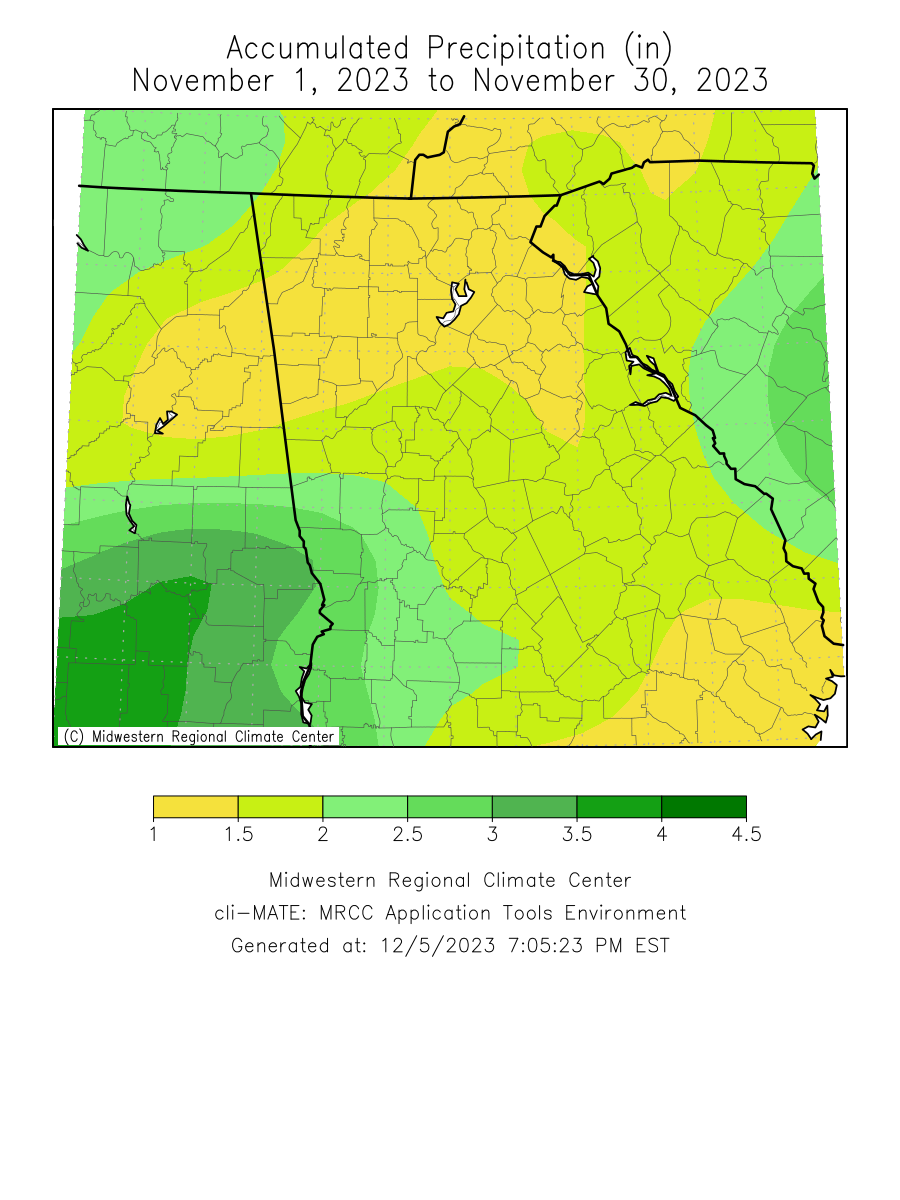
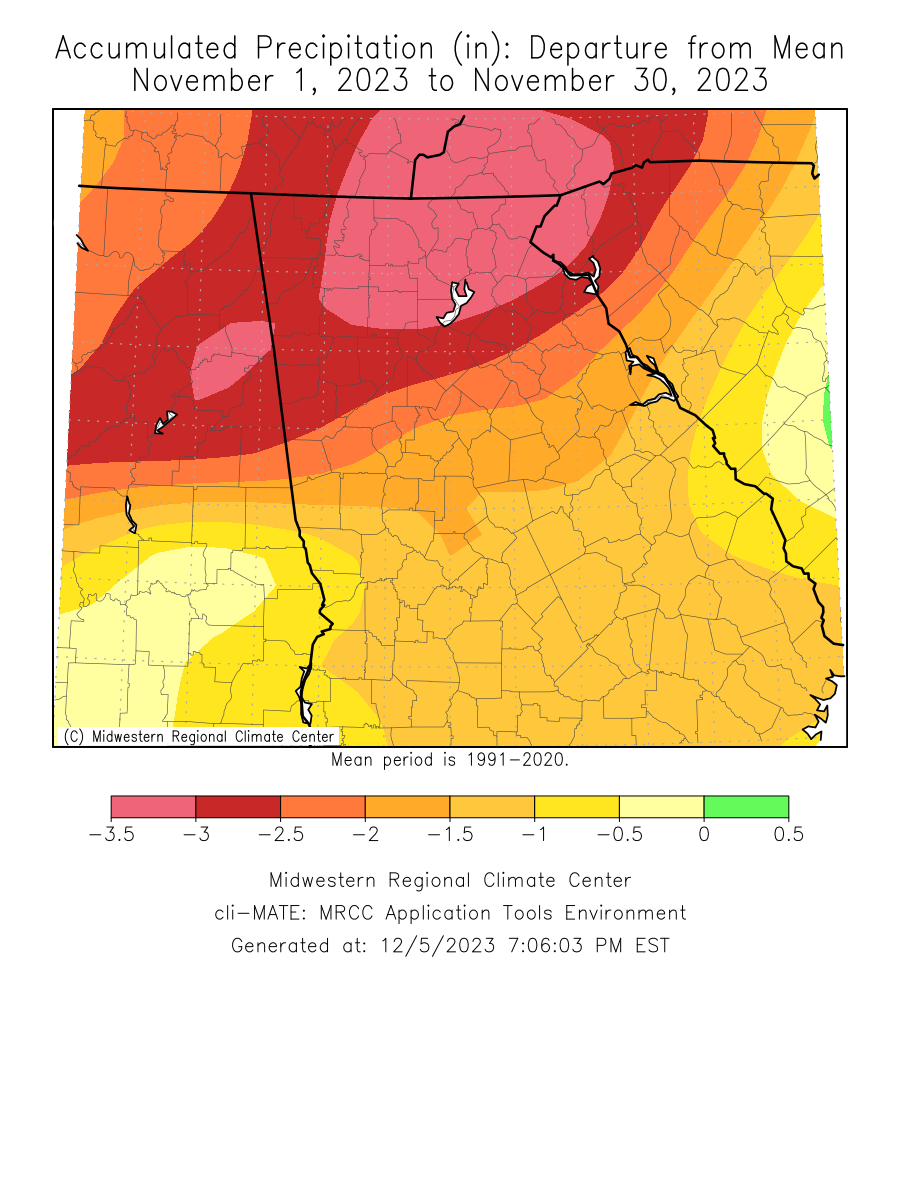
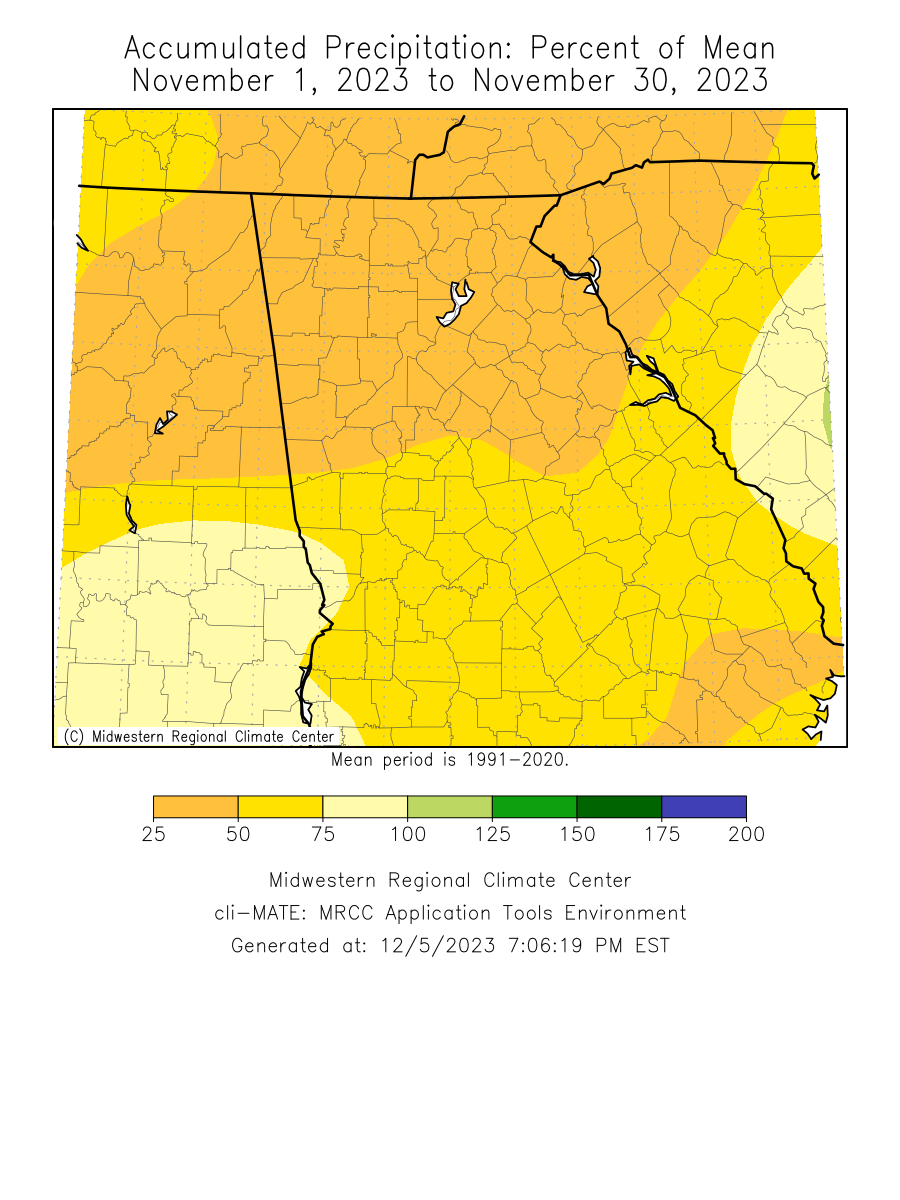
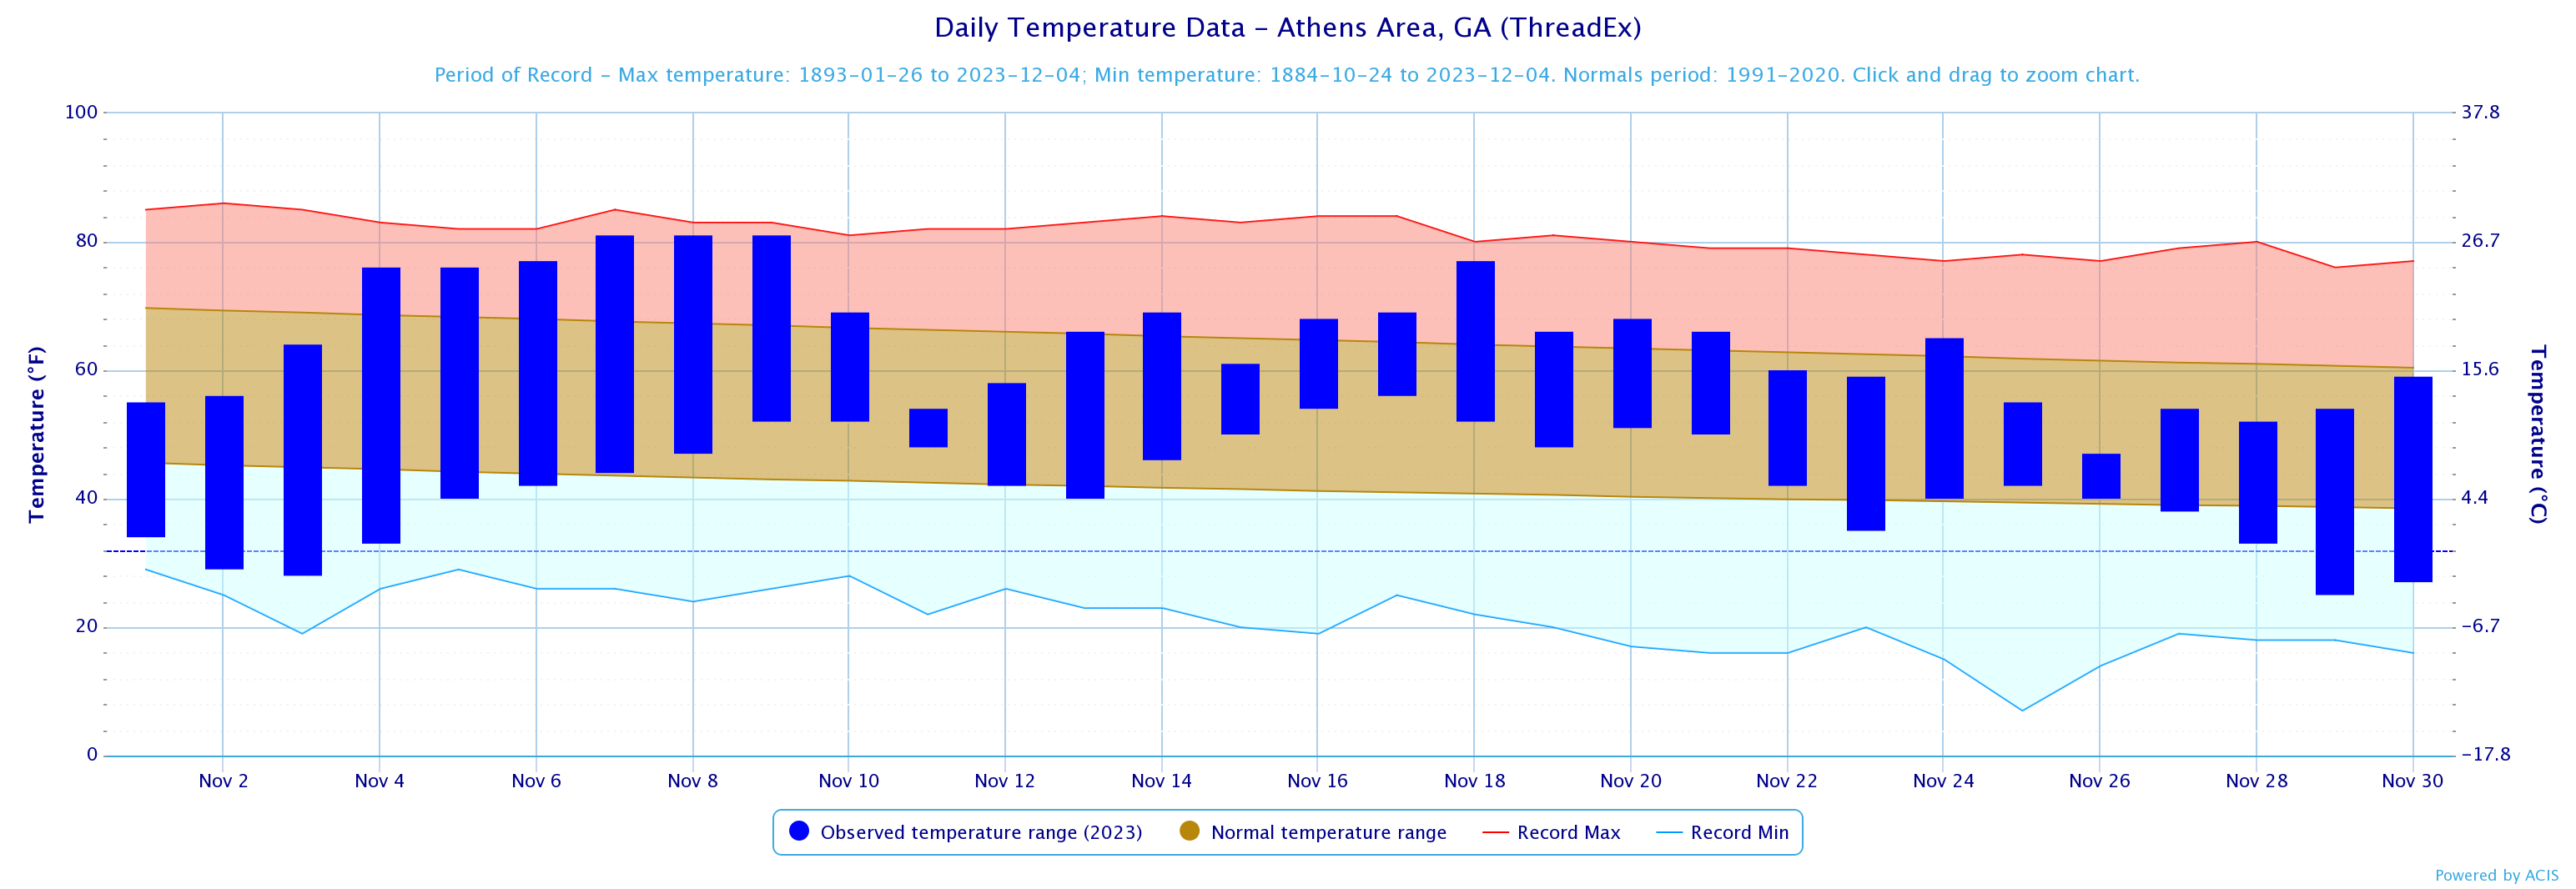
Temperatures through the month of November were around a degrees above normal. Precipitation through the month of November was around two inches below normal.
Climate Site Temperatures Precipitation Climate Site Maximum Temperature Max T Date Climate Site Total Precipitation DFN (Departure Climate Site Maximum Daily Precip (in inches) Max P Date Data prepared by NWS Peachtree City/Atlanta Based on the Climate Prediction Center's outlook for December, south and central Georgia has a 33% to 40% chance of above normal temperatures while the remainder of Georgia has an equal chance of above or below normal temperatures. For precipitation, all of south and central Georgia has a 33% to 40% chance of below normal precipitation while the remainder of Georgia has an equal chance of above or below normal precipitation.
Overview
Climate Graphs
Records
Events
December Outlook
Below are the overview stats for November 2023 for our 10 climate sites.
November 2023 November Rankings
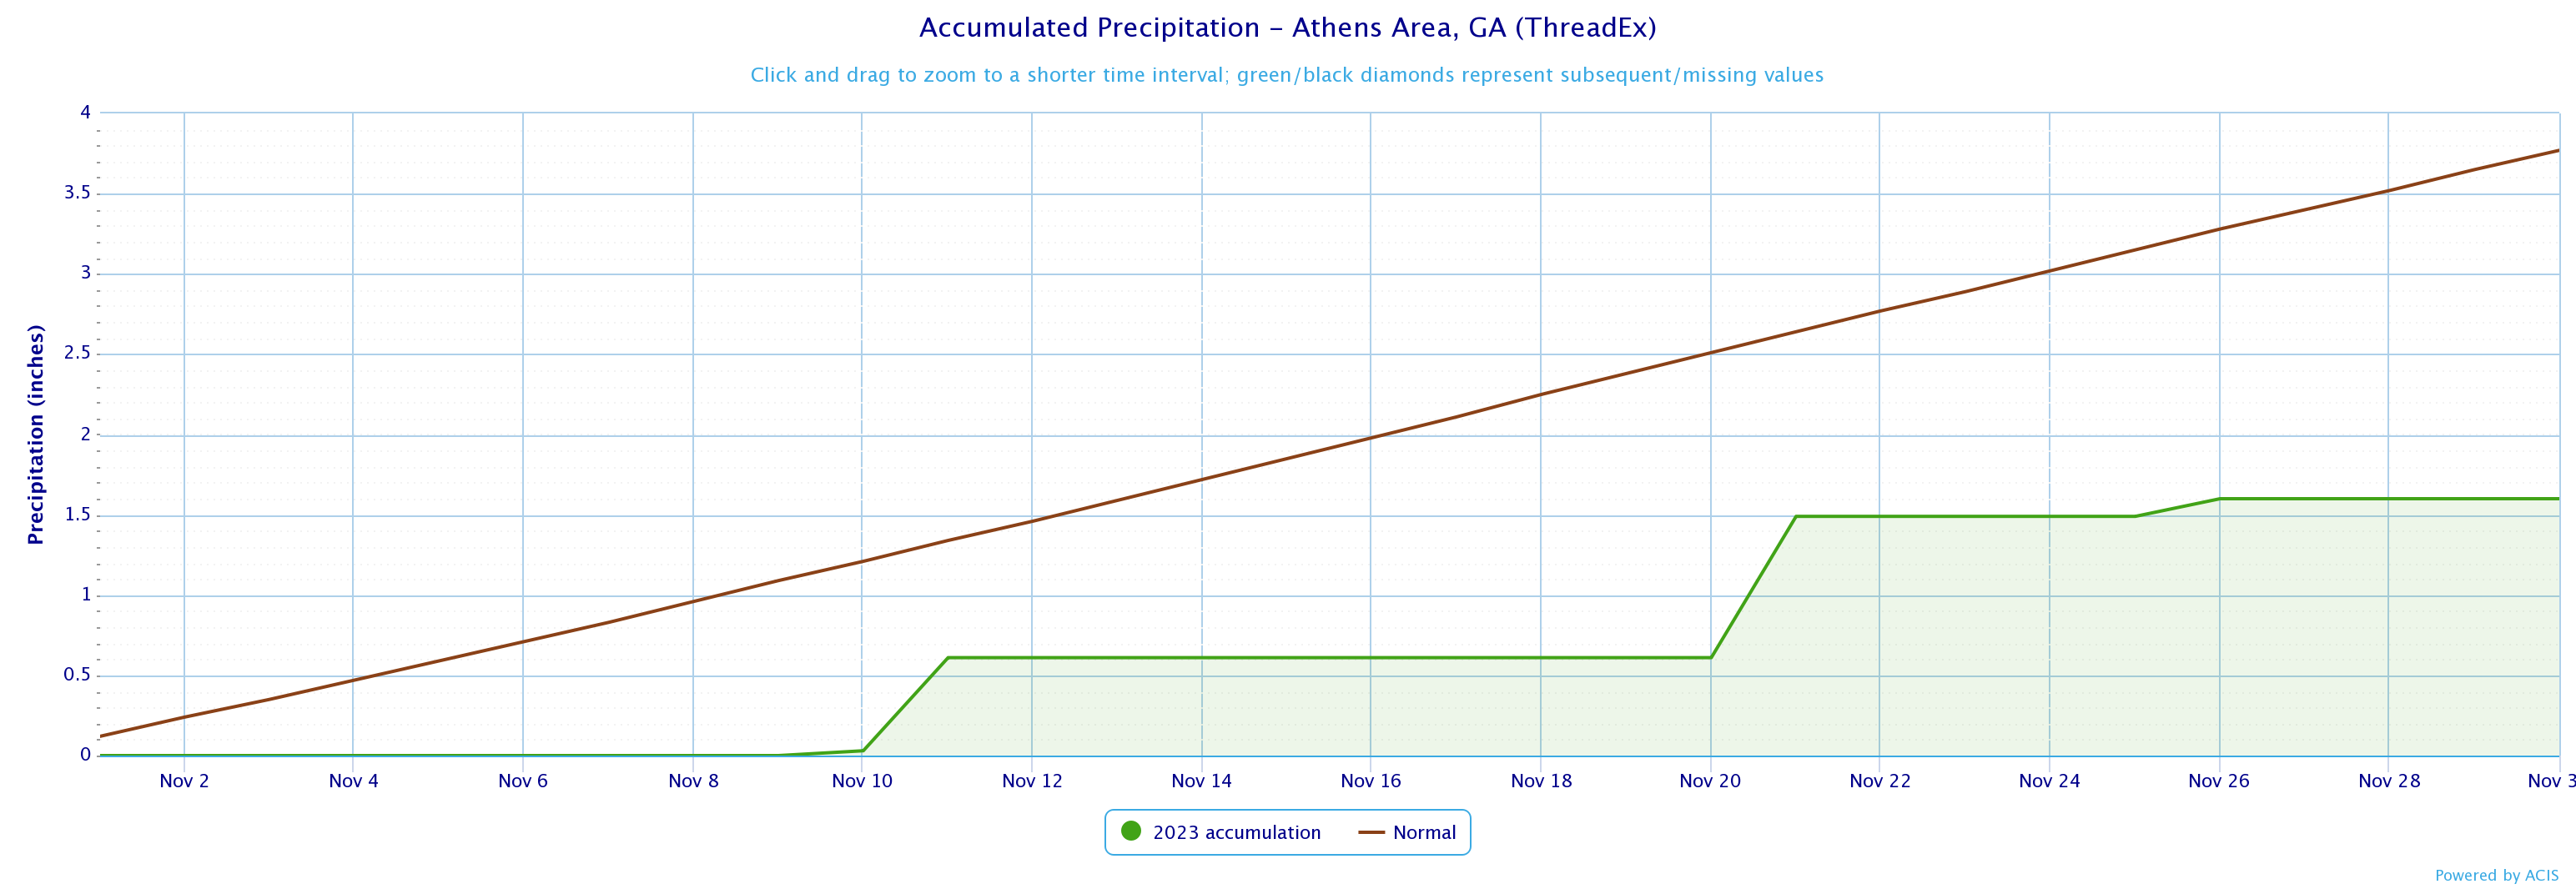
Athens
41st Warmest
33rd Driest
Atlanta
11th Warmest
42nd Driest
Columbus
53rd Warmest
62nd Wettest
Macon
59th Warmest
42nd Driest
November 2023 Climate Averages
Climate Site
November Temp (°F)
Average Temp
Departure from normal
Athens
53.4
53.3
0.1
Atlanta
56.0
54.2
1.8
Columbus
56.7
57.3
-0.6
Macon
55.9
55.8
0.1
Dekalb Peachtree Arpt
53.1
51.5
1.6
Fulton Co Arpt
53.9
52.3
1.6
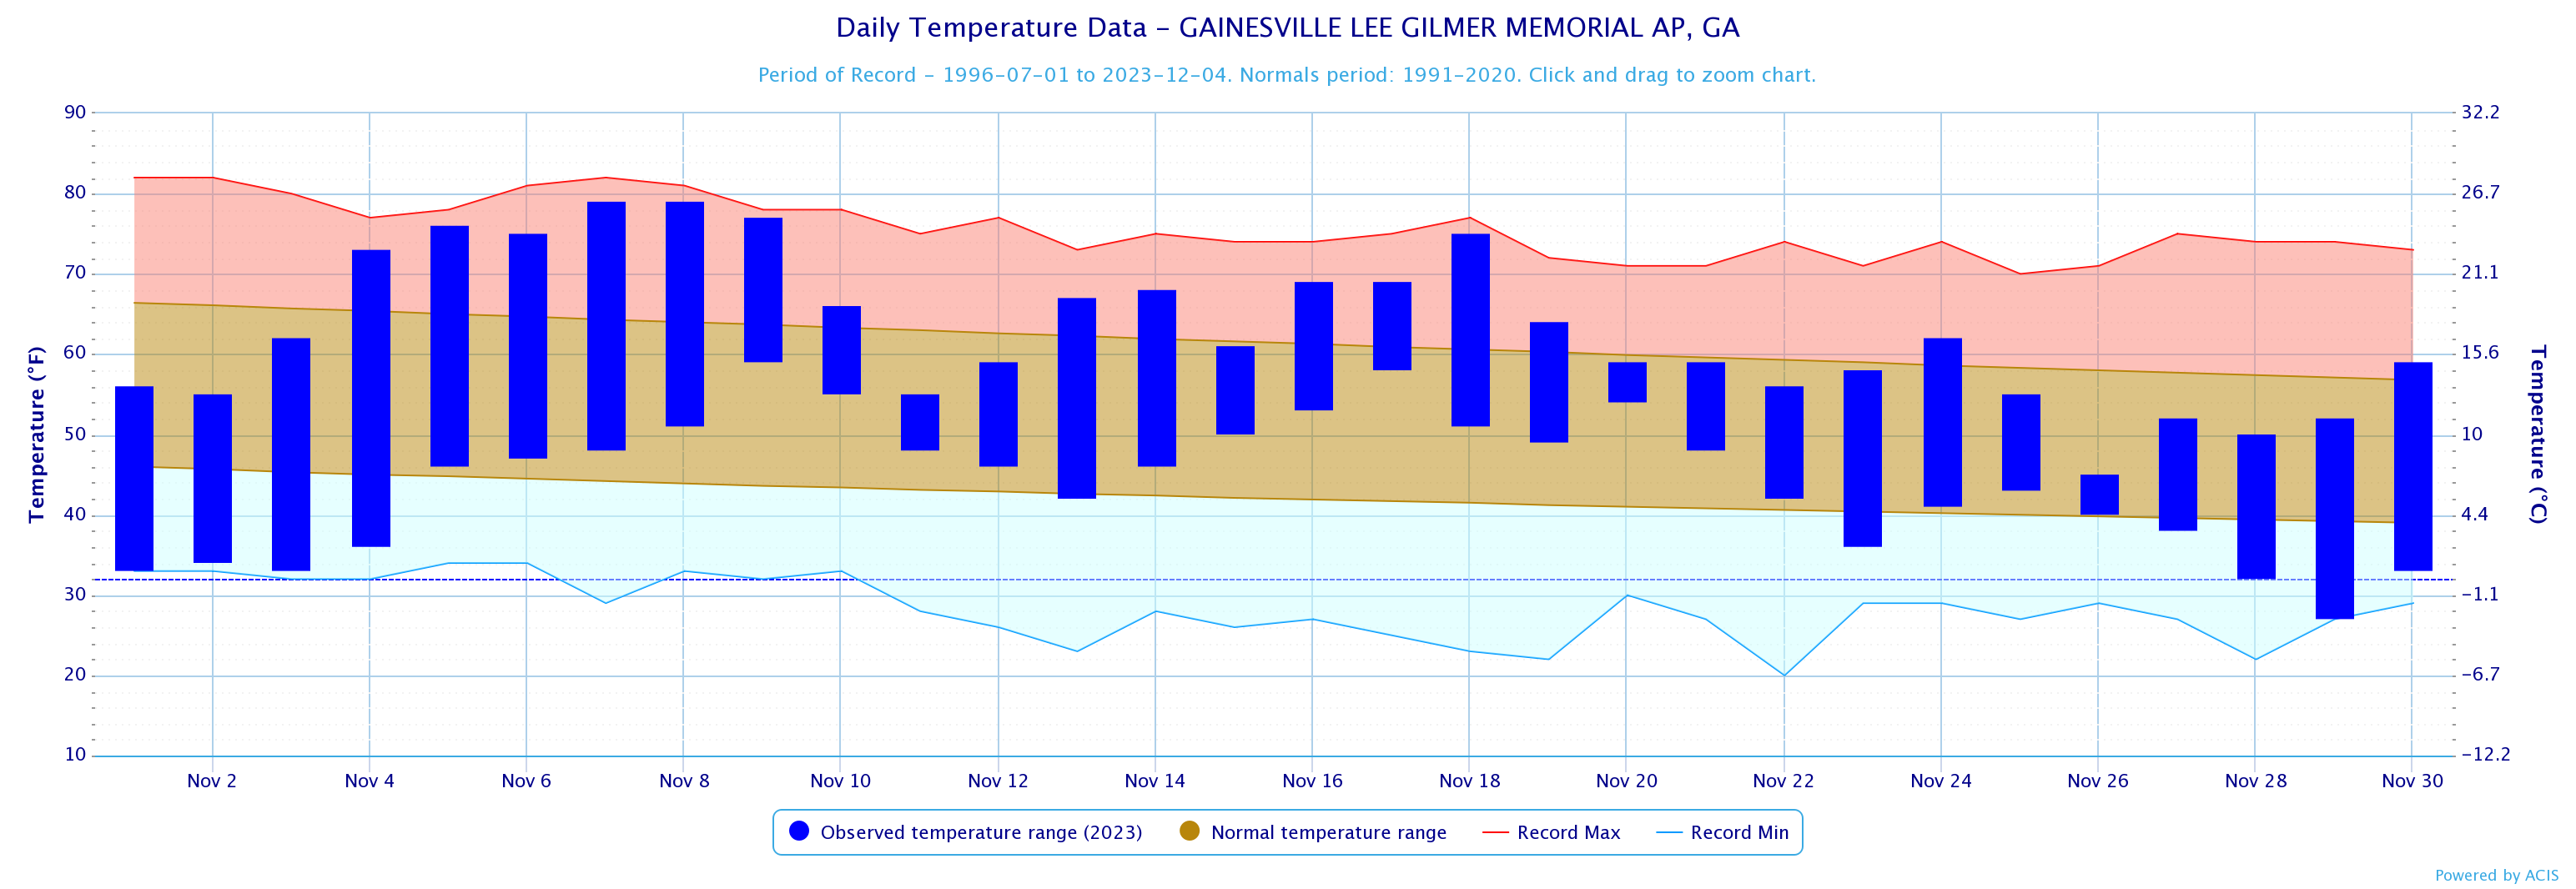
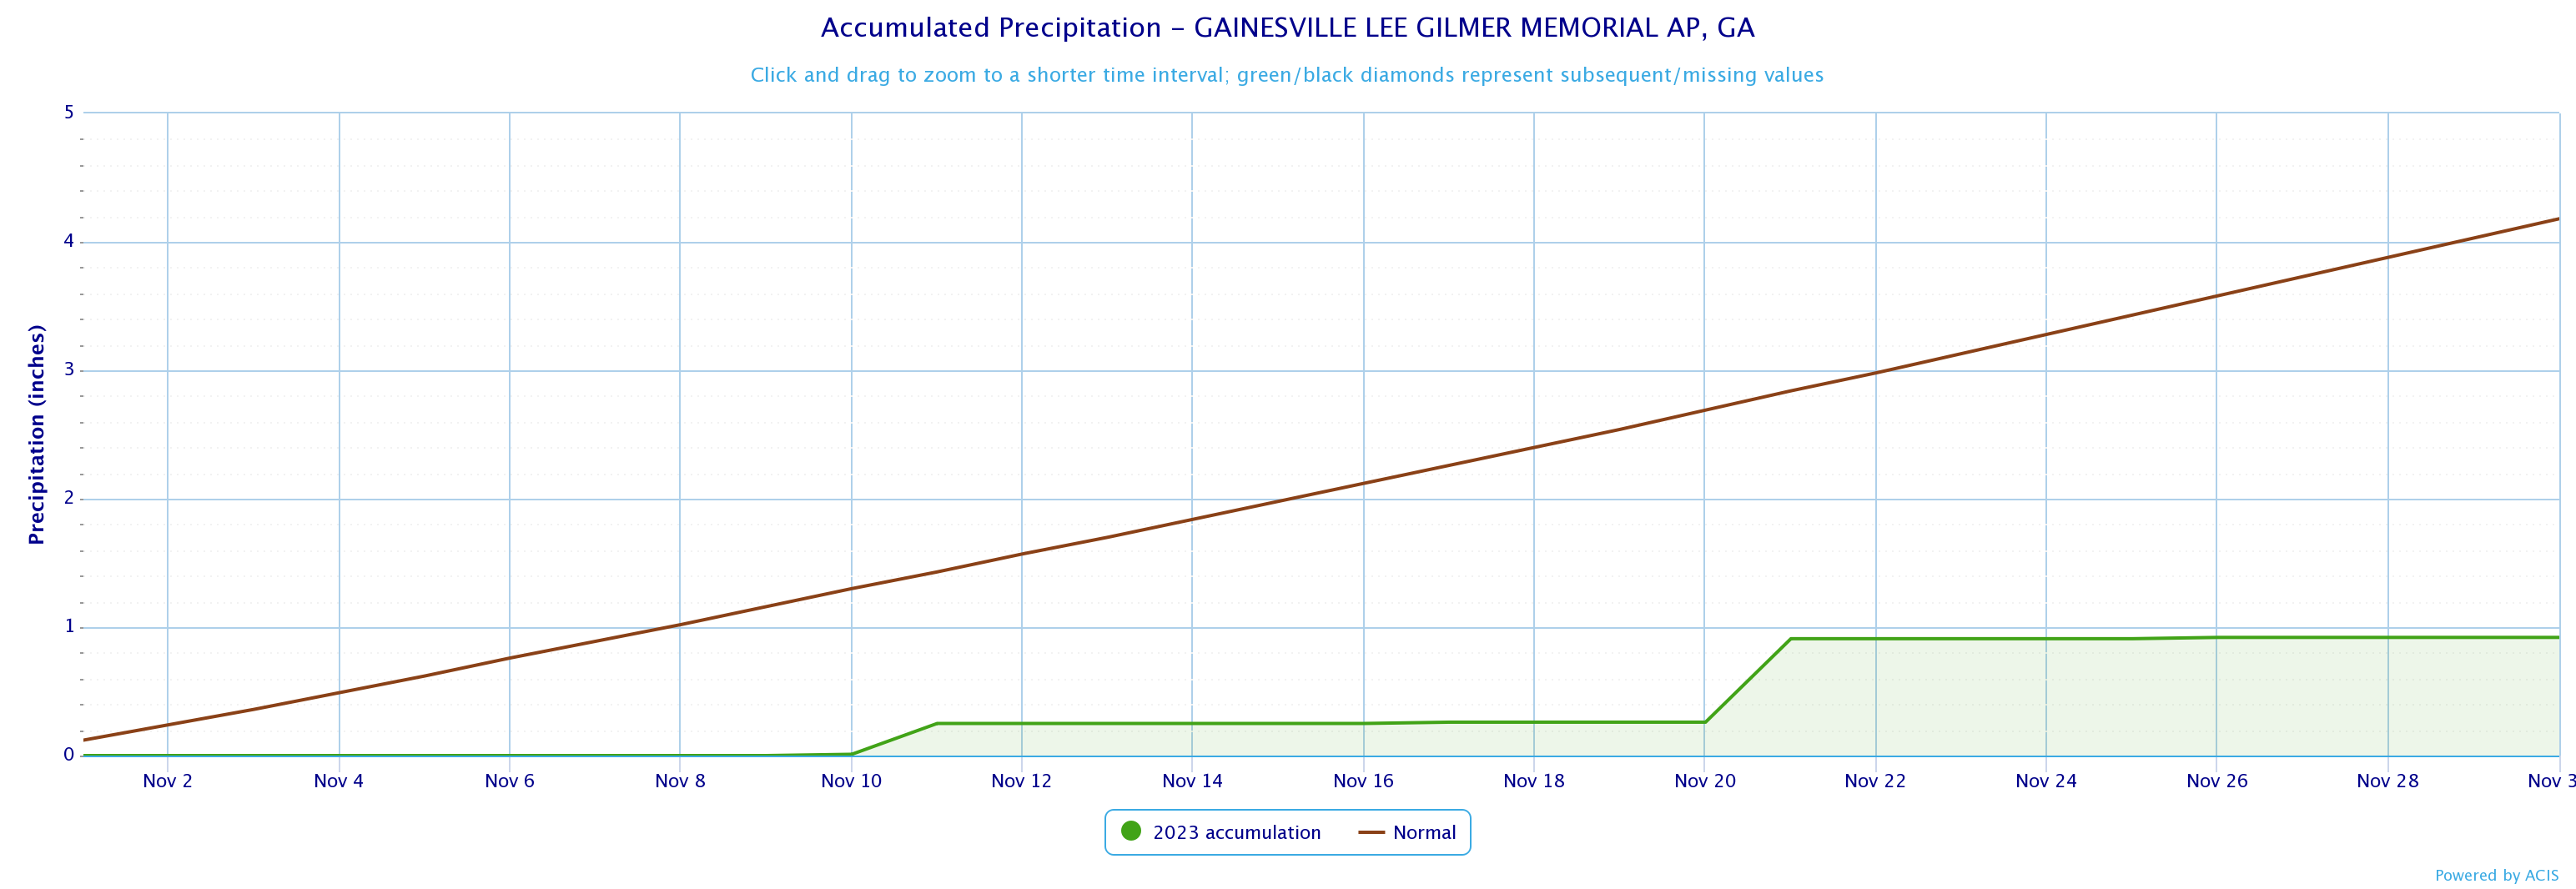
Gainesville
53.5
51.8
1.7
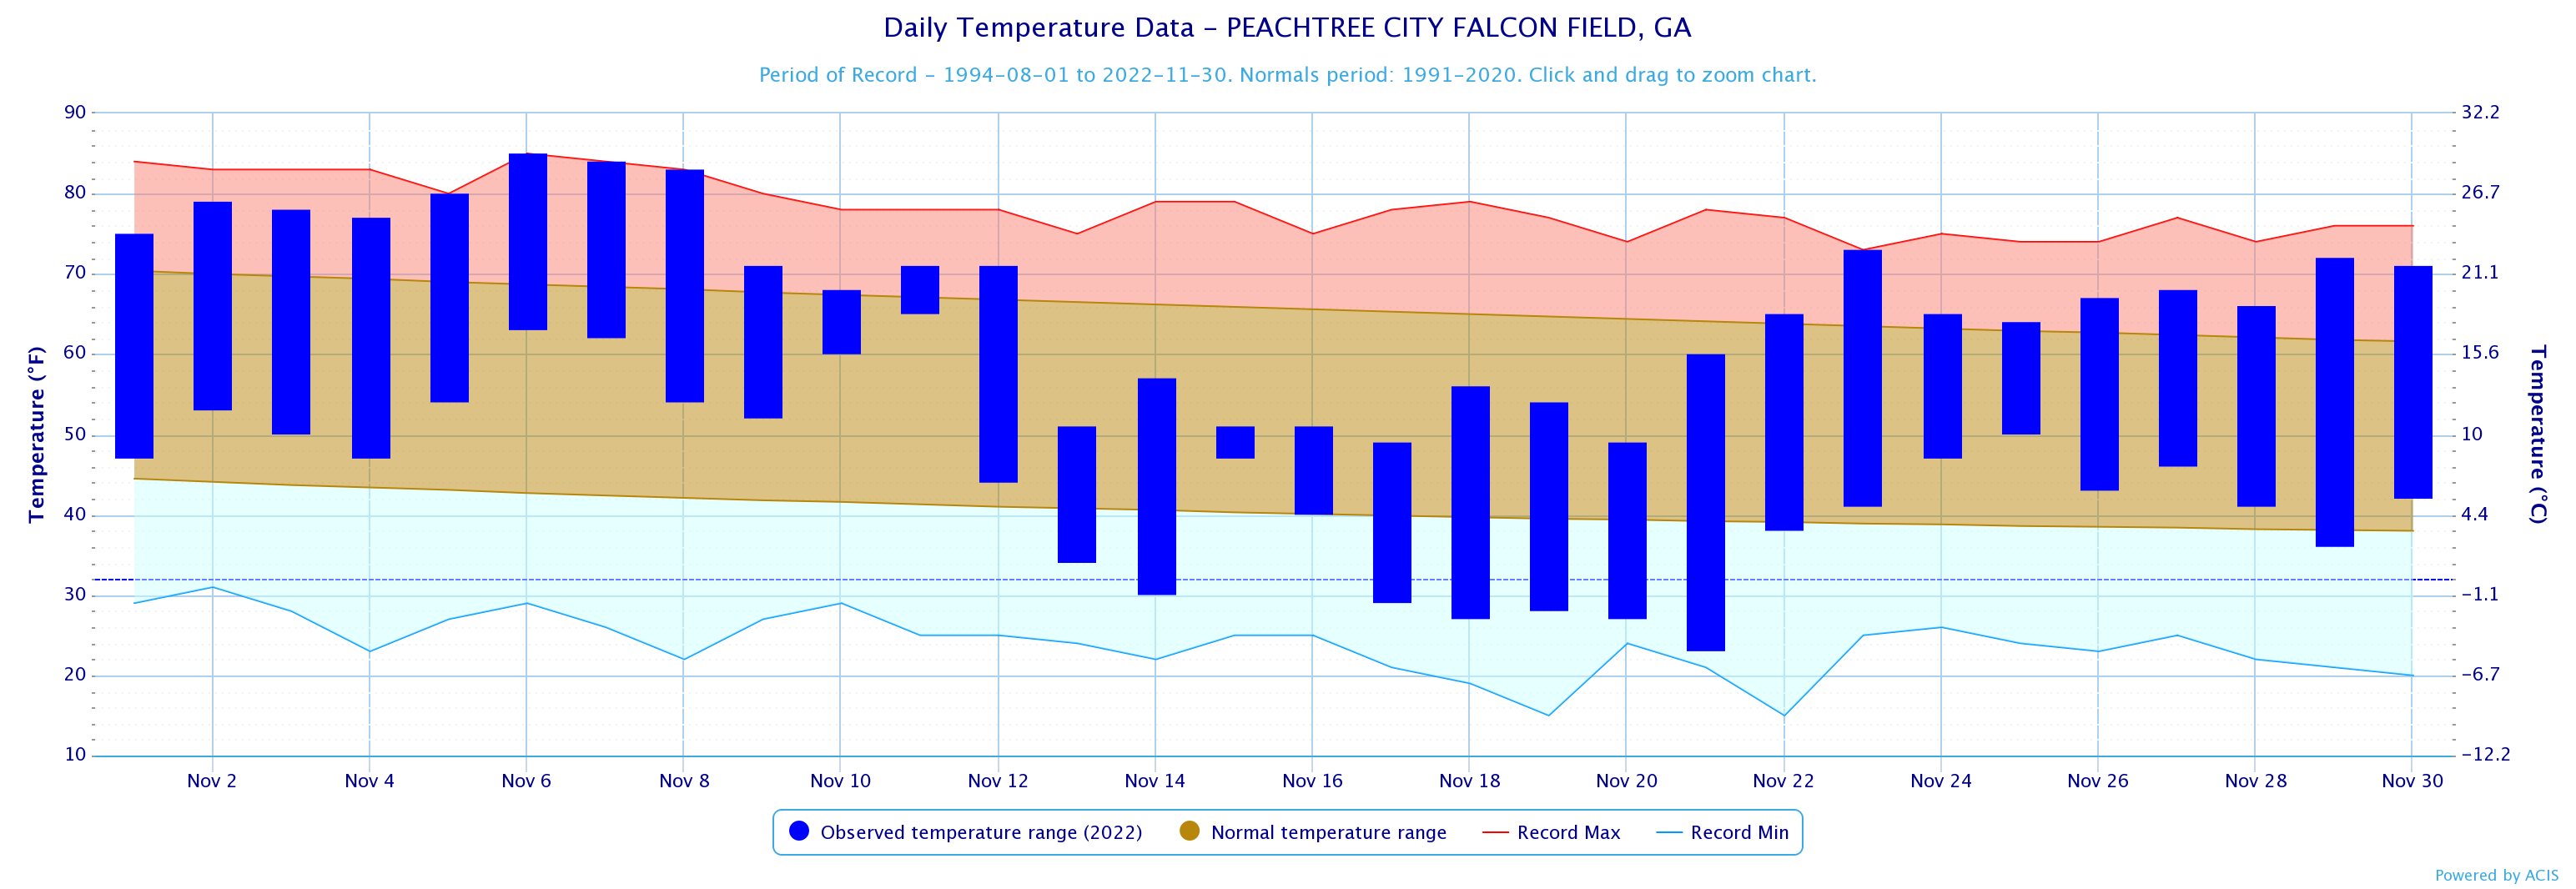
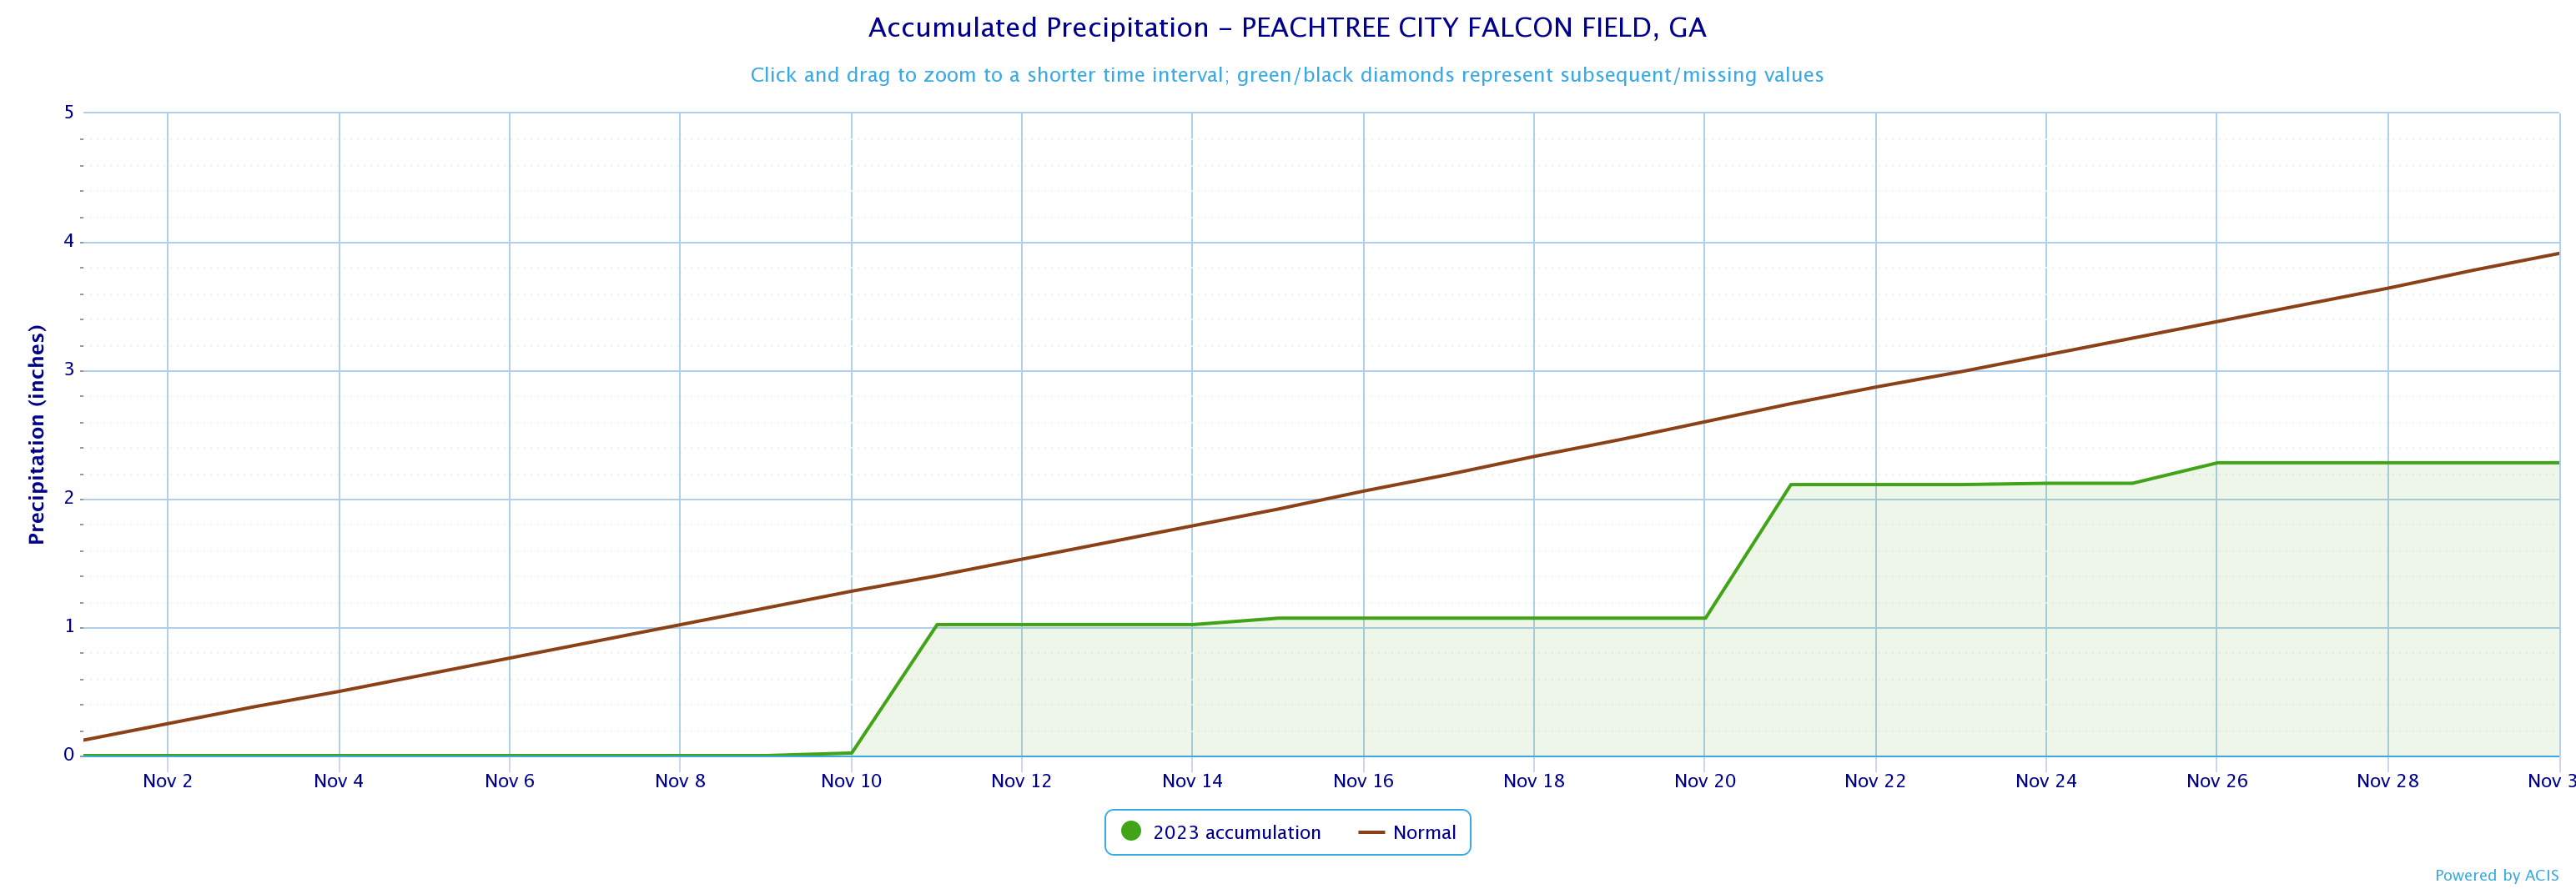
Peachtree City
52.9
53.2
-0.3
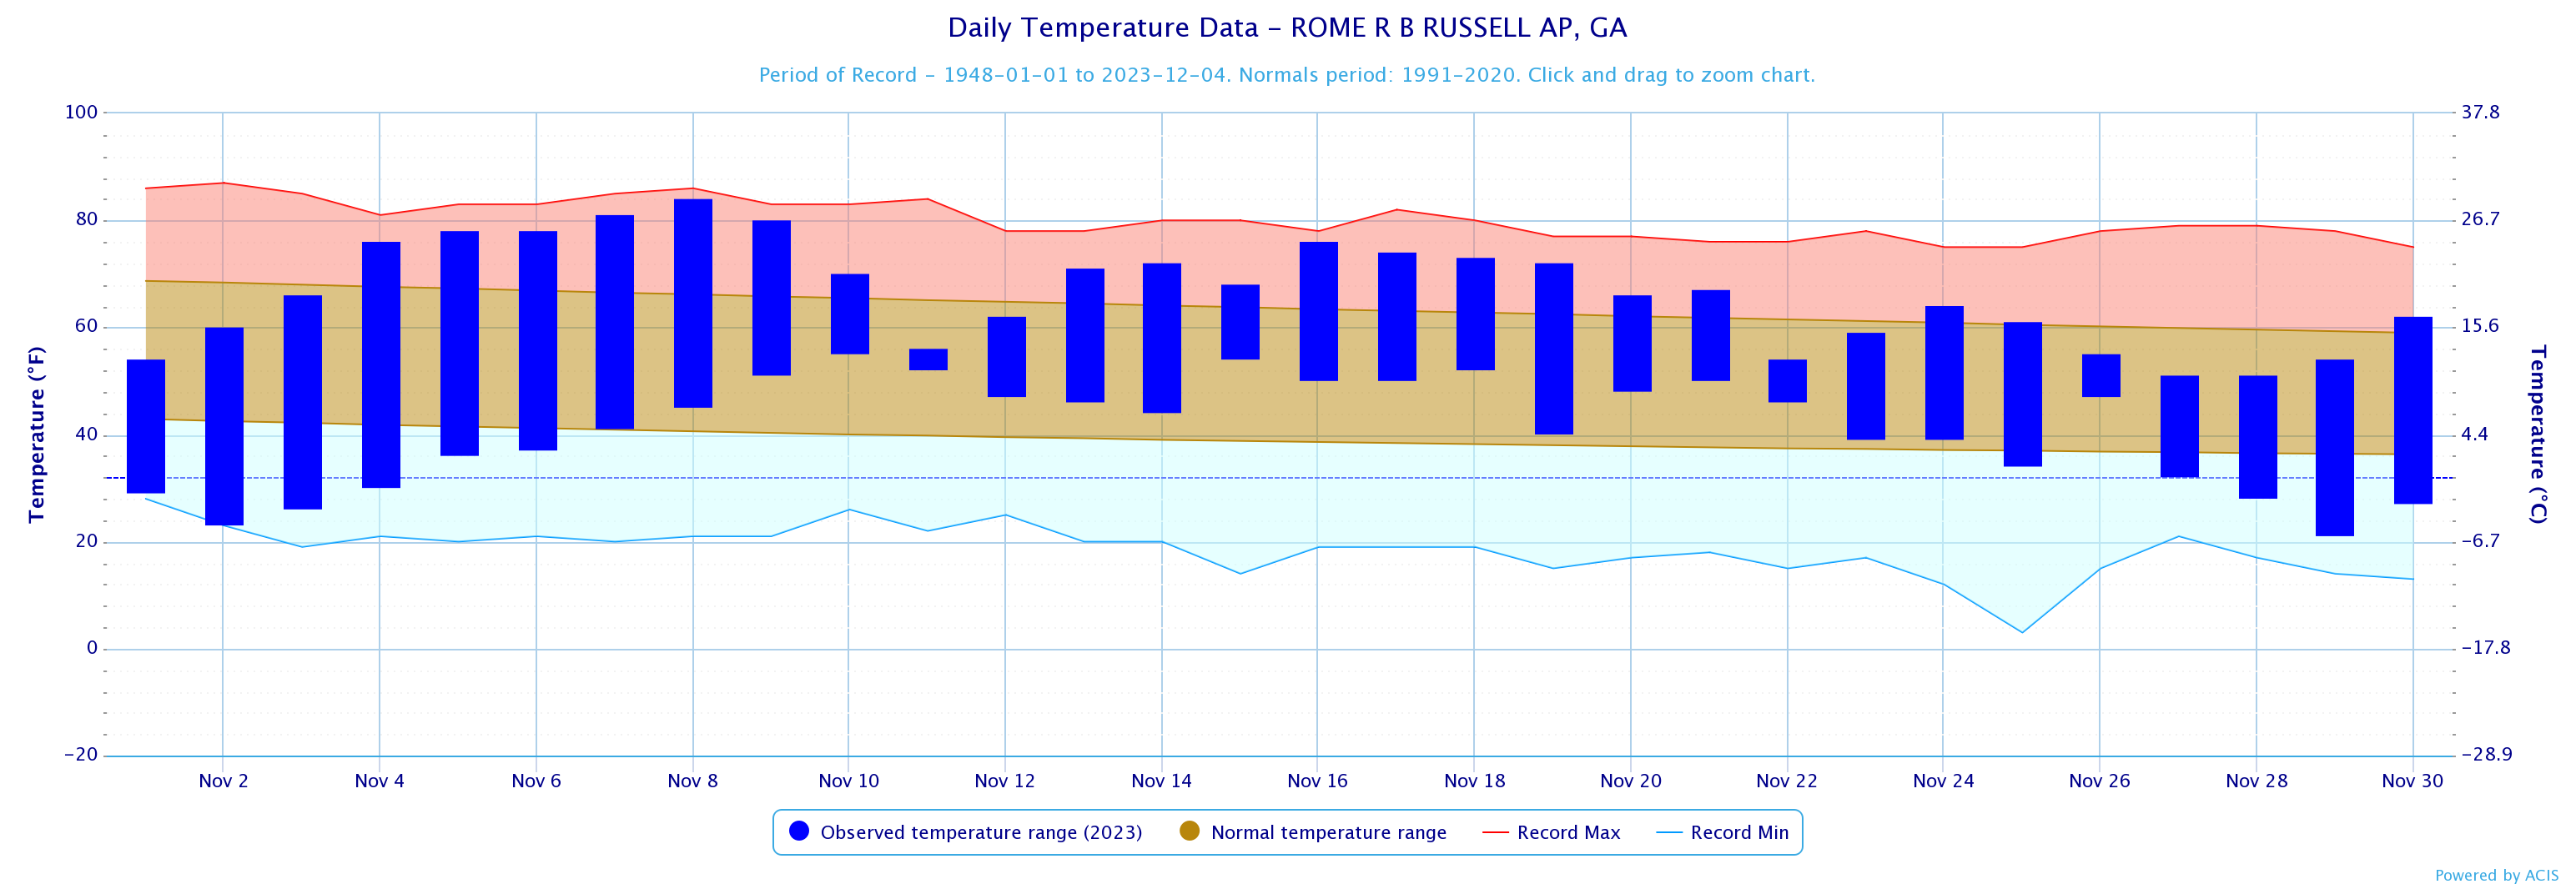
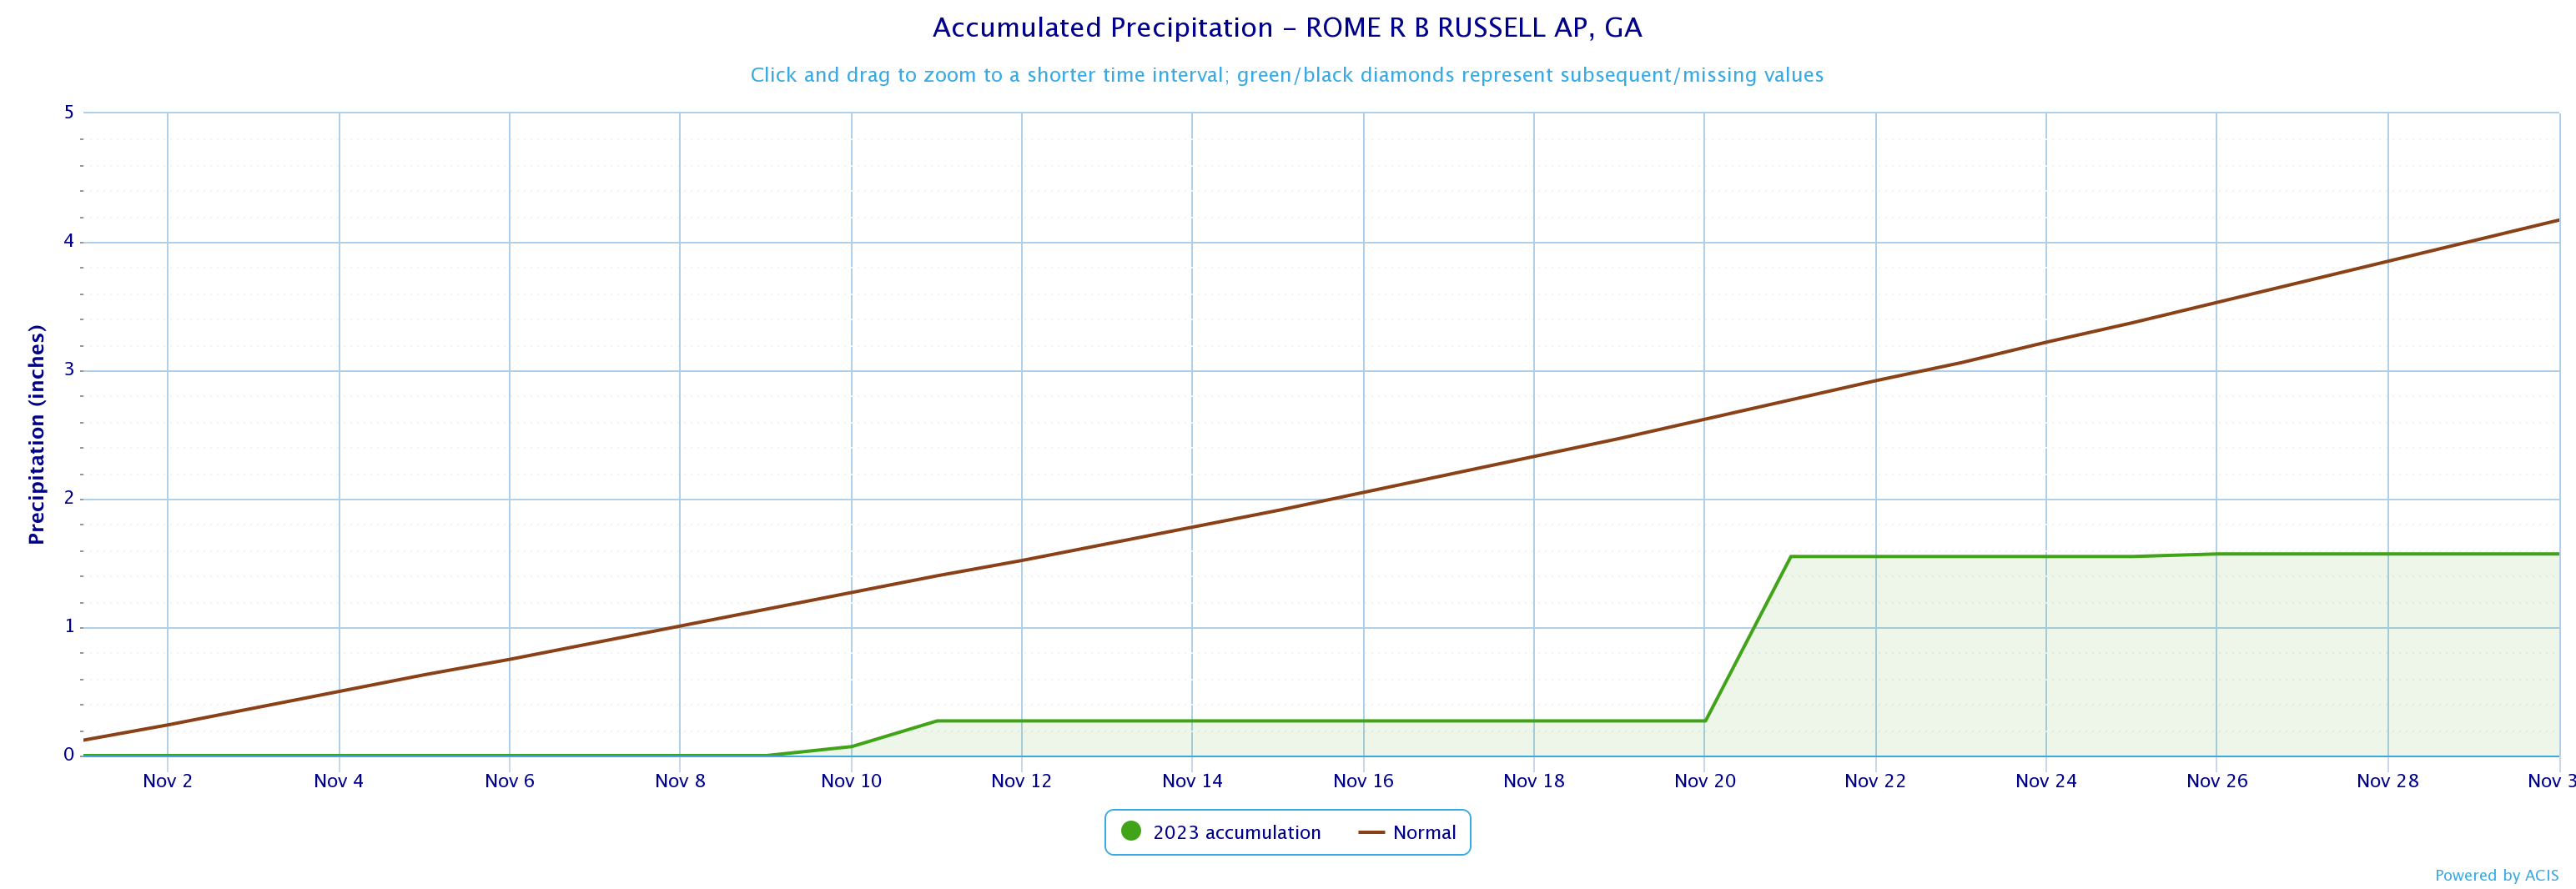
Rome
53.6
51.4
2.2
November 2023 Temperature Climate Statistics
Minimum Temperature
Min T Date
Athens
81
11/8, 9
25
11/29
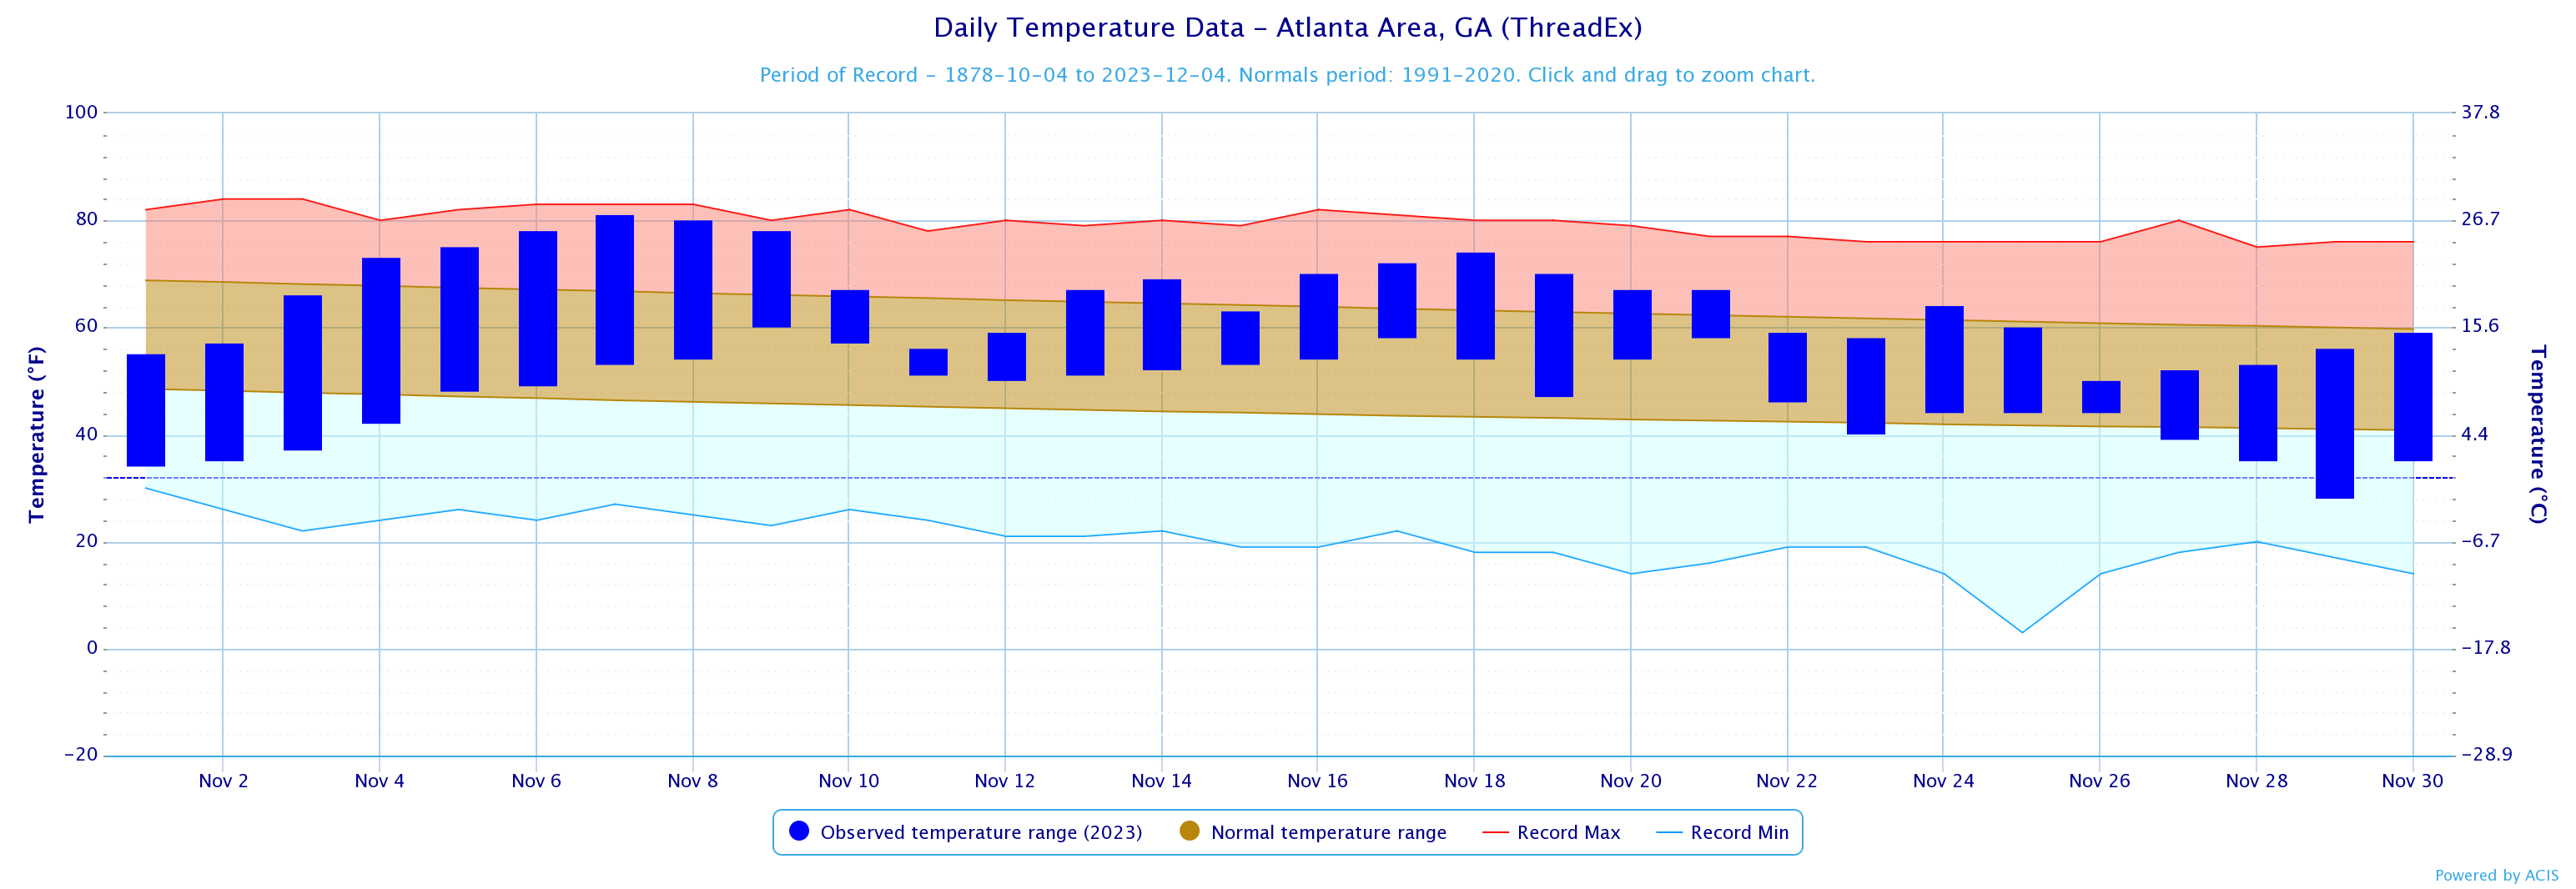
Atlanta
81
11/7
28
11/29
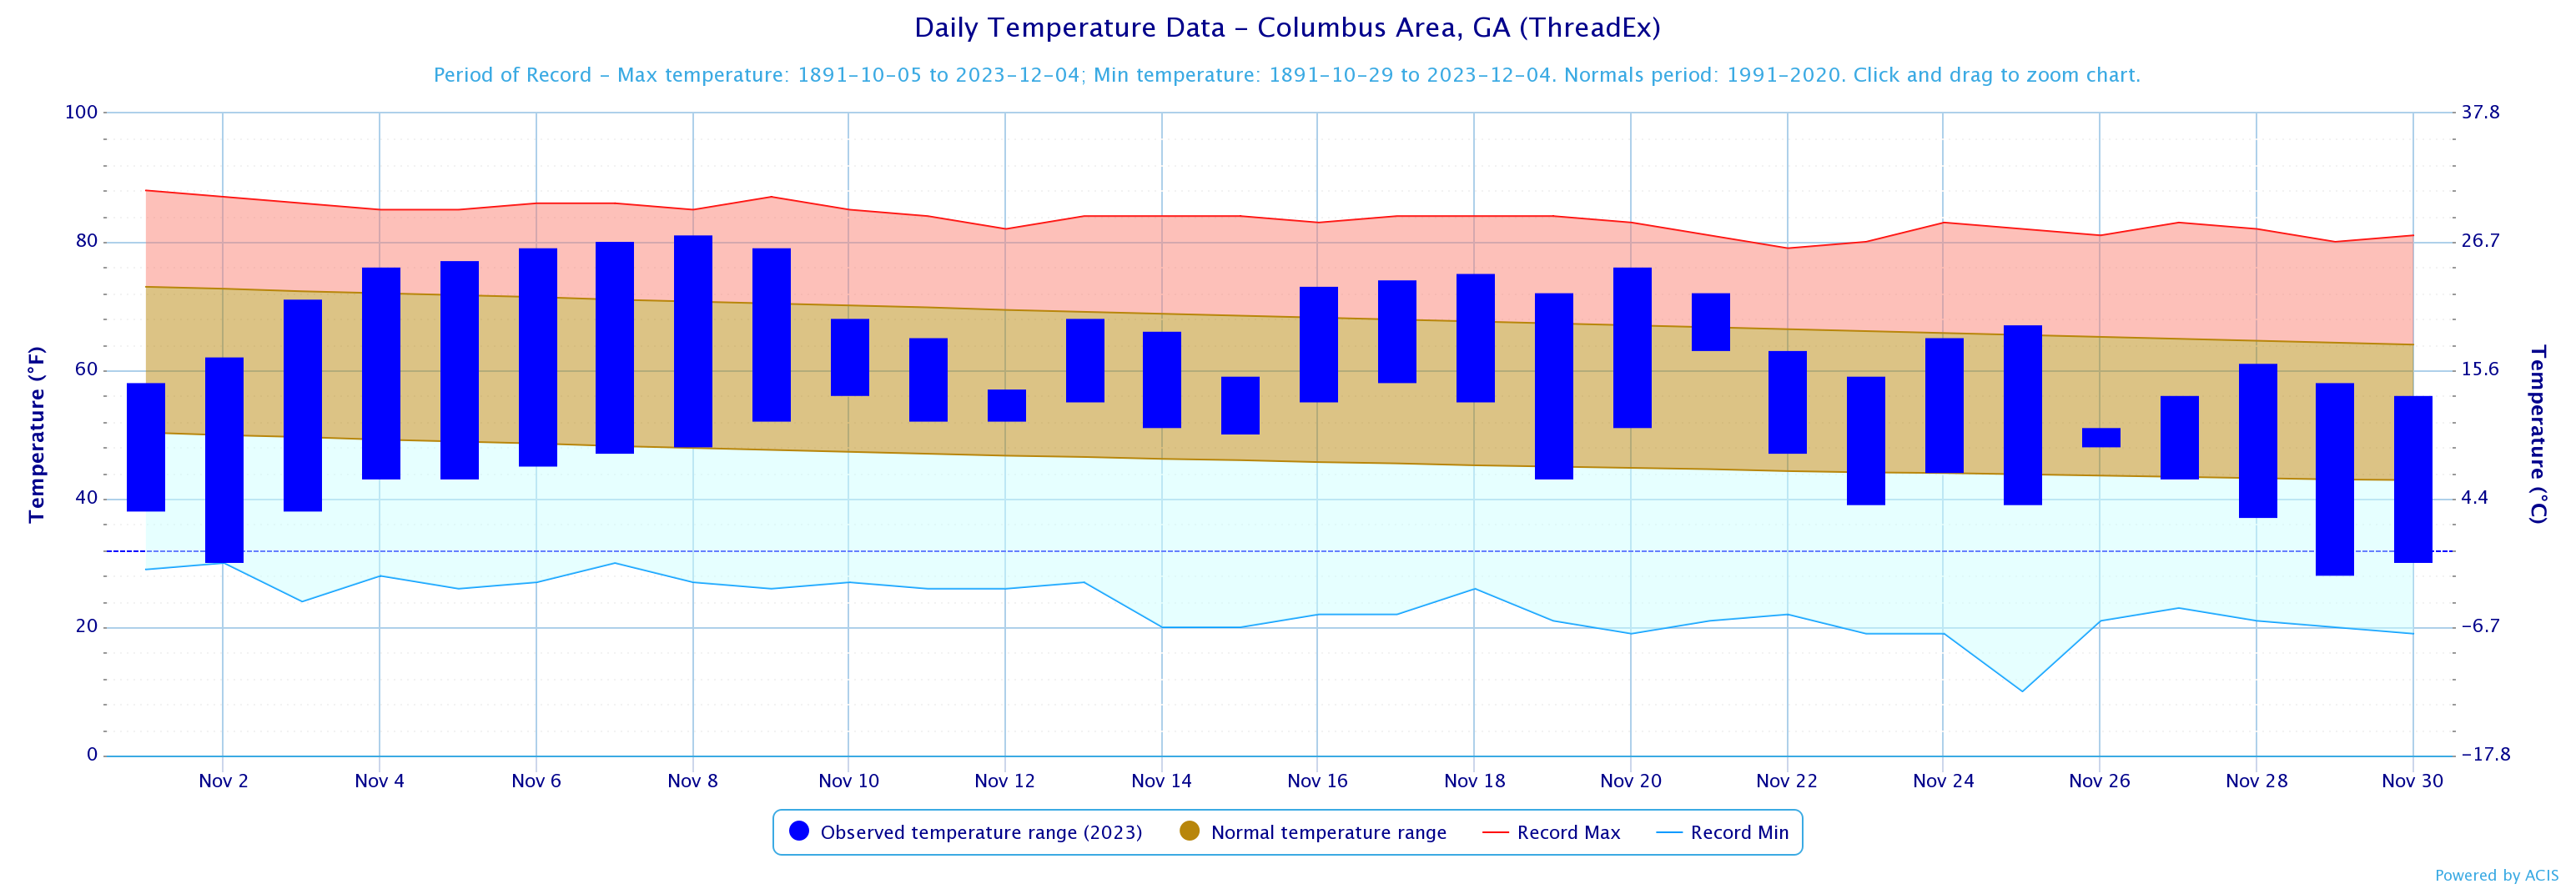
Columbus
81*
11/8
28
11/29
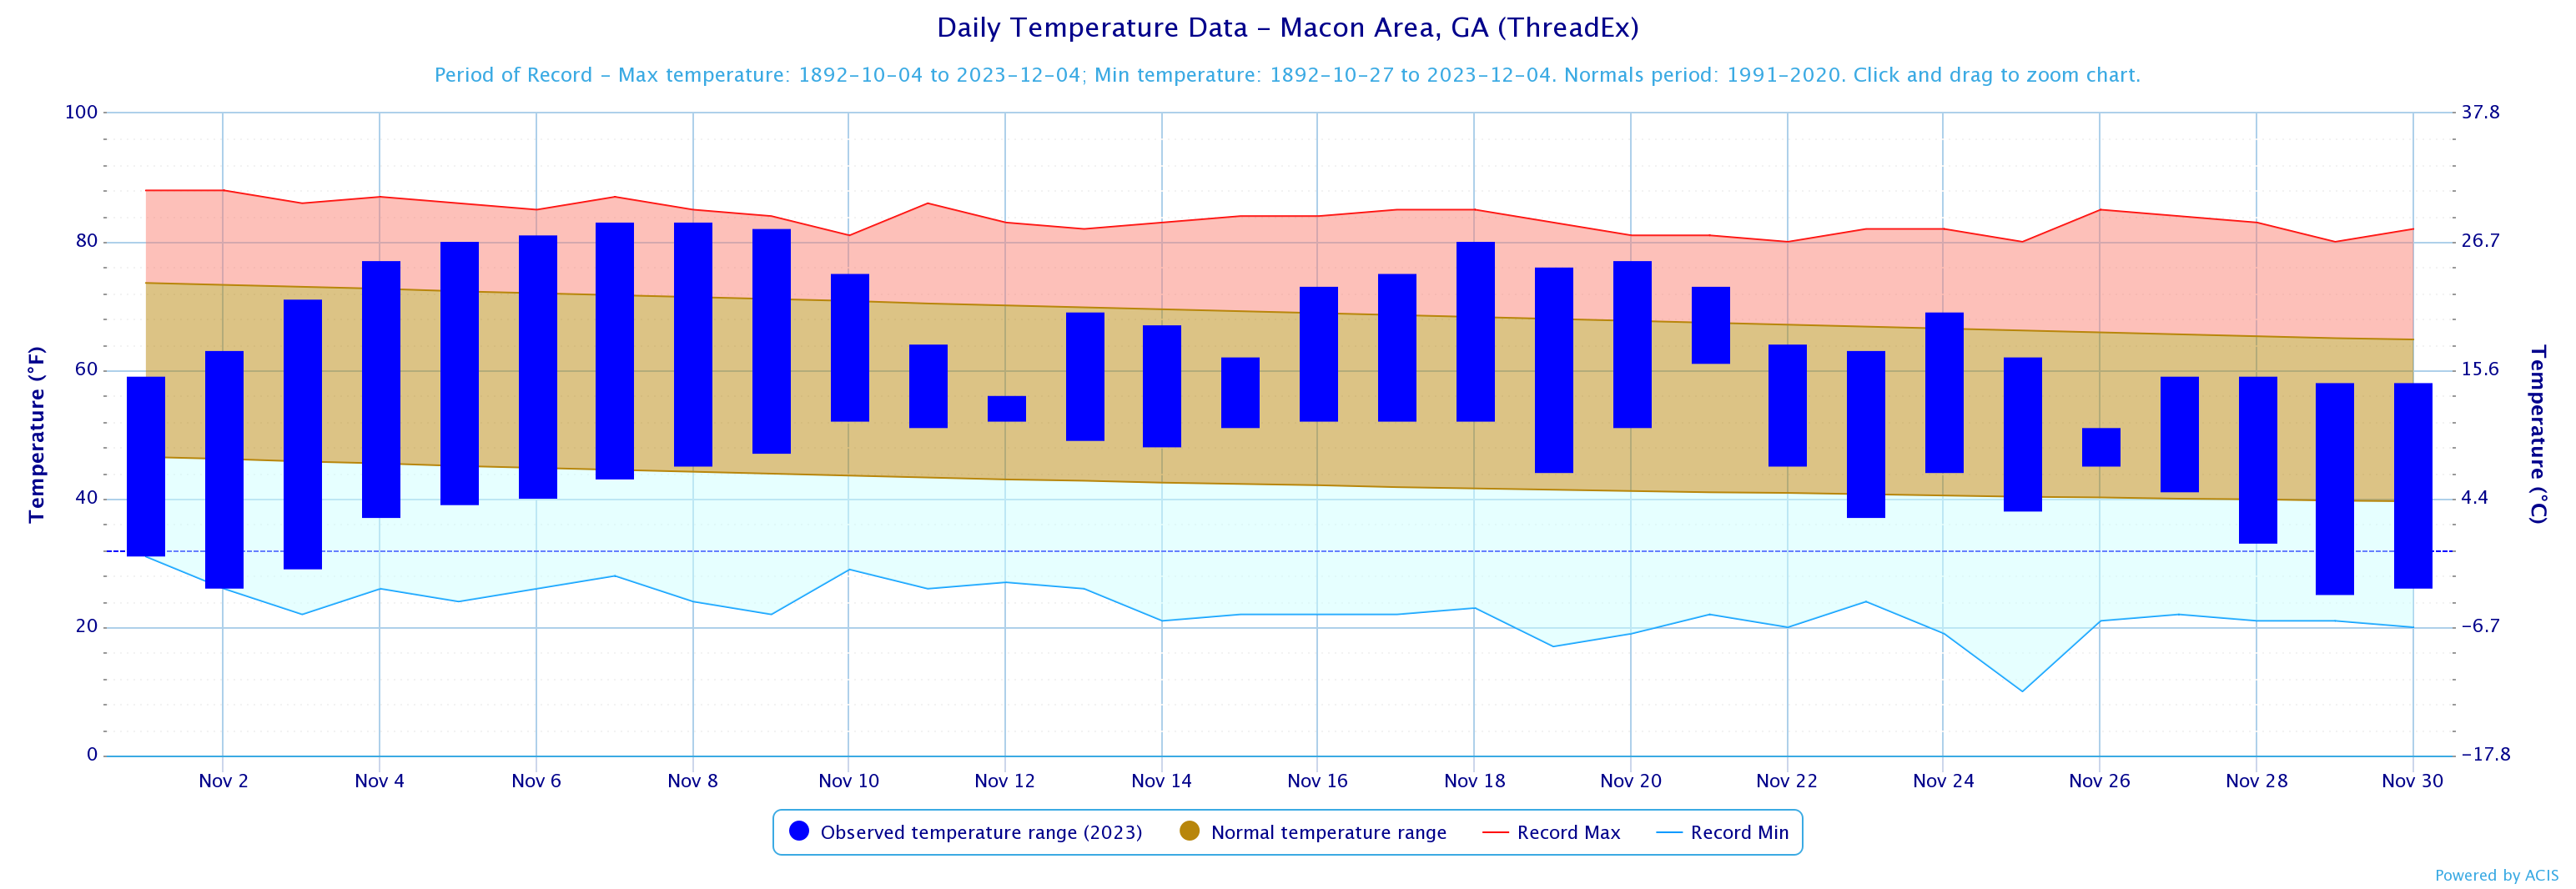
Macon
83*
11/7, 8
25
11/29
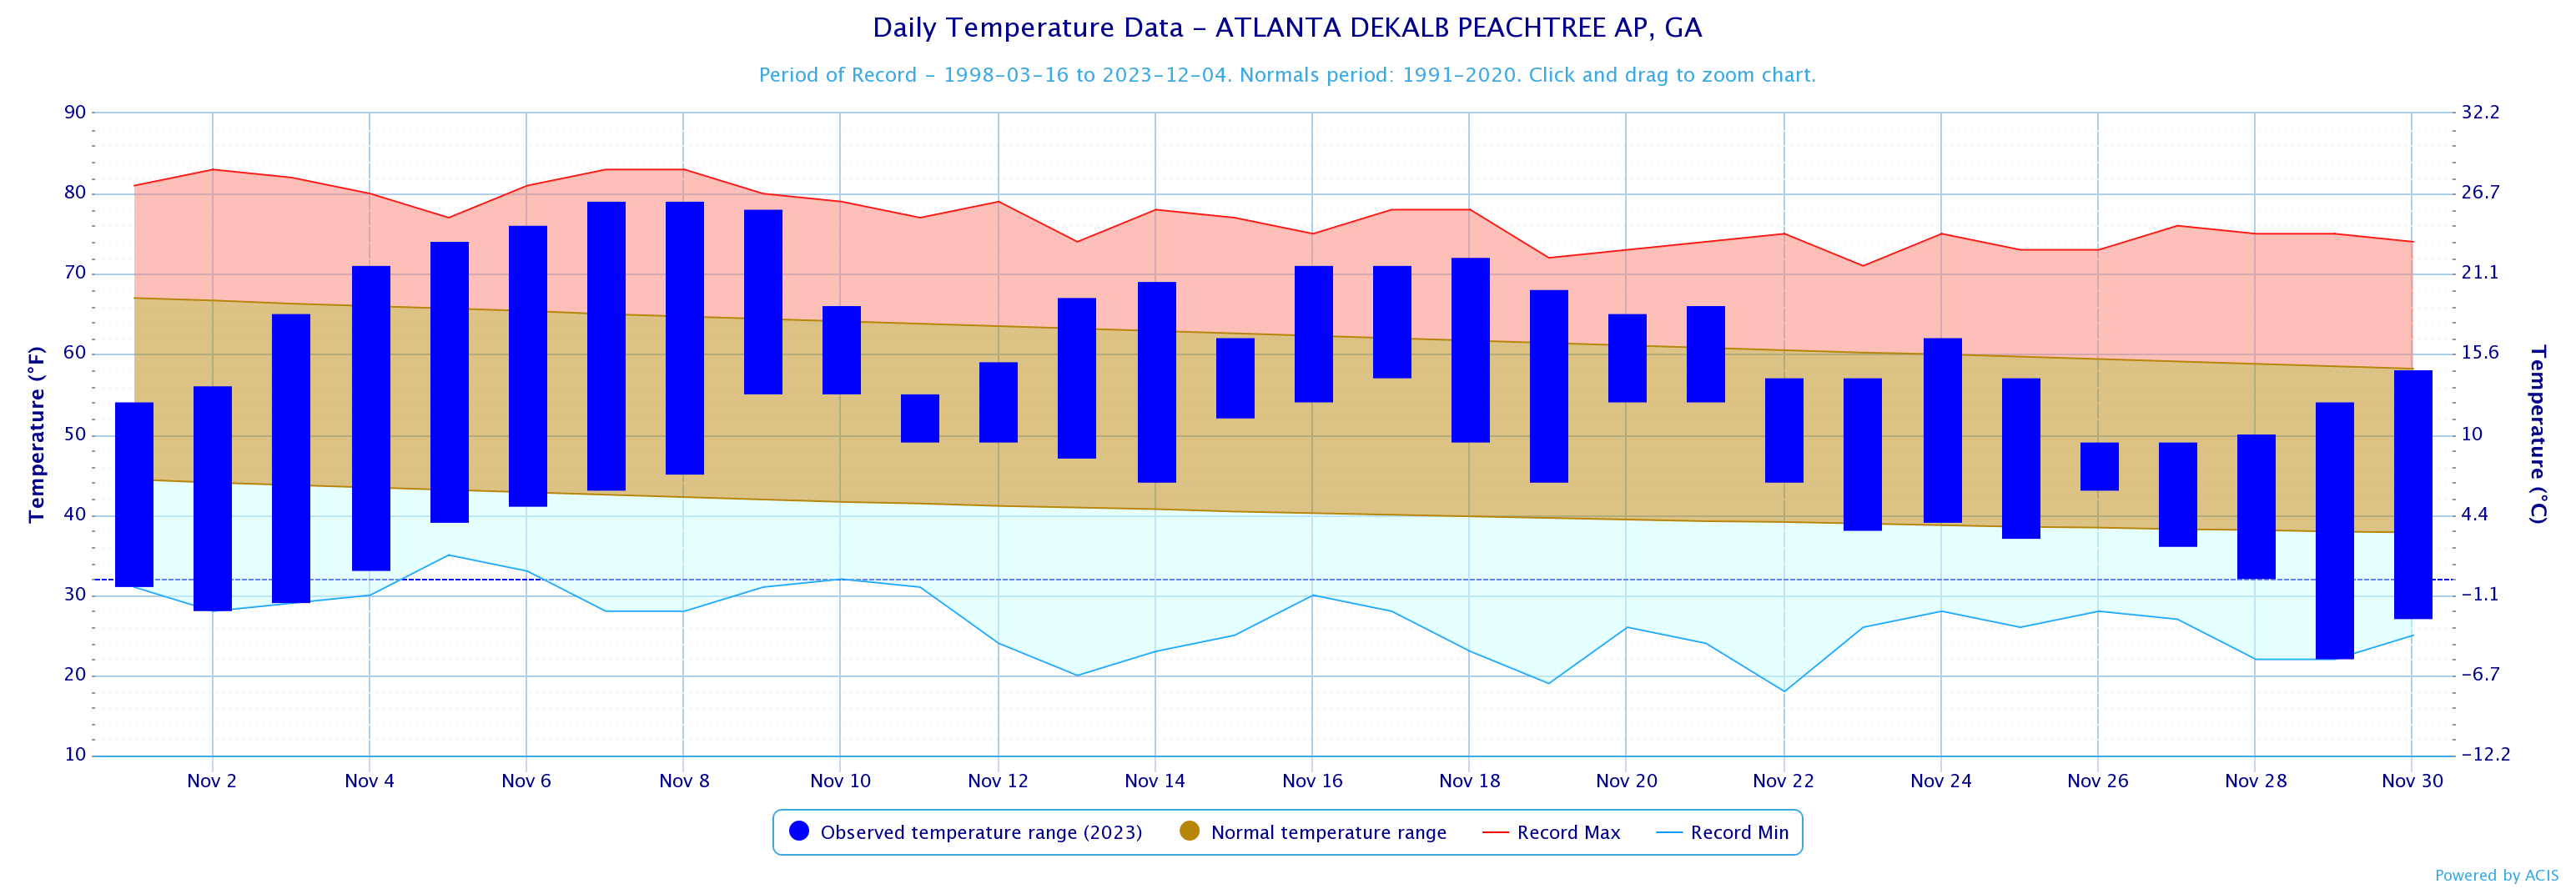
Dekalb Peachtree Arpt
79
11/7, 8
22
11/29
Fulton Co Arpt
81
11/7, 8
27
11/29
Gainesville
79
11/7, 8
27
11/29
Peachtree City
79
11/7, 8
23
11/29
Rome
84
11/8
21
11/29
November 2023 Precipitation Climate Statistics
Average Precipitation
From Normal)
Athens
1.60
3.77
-2.17
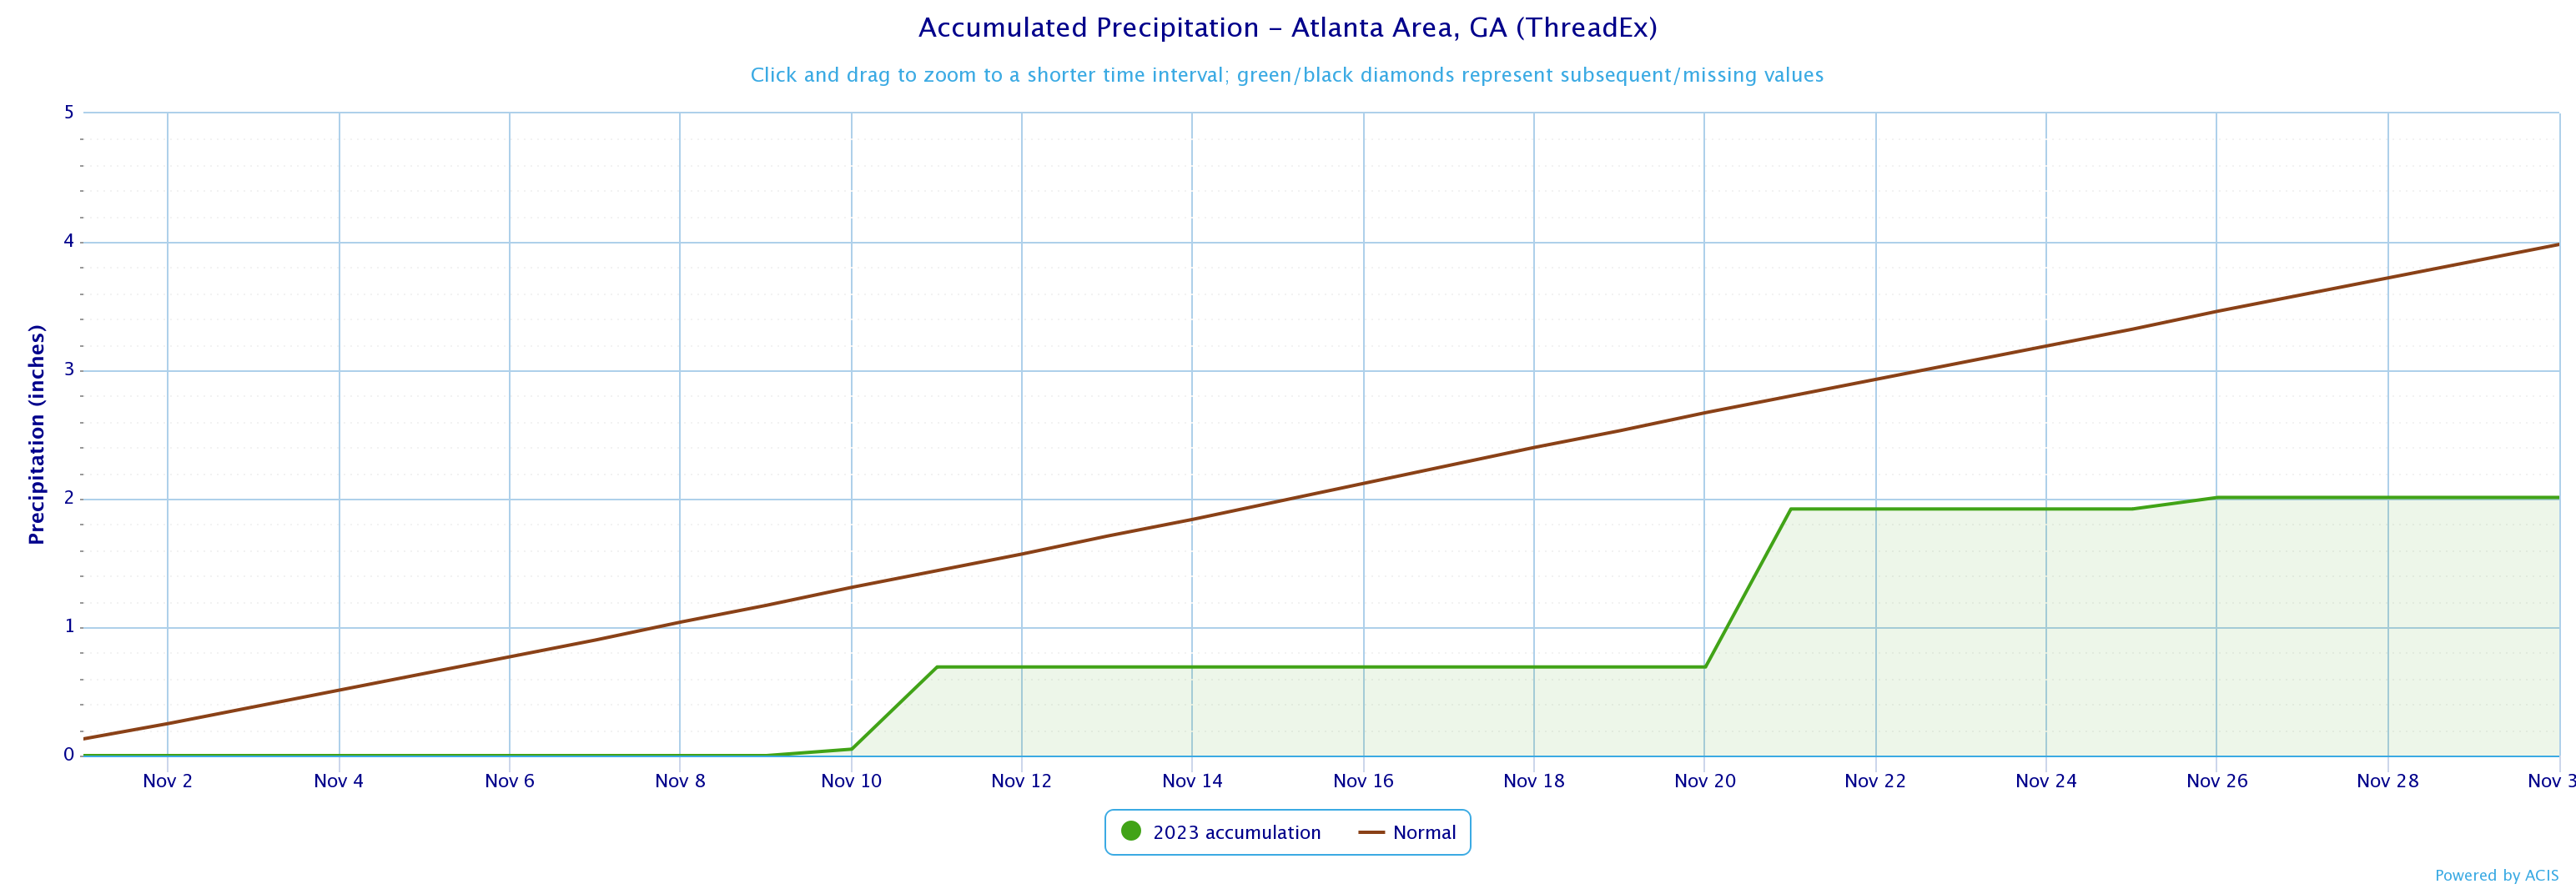
Atlanta
2.01
3.98
-1.97
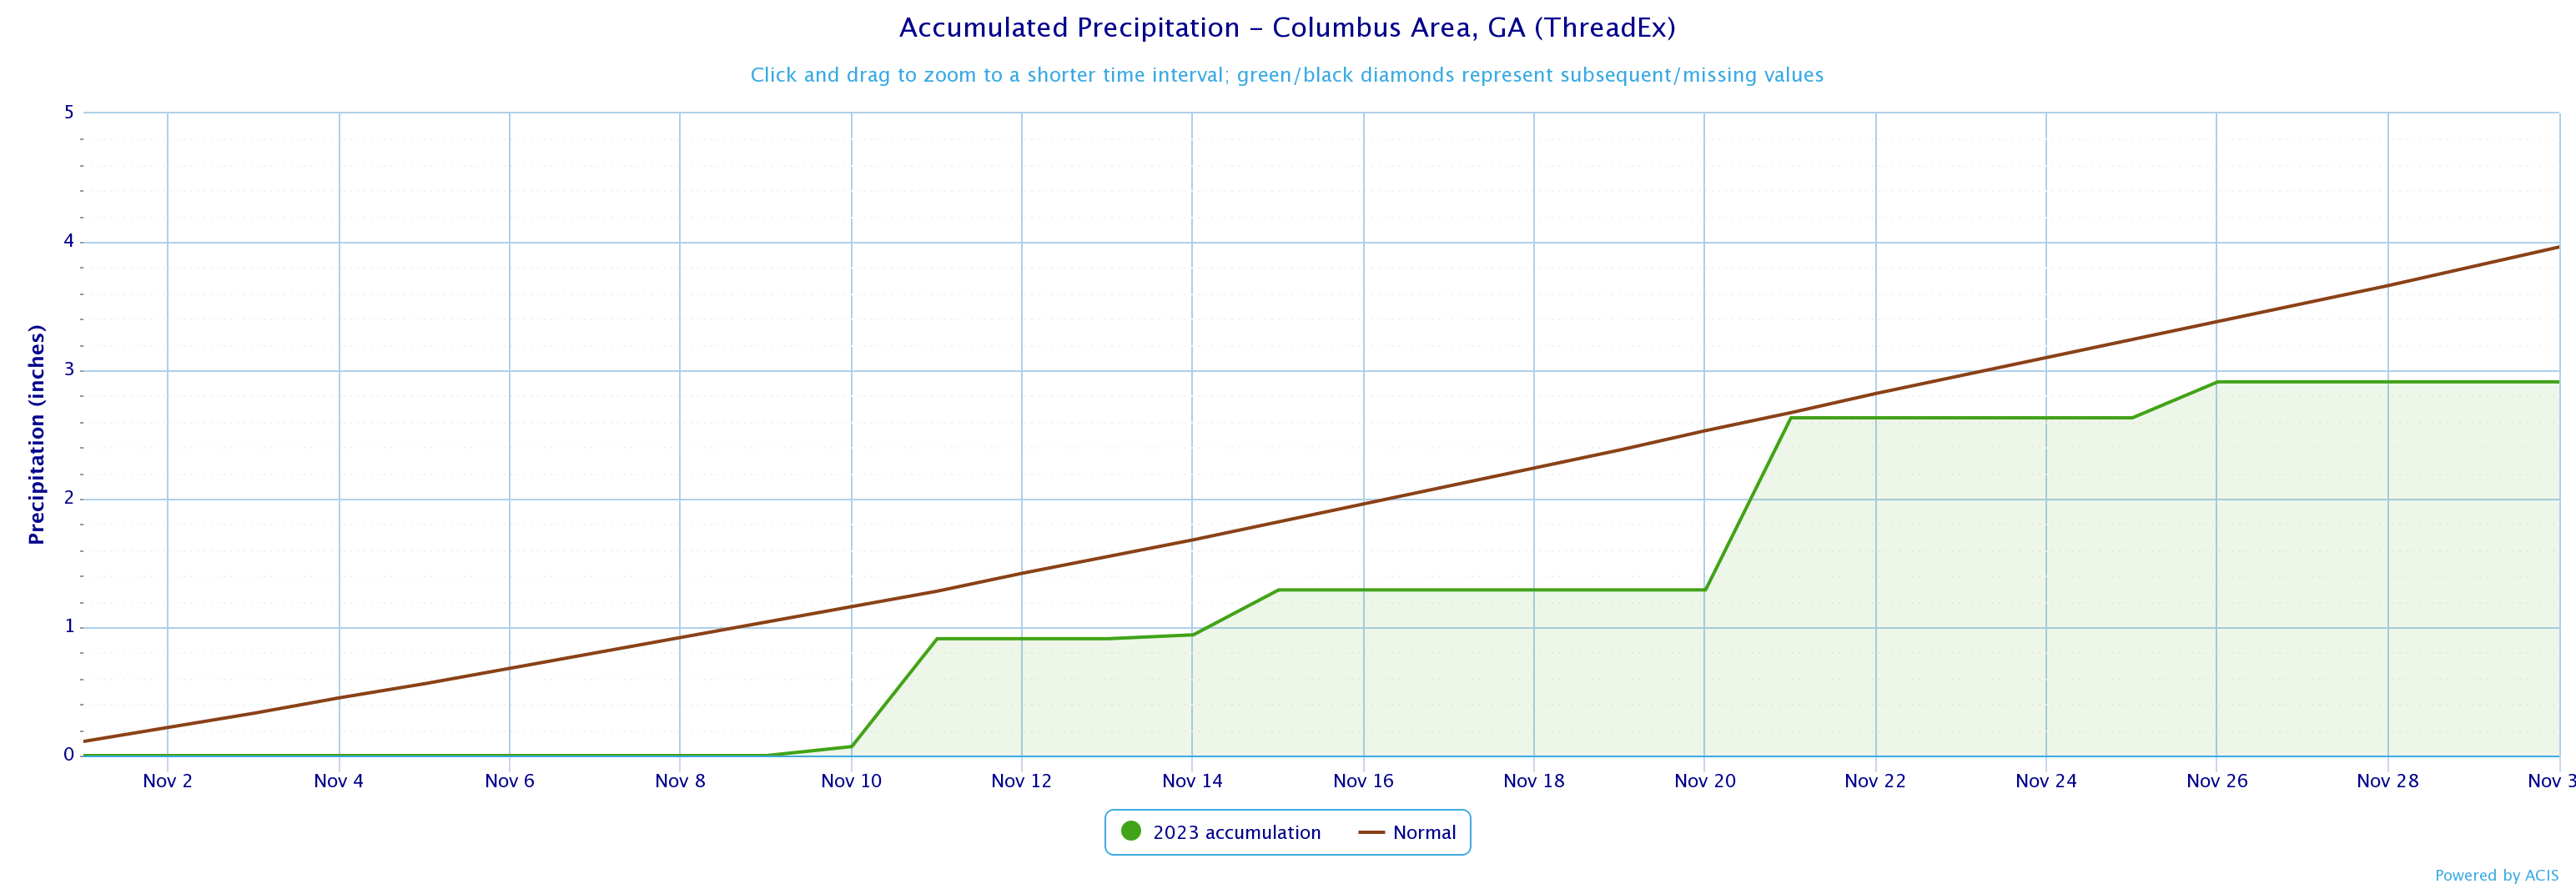
Columbus
2.91
3.96
-1.05
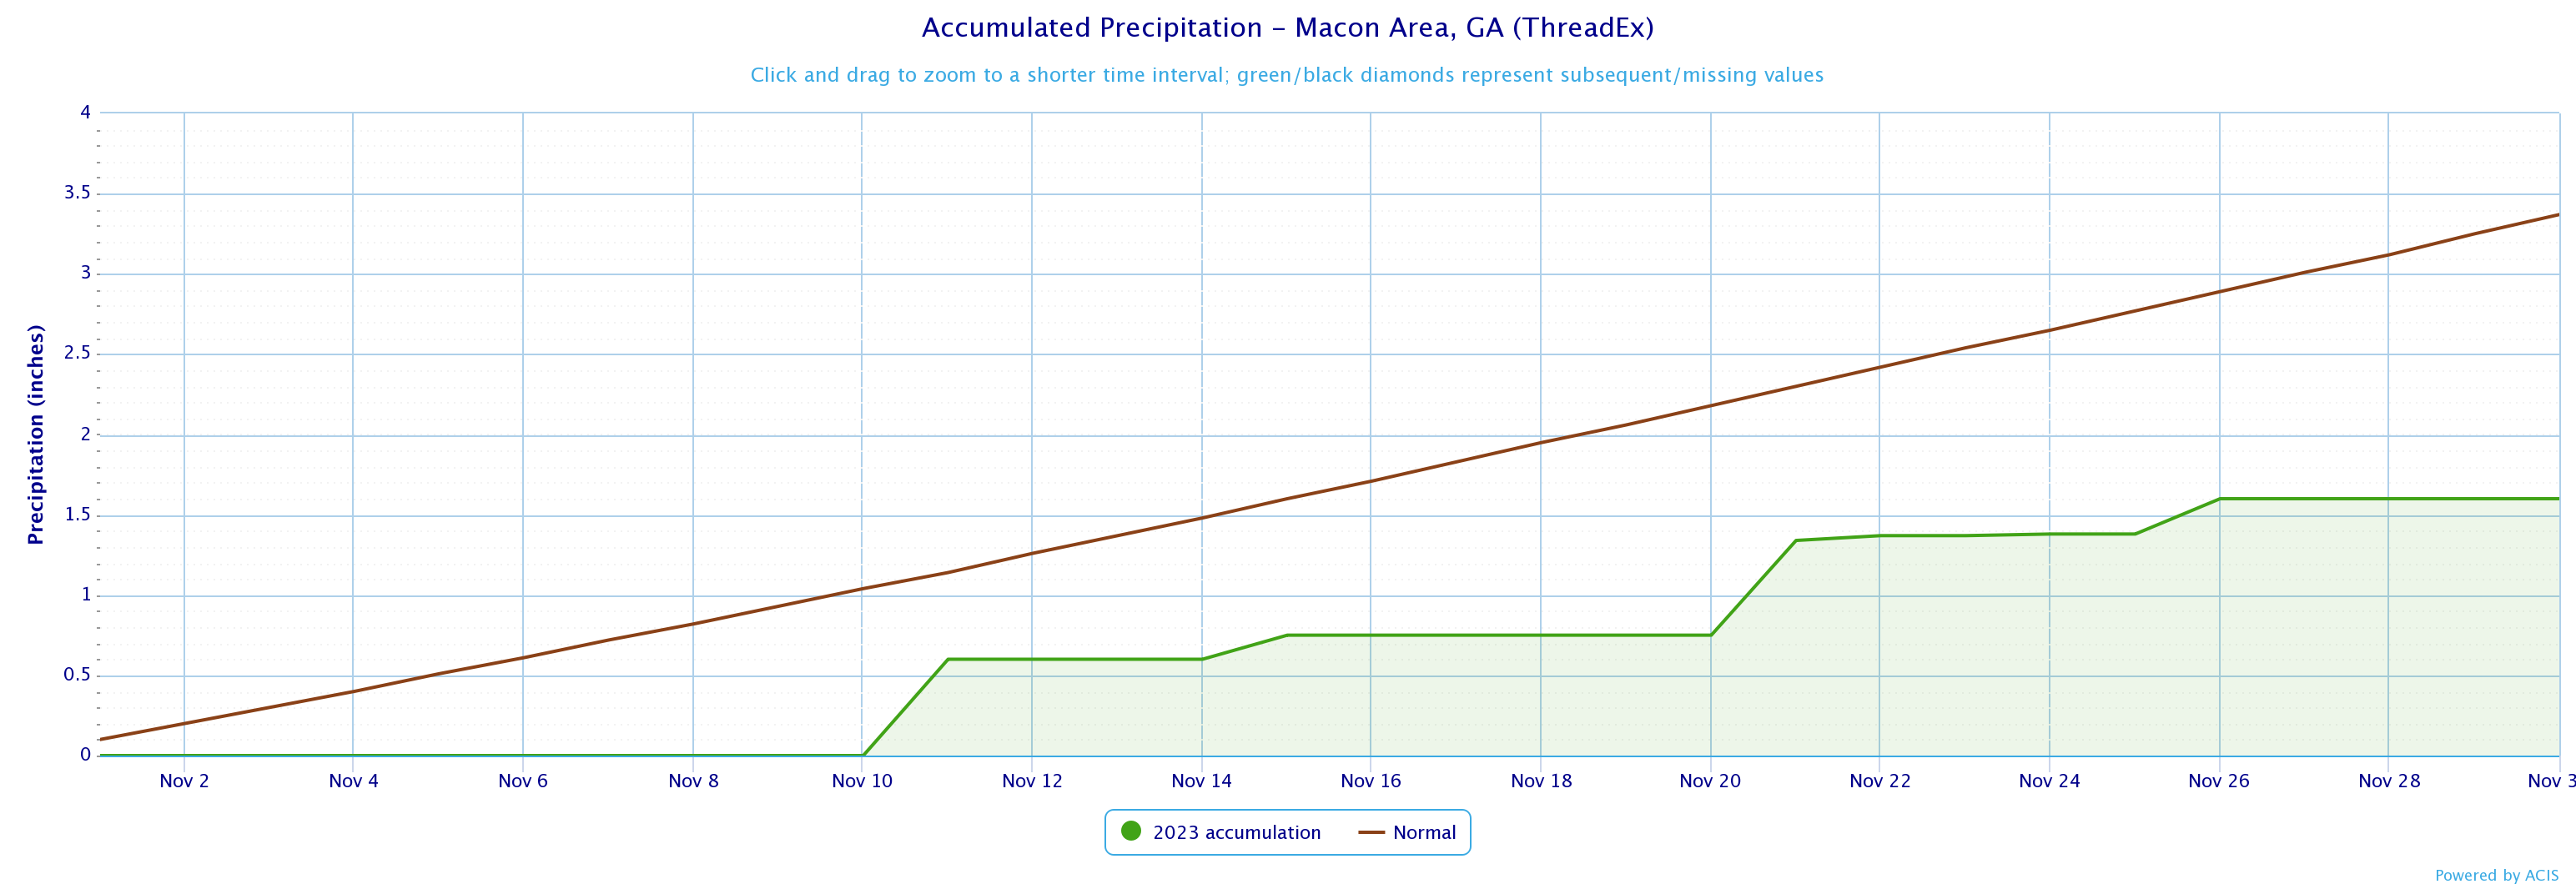
Macon
1.60
3.37
-1.77
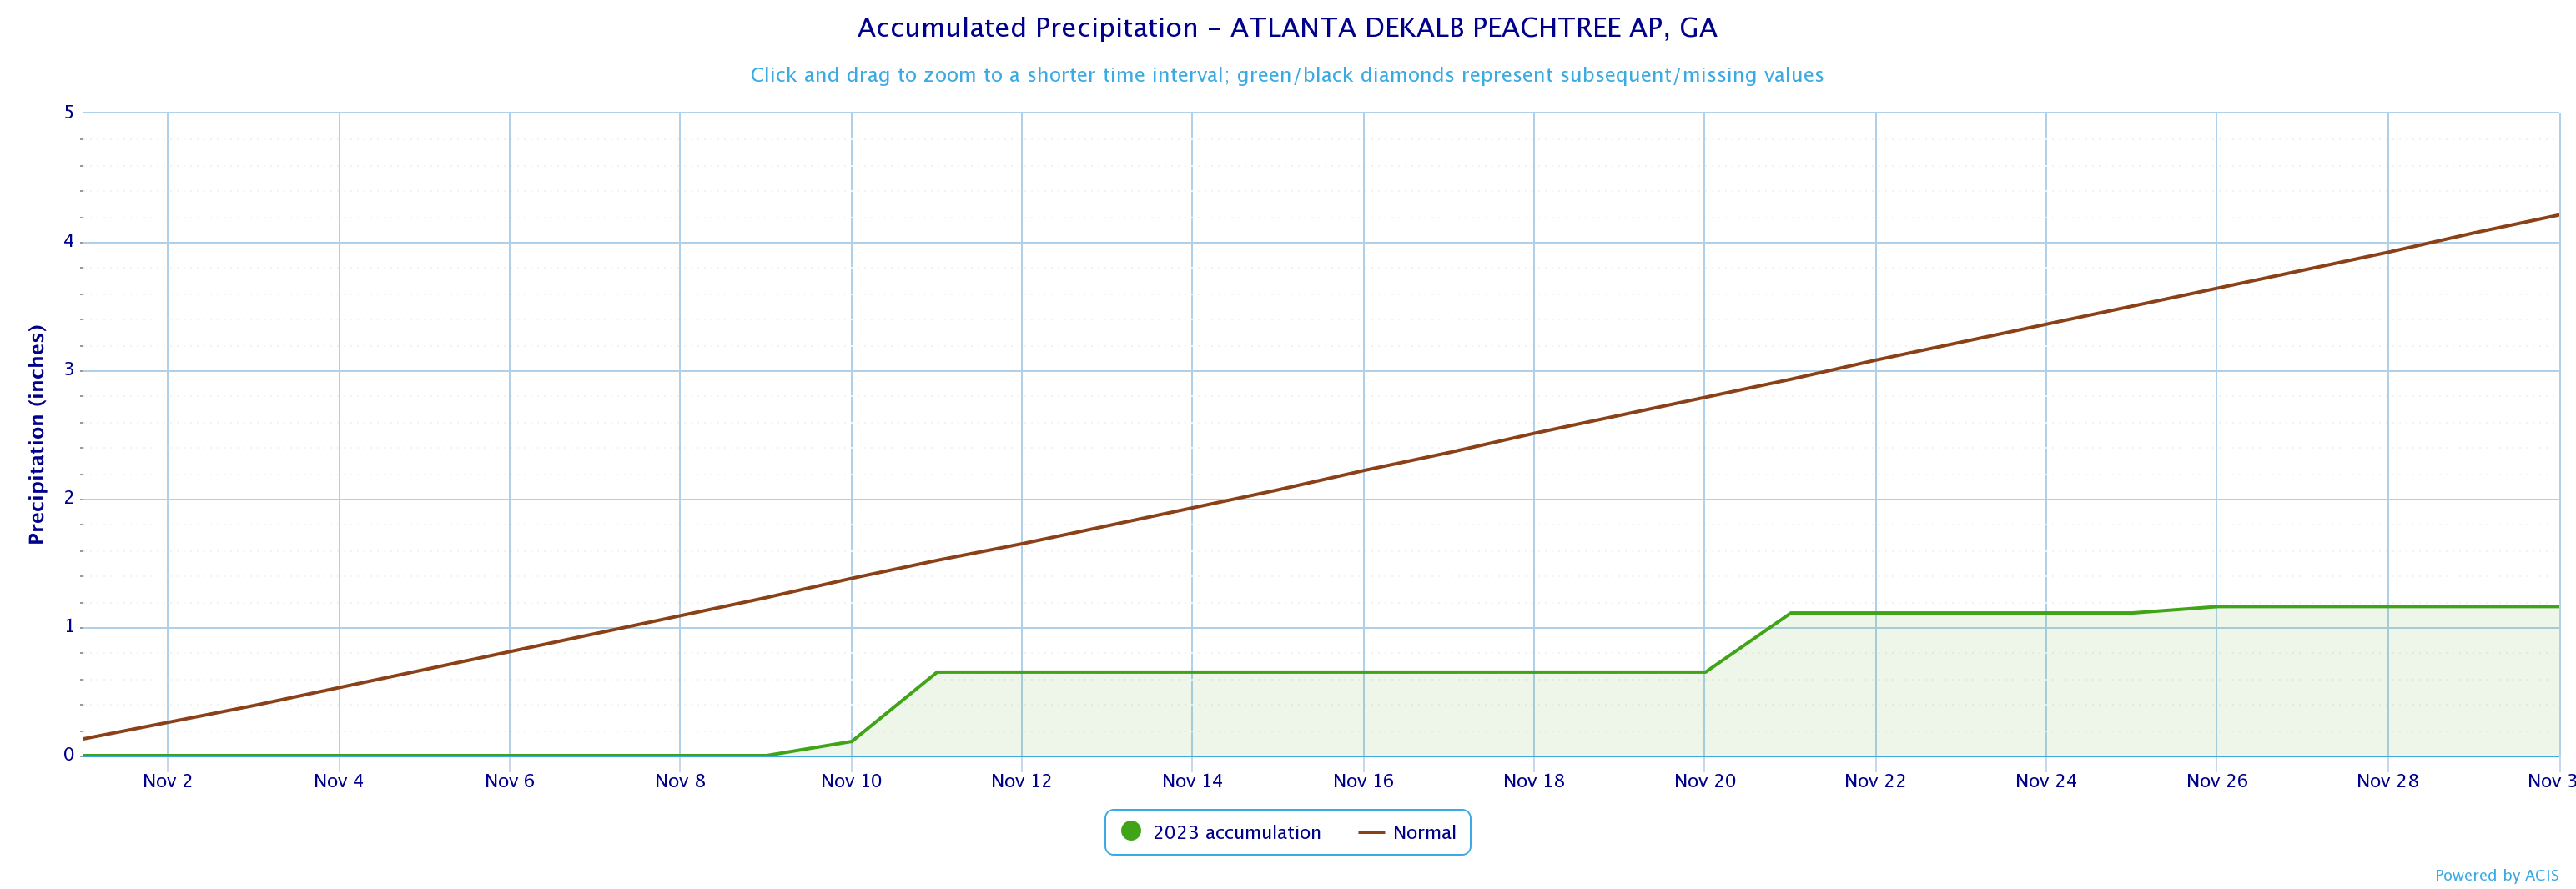
Dekalb Peachtree Arpt
1.16
4.21
-3.05
Fulton County Arpt
1.20
3.77
-2.57
Gainesville
0.92
4.18
-3.26
Peachtree City
2.28
3.91
-1.63
Rome
1.57
4.17
-2.60
November 2023 Precipitation Climate Statistics
Athens
0.88
11/21
Atlanta
1.23
11/21
Columbus
1.34
11/21
Macon
0.62
11/21
Dekalb Peachtree Arpt
0.62
11/11
Fulton Co Arpt
0.65
11/10
Gainesville
0.65
11/21
Peachtree City
1.04
11/21
Rome
1.28
11/21
Click the links below to explore the temperature and precipitation data across north and central Georgia for the month of November 2023.
Temperature Maps
Precipitation Maps
Temperature Graphs
Precipitation Graphs
Temperature and precipitation records at our 4 main climate sites are located below.
November 2023 Climate Records
Date
Type
Location
Records set over a 24 hour period
11/3
Min Temp
Columbus
Columbus fell to 29°F which ties the record set in 1954
11/3
Min Temp
Macon
Macon fell to 26°F which breaks the record of 29°F in 1994
No significant weather events occurred across north and central Georgia this past November.
The December climate outlook is below.
December Outlook