| Previous Month | Next Month |
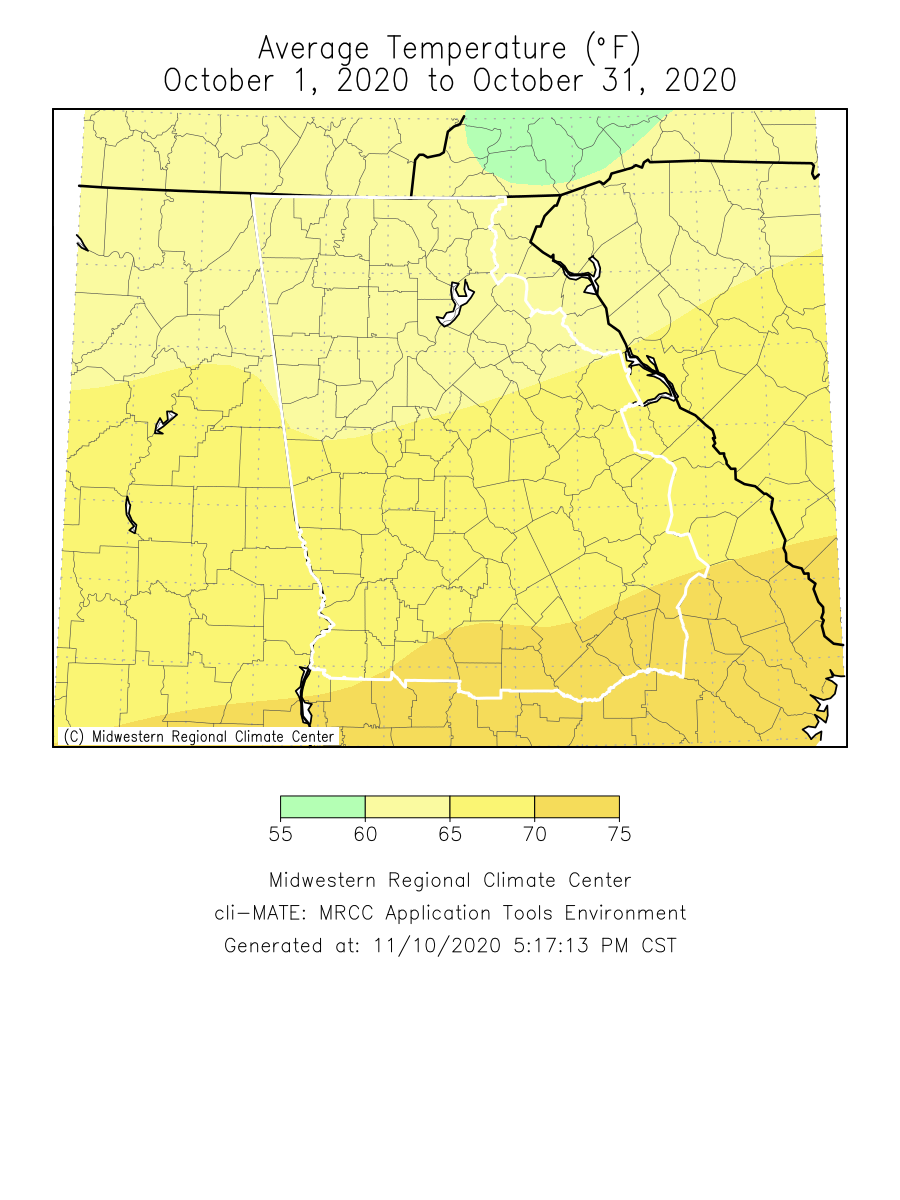
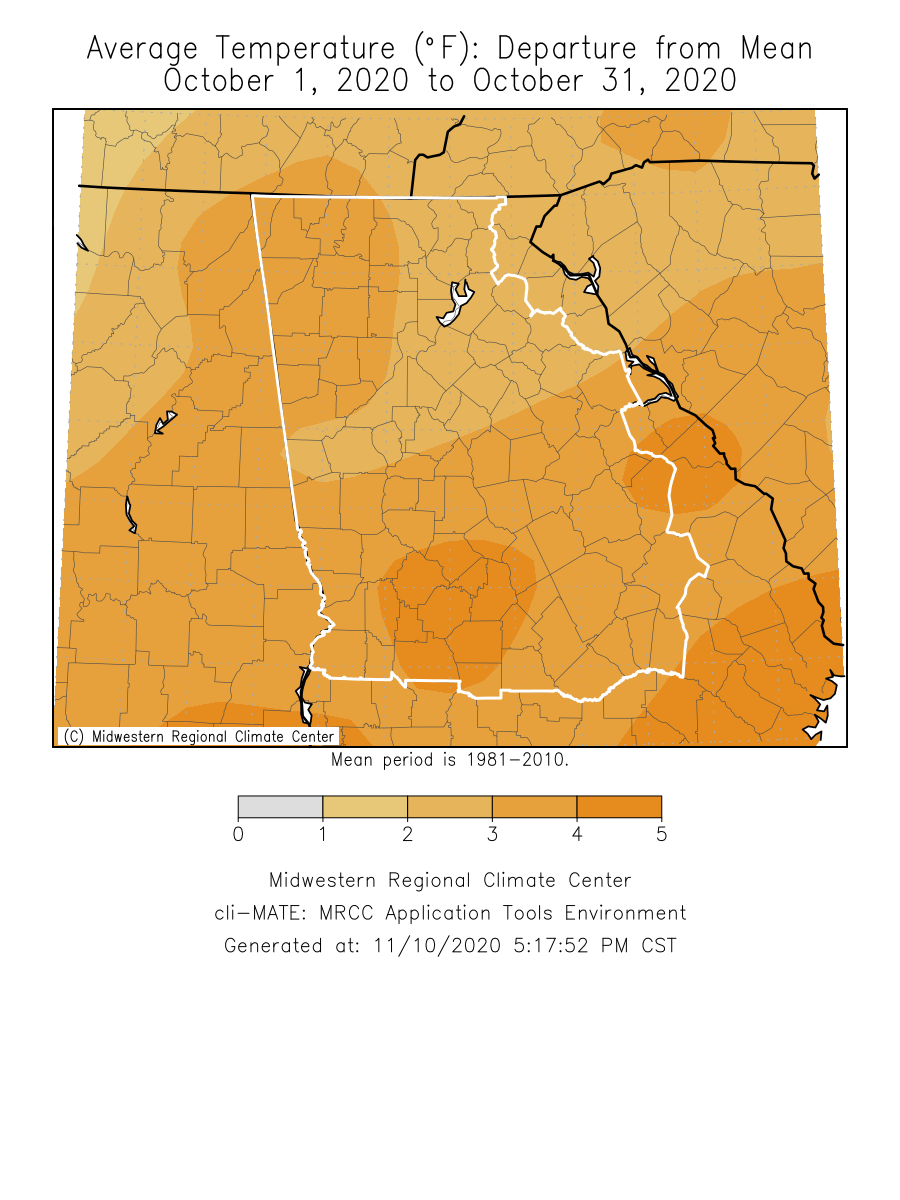
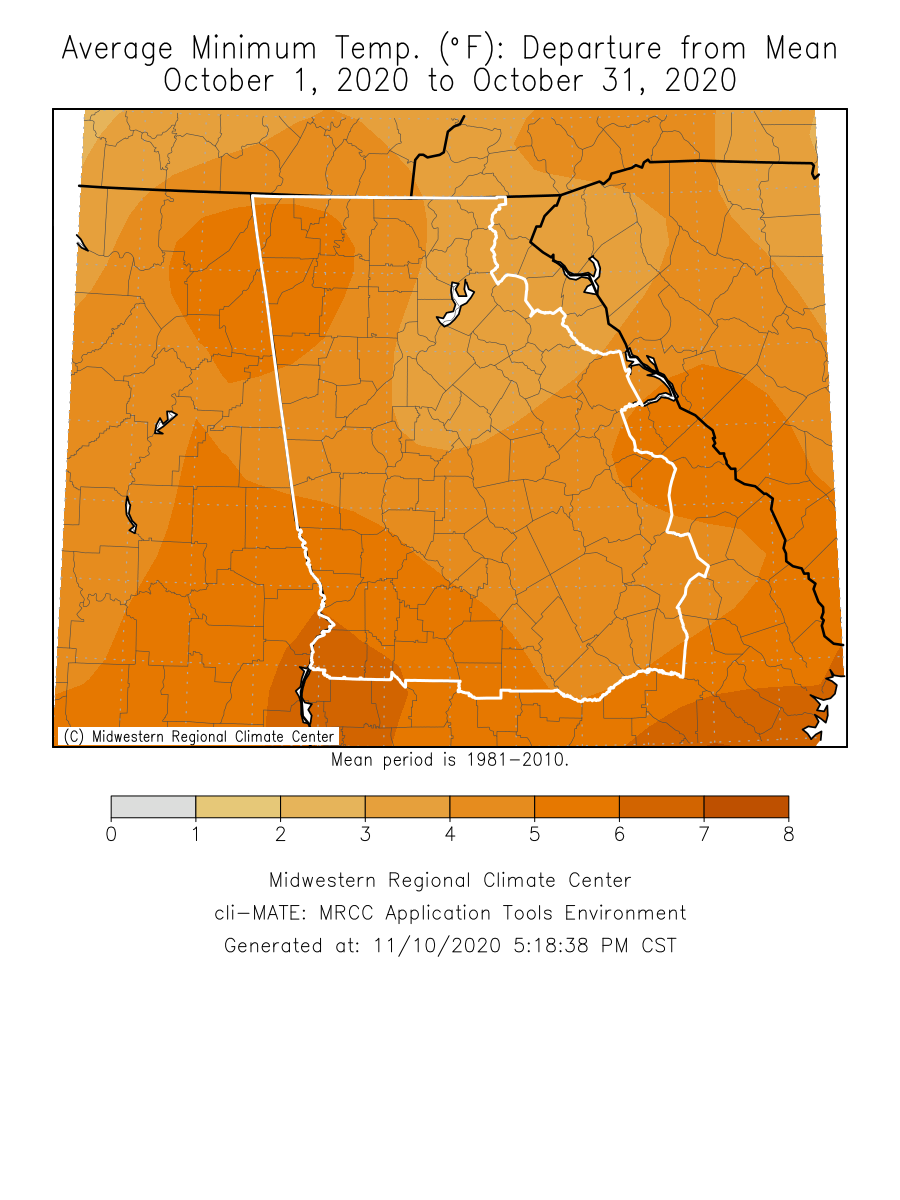
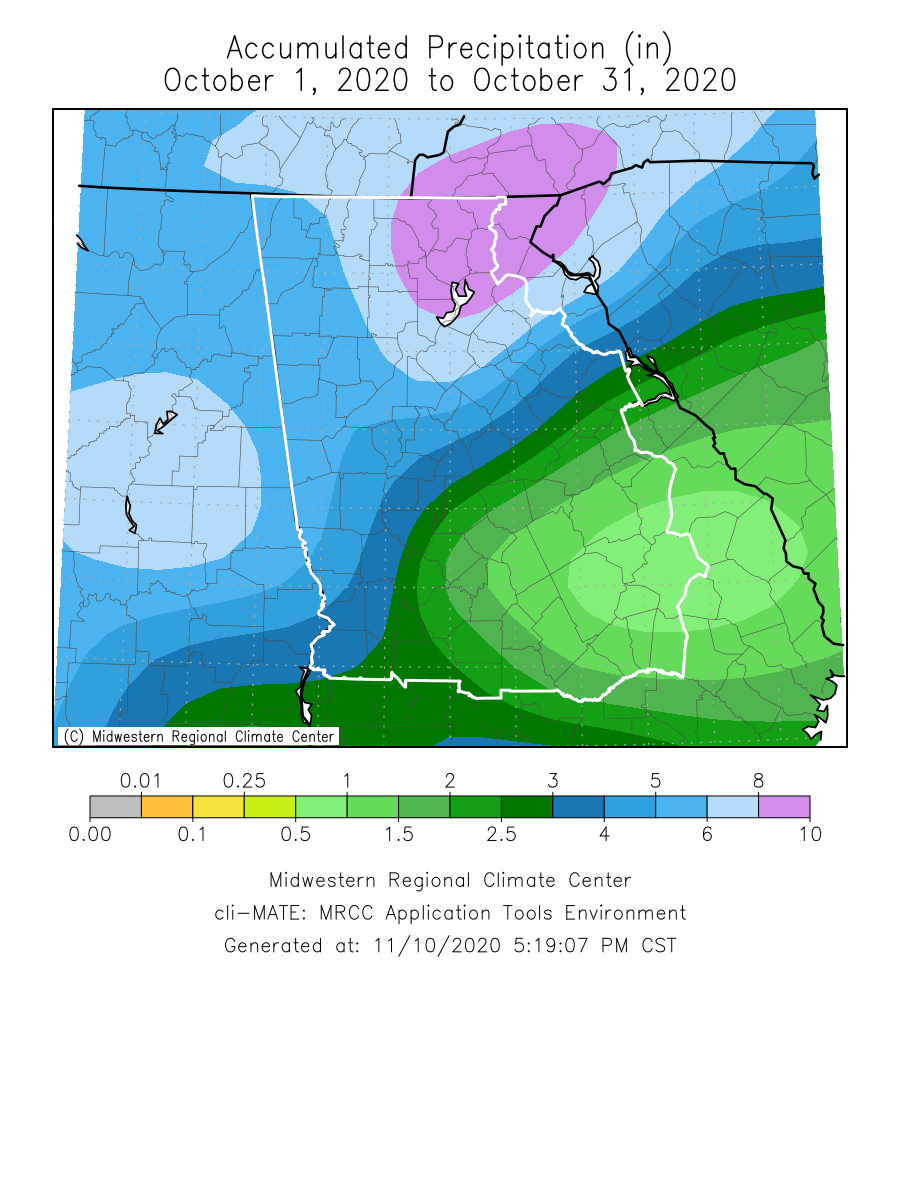
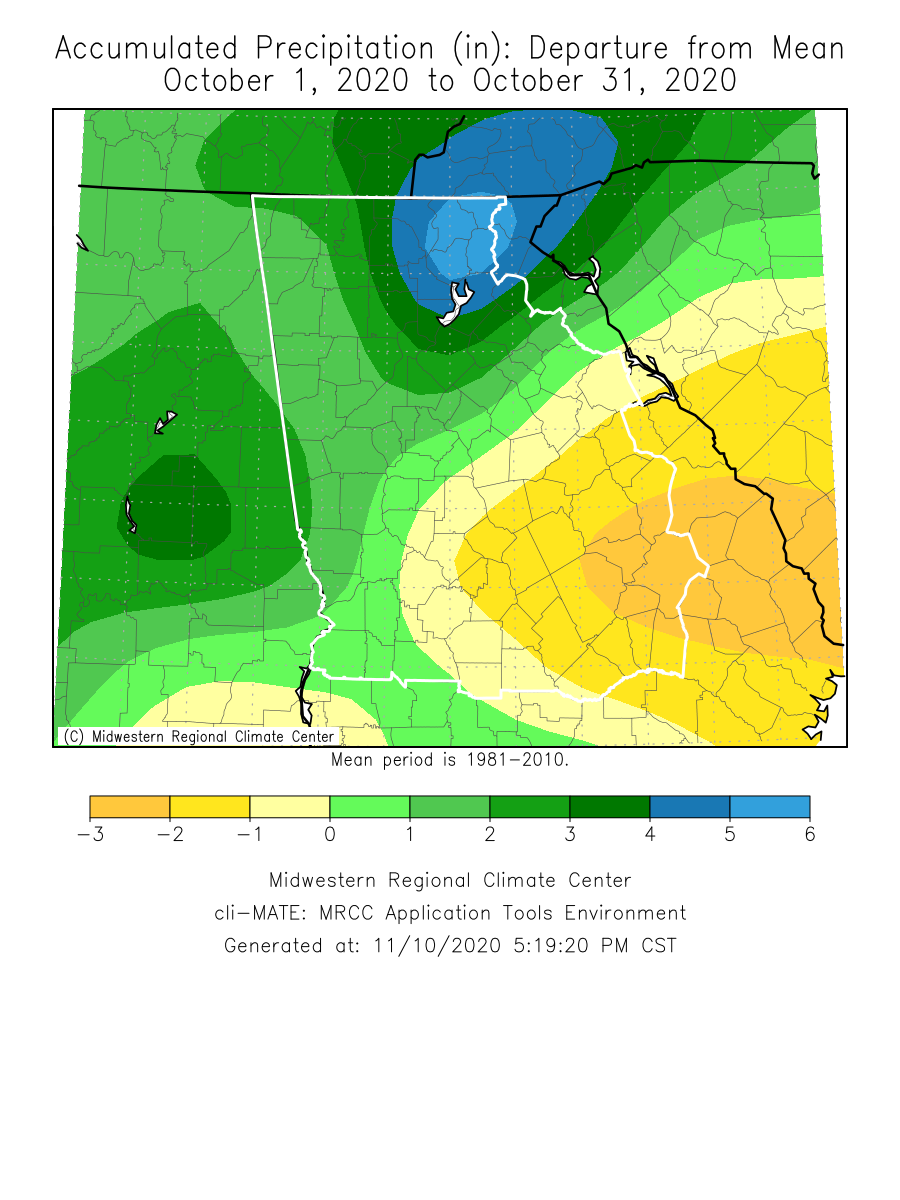
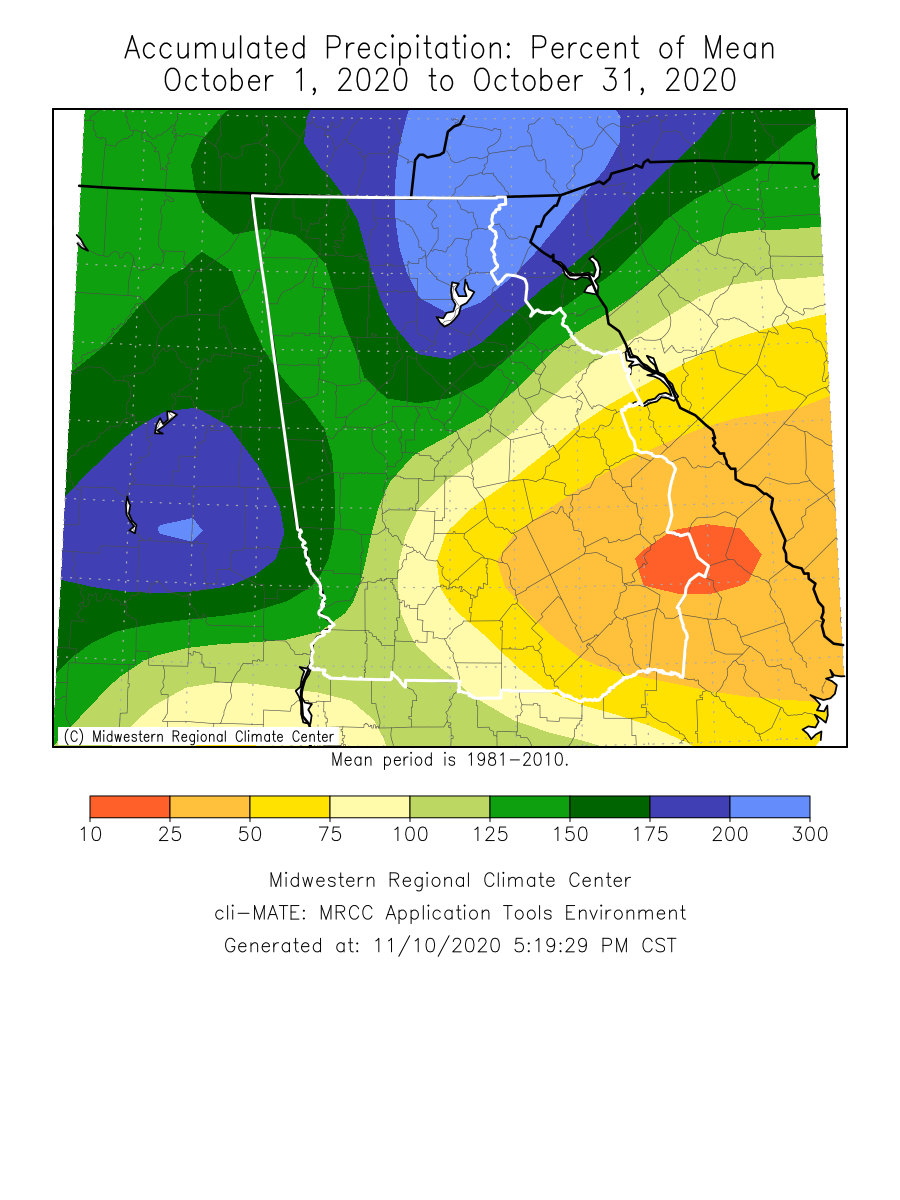
Temperatures through the month of October were 2 to 5 degrees warmer than normal. Precipitation through the month of October was around 1 to 4 inches above normal.
Top 10 Records At Our 4 Main Climate Sites
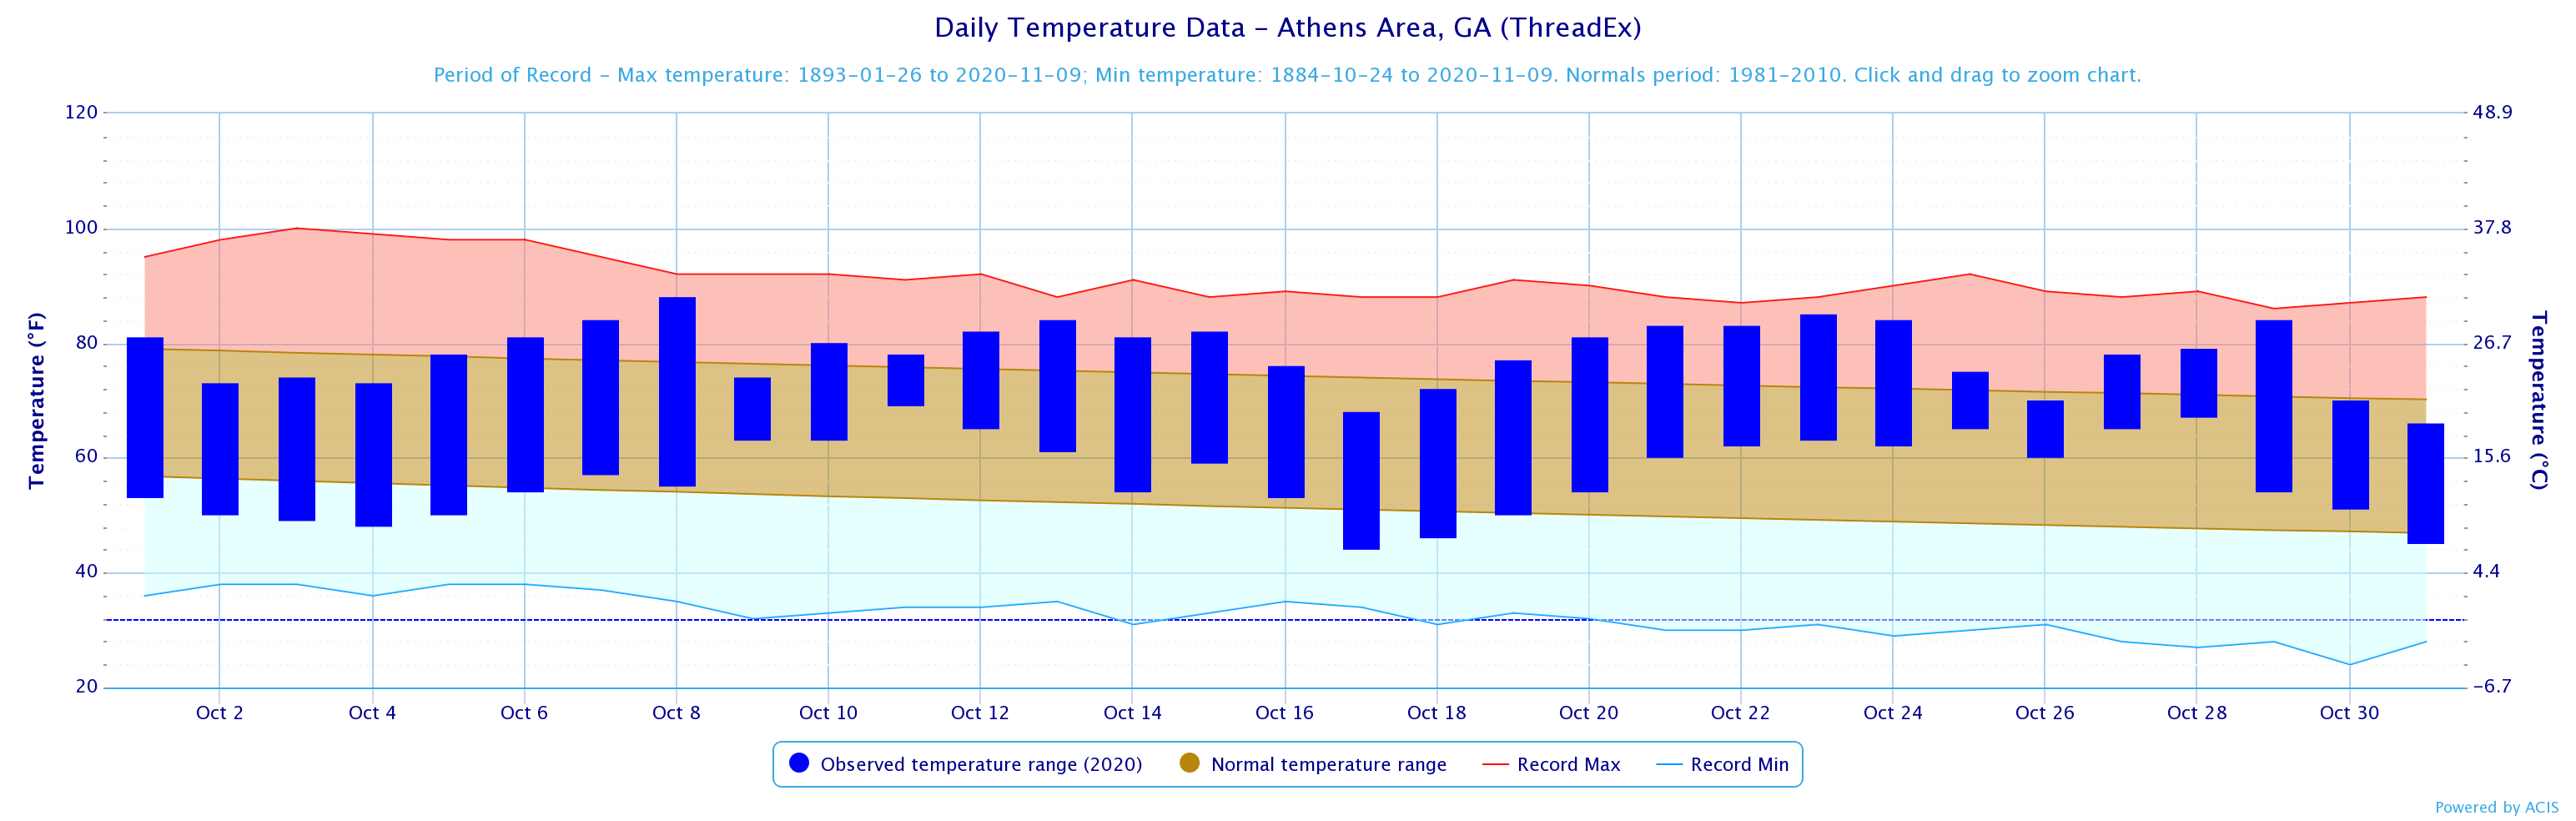
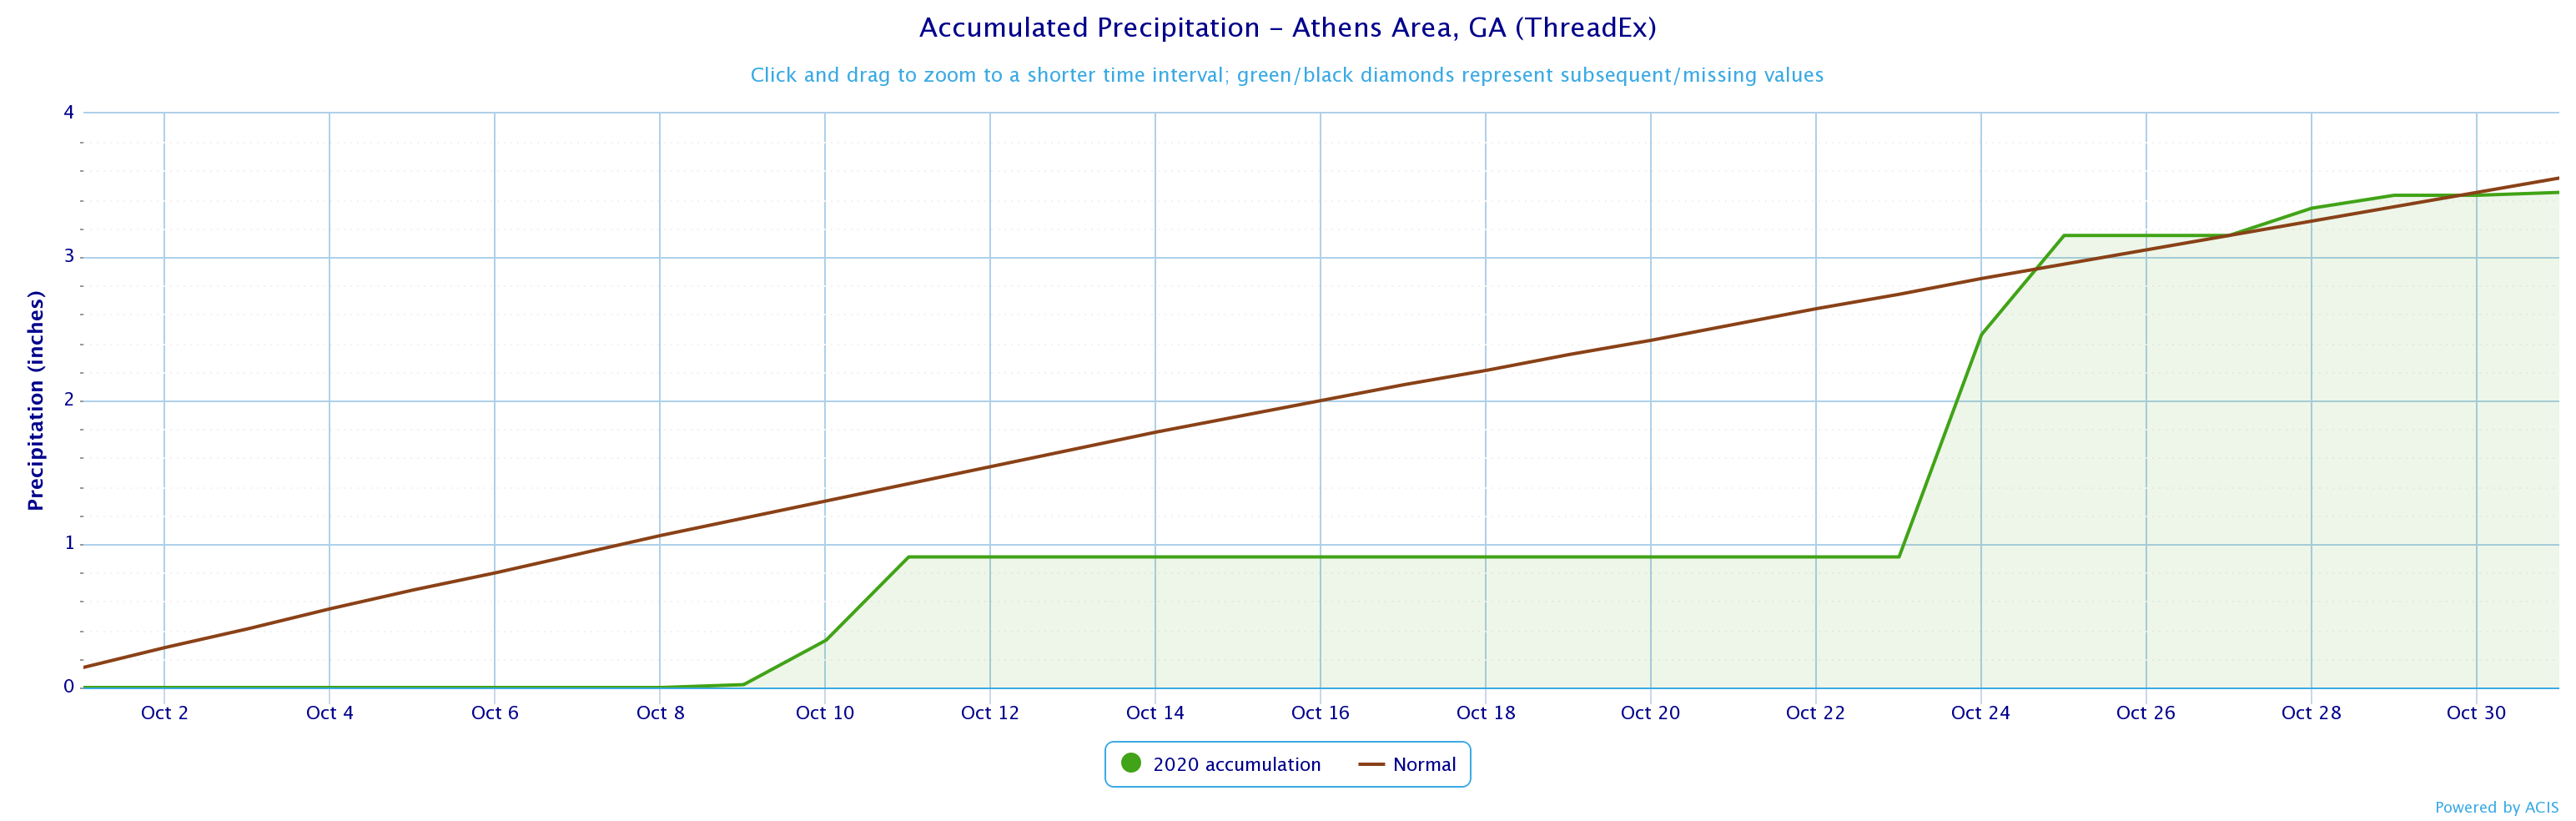
Athens experienced its 7th warmest October on record.
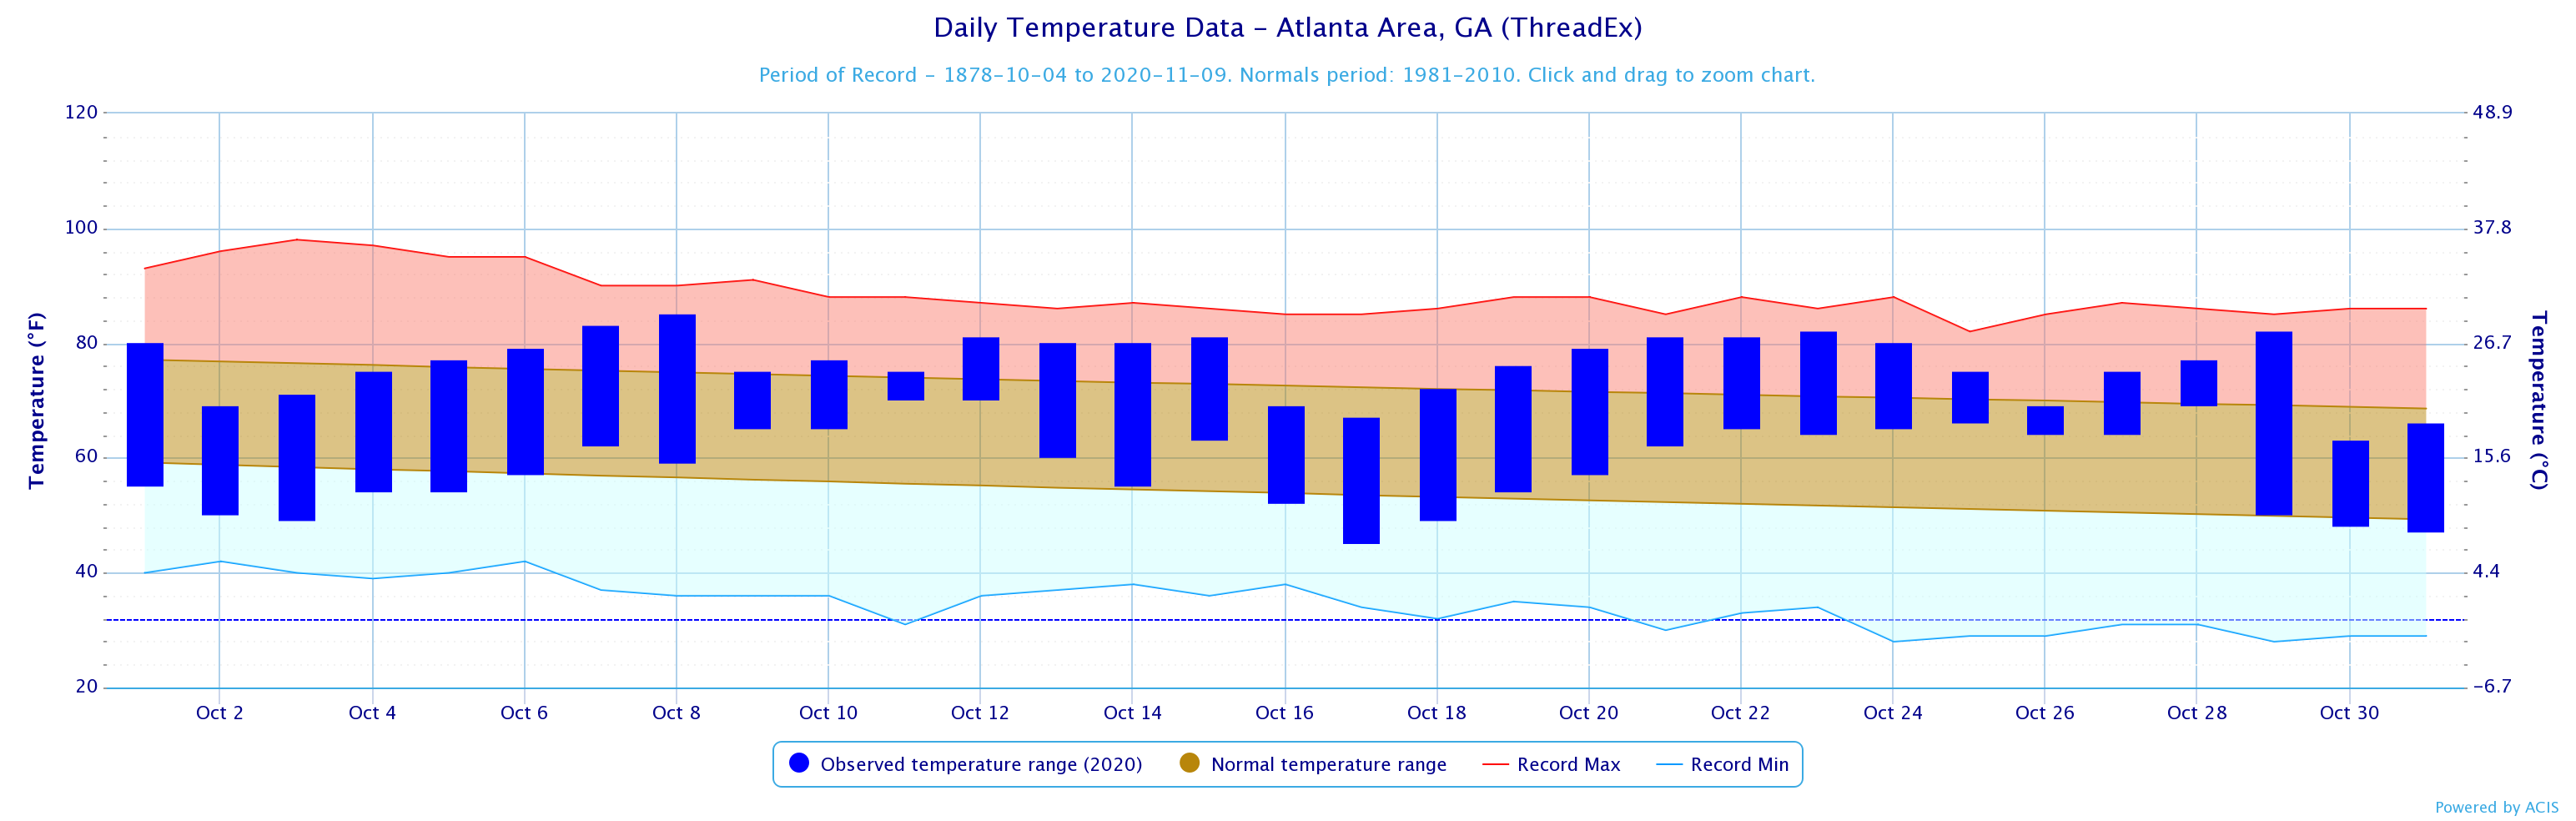
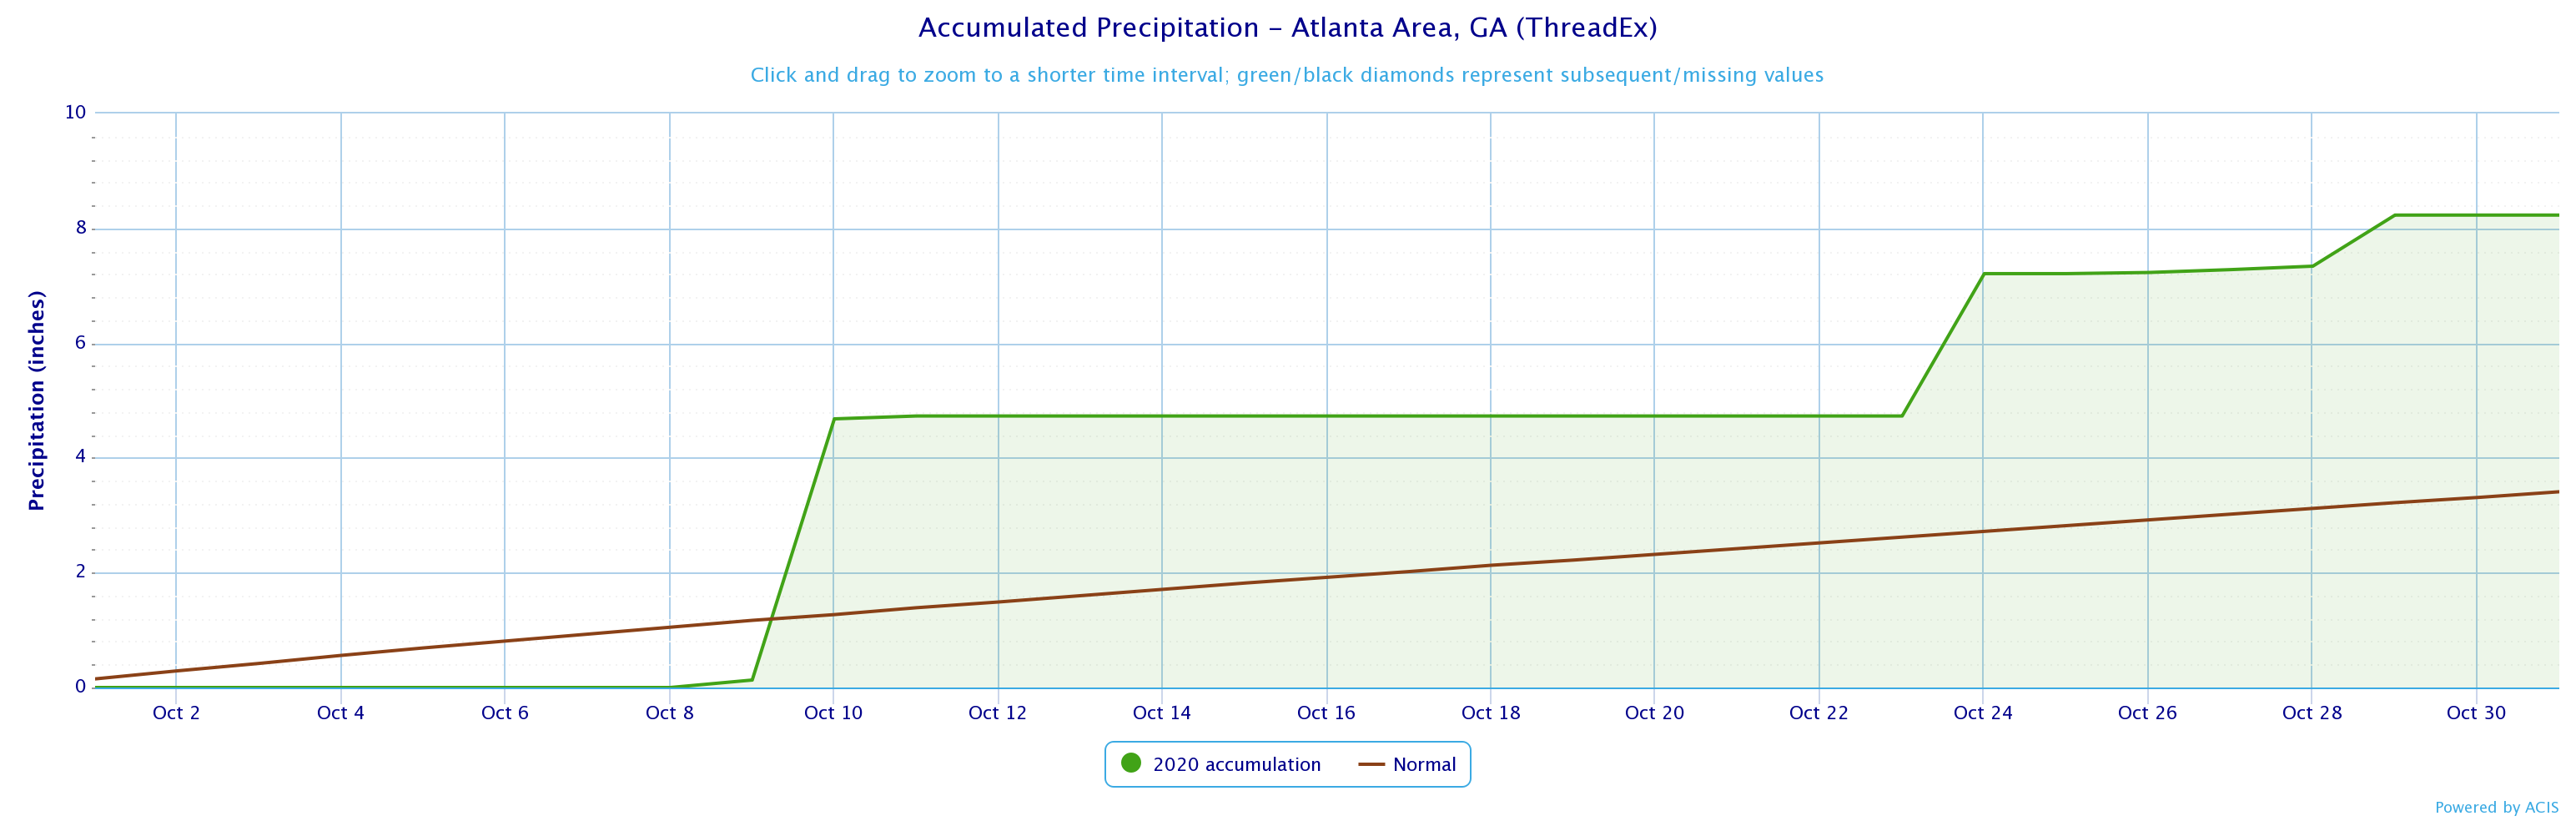
Atlanta experienced its 8th warmest October on record.
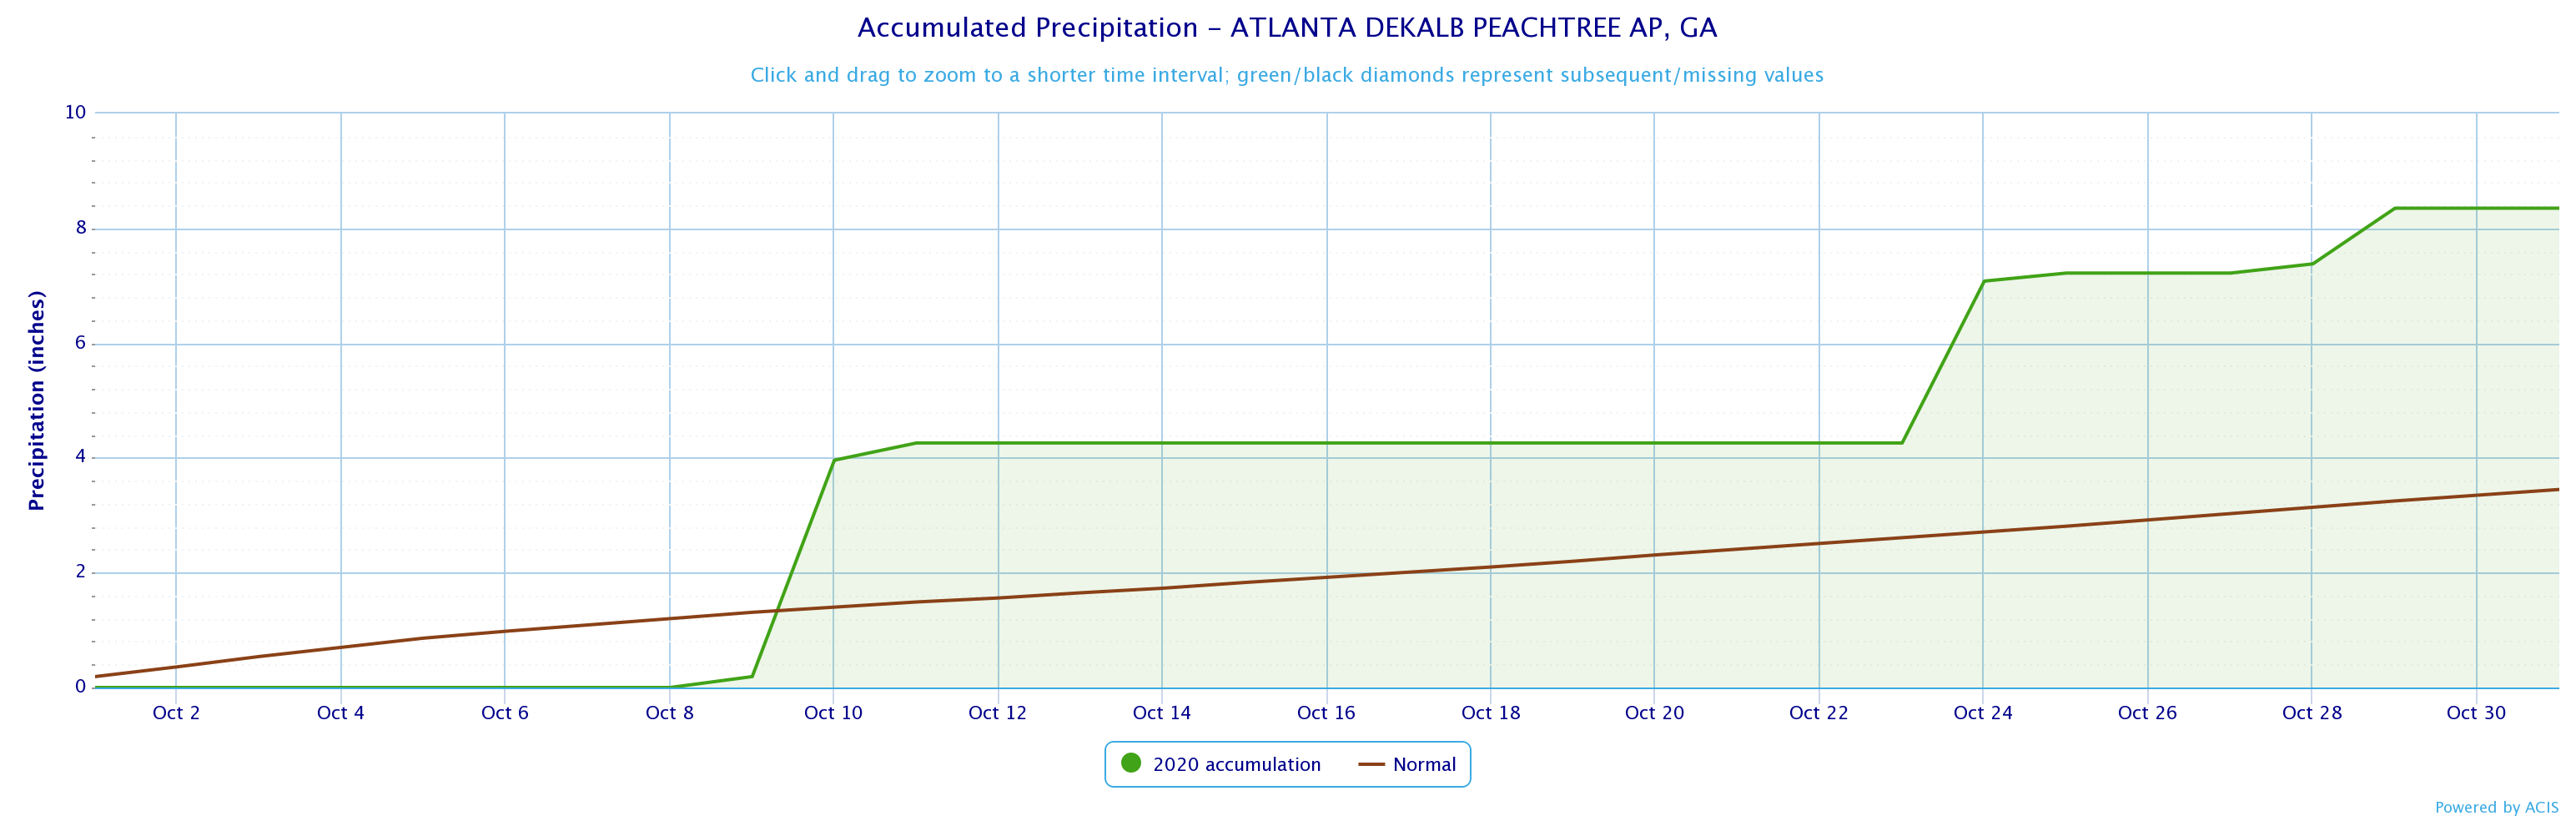
Atlanta experienced its 3rd wettest October on record.
|
October 2020 Temperature Climate Statistics
|
|||
| Climate Site | Average Temperature |
Normal Temperature
|
DFN (Departure
From Normal)
|
|
67.3
|
63.0
|
+4.3
|
|
|
67.3
|
63.3
|
+4.0
|
|
|
70.3
|
66.5
|
+3.8
|
|
|
69.3
|
64.9
|
+4.4
|
|
|
65.6
|
60.6
|
+5.0
|
|
|
64.8
|
61.9
|
+2.9
|
|
|
65.5
|
62.5
|
+3.0
|
|
|
64.3
|
61.7
|
+2.6
|
|
|
65.8
|
61.4
|
+4.4
|
|
|
65.3
|
61.1
|
+4.2
|
|
|
October 2020 Temperature Climate Statistics
|
||||
| Climate Site | Maximum Temperature | Max T Date |
Minimum Temperature
|
Min T Date
|
|
Athens
|
88
|
10/8
|
44
|
10/17
|
|
Atlanta
|
85
|
10/8
|
45
|
10/17
|
|
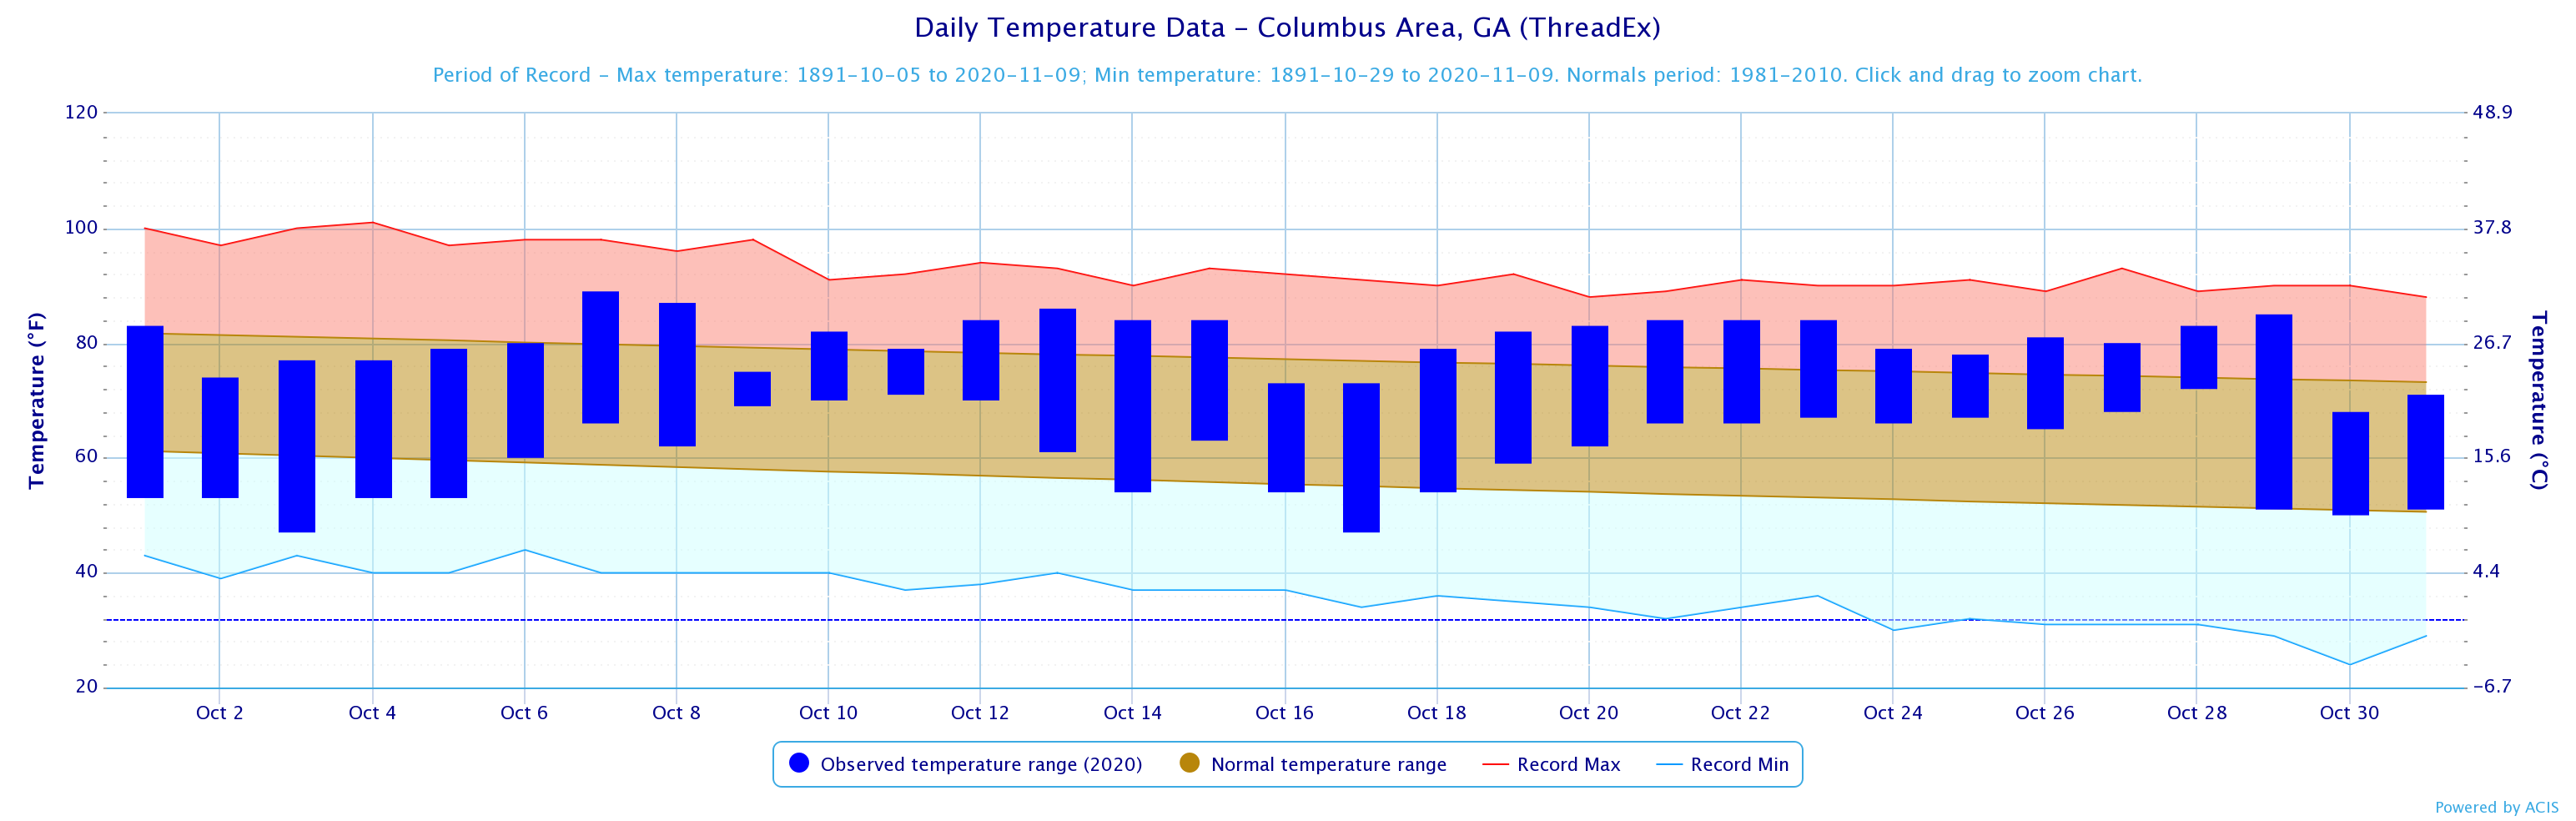
Columbus
|
89
|
10/7
|
47
|
10/3, 10/17
|
|
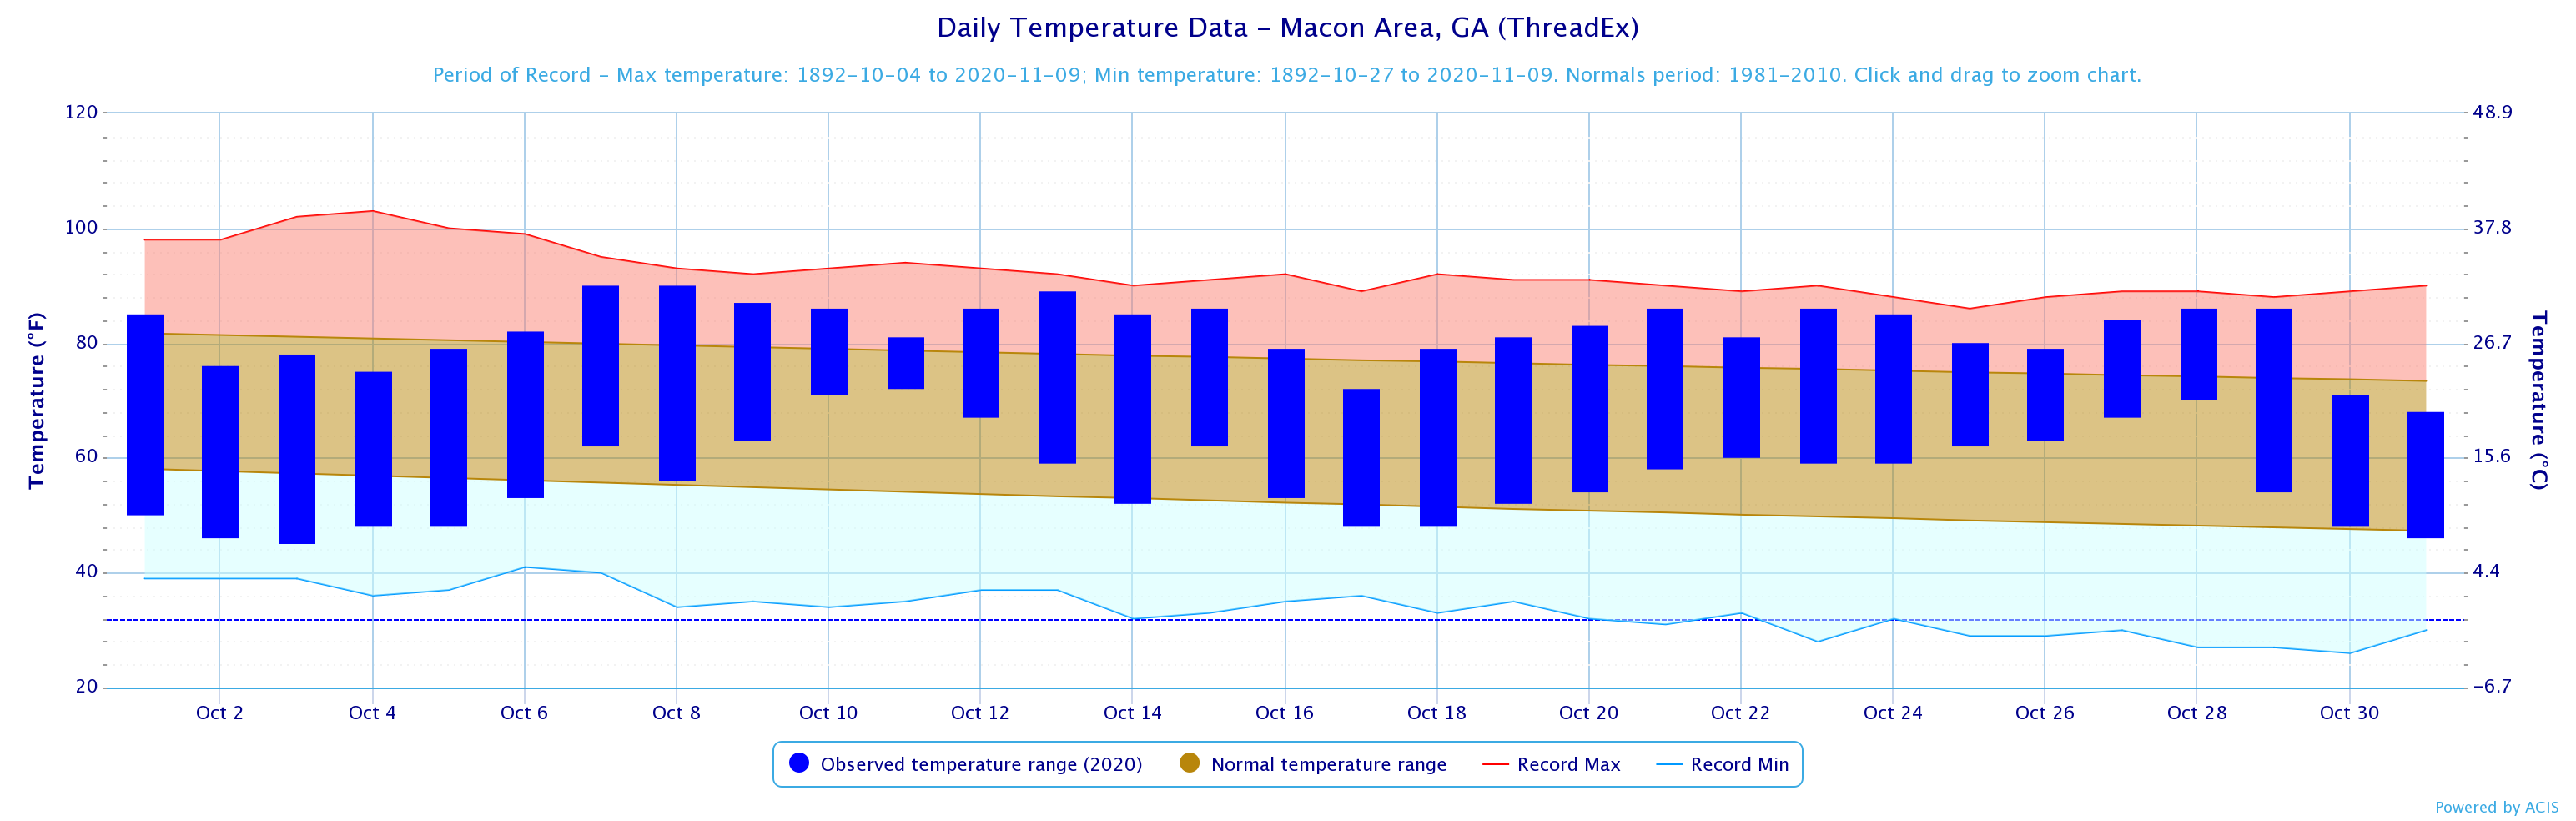
Macon
|
90
|
10/7, 10/8
|
45
|
10/3
|
|
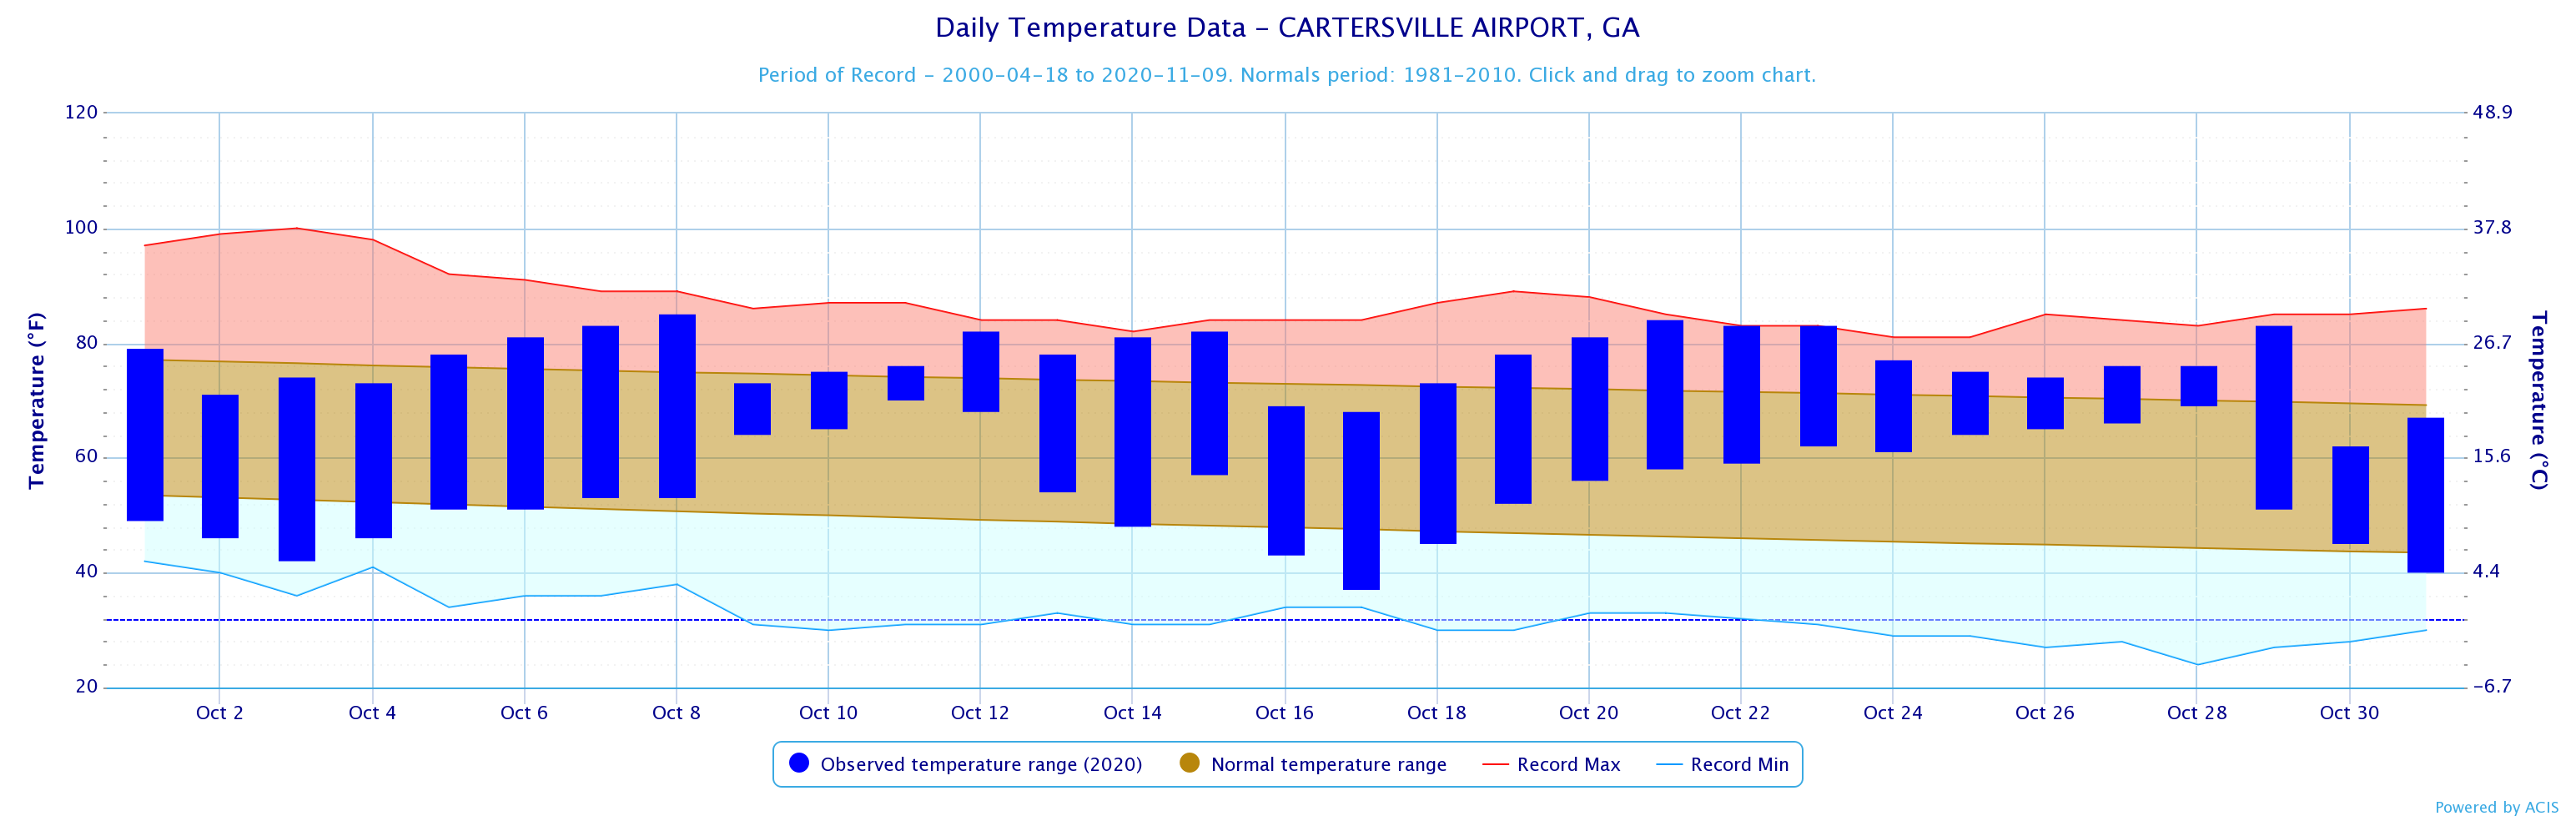
Cartersville
|
85
|
10/8
|
37
|
10/17
|
|
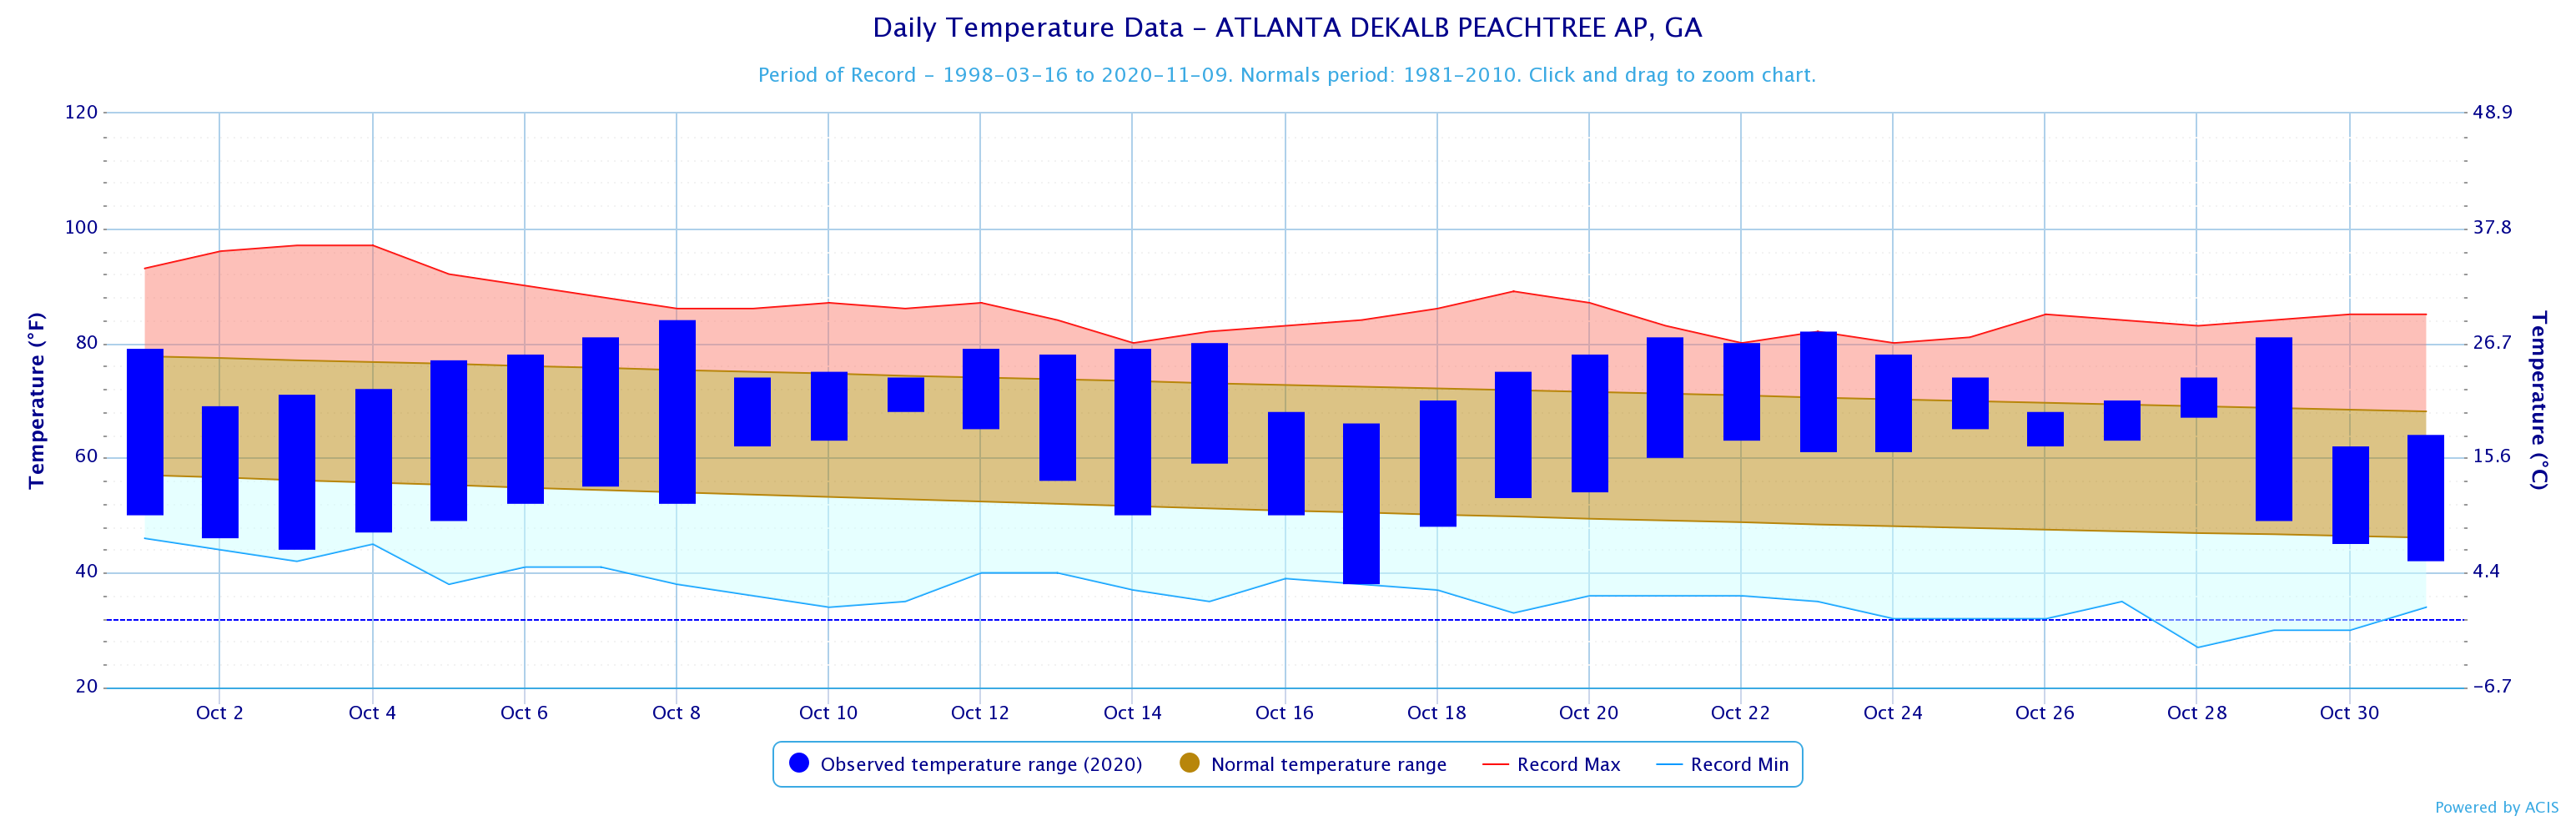
Dekalb Peachtree Arpt
|
84
|
10/8
|
38
|
10/17*
|
|
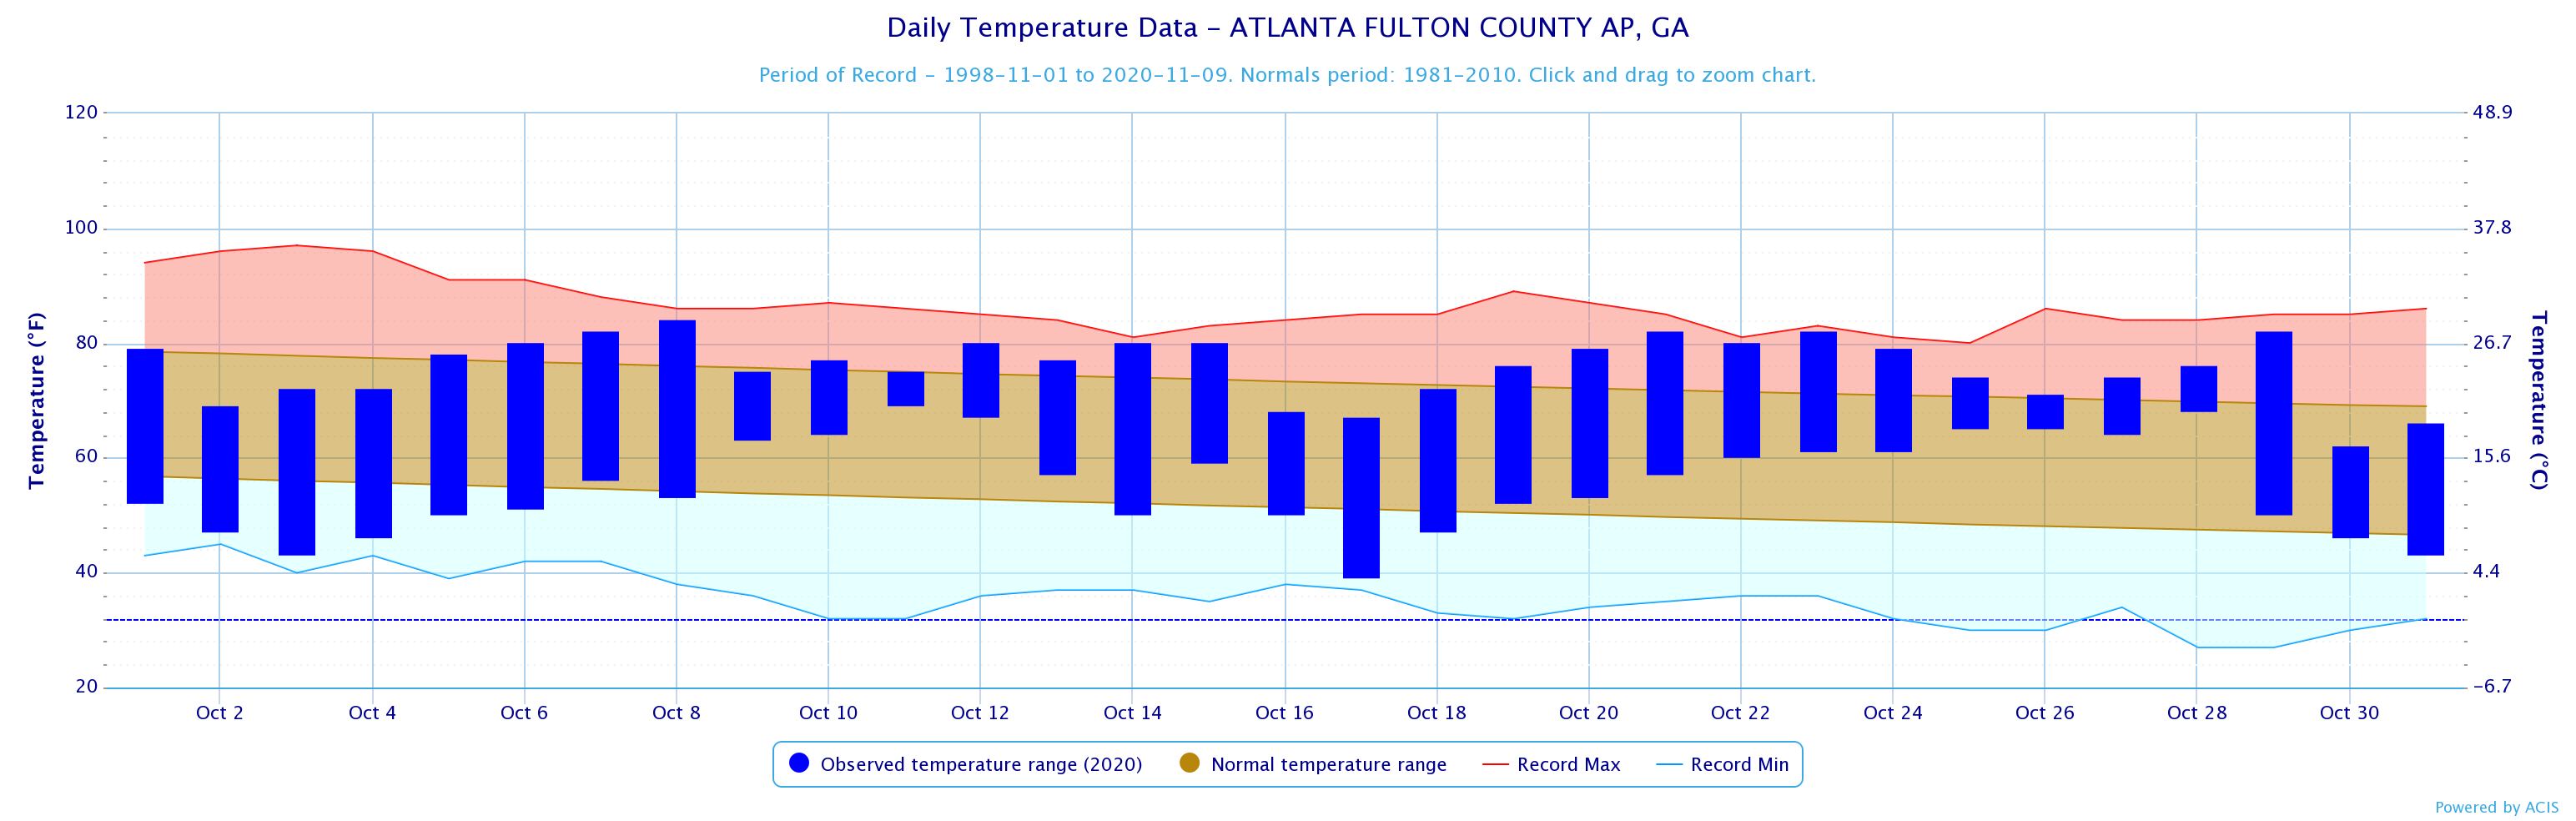
Fulton Co Arpt
|
84
|
10/8
|
39
|
10/17
|
|
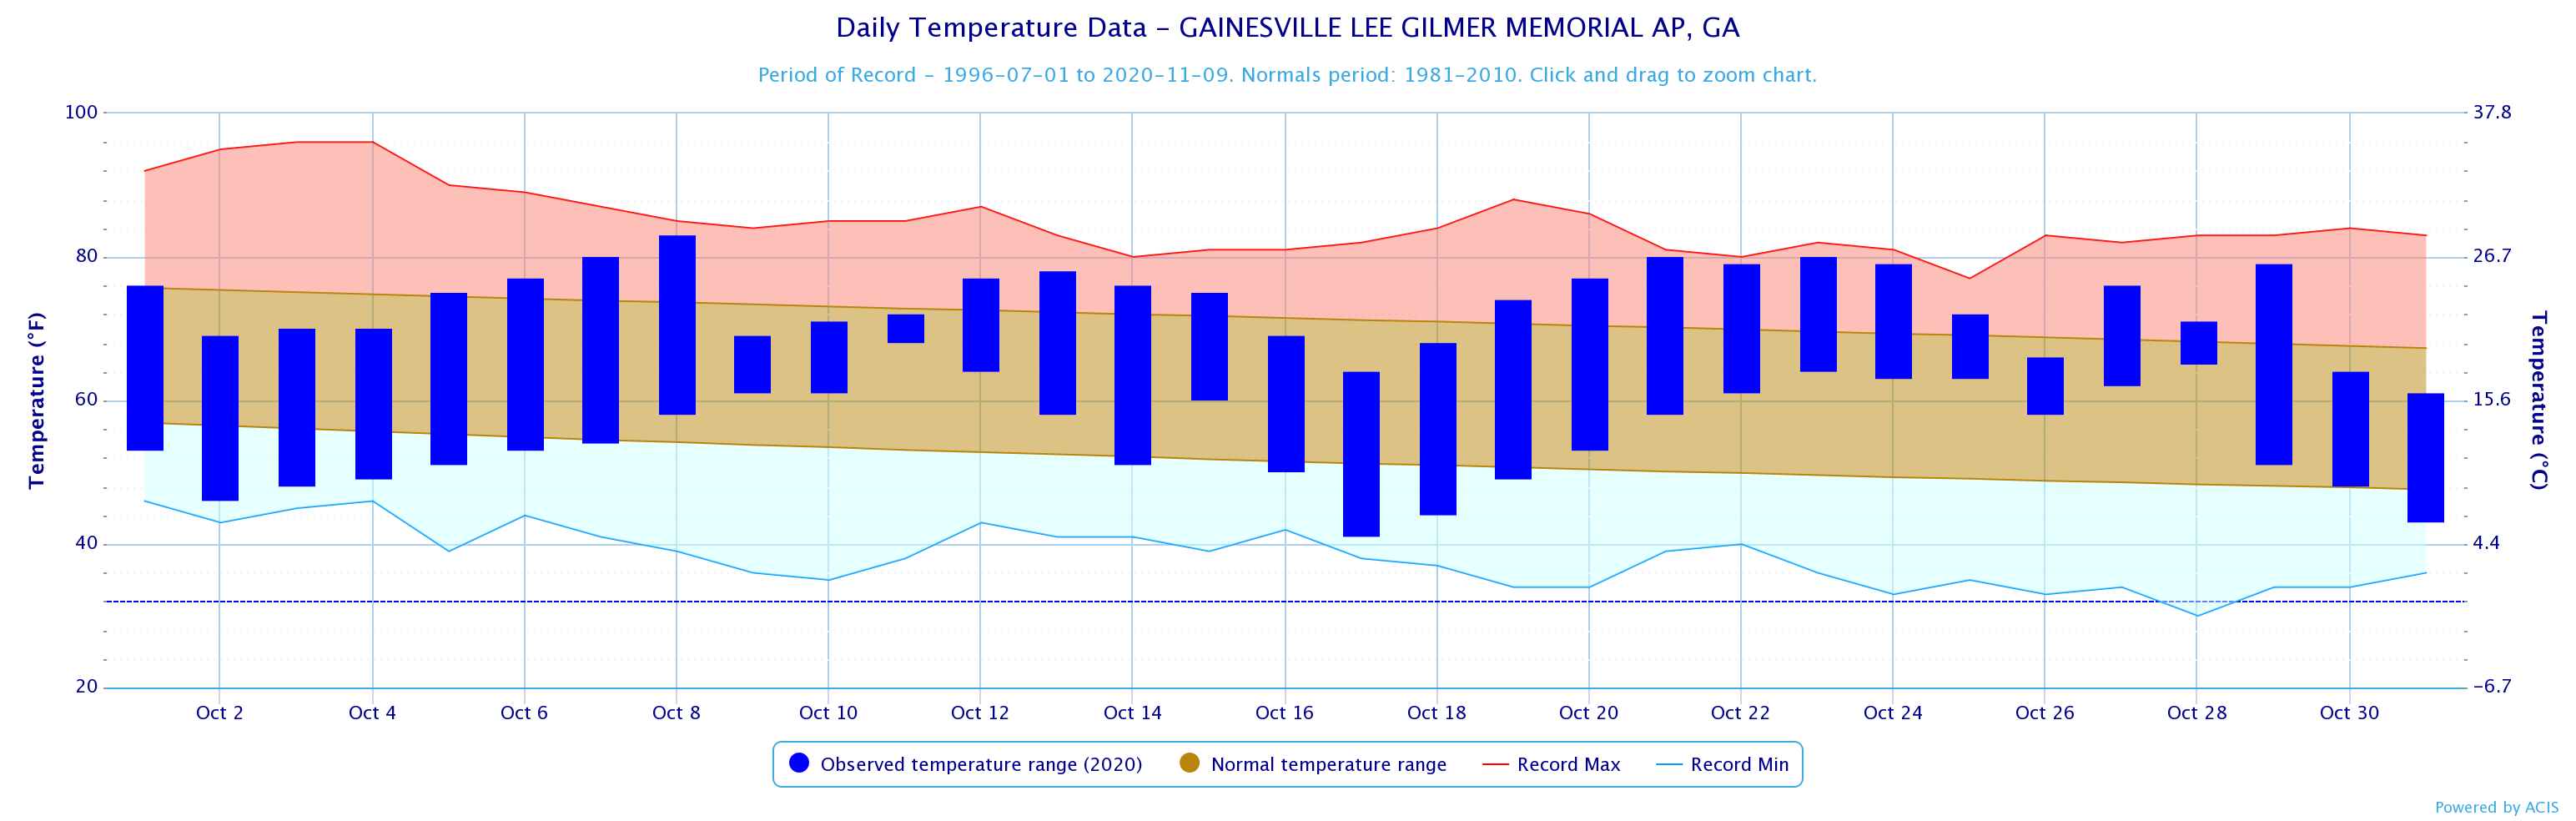
Gainesville
|
83
|
10/8
|
41
|
10/17
|
|
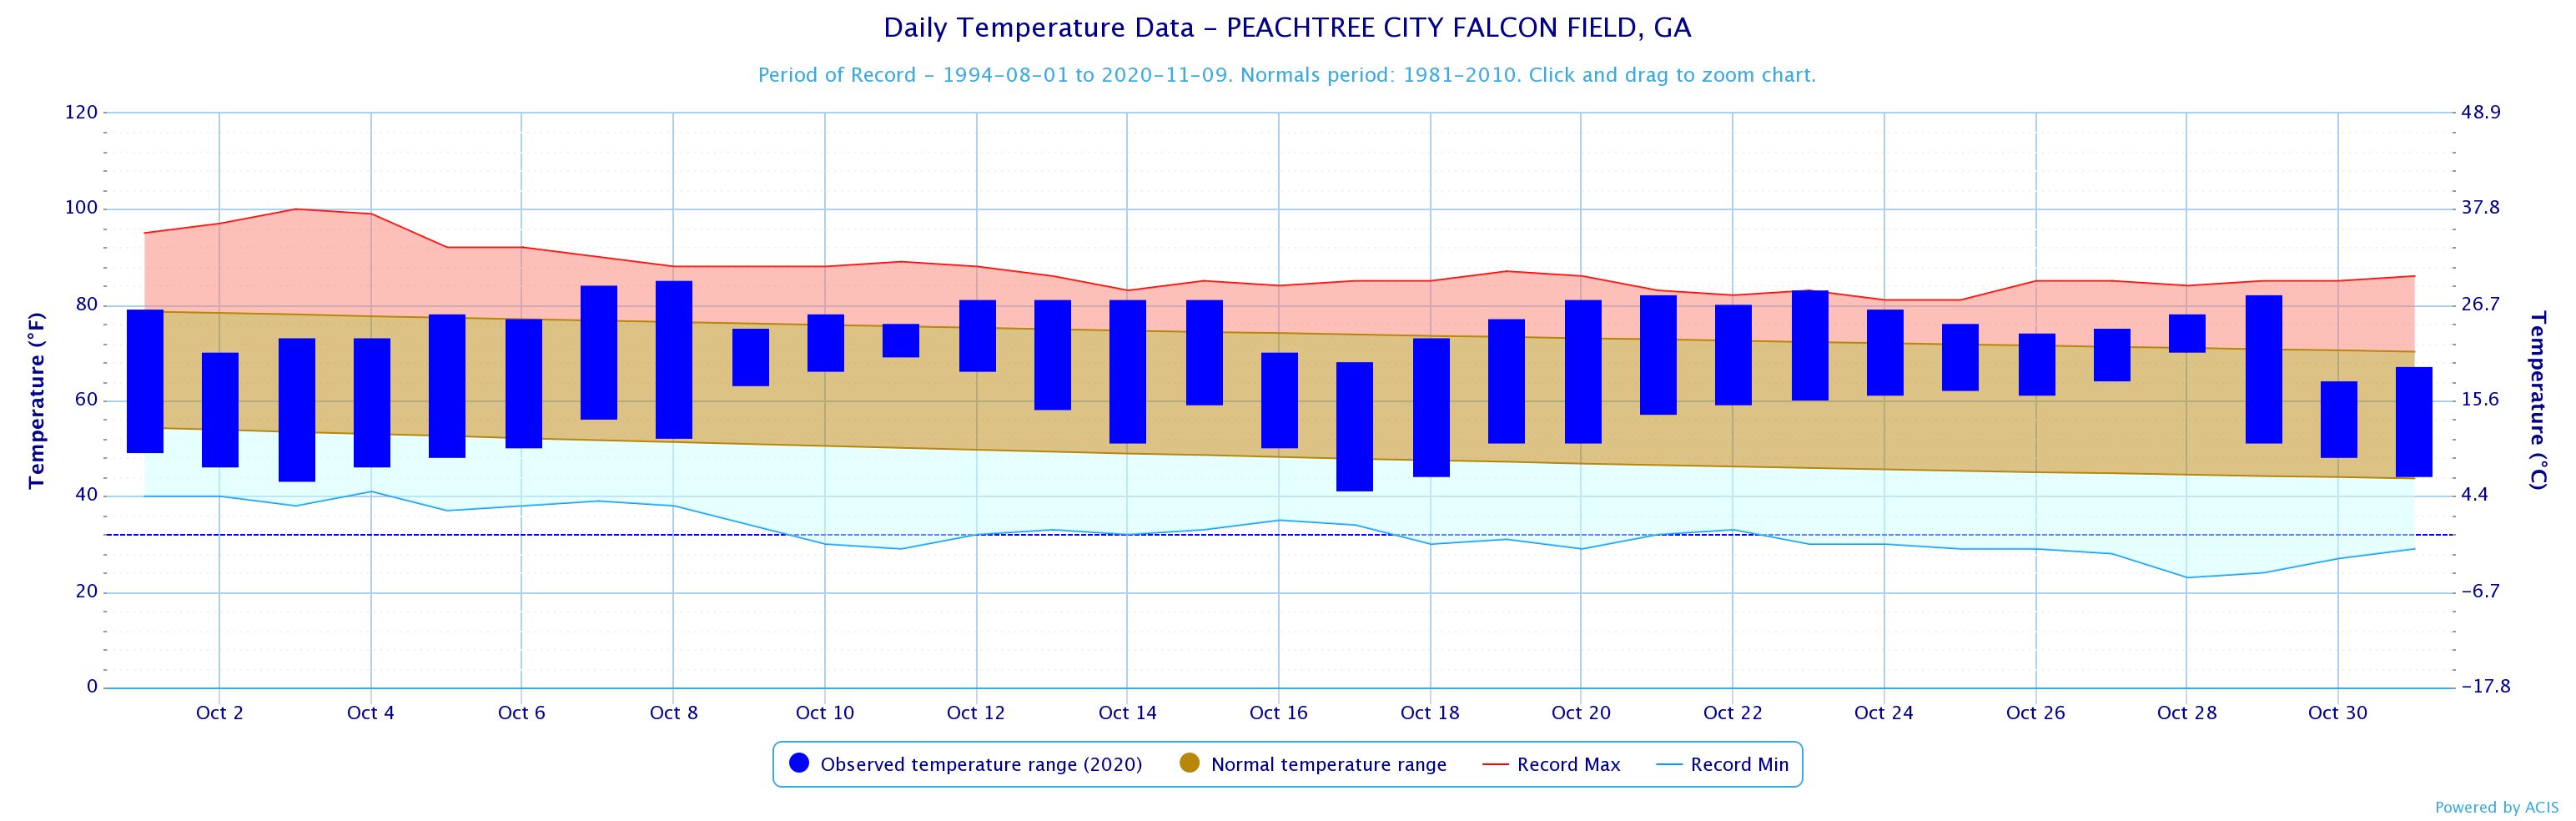
Peachtree City
|
85
|
10/8
|
41
|
10/17
|
|
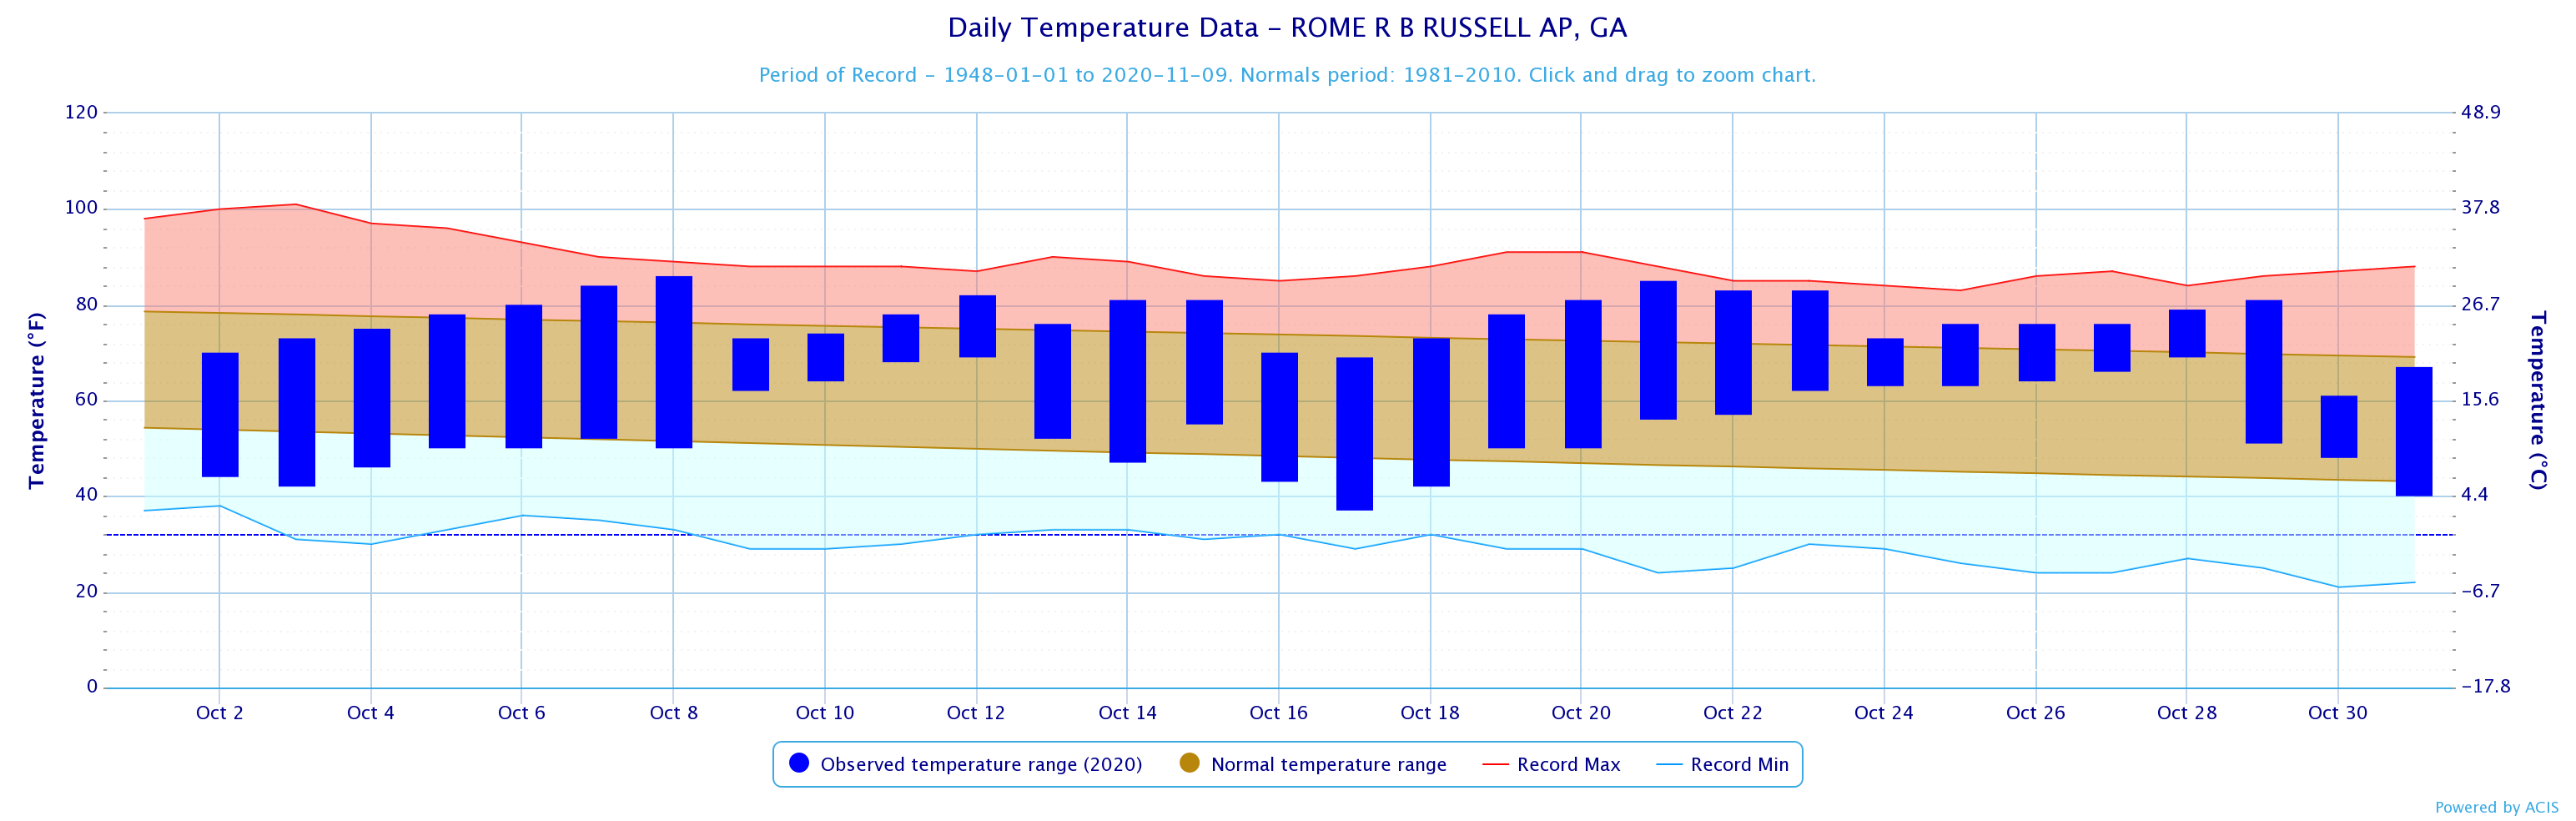
Rome
|
86
|
10/8
|
37
|
10/17
|
*Indicates a daily record was set
|
October 2020 Precipitation Climate Statistics
|
|||
| Climate Site | Total Precipitation |
Normal Precipitation
|
DFN (Departure
From Normal)
|
|
3.45
|
3.55
|
-0.10
|
|
|
8.23
|
3.41
|
+4.82
|
|
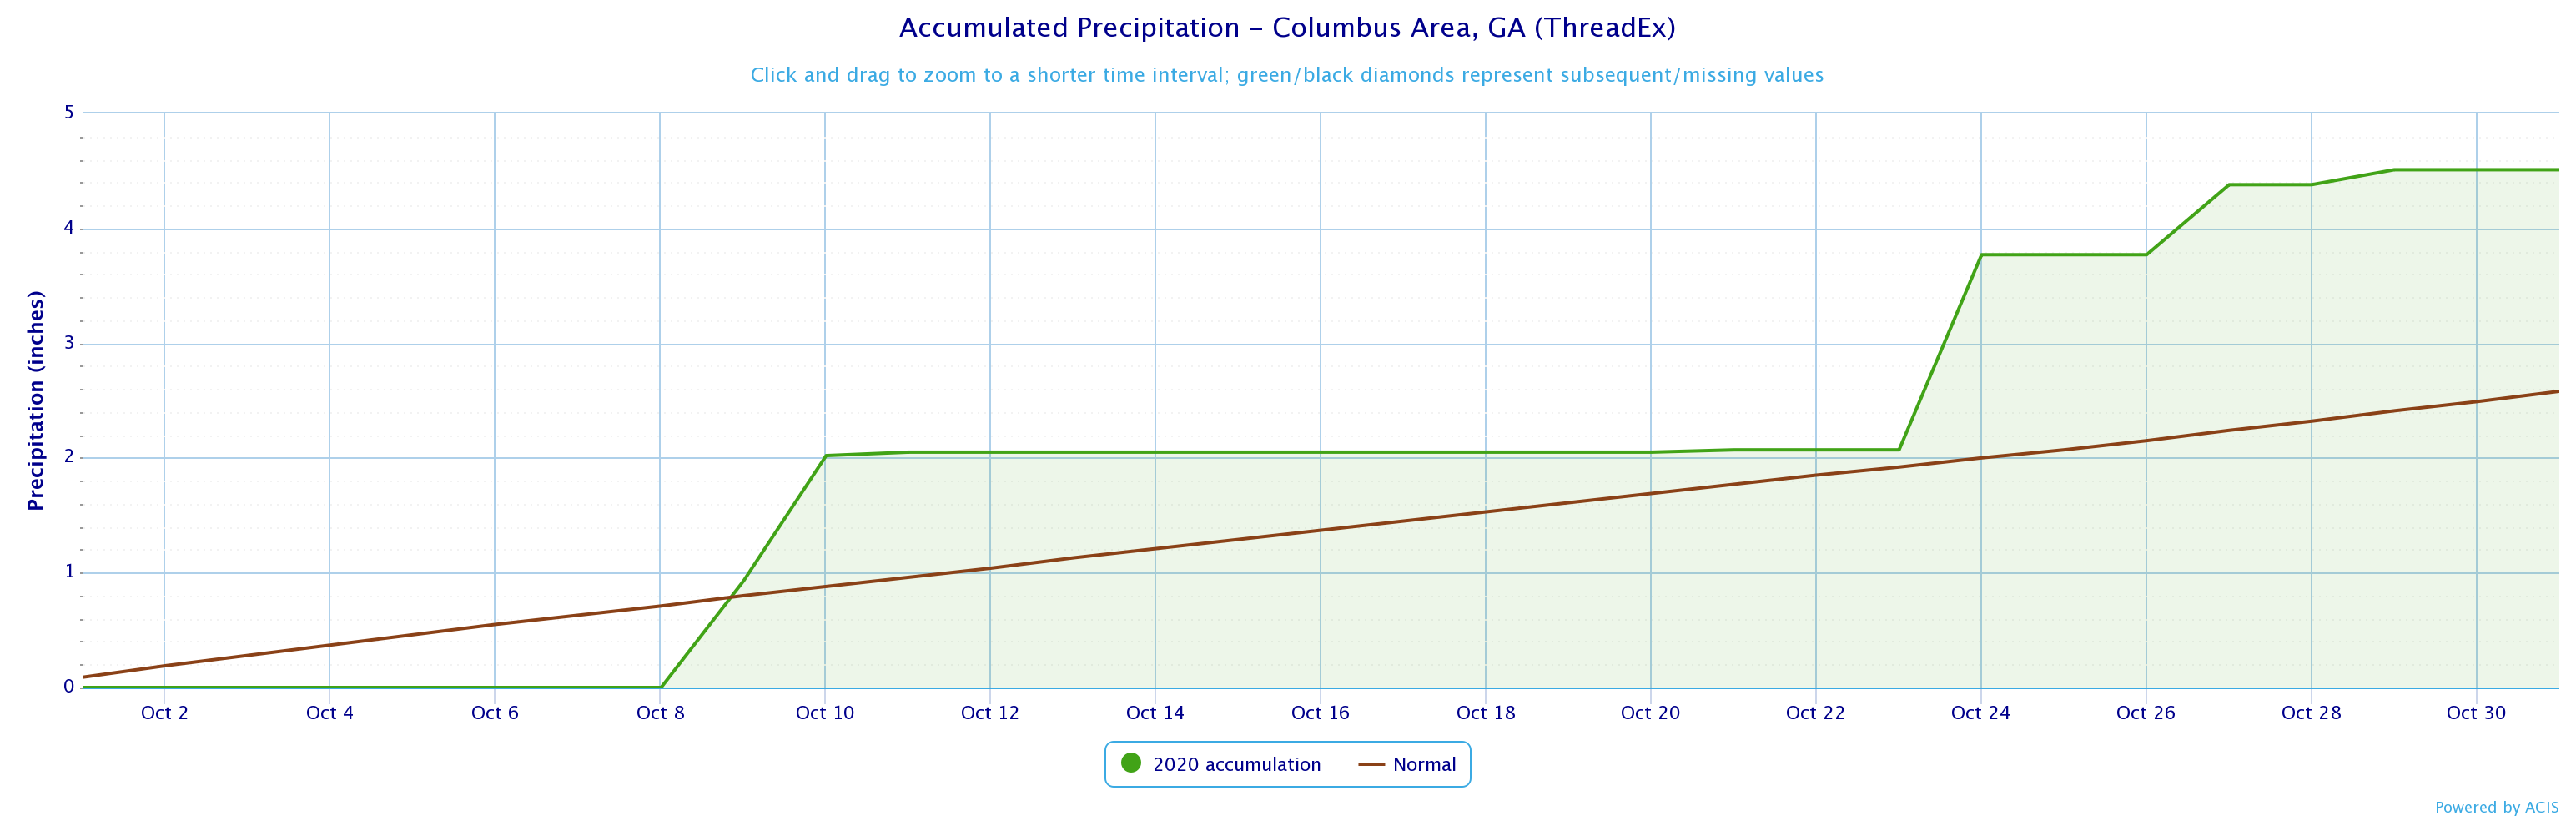
|
4.51
|
2.58
|
+1.93
|
|
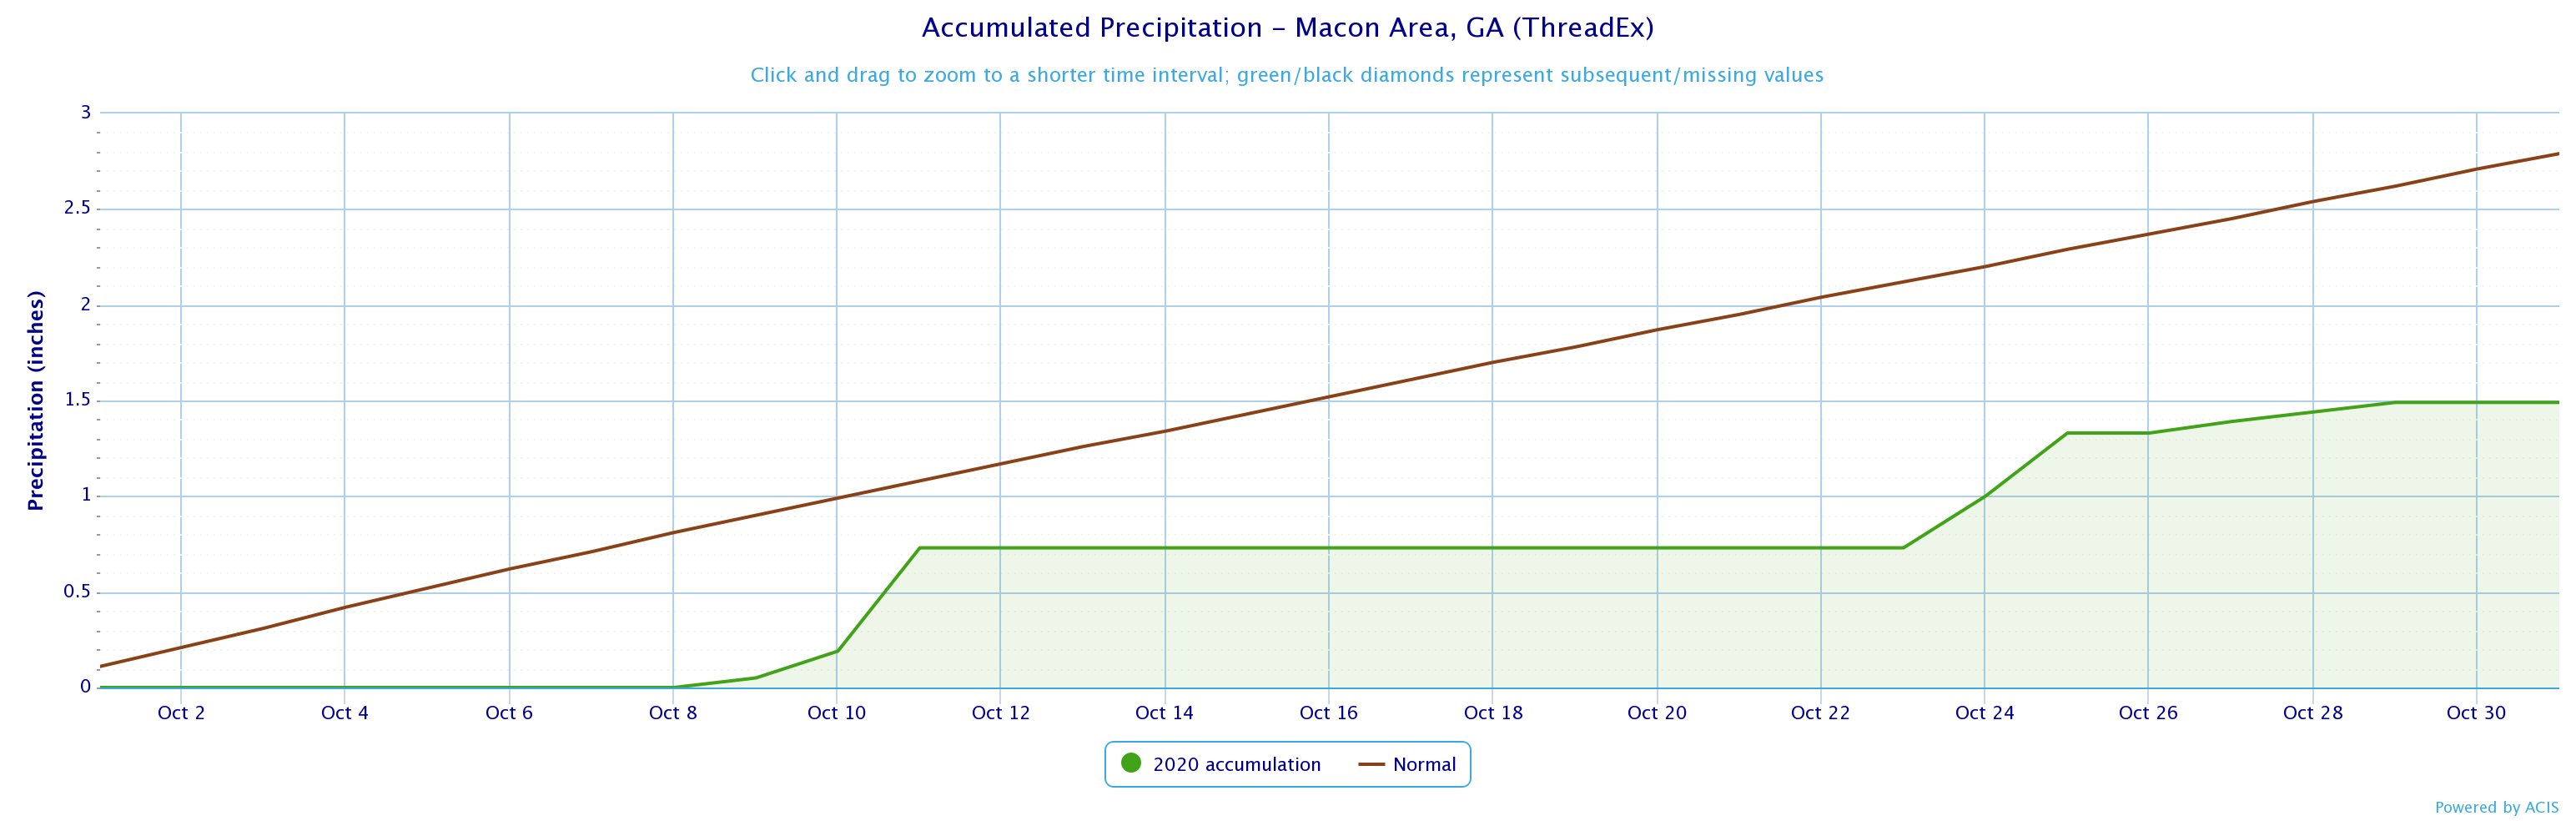
|
1.49
|
2.79
|
-1.30
|
|
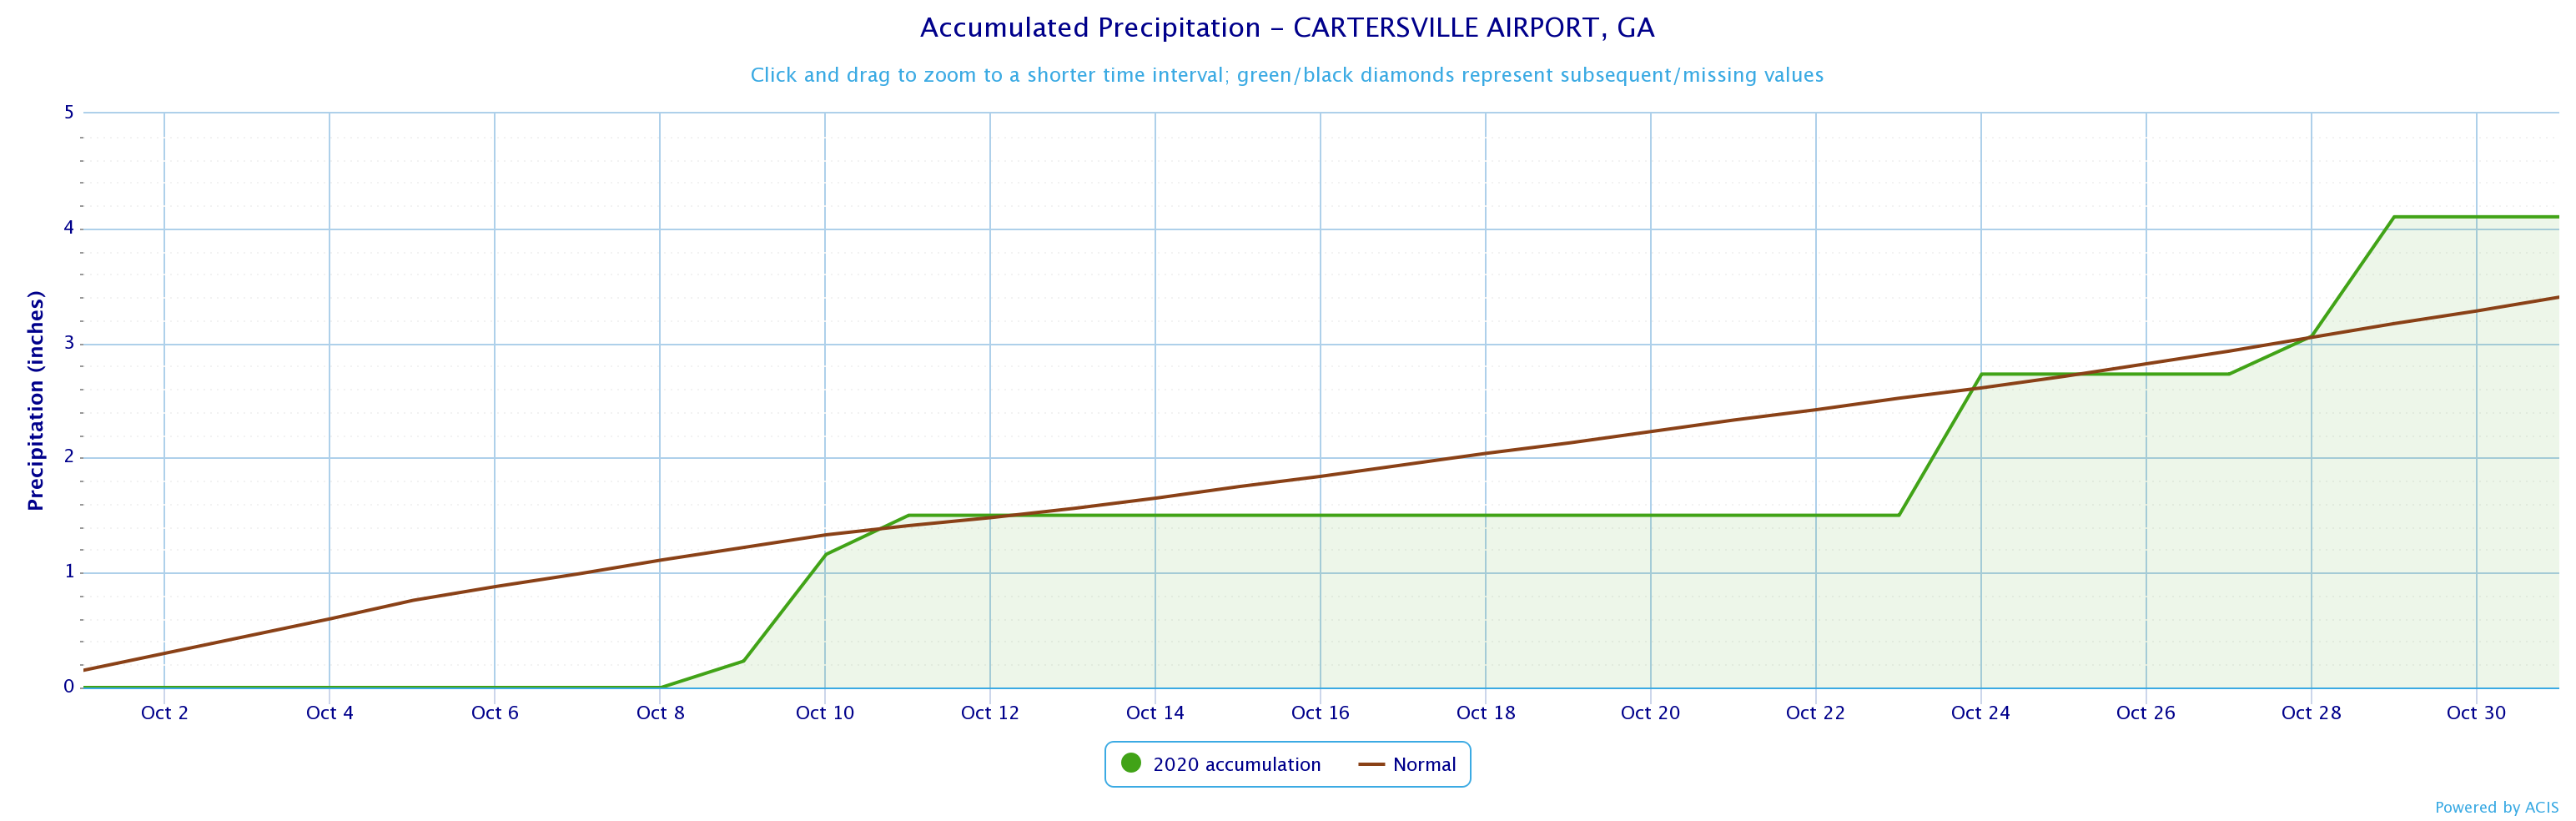
|
4.10
|
3.40
|
+0.70
|
|
|
8.35
|
3.45
|
+4.90
|
|
|
8.99
|
3.61
|
+5.38
|
|
|
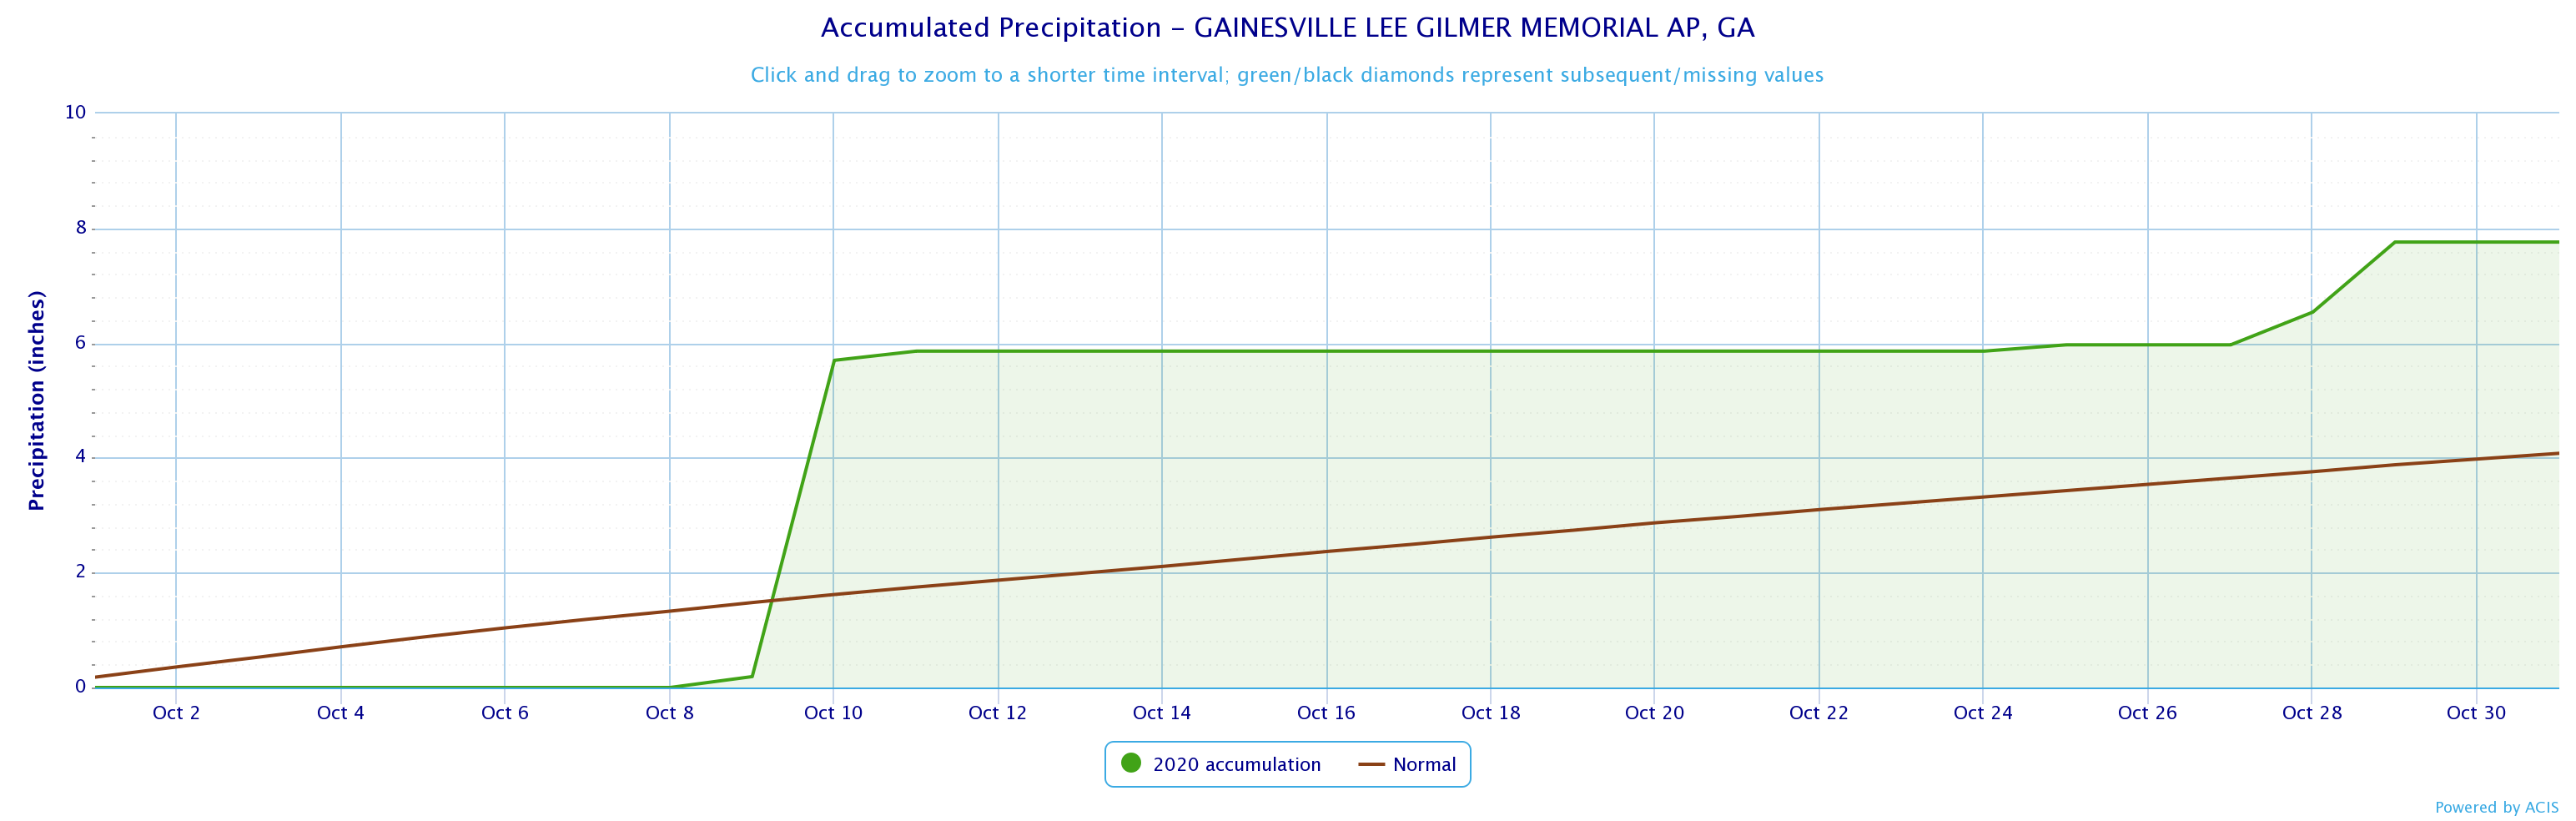
7.76
|
4.08
|
+3.68
|
|
|
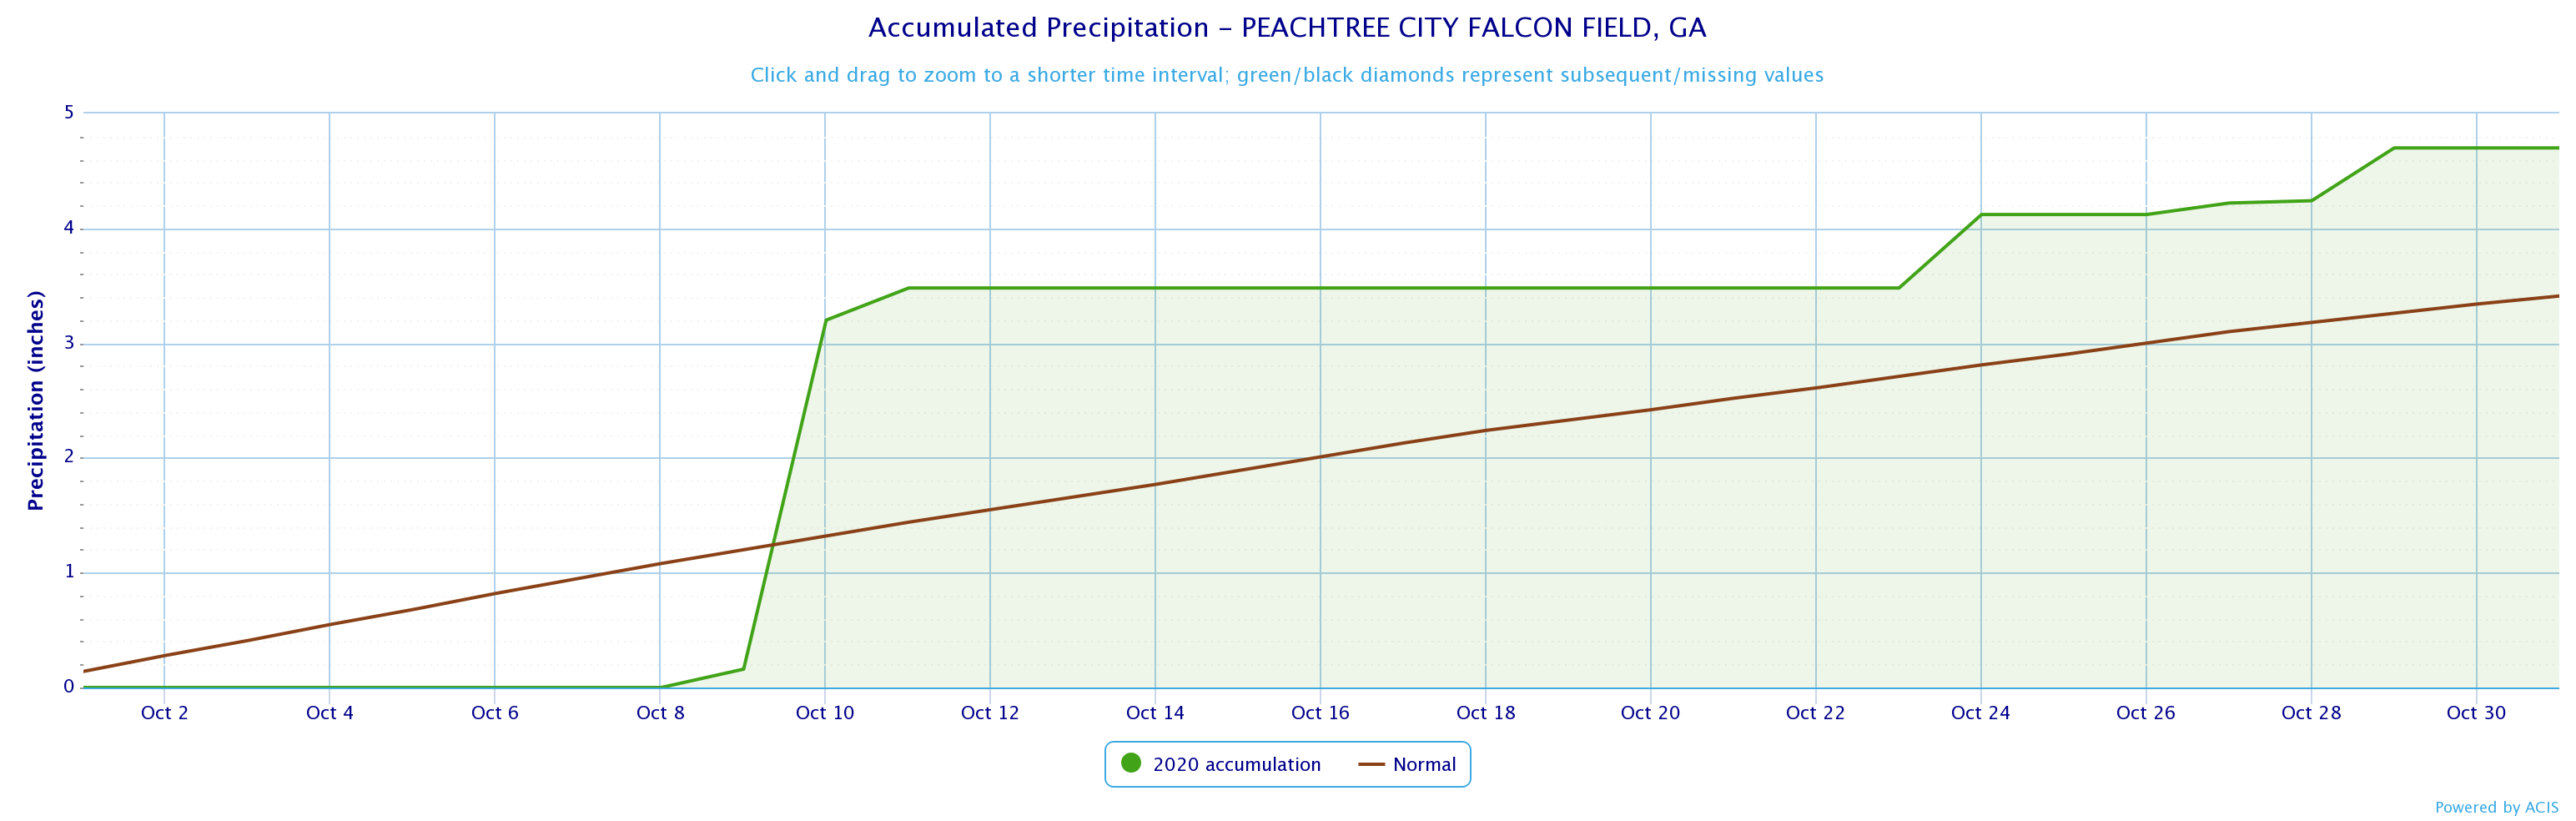
4.70
|
3.41
|
+1.29
|
|
|
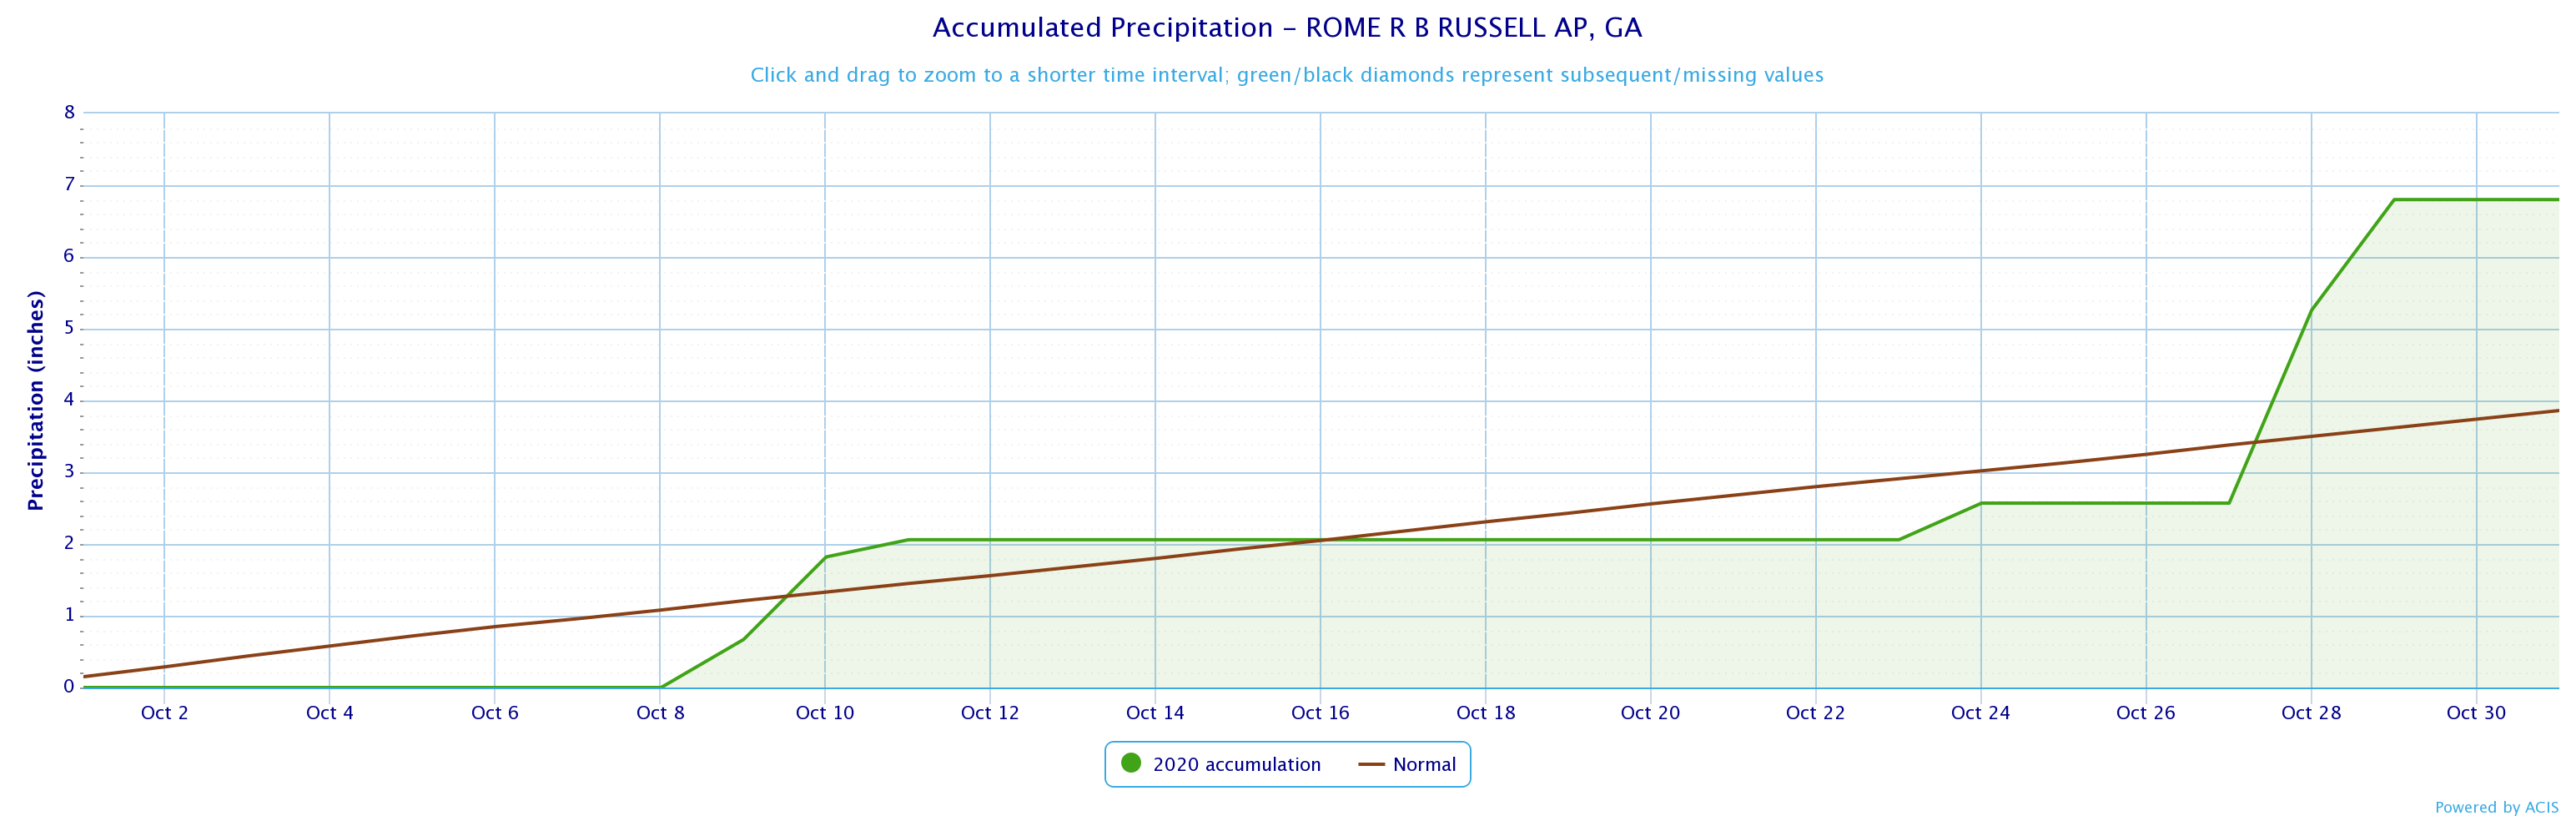
6.80
|
3.86
|
+2.94
|
|
|
October 2020 Precipitation Climate Statistics
|
||||
| Climate Site | Maximum Daily Precip | Max P Date | ||
|
Athens
|
1.55
|
10/24
|
||
|
Atlanta
|
4.55
|
10/10*
|
||
|
Columbus
|
1.70
|
10/24
|
||
|
Macon
|
0.54
|
10/11
|
||
|
Cartersville
|
1.23
|
10/24*
|
||
|
Dekalb Peachtree Arpt
|
3.77
|
10/10*
|
||
|
Fulton Co Arpt
|
4.26
|
10/24*
|
||
|
Gainesville
|
5.51
|
10/10
|
||
|
Peachtree City
|
3.04
|
10/10
|
||
|
Rome
|
2.69
|
10/28* | ||
*Indicates a daily record was set
Data prepared by NWS Peachtree City/Atlanta.
Temperature Maps |
Precipitation Maps
|
Temperature Graphs
|
Precipitation Graphs |


|
October 2020 Climate Records
|
|||
|
Date
|
Type
|
Location
|
Record
|
|
10/10
|
Precipitation
|
Atlanta
|
4.55 inches of precipitation fell on 10/10. This breaks the previous record of 3.42 inches, last set in 2018.
|
|
10/24
|
Precipitation
|
Atlanta
|
2.48 inches of precipitation fell on 10/24. This breaks the previous record of 1.72 inches, last set in 1918.
|
Most notably, the remnants of Hurricane Delta impacted portions of north and central Georgia on October 10th - 11th. The remnants of Delta brought multiple weak tornadoes to the area, downing numerous trees and power lines and even damaging several buildings. In addition, pockets of heavy rain fell across the metro Atlanta area and further northeast leading to localized flooding and washed out roads. More information on the impacts across north and central Georgia due to Delta can be found here.
Later on in the month on October 29th, Tropical Storm Zeta crossed portions of west central and northern Georgia bringing sustained winds of 20 to 35 mph with widespread gusts of 40 to 60 mph, with some isolated gusts over 60 mph. These strong winds downed numerous trees and power lines across much of north and portions of central Georgia, leading to property damage from falling trees and widespread power outages. In addition, portions of northern Georgia received between 1.5 to 4 inches of rainfall leading to isolated issues with localized flooding. More information on the impacts across north and central Georgia due to Tropical Storm Zeta can be found here.
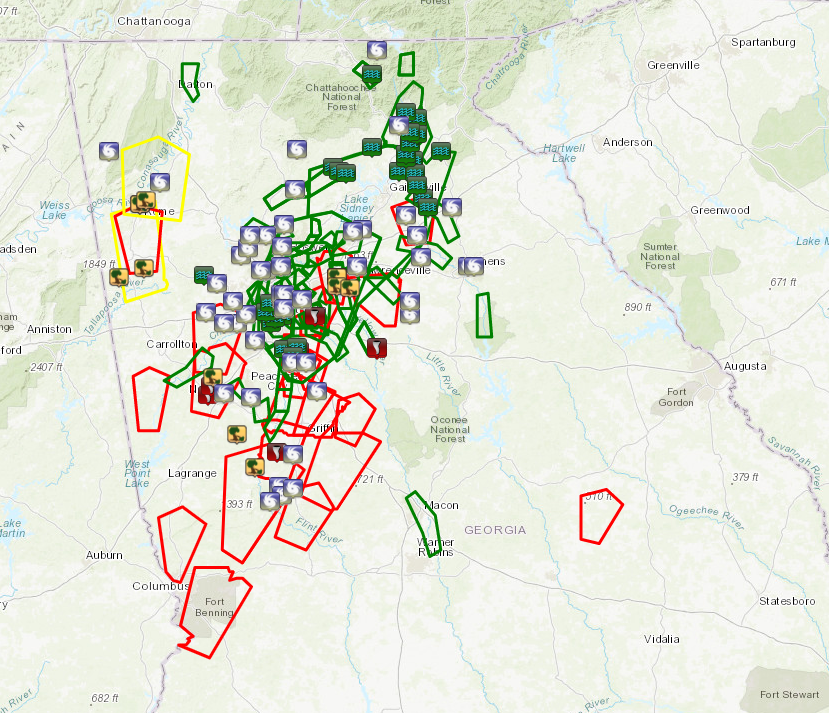
Here is a visual summary of all the warnings and local storm reports issued across portions of northern and central Georgia in October 2020.
Based on the Climate Prediction Center's outlook for November, all of north and central Georgia has a 33% to 40% chance of above normal temperatures. For precipitation, portions of west Georgia have a 50% to 60% chance of below normal precipitation and the rest of Georgia has a 40% to 50% chance of below normal precipitation.
Data prepared by NWS Peachtree City/Atlanta.

