A significant heat wave is underway for the Intermountain West, Northern Plains, and Upper Great Lakes, peaking in intensity through midweek and lingering across parts of the Northern Plains and Midwest until this weekend. In southwest Texas, excessive rainfall may bring a risk for potentially life-threatening flash and arroyo flooding through Thursday. Read More >
|
||||||||
The year 2020 had its fair share of memorable moments, but overall the weather across south central Nebraska and north central Kansas was a little more subdued compared to recent years. We've highlighted a few of the more extreme events throughout the year...from snow events, to severe weather with large hail and brief tornadoes...to increasing drought conditions and days with smoke from western wild fires.
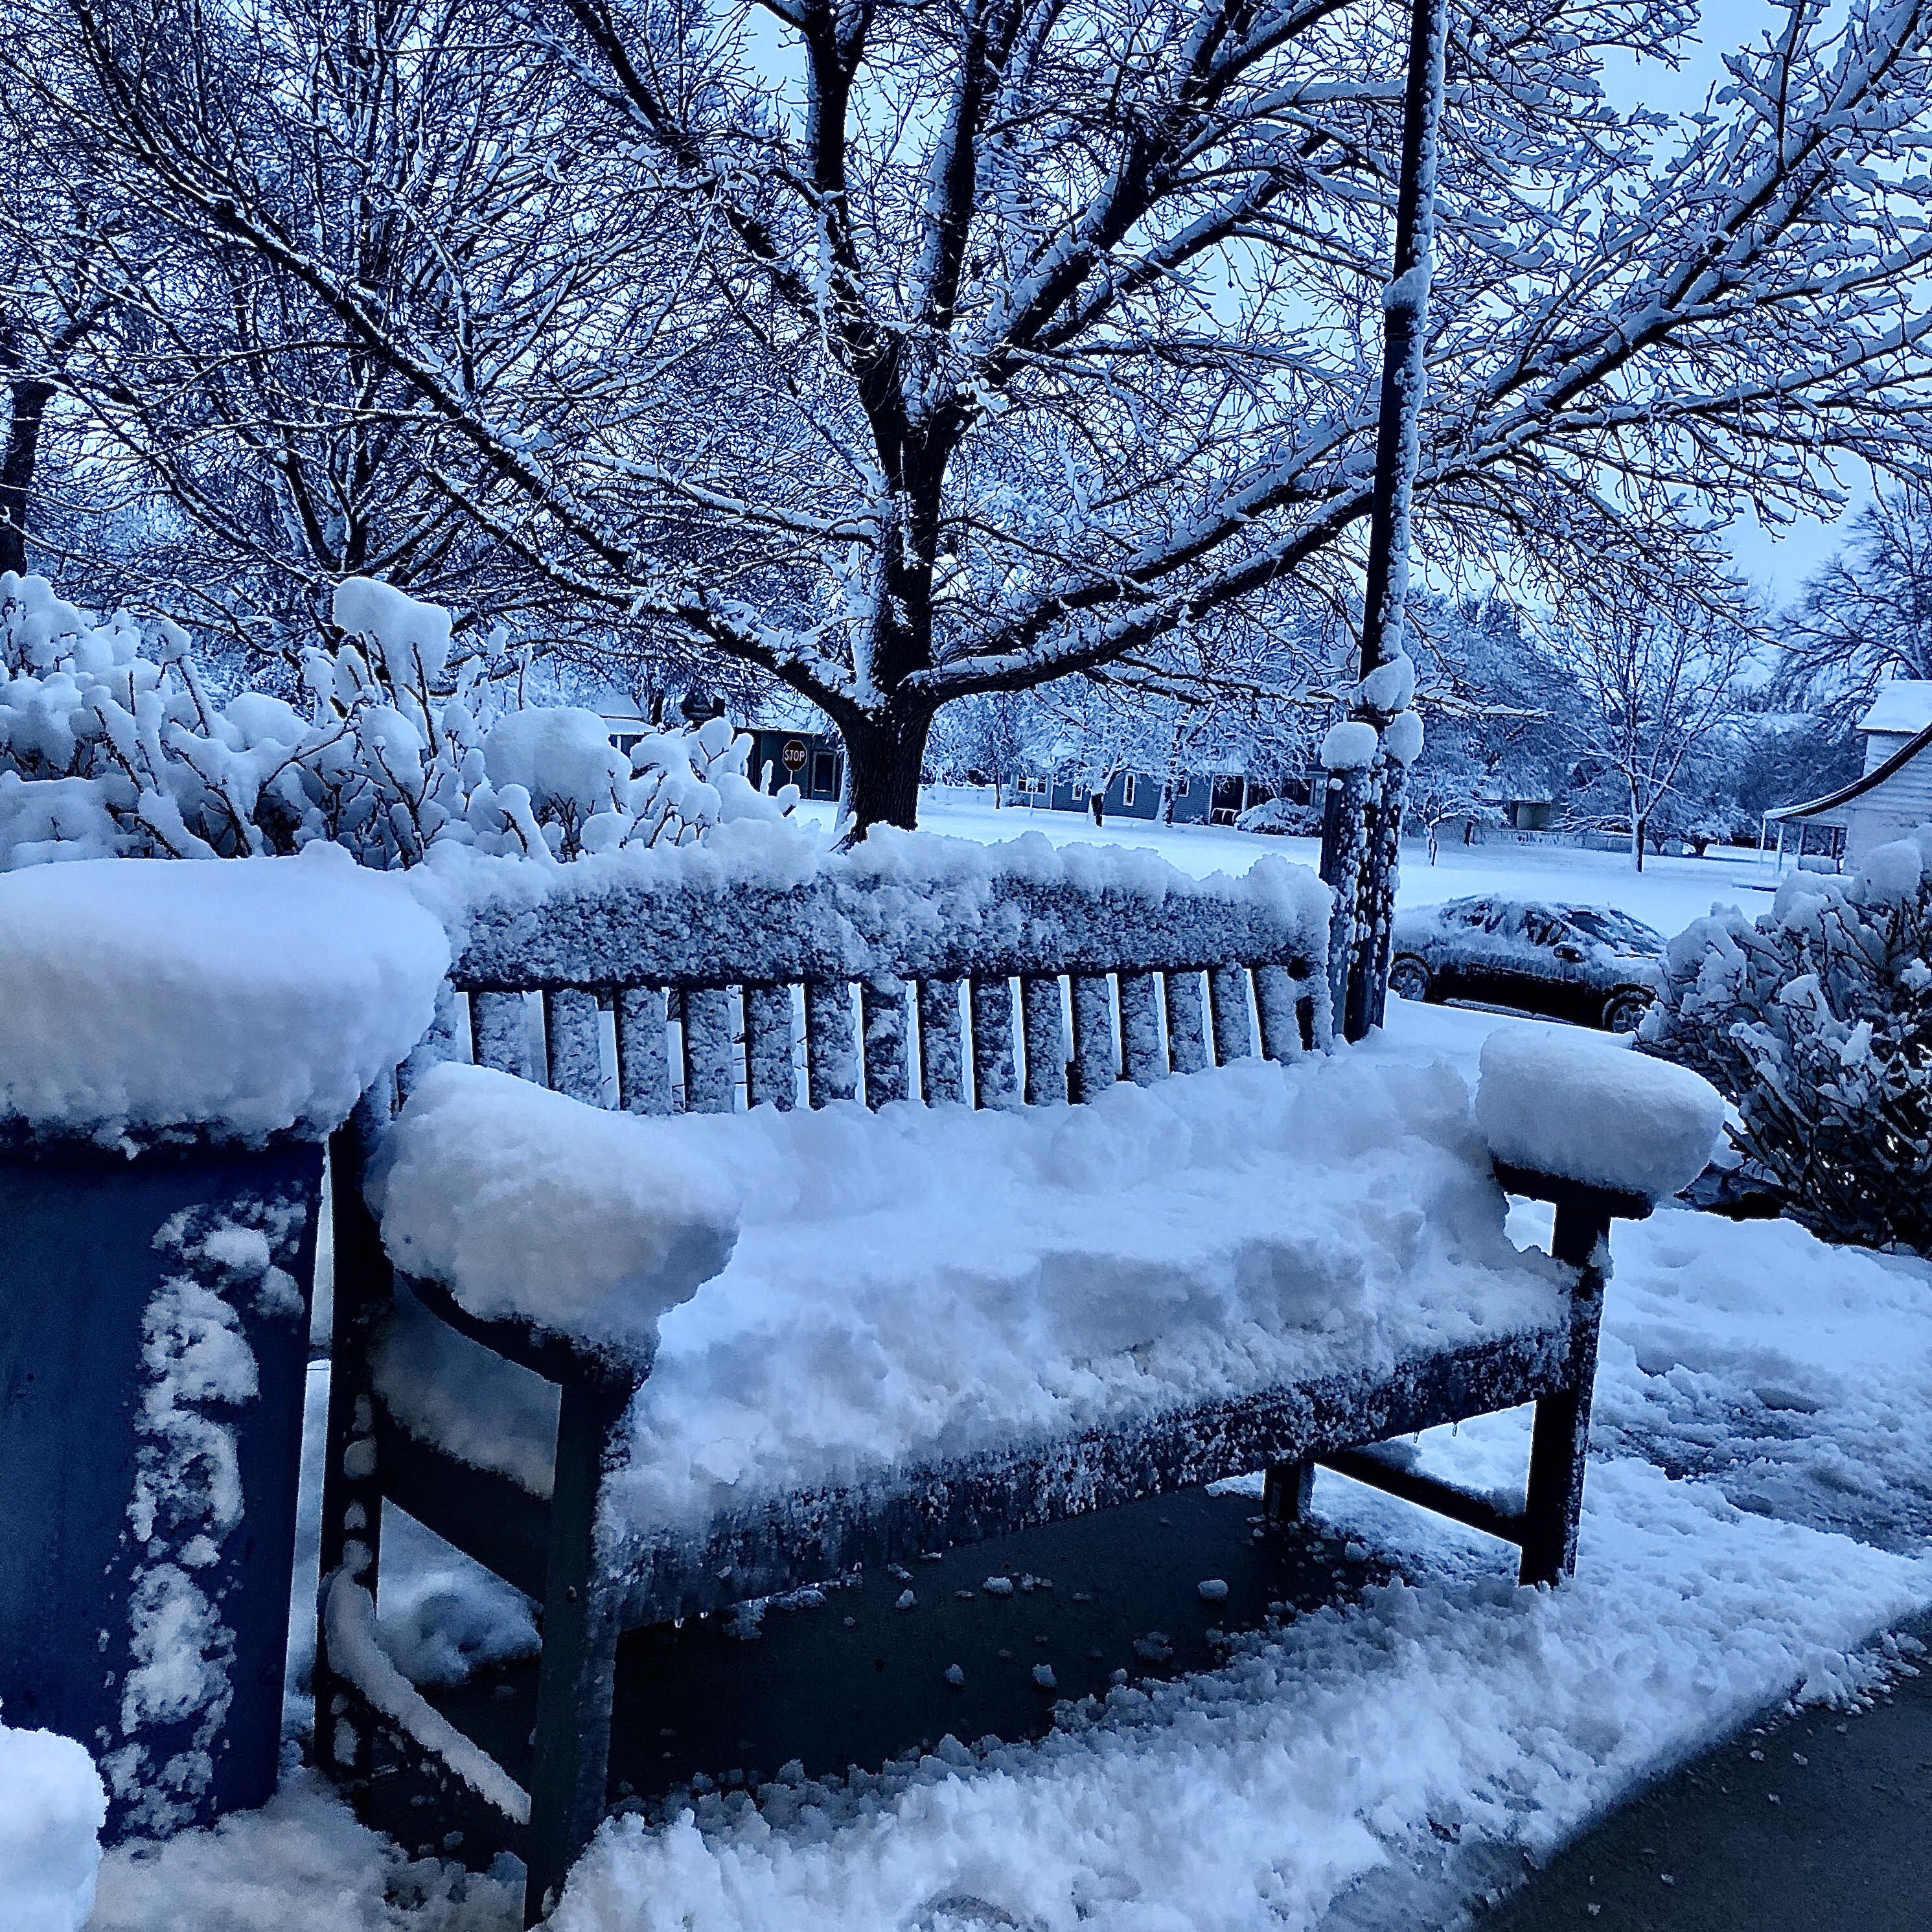
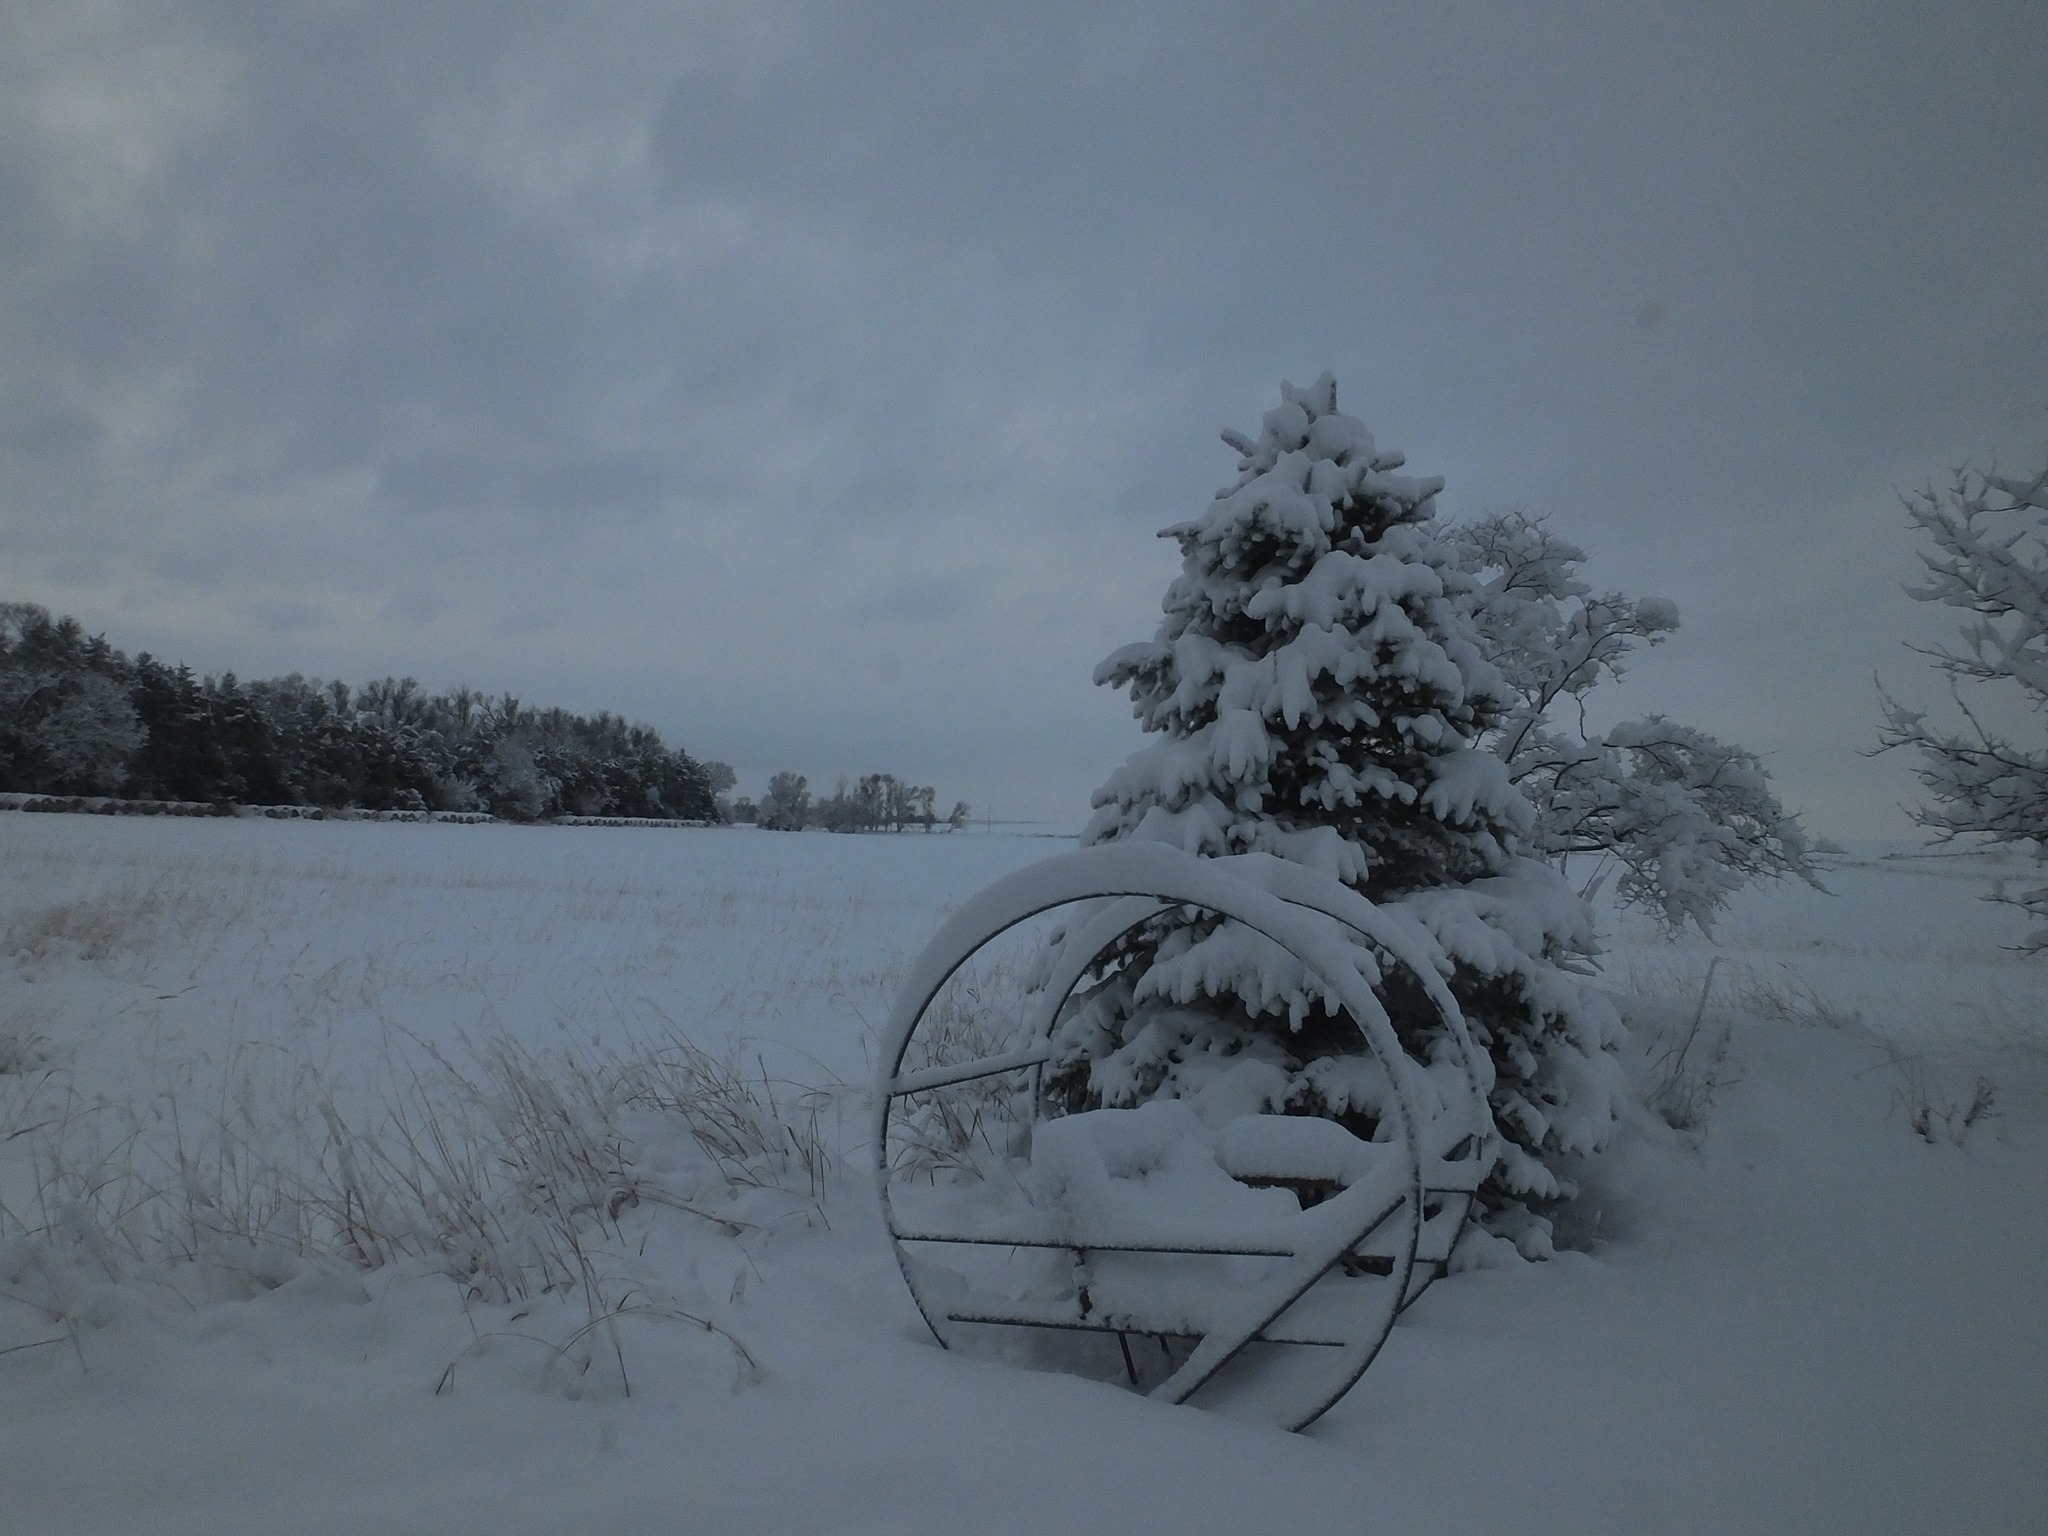
February 25th - A Banded Heavy Snowfall Event
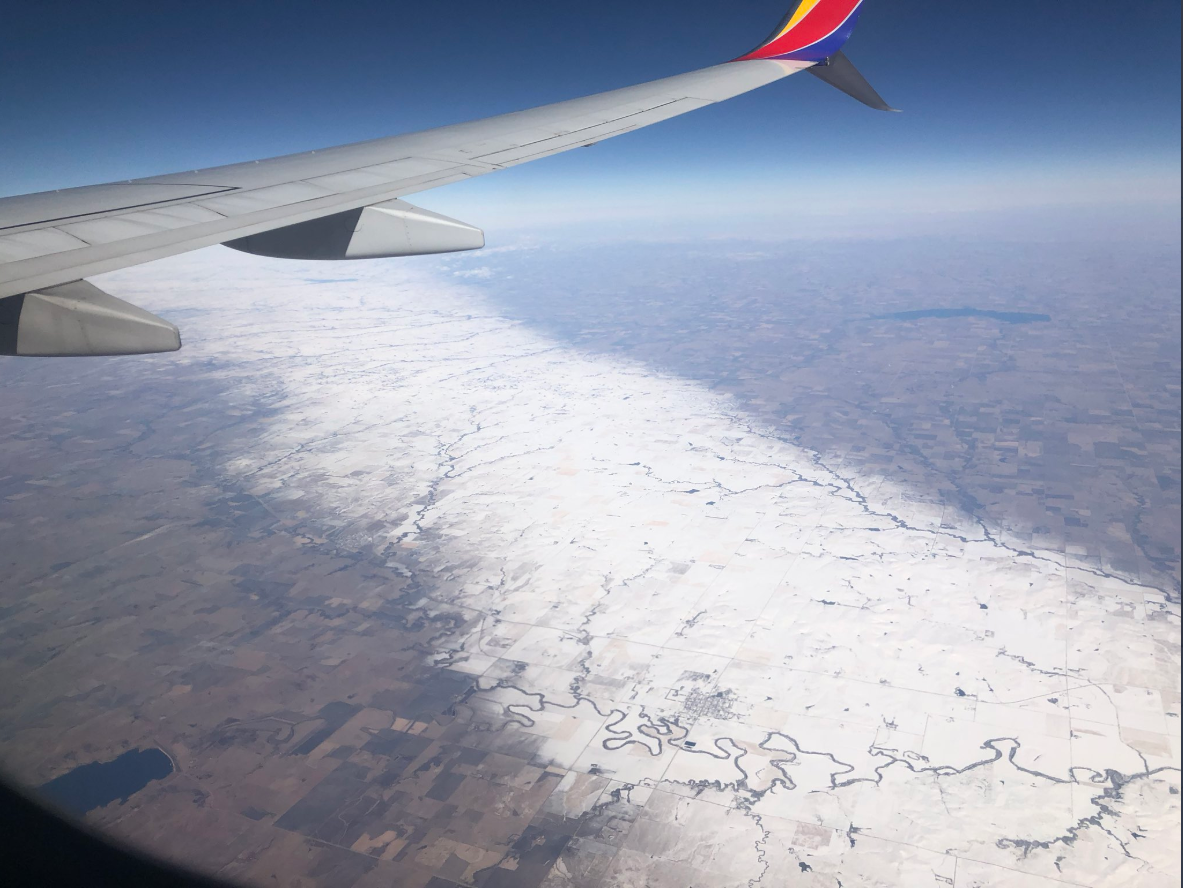
The late evening of February 24th into the morning of Tuesday the 25th featured an intriguing mesoscale snow event where an intense, narrow band of snow developed and produced impressive snowfall rates and amounts. The precipitation began as liquid with spotty rain showers, but as cold air deepened and forcing increased with a potent upper level disturbance crossing the Central Plains, the rain transitioned to snow and intensified. A fairly narrow band of heavy, wet snow focused along a frontal zone early on February 25th, oriented roughly from the Gothenburg and Cozad areas to Edison and Beaver City in south central Nebraska, and southward through the Phillipsburg, Logan and Osborne areas in north central Kansas.
The highest snowfall amounts were concentrated within a swath no more than 10-15 miles wide, with snow totals tapering off to barely a dusting only a few miles on either side of the heavy snow band. Snow amounts within the heart of the band were impressive...generally 6 to 10 inches! Slightly outside the main band, totals of 3 to 4.5 inches fell in the Cambridge, Gothenburg, Cozad, NE and Plainville, KS areas. The snow blanketed the landscape and produced a picturesque setting due to the lack of wind. Aerial photography vividly depicted just how narrow this snow swath was.
 |
 |
 |
| Beaver City, NE photo by Furnas County Sheriff's Office |
Phillipsburg, KS 5.7E photo by David Roberts |
Aerial photo looking north/northwest across mainly Osborne County, KS photo by Leigh Marts |
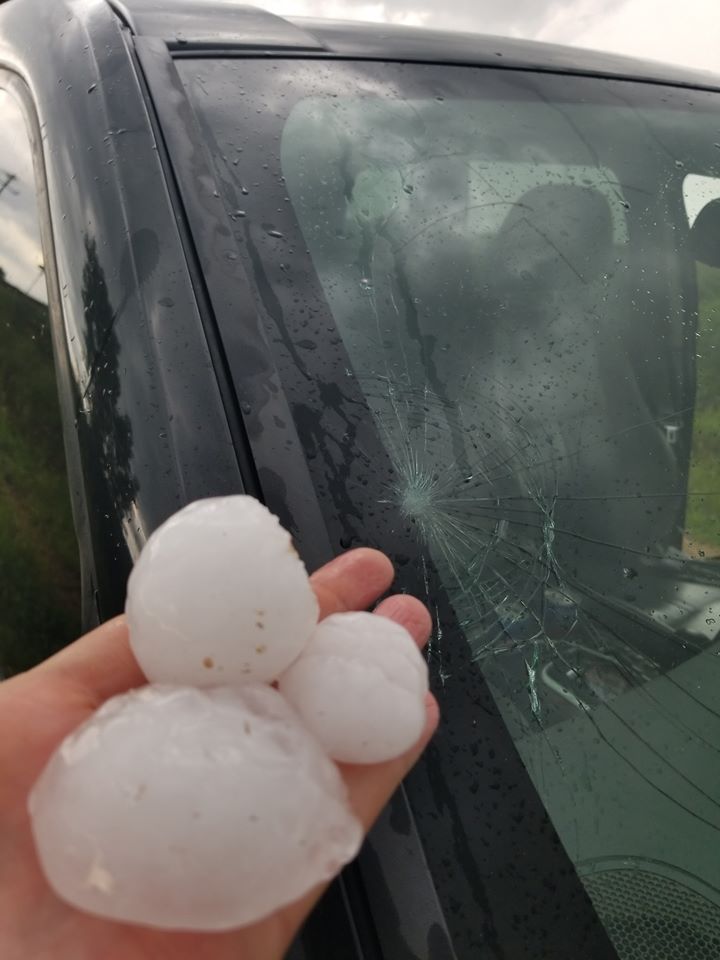
July 8-9th - Severe Thunderstorms Produce Damaging Winds and Large Hail
During the evening of Wednesday, July 8th, thunderstorms developed along a cold front and surface trough in northern and western Nebraska. The storms organized into a line, which advanced south and east across the heart of south central Nebraska and north central Kansas. These severe storms entered the NWS Hastings area after 10pm and lasted well into the early morning hours of Thursday, July 9th, producing significant and widespread straight-line wind damage with numerous reports of gusts at least 60-70 MPH. Trees, tree limbs, crops and power lines were impacted, along with a handful of structures (such as grain bins). Many communities were impacted with brief power outages. There was also some isolated hail up to golf ball size in Furnas County. Additionally, a narrow line of storms trained over the same locations, producing a band of up to 2-3" of rain that caused brief flooding in Mitchell County, KS.
MikeSchardt_CropDamage_Carleton.jpg) |
 |
PrairySky_Hail_Wilsonville_FurnasCounty.jpg) |
| Crop Damage photo by Mike Schardt |
Mobile Home Damaged in Cawker City, KS photo by Mitchell County Emergency Management |
Large Hail in Wilsonville, NE photo by Prairy Sky |
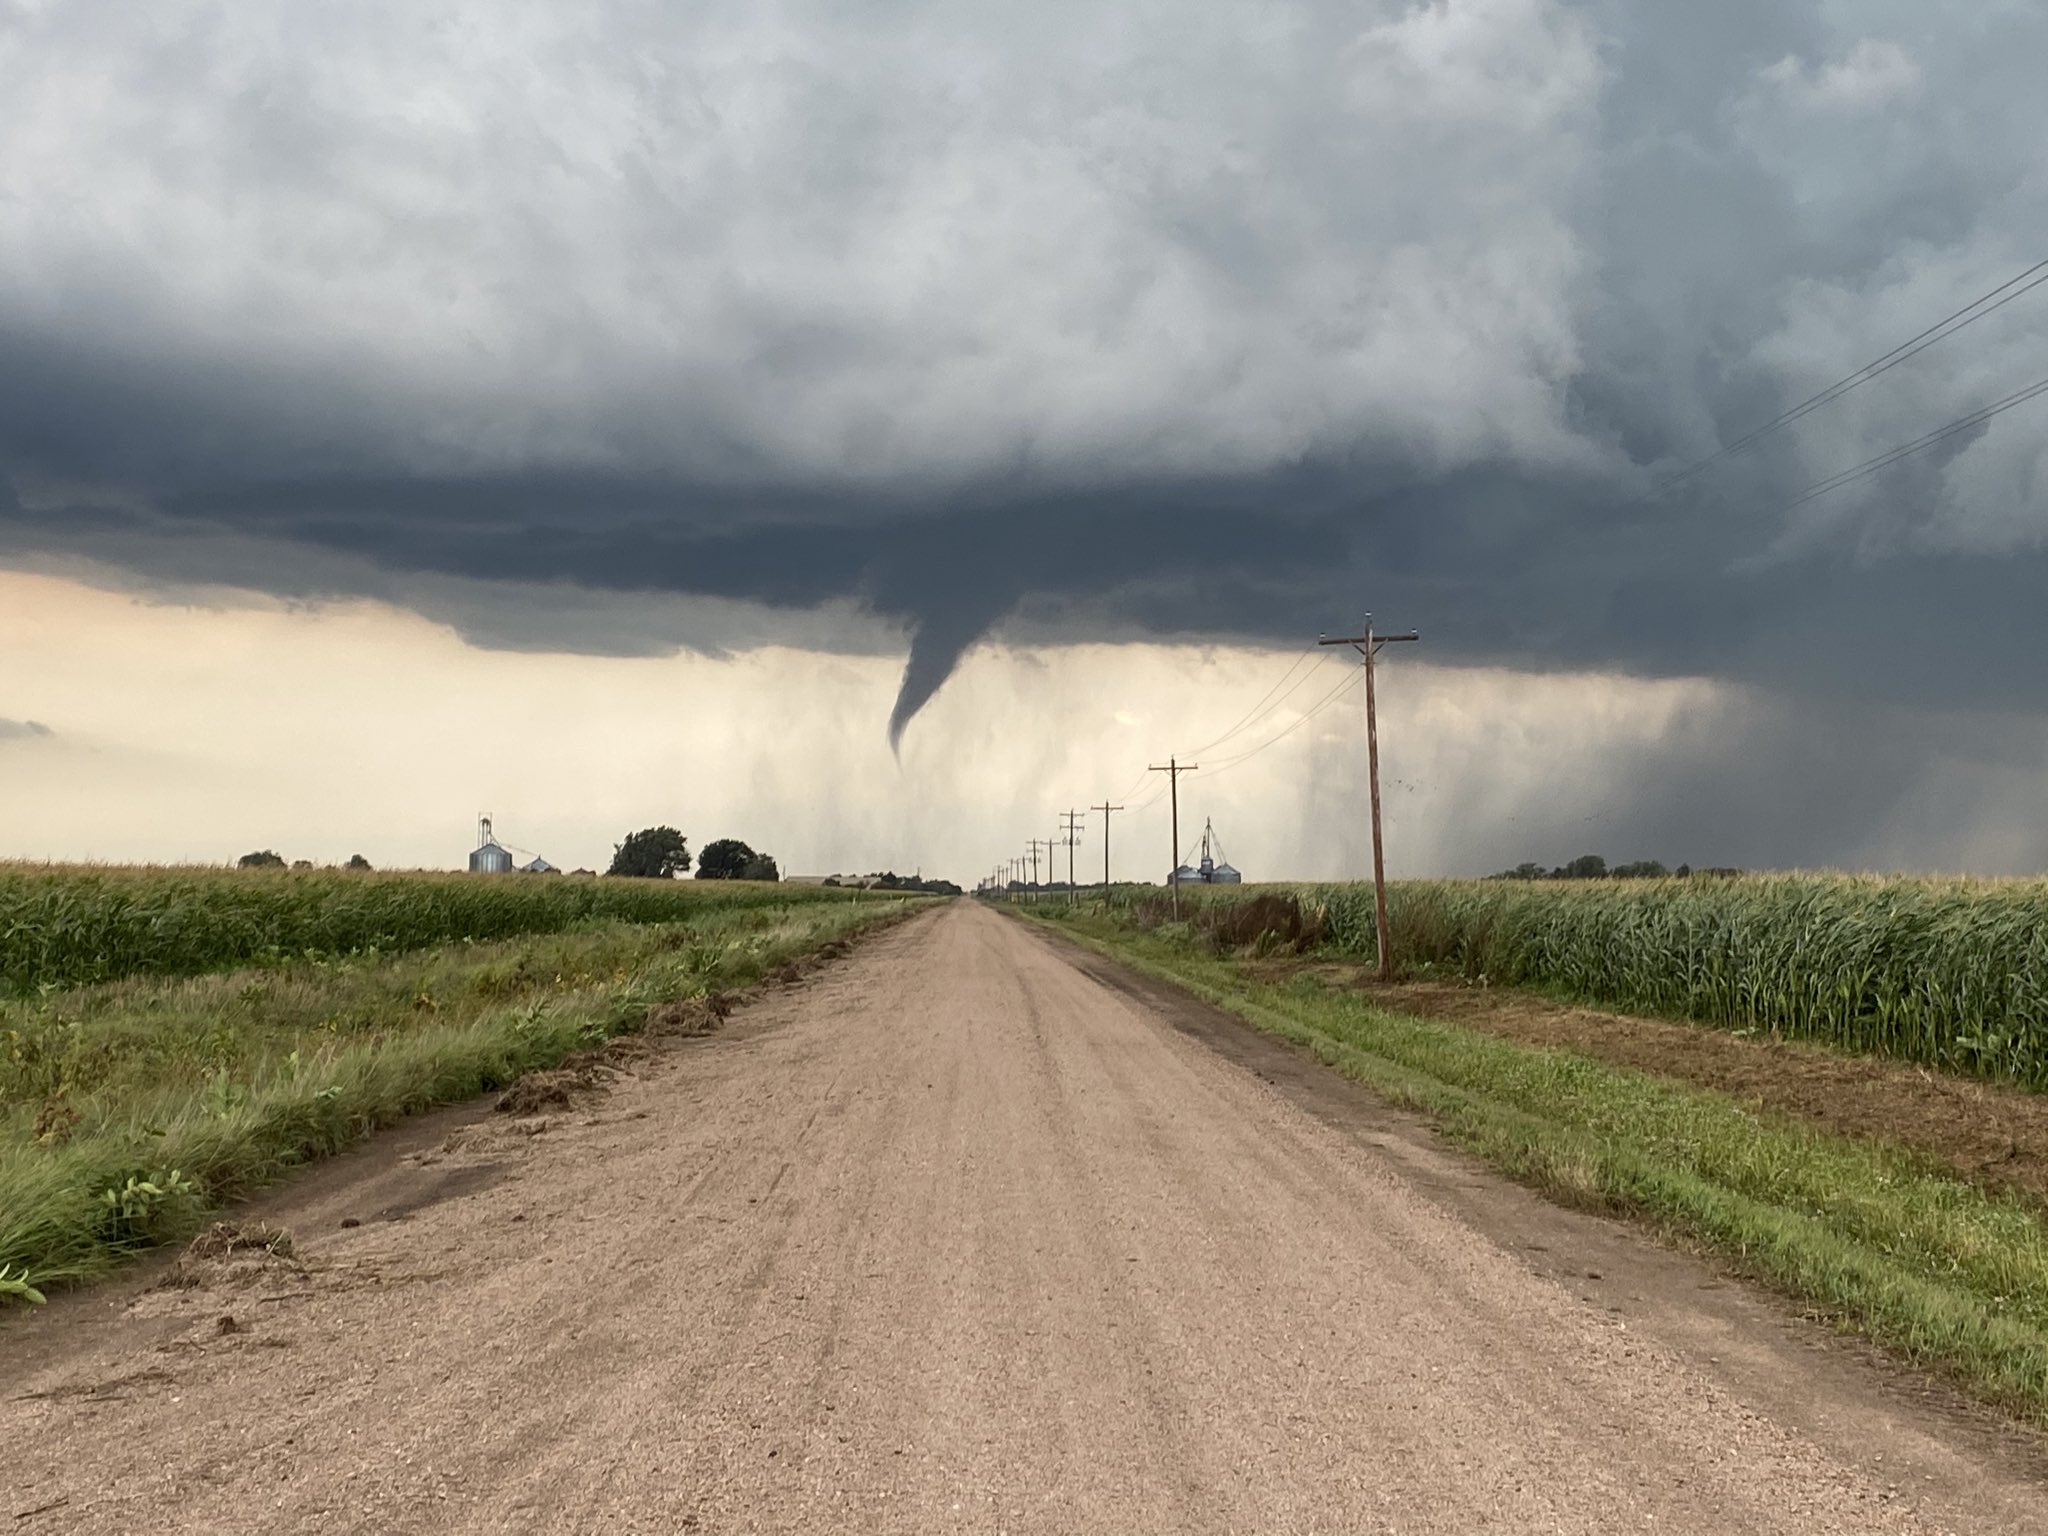
August 14th - Tornadoes and Huge Hail
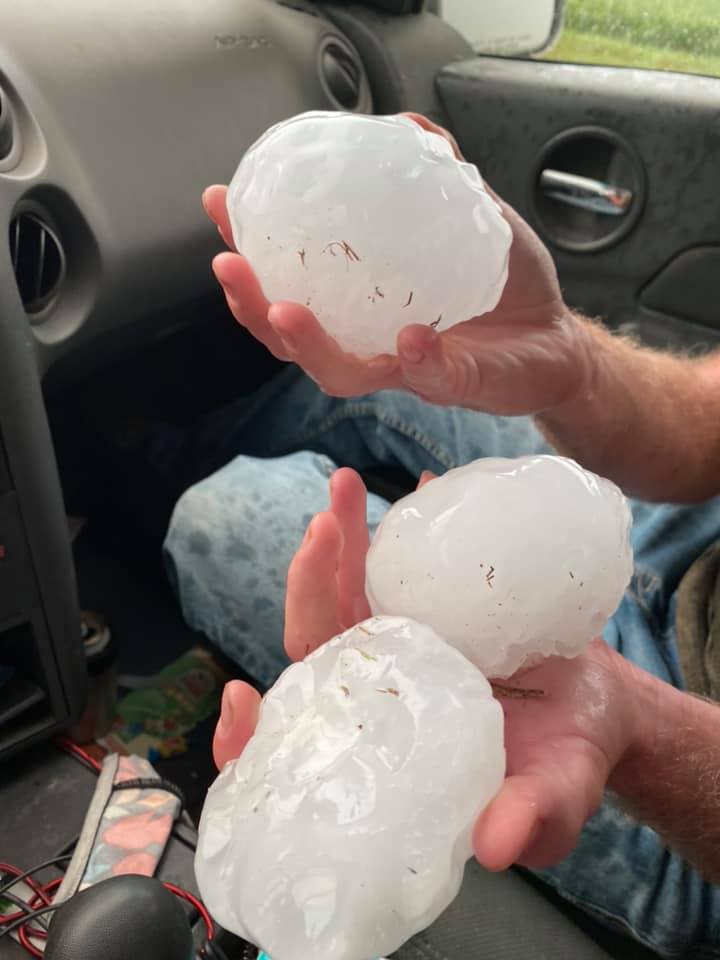
Thunderstorms initiated in the afternoon hours along a cold front, and a supercell thunderstorm first intensified over Polk and northern York Counties and started producing severe hail. The storm built to the south-southwest during the evening and grew in size and intensity, even spawning three brief EF-0 tornadoes. These tornadoes touched down along a roughly 15-mile long corridor from near Interstate 80 to a few miles south of Hampton, NE, to the Stockham and Saronville areas. The tornado near Hampton damaged irrigation pipe, overturned a center pivot, destroyed a lean-to shed and flattened. The tornado in southern Hamilton County began in a freshly rowed alfalfa field and scattered the alfalfa. The tornado between Stockham and Saronville damaged corn and narrowly missed a farmstead and outbuildings.
The main supercell storm continued to trek south during the evening, moving into north central Kansas and merging with another storm as it went on to produce huge hail! The cities of Mankato and Jewell, KS were the hardest hit from copious amounts of tennis ball to softball sized hail. The hail caused extensive damage to homes, vehicles and crops. Farther south, hail the size of ping pong balls impacted Cawker City and golf ball size hail fell in the Osborne area.
 |
 |
 |
| Tornado South of Stockham, NE photo by Kirt Smith |
Large Hail 3N Jewell, KS photo by Kayla Dunstan |
Large Hail 5E Lawrence, NE photo by Mark W |
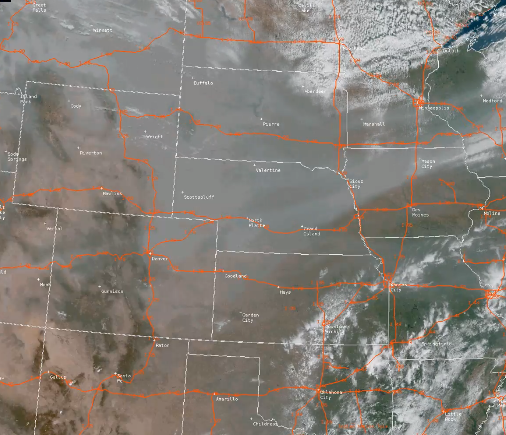
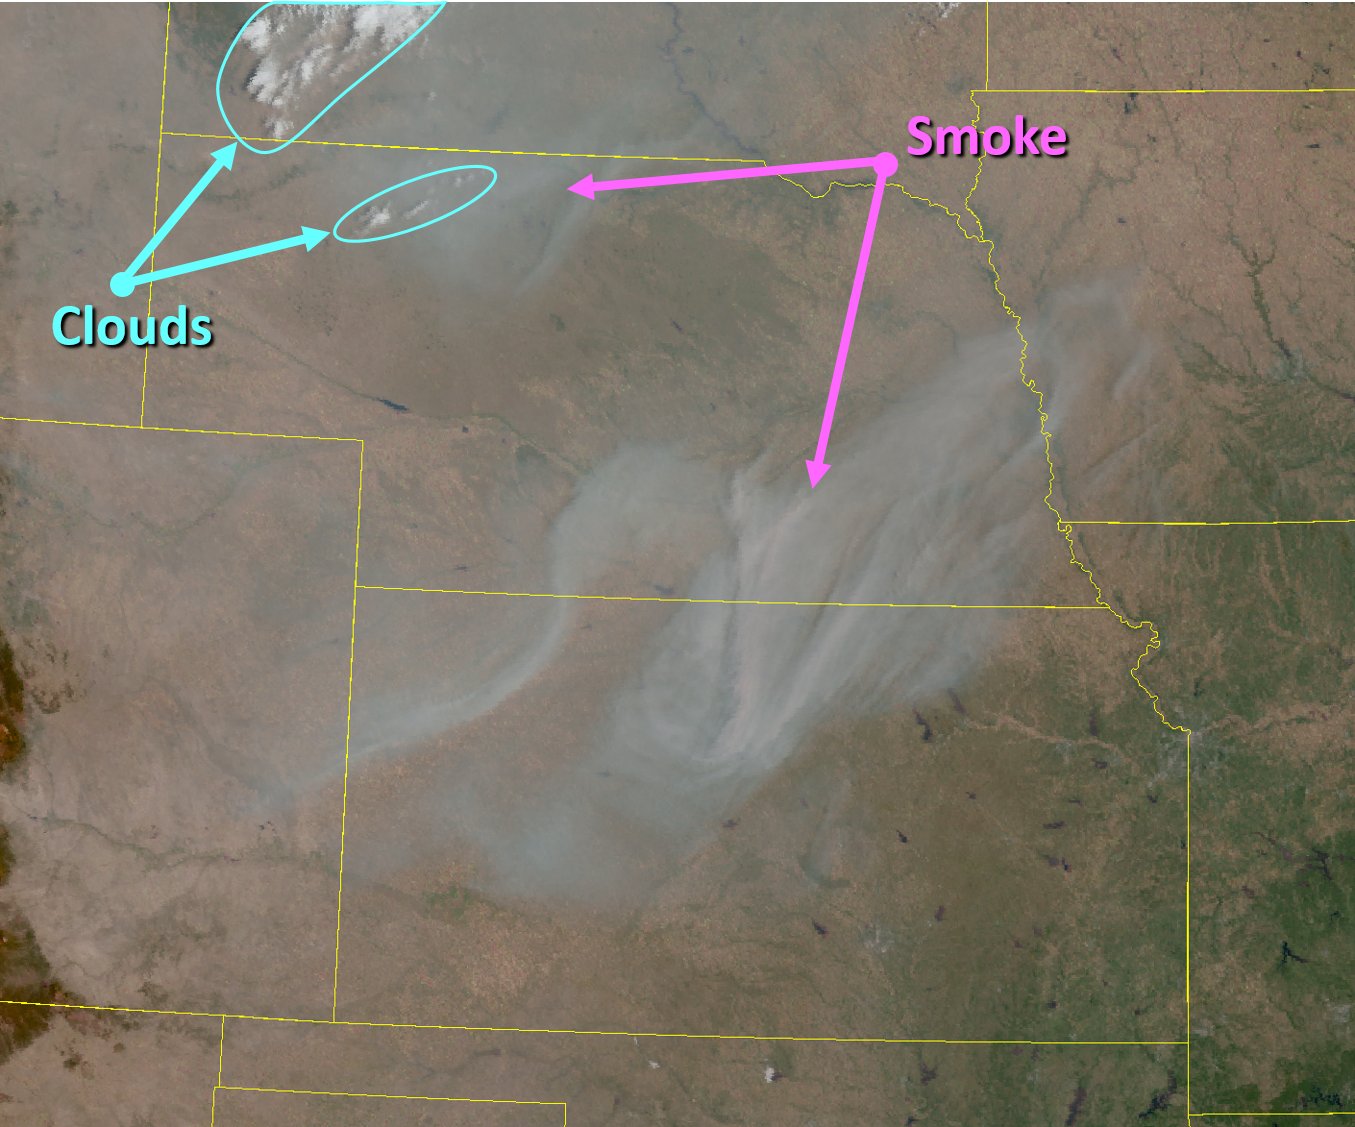
Multiple Days with Hazy Skies from Western United States Wildfire Smoke (Summer-Early Fall)
The 2020 Western United States wildfire season was particularly severe, as a series of major fires raged across states such as Colorado, California, Oregon and Washington (among others). Fires ignited at various times during the summer months and continued into the fall, with extremely dry and at-times windy conditions proving favorable for significant fire growth. Smoke from many of these Western fires was routinely transported eastward by the upper level jet stream, often overspreading the skies across the Central Plains on multiple late summer and early-fall days. This resulted in several days with a notably-hazy/white-looking sky and resultant filtered sunshine affecting many states including Nebraska/Kansas. Even well into October, a resurgence of Colorado wildfire activity provided several more days of smoky/hazy conditions. Although not common, atmospheric conditions occasionally allowed some of the high-level smoke to descend to the surface across our local area, reducing visibility to as low as a few miles and filling the air with a distinct odor.
 |
 |
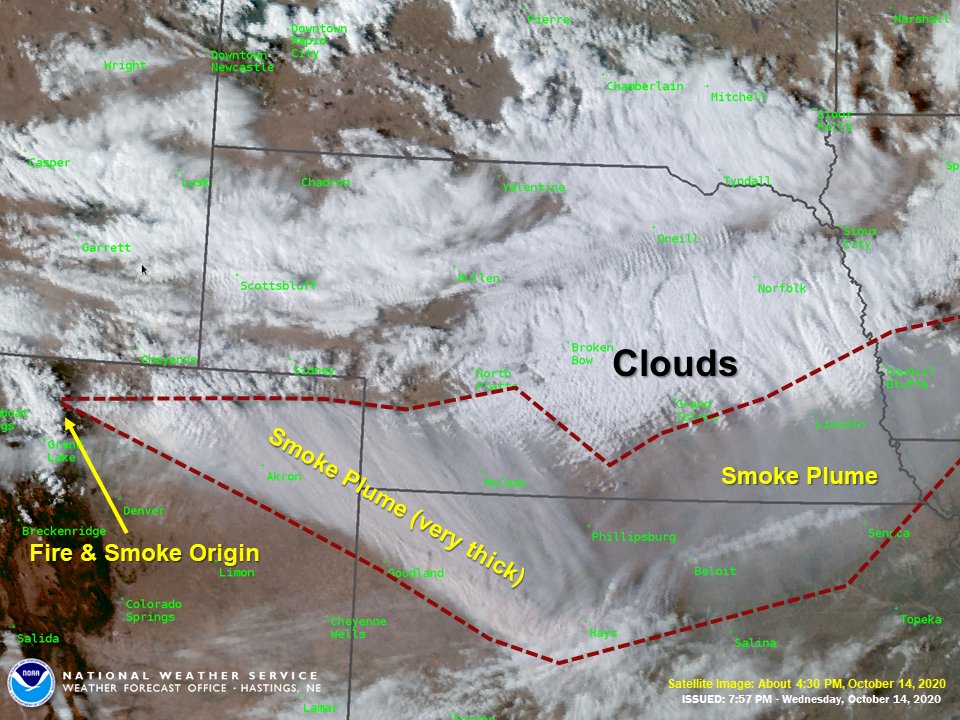 |
| GOES East Visible Satellite Image September 16, 2020 |
GOES East Visible Satellite Image October 5, 2020 |
GOES East Visible Satellite Image October 14, 2020 |
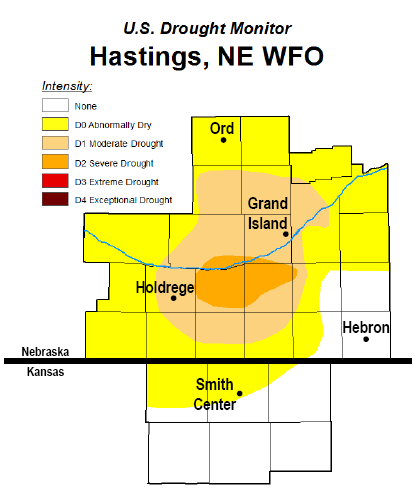
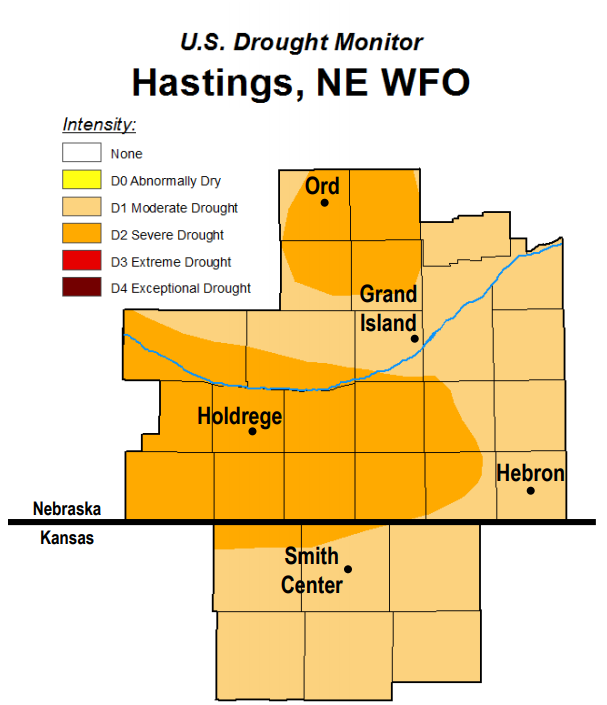
Worsening Drought Conditions (first developing during the summer and worsening in the fall)
The first several months of 2020 started out void of all drought concerns within south central Nebraska/north central Kansas, largely due to a notably-wet 2019. However, during the later spring and early summer, Abnormally Dry (D0) to localized Moderate Drought (D1) began showing up mainly near and south of the Nebraska-Kansas border, while a wet May kept drought at bay across most local counties. But then, rainfall patterns became quite interesting and highly-variable during June-July. Over the course of these two months, most northern, western and particularly southern portions of our coverage area received appreciable rainfall (especially during July), while in contrast, a handful of counties in the heart of south central Nebraska (particularly Kearney/Adams counties) kept missing out on one rain event after another, allowing Moderate Drought (D1) to take hold. Finally, August came around and nearly the ENTIRE 24-county area was dealt well-below-normal rain (most areas only 10-40 percent of the monthly normal). This lack of August rain, in tandem with a notably-hot nine-day stretch centered from Aug. 20-28 (highs in the 90s each day), finally prompted the introduction of Severe Drought (D2) to parts of south central Nebraska for the first time since early-2017 . As drier-than-normal conditions persisted into the fall season, drought conditions gradually worsened with time, with both D1 and D2 drought not only expanding across most of the area, but also allowing for the introduction of D3 Extreme Drought to southwestern local counties (such as Furnas/Gosper/Phelps/Harlan) in late-November. This marked the first instance of D3 in any portion of our coverage area since 2014!
Looking at some specific numbers for the four-month period covering August-November, the driest portions of our area (mainly within/near the D3 area) only measured about 15-25% of normal precipitation. A few of the very driest official NWS observer stations during this stretch included: Lexington 6SSE with 1.07" (driest on record), Elwood 8S with 1.47" (driest on record), Phillipsburg KS 1.88" (driest on record), Holdrege 2.18" (2nd-driest on record) and Minden 2.20" (driest on record).
Ending on a somewhat-positive note, while the final part of the year brought little-to-no improvement in official drought categories, a few rounds of beneficial moisture did arrive during November and the first half of December. Also, given that widespread drought conditions did not really materialize until later in the summer and fall, and that the first part of 2020 (and the entirety of the preceding few years) had been rather wet, there were no really no serious/noteworthy drought impacts within our coverage area during the year (such as devastating/widespread crop loss, major water shortages etc.), although some dryland crops and pastures did exhibit drought stress.
 |
 |
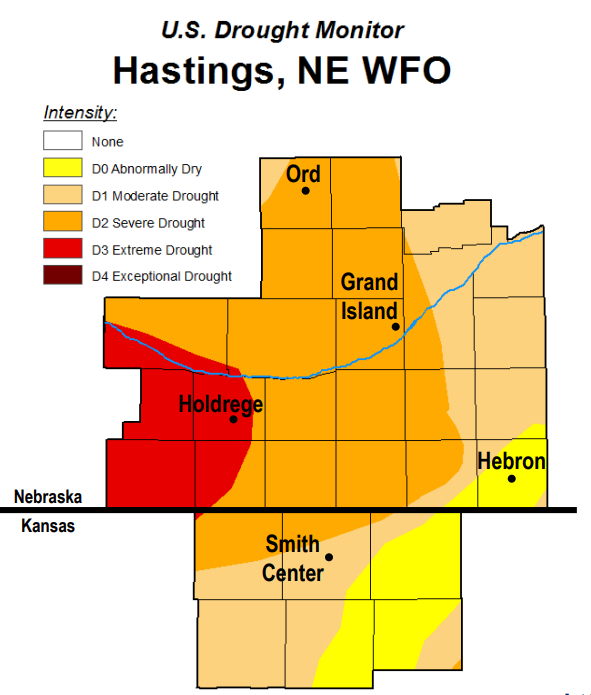 |
| Drought Conditions September 3rd | Drought Conditions November 12th | Drought Conditions December 10th |
(data from NWS Cooperative & CocCoRaHs/NeRAIN observers) |
** Please note: data below updated 3-17-2021 **
Hottest Temperatures
Coldest Temperatures
Highest Annual Precipitation ("normal" annual precip generally ranges from 23-30")
Lowest Annual Precipitation (only includes stations with no more than a few days of missing data)
Highest Calendar-Month Precipitation
Highest 24-hour Rain Totals (for a roughly 7am-7am period ending on the specified date)
Highest Calendar-Month Snowfall
Highest Storm-Total Snowfall (defined as highest 1-2 day totals)
Nebraska Tri-Cities Extremes and Totals (Grand Island, Hastings, and Kearney airports)
Please visit the following sites for a wealth of additional local climate information:
- NOWData....official temp/precip/snow data for any NWS observation site in our coverage area
- Daily/Monthly/Annual Precipitation Maps (maintained by NWS Hastings)
- 24 to 72 hour Observed Snowfall Maps (maintained by NWS Hastings)
- NWS Hastings Local Climate Page (various additional weather/climate info)
- High Plains Regional Climate Center (HPRCC)...information for the entire High Plains region (not just our coverage area)