Dangerous and extreme heat will remain across portions of the southern U.S. this week. Heavy rainfall may bring significant flash flooding across portions of the Mid-Atlantic and Northeast through the night, and additional flash flooding concerns across New England on Wednesday. Monsoonal thunderstorms will bring a flash flood risk to the Four Corners region, especially in burn scar areas Read More >
2020 Precipitation Summary and Monthly Details for 5 Sites (Including Tri Cities):
(see tabs below for site-specific details)
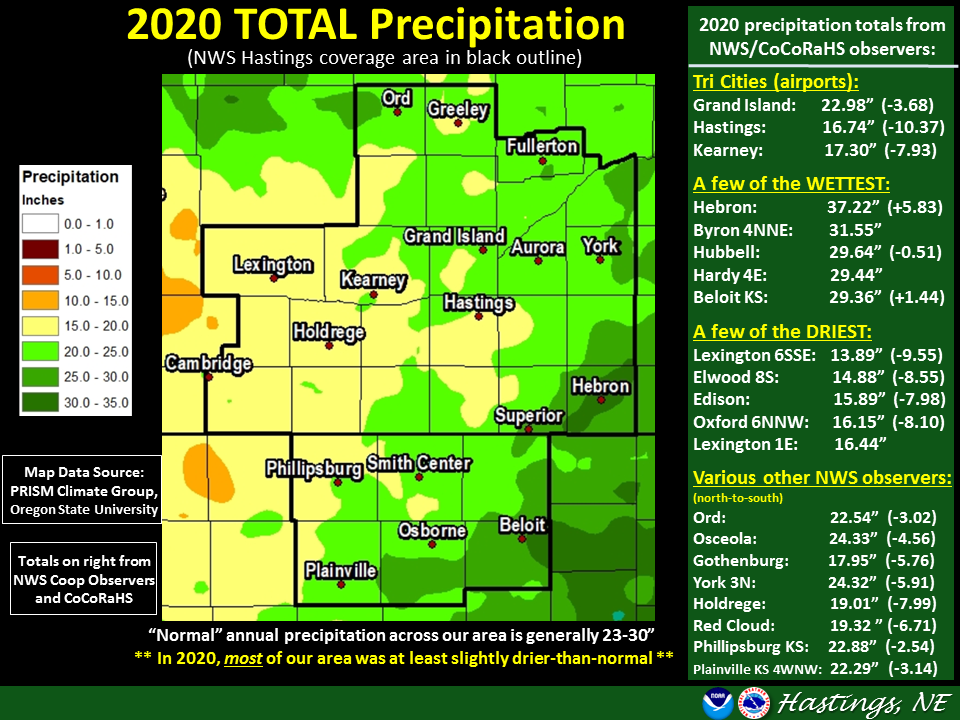
Following 2 rather wet years in 2018-19 (especially 2019), things took a noticeably-drier turn in 2020, sending nearly our entire 30-county coverage area into varying degrees of drought during the latter half of the year. Based on ground-truth measurements from dozens of NWS and CoCoRaHS/NeRAIN observers and also radar-estimated analysis, roughly 90% of our area received at least slightly below-normal annual precipitation, and around half of it tallied no more than 75% normal (based on official 30-year normals from NCEI). With little exception, the overall-driest areas (overall and versus normal) focused within several Nebraska counties along and west of the Highway 281 corridor, along with portions of particularly Phillips/Smith counties in north central KS. In contrast, the overall-wettest areas concentrated mainly in far eastern portions of our Nebraska area (especially parts of Thayer/Nuckolls/Fillmore counties) along with much of Mitchell/Osborne/Jewell counties in KS. However, even in the comparably-wetter areas, Thayer and Mitchell were the only two counties in our 30-county area to see predominantly slightly-above normal precipitation. |
2020 Nebraska Cooperative Observer Precipitation Totals (around 45 sites)
2020 Kansas Cooperative Observer Precipitation Totals (around 15 sites)
Top Weather Events of 2020 Story (For Our Coverage Area)
Grand Island & Hastings Details - 12-Month Climate History:
| Grand Island (Regional Airport ASOS) - Jan. 2020 - Dec. 2020 | |||||||||||||
| Jan. | Feb. | Mar. | Apr. | May | June | July | Aug. | Sept. | Oct. | Nov. | Dec. | 2020 | |
| Average High (F) | 35.0 | 44.1 | 53.5 | 64.7 | 69.9 | 90.2 | 88.0 | 88.1 | 78.7 | 63.5 | 58.9 | 43.5 | |
| Average Low (F) | 19.7 | 19.8 | 32.5 | 34.1 | 49.7 | 65.1 | 66.7 | 64.9 | 51.6 | 37.1 | 31.7 | 21.1 | |
| Average Temperature (F) | 27.4 | 31.9 | 43.0 | 49.4 | 59.8 | 77.6 | 77.4 | 76.1 | 65.2 | 50.3 | 45.3 | 32.3 | 53.0 |
| Departure From Normal | +2.3 | +2.8 | +3.6 | -1.2 | -1.4 | +6.3 | +1.2 | +2.1 | +0.1 | -1.9 | +7.2 | +5.6 | +2.2 |
| Precipitation (in) | 1.18 | 0.11 | 2.86 | 0.76 | 7.48 | 1.82 | 4.55 | 0.54 | 1.24 | 0.08 | 1.16 | 1.20 | 22.98 |
| Departure From Normal | +0.65 | -0.57 | +1.06 | -1.77 | +3.07 | -2.48 | +1.15 | -2.58 | -0.99 | -1.78 | -0.01 | +0.57 | -3.68 |
| Snowfall (in) | 4.3 | 2.0 | 4.5 | 3.9 | 0.0 | 0.0 | 0.0 | 0.0 | T | 0.7 | 0.8 | 12.0 | |
| Departure From Normal | -2.2 | -4.3 | -0.9 | +2.4 | 0.0 | 0.0 | 0.0 | 0.0 | -0.1 | -0.3 | -2.3 | +6.9 | |
| Hastings (Municipal Airport ASOS) - Jan. 2020 - Dec. 2020 | |||||||||||||
| Jan. | Feb. | Mar. | Apr. | May | June | July | Aug. | Sept. | Oct. | Nov. | Dec. | 2020 | |
| Average High (F) | 35.3 | 43.5 | 54.1 | 64.0 | 69.6 | 89.1 | 88.4 | 87.6 | 77.5 | 62.3 | 58.1 | 43.5 | |
| Average Low (F) | 19.8 | 19.8 | 32.7 | 33.8 | 49.5 | 65.1 | 66.8 | 64.2 | 52.6 | 37.5 | 32.1 | 22.5 | |
| Average Temperature (F) | 27.5 | 31.6 | 43.4 | 48.9 | 59.5 | 77.1 | 77.6 | 75.9 | 65.1 | 49.9 | 45.1 | 33.0 | 52.9 |
| Departure From Normal | +1.5 | +1.7 | +3.5 | -1.8 | -1.8 | +5.3 | +0.5 | +1.6 | -0.5 | -2.7 | +6.4 | +5.4 | +1.6 |
| Precipitation (in) | 0.98 | 0.13 | 2.19 | 0.88 | 4.50 | 0.97 | 3.14 | 0.39 | 1.16 | 0.21 | 1.38 | 0.81 | 16.74 |
| Departure From Normal | +0.57 | -0.36 | +0.40 | -1.68 | -0.07 | -2.83 | -0.60 | -2.91 | -1.40 | -1.78 | +0.09 | +0.20 | -10.37 |
| Snowfall (in) | 4.1 | 2.1 | 5.3 | 2.5 | 0.0 | 0.0 | 0.0 | 0.0 | T | 2.8 | 0.2 | 11.1 | |
| Departure From Normal | -1.9 | -4.4 | +0.1 | +1.3 | 0.0 | 0.0 | 0.0 | 0.0 | -0.2 | +1.8 | -2.4 | +5.0 | |
Kearney - 12 Month Climate History:
All data here is from the official NWS observer at Kearney airport, with 24-hour observations taken around 7 a.m. ** PLEASE NOTE: This official Kearney data often differs slightly from the unofficial data recorded by the automated airport system (KEAR) **
| Kearney Airport (Coop Observer) - Jan. 2020 - Dec. 2020 | |||||||||||||
| Jan. | Feb. | Mar. | Apr. | May | June | July | Aug. | Sept. | Oct. | Nov. | Dec. | 2020 | |
| Average High (F) | 35.2 | 42.6 | 53.0 | 62.1 | 68.7 | 88.8 | 88.2 | 88.2 | 77.9 | 62.1 | 58.6 | 42.6 | |
| Average Low (F) | 18.2 | 18.6 | 30.9 | 31.8 | 47.7 | 64.1 | 66.2 | 62.7 | 49.9 | 35.3 | 30.4 | 19.3 | |
| Average Temperature (F) | 26.7 | 30.6 | 42.0 | 47.0 | 58.2 | 76.5 | 77.2 | 75.4 | 63.9 | 48.7 | 44.5 | 31.0 | 51.8 |
| Departure From Normal | +2.1 | +2.5 | +4.3 | -1.7 | -1.3 | +6.7 | +2.5 | +2.8 | +0.4 | -2.2 | +7.5 | +5.1 | +2.4 |
| Precipitation (in) | 0.82 | 0.27 | 2.13 | 0.77 | 6.66 | 1.67 | 1.81 | 0.35 | 1.14 | 0.17 | 0.60 | 0.91 | 17.30 |
| Departure From Normal (in) | +0.33 | -0.28 | +0.34 | -1.46 | +2.48 | -2.26 | -1.47 | -2.73 | -0.93 | -1.87 | -0.42 | +0.34 | -7.93 |
| Snowfall (in) | 1.8 | 2.9 | 6.2 | 3.0 | 0.0 | 0.0 | 0.0 | 0.0 | 0.0 | 2.0 | 0.8 | 11.0 | |
| Departure From Normal (in) | -2.6 | -2.2 | +1.6 | +1.2 | 0.0 | 0.0 | 0.0 | 0.0 | -0.2 | +1.3 | -2.3 | +7.5 | |
Ord - 12 Month Climate History:
All snowfall data is from the NWS Cooperative Observer in town. In addition, winter precipitation totals often include Cooperative Observer data given that the automated airport equipment is not designed to accurately melt snowfall liquid equivalent.
| Ord (Evelyn Sharp Field ASOS) - Jan. 2020 - Dec. 2020 | |||||||||||||
| Jan. | Feb. | Mar. | Apr. | May | June | July | Aug. | Sept. | Oct. | Nov. | Dec. | 2020 | |
| Average High (F) | 34.5 | 42.3 | 52.5 | 61.3 | 67.0 | 87.0 | 87.0 | 87.0 | 77.0 | 60.5 | 58.0 | 43.8 | |
| Average Low (F) | 16.6 | 15.5 | 29.2 | 28.9 | 45.2 | 60.8 | 63.0 | 60.2 | 47.5 | 32.1 | 24.6 | 16.1 | |
| Average Temperature (F) | 25.6 | 28.9 | 40.8 | 45.1 | 56.1 | 73.9 | 75.0 | 73.6 | 62.3 | 46.3 | 41.3 | 30.0 | 49.9 |
| Departure From Normal | +1.0 | +1.1 | +3.1 | -3.7 | -3.2 | +4.7 | +0.6 | +0.6 | -1.3 | -3.3 | +5.0 | +5.1 | +0.8 |
| Precipitation (in) | 0.77 | 0.14 | 2.30 | 0.70 | 4.14 | 2.59 | 7.79 | 0.28 | 0.57 | 1.16 | 0.77 | 0.73 | 21.94 |
| Departure From Normal (in) | +0.40 | -0.30 | +0.85 | -1.89 | +0.33 | -1.53 | +4.82 | -2.88 | -1.87 | -0.77 | -0.30 | +0.14 | -3.00 |
| Snowfall (in) | 4.8 | 3.8 | 7.0 | 5.0 | 0.0 | 0.0 | 0.0 | 0.0 | 0.0 | 9.5 | 2.7 | 12.5 | |
| Departure From Normal (in) | -2.0 | -2.2 | +1.1 | +2.5 | 0.0 | 0.0 | 0.0 | 0.0 | 0.0 | +8.4 | -4.7 | +5.1 | |
Smith Center, KS - 12 Month Climate History:
All data is from the official NWS observer, with 24-hour observations taken around 7 a.m. As a result, data may vary slightly from a true "Calendar Day".
| Smith Center KS (NWS Coop Observer) - Jan. 2020 - Dec. 2020 | |||||||||||||
| Jan. | Feb. | Mar. | Apr. | May | June | July | Aug. | Sept. | Oct. | Nov. | Dec. | 2020 | |
| Average High (F) | 39.4 | 45.9 | 57.2 | 66.8 | 72.3 | 92.0 | 90.8 | 90.0 | 80.0 | 65.0 | 62.0 | 47.2 | |
| Average Low (F) | 20.0 | 18.0 | 31.6 | 33.9 | 47.5 | 63.3 | 66.7 | 62.9 | 50.9 | 37.5 | 31.3 | 21.7 | |
| Average Temperature (F) | 29.7 | 32.3 | 44.4 | 50.4 | 59.9 | 77.7 | 78.7 | 76.4 | 65.4 | 51.3 | 46.7 | 34.4 | 53.9 |
| Departure From Normal | +2.0 | +0.3 | +2.8 | -2.1 | -3.8 | +3.7 | -1.0 | -0.8 | -2.8 | -3.5 | +6.3 | +5.6 | +0.5 |
| Precipitation (in) | 0.92 | 0.09 | 0.87 | 0.26 | 3.59 | 2.59 | 9.66 | 0.38 | 0.90 | 0.05 | 1.26 | 0.12 | 20.69 |
| Departure From Normal (in) | +0.43 | -0.49 | -1.00 | -2.01 | -0.33 | -1.02 | +5.79 | -2.92 | -1.14 | -1.83 | +0.04 | -0.54 | -5.02 |
| Snowfall (in) | 1.9 | 0.8 | 1.3 | T | 0.0 | 0.0 | 0.0 | 0.0 | 0.0 | 0.6 | T | 1.8 | |
| Departure From Normal (in) | -1.8 | -3.3 | -1.3 | -0.6 | 0.0 | 0.0 | 0.0 | 0.0 | -0.2 | +0.2 | -1.8 | -1.4 | |
 |
Media use of NWS Web News Stories is encouraged! Please acknowledge the NWS as the source of any news information accessed from this site. |
|