A significant heat wave continues for the Rockies, Northern Plains, and Great Lakes into the Mid-Atlantic, peaking in intensity through midweek and lingering across parts of the Northern Plains and Midwest until this weekend. Excessive rainfall my bring life-threatening and locally catastrophic flash and urban flooding across portions of southwestern Texas through early Friday. Read More >
2021 Precipitation Analysis for Our Entire Coverage Area...Including Map, Tables, Extremes, Tri Cities Details, etc.
(click tabs below for a wealth of 2021 data including precipitation extremes)
2021 was a somewhat odd precipitation year within our 30-county coverage area, especially considering that one particular month (March...of all months!) had FAR MORE of an influence on annual totals than is typical (more on that in a bit). |
Grand Island & Hastings - 2021 Monthly Details:
NOTE: snowfall in Grand Island is measured by the NWS Observer located near the airport. Snowfall for Hastings is measured at the NWS office just north of town (however, all official temperature and most liquid precipitation data is from the automated airport sensor on the west side of town).
| Grand Island (Regional Airport ASOS) - 2021 Monthly Details | |||||||||||||
| Jan | Feb | Mar | Apr | May | Jun | Jul | Aug | Sep | Oct | Nov | Dec | 2021 | |
| Average High (F) | 39.1 | 24.3 | 57.7 | 64.6 | 71.5 | 89.7 | 87.6 | 87.6 | 83.3 | 68.4 | 57.6 | 48.5 | |
| Average Low (F) | 22.3 | 6.7 | 34.2 | 38.2 | 51.2 | 62.9 | 65.9 | 65.0 | 55.8 | 43.3 | 32.3 | 22.6 | |
| Average Temperature (F) | 30.7 | 15.5 | 46.0 | 51.4 | 61.4 | 76.3 | 76.8 | 76.3 | 69.5 | 55.8 | 44.9 | 35.5 | 53.3 |
| Departure From Normal | +4.8 | -14.2 | +5.3 | +0.4 | -0.6 | +3.5 | -0.2 | +1.7 | +2.9 | +2.7 | +5.3 | +6.6 | +1.5 |
| Precipitation (in) | 1.32 | 0.80 | 8.65 | 1.43 | 2.89 | 1.85 | 2.85 | 4.53 | 1.48 | 1.98 | 0.47 | 0.34 | 28.59 |
| Departure From Normal | +0.71 | +0.06 | +7.26 | -1.09 | -1.81 | -2.16 | -0.66 | +1.33 | -0.52 | -0.01 | -0.63 | -0.50 | +1.98 |
| Snowfall (in) | 12.6 | 13.4 | 0.0 | 0.2 | 0.0 | 0.0 | 0.0 | 0.0 | 0.0 | 0.0 | 0.2 | 2.2 | |
| Departure From Normal | +5.8 | +6.1 | -3.8 | -1.4 | 0.0 | 0.0 | 0.0 | 0.0 | -0.1 | -1.1 | -2.1 | -2.5 | |
| Hastings (Municipal Airport ASOS) - 2021 Monthly Details | |||||||||||||
| Jan | Feb | Mar | Apr | May | Jun | Jul | Aug | Sep | Oct | Nov | Dec | 2021 | |
| Average High (F) | 39.1 | 23.6 | 57.1 | 63.2 | 70.4 | 87.5 | 86.6 | 87.4 | 82.8 | 67.4 | 56.0 | 47.9 | |
| Average Low (F) | 22.9 | 5.9 | 34.7 | 38.5 | 51.5 | 62.9 | 65.8 | 65.4 | 57.2 | 42.9 | 31.6 | 21.7 | |
| Average Temperature (F) | 31.0 | 14.8 | 45.9 | 50.9 | 60.9 | 75.2 | 76.2 | 76.4 | 70.0 | 55.1 | 43.8 | 34.8 | 52.9 |
| Departure From Normal | +4.6 | -15.2 | +5.0 | -0.1 | -0.9 | +2.5 | -0.8 | +1.9 | +3.6 | +1.9 | +4.1 | +5.6 | +1.0 |
| Precipitation (in) | 1.05 | 0.93 | 8.16 | 1.36 | 4.84 | 0.86 | 2.78 | 4.03 | 1.72 | 1.83 | 0.40 | 0.10 | 28.06 |
| Departure From Normal | +0.50 | +0.18 | +6.83 | -1.34 | +0.49 | -2.81 | -0.84 | +0.61 | -0.34 | -0.13 | -0.73 | -0.76 | +1.66 |
| Snowfall (in) | 10.3 | 15.2 | 0.0 | 0.5 | 0.0 | 0.0 | 0.0 | 0.0 | 0.0 | 0.0 | 1.0 | 0.3 | |
| Departure From Normal | +3.8 | +7.7 | -3.8 | -1.2 | 0.0 | 0.0 | 0.0 | 0.0 | 0.0 | -1.2 | -1.3 | -5.3 | |
Kearney - 2021 Monthly Details:
NOTE: all data here is from the official NWS observer at Kearney airport, with daily observations valid for 24-hour periods ending around 7 AM.
** PLEASE NOTE: This official Kearney data often differs slightly from the unofficial "calendar day" data recorded by the automated airport AWOS (KEAR) **
| Kearney Airport (Coop Observer) - 2021 Monthly Details | |||||||||||||
| Jan | Feb | Mar | Apr | May | Jun | Jul | Aug | Sep | Oct | Nov | Dec | 2021 | |
| Average High (F) | 38.6 | 24.1 | 55.5 | 61.4 | 70.9 | 86.9 | 85.6 | 86.9 | 82.4 | 67.2 | 55.5 | 48.5 | |
| Average Low (F) | 21.2 | 5.3 | 32.3 | 35.2 | 49.8 | 61.9 | 64.4 | 63.2 | 54.4 | 41.2 | 30.0 | 22.0 | |
| Average Temperature (F) | 29.9 | 14.7 | 43.9 | 48.3 | 60.4 | 74.4 | 75.0 | 75.0 | 68.4 | 54.2 | 42.8 | 35.2 | 51.9 |
| Departure From Normal | +5.1 | -13.4 | +5.6 | -0.3 | +0.9 | +4.0 | +0.2 | +2.4 | +3.9 | +2.9 | +4.9 | +7.8 | +2.1 |
| Precipitation (in) | 0.89 | 0.69 | 7.55 | 2.11 | 4.78 | 0.88 | 3.32 | 2.18 | 2.06 | 1.10 | 0.42 | 0.22 | 26.20 |
| Departure From Normal (in) | +0.38 | +0.10 | +6.09 | -0.57 | +0.38 | -3.02 | -0.04 | -0.83 | +0.22 | -1.03 | -0.58 | -0.46 | +0.64 |
| Snowfall (in) | 7.7 | 12.0 | 0.0 | 3.3 | 0.0 | 0.0 | 0.0 | 0.0 | 0.0 | 0.0 | 1.3 | 2.8 | |
| Departure From Normal (in) | +4.0 | +6.4 | -3.5 | +1.4 | -0.1 | 0.0 | 0.0 | 0.0 | 0.0 | -0.8 | -1.5 | -0.6 | |
Ord - 2021 Monthly Details:
NOTE: All snowfall is measured by the NWS Cooperative Observer in Ord. In addition, winter precipitation totals often include Cooperative Observer data given that the automated airport sensor is not designed to accurately melt snowfall (especially in very cold and/or windy regimes).
| Ord (Evelyn Sharp Field ASOS) - 2021 Monthly Details | |||||||||||||
| Jan | Feb | Mar | Apr | May | Jun | Jul | Aug | Sep | Oct | Nov | Dec | 2021 | |
| Average High (F) | 37.7 | 24.7 | 56.3 | 61.8 | 70.0 | 87.5 | 87.0 | 88.6 | 80.8 | 66.3 | 57.0 | 46.4 | |
| Average Low (F) | 19.3 | 3.9 | 28.5 | 31.7 | 46.7 | 58.3 | 62.8 | 61.7 | 51.9 | 37.8 | 25.9 | 18.3 | |
| Average Temperature (F) | 28.5 | 14.3 | 42.4 | 46.8 | 58.4 | 72.9 | 74.9 | 75.2 | 66.4 | 52.1 | 41.5 | 32.3 | 50.5 |
| Departure From Normal | +4.4 | -13.2 | +4.4 | -1.1 | -0.3 | +3.5 | +0.3 | +2.6 | +3.0 | +2.5 | +5.4 | +6.1 | +1.5 |
| Precipitation (in) | 0.71 | 0.64 | 4.55 | 1.42 | 3.13 | 1.01 | 3.14 | 3.39 | 2.53 | 1.20 | 0.25 | 0.19 | 22.16 |
| Departure From Normal (in) | +0.34 | +0.14 | +3.30 | -1.46 | -0.57 | -2.64 | +0.49 | +0.13 | +0.31 | -0.71 | -0.62 | -0.37 | -1.66 |
| Snowfall (in) | 10.7 | 13.5 | Trace | Trace | 0.0 | 0.0 | 0.0 | 0.0 | 0.0 | 0.0 | Trace | 3.0 | |
| Departure From Normal (in) | +3.7 | +6.3 | -5.3 | -3.0 | -0.2 | 0.0 | 0.0 | 0.0 | 0.0 | -1.5 | -4.3 | -3.5 | |
Smith Center, KS - 2021 Monthly Details:
NOTE: All data is from the official NWS observer, with daily observations valid for 24-hour periods ending at 7 AM. As a result, data varies slightly from true "calendar day".
| Smith Center KS (NWS Coop Observer) - 2021 Monthly Details | |||||||||||||
| Jan | Feb | Mar | Apr | May | Jun | Jul | Aug | Sep | Oct | Nov | Dec | 2021 | |
| Average High (F) | 41.9 | 30.6 | 59.0 | 64.5 | 73.2 | 89.0 | 90.8 | 92.7 | 86.4 | 70.5 | 58.6 | 51.8 | |
| Average Low (F) | 21.2 | 9.3 | 33.4 | 37.0 | 50.0 | 61.9 | 64.6 | 65.0 | 56.5 | 43.5 | 30.6 | 21.8 | |
| Average Temperature (F) | 31.5 | 19.9 | 46.2 | 50.8 | 61.6 | 75.5 | 77.7 | 78.8 | 71.4 | 57.0 | 44.6 | 36.8 | 54.3 |
| Departure From Normal | +4.2 | -11.3 | +4.6 | -1.0 | -1.4 | +1.4 | -1.4 | +2.5 | +3.4 | +2.6 | +4.1 | +7.0 | +1.2 |
| Precipitation (in) | 0.92 | 0.34 | 5.71 | 1.96 | 5.77 | 1.89 | 2.93 | 1.70 | 2.00 | 2.33 | 0.06 | 0.06 | 25.67 |
| Departure From Normal (in) | +0.33 | -0.36 | +4.26 | -0.16 | +1.77 | -1.75 | -1.46 | -1.72 | +0.02 | +0.47 | -1.10 | -0.73 | -0.43 |
| Snowfall (in) | 9.3 | 5.1 | 0.0 | 1.7 | Trace | 0.0 | 0.0 | 0.0 | 0.0 | 0.0 | 0.0 | Trace | |
| Departure From Normal (in) | +4.9 | -0.8 | -2.3 | +1.0 | 0.0 | 0.0 | 0.0 | 0.0 | 0.0 | -0.5 | -1.5 | -3.0 | |
2021 SOUTH CENTRAL NEBRASKA
NWS COOPERATIVE OBSERVER PRECIPITATION
(for 24 counties in the NWS Hastings coverage area)
(see bottom tables for winter 2020-2021 and 2021-2022 seasonal snowfall)
The highest reported amount for the month/year indicated in BLUE, the lowest amount in RED.
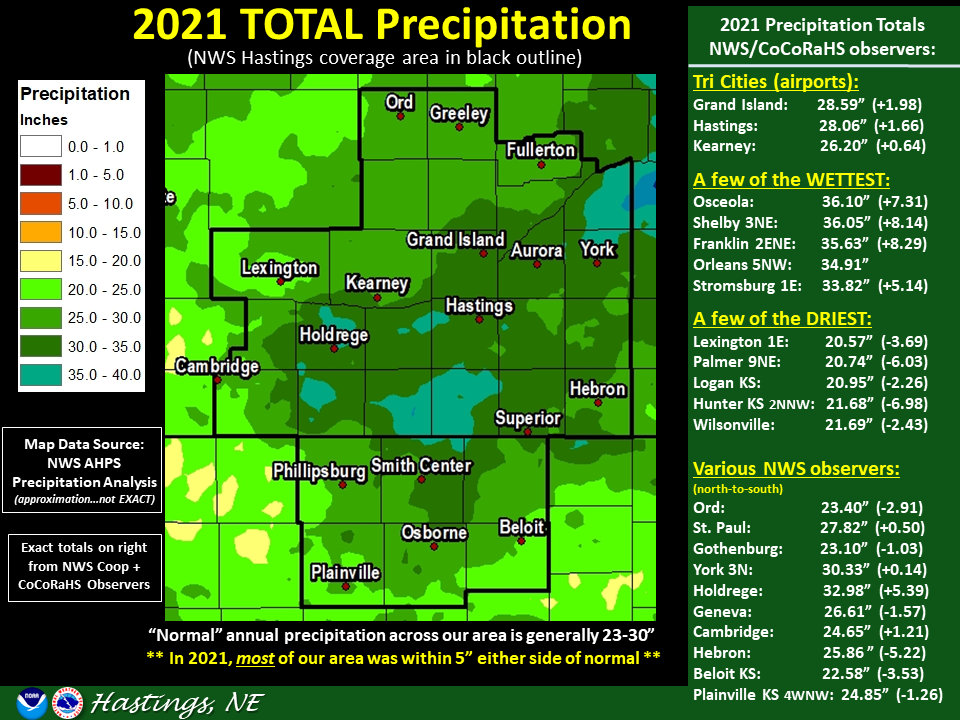
According to official 30-year NCEI "normals" for 1991-2020, normal annual precipitation across the 24-county area generally ranges from 23-30", with the lowest amounts in this range found in far western counties such as Dawson/Gosper/Furnas, and the highest amounts in this range including far eastern counties such as Polk/York/Thayer.
| Station | Jan | Feb | Mar | Apr | May | Jun | July | Aug | Sep | Oct | Nov | Dec | 2021 Total |
| Arcadia 2W | 0.71 | 0.66 | 4.75 | 1.73 | 3.72 | 0.15 | 2.23 | 3.92 | 2.86 | 1.37 | 0.40 | 0.29 | 22.79 |
| Aurora 4N | 1.25 | 0.62 | 7.91 | MSG | MSG | MSG | 2.37 | 5.04 | 0.61 | 2.63 | MSG | MSG | MSG |
| Beaver City | 0.81 | 0.55 | 5.46 | 0.60 | 4.61 | 1.99 | 2.50 | 3.13 | 2.65 | 1.30 | 0.29 | 0.12 | 24.01 |
| Belgrade | 0.91 | 0.65 | 6.06 | 0.87 | 3.19 | 1.80 | 3.01 | 3.91 | 1.14 | 2.71 | 0.35 | 0.31 | 24.91 |
| Blue Hill 4SW | MSG | MSG | MSG | MSG | MSG | MSG | 4.67 | 3.91 | 1.46 | 2.26 | 0.28 | 0.20 | MSG |
| Cambridge | 0.65 | 0.82 | 4.97 | 0.72 | 7.34 | 2.52 | 2.19 | 1.50 | 2.67 | 0.83 | 0.28 | 0.16 | 24.65 |
| Lexington 6SSE (Canaday) | 0.64 | 0.69 | 4.76 | 1.16 | 3.66 | 0.56 | 2.73 | 2.54 | 4.62 | 0.65 | 0.47 | 0.17 | 22.65 |
| Clay Center 6 ESE | 1.17 | 0.84 | 5.81 | 1.91 | 4.13 | 2.52 | 1.93 | 1.48 | 1.31 | 3.16 | 0.39 | 0.15 | 24.80 |
| Clay Center | 1.32 | 0.61 | 6.40 | 1.62 | 5.71 | 2.33 | 2.26 | 2.11 | 1.86 | 2.72 | 0.41 | 0.29 | 27.64 |
| Edison | 0.52 | 0.55 | 5.53 | 0.73 | 5.83 | 1.62 | 5.55 | 1.28 | 2.70 | 1.14 | 0.24 | 0.11 | 25.80 |
| Elwood 8S | 0.56 | 0.65 | 4.75 | 0.84 | 6.69 | 0.89 | 4.96 | 2.35 | 2.99 | 0.66 | 0.25 | 0.14 | 25.73 |
| Franklin | 0.98 | 1.03 | 7.01 | 2.29 | 6.71 | 1.83 | 3.69 | 5.61 | 2.50 | 2.53 | 0.32 | 0.12 | 34.62 |
| Geneva | 1.14 | 0.46 | 6.61 | 1.53 | 3.03 | 3.02 | 2.24 | 1.97 | 2.08 | 3.54 | 0.68 | 0.31 | 26.61 |
| Genoa 2W | 1.27 | 0.59 | 6.61 | 1.55 | 2.87 | 2.83 | 3.11 | 4.72 | 1.08 | 2.53 | 0.31 | 0.68 | 28.15 |
| Gothenburg | 0.41 | 0.91 | 4.14 | 1.47 | 4.98 | 0.45 | 2.52 | 2.96 | 3.91 | 0.62 | 0.51 | 0.22 | 23.10 |
| Grand Island Airport | 1.32 | 0.80 | 8.65 | 1.43 | 2.89 | 1.85 | 2.85 | 4.53 | 1.48 | 1.98 | 0.47 | 0.34 | 28.59 |
| Greeley | 0.58 | 0.43 | 7.10 | 1.55 | 3.28 | 0.87 | 3.64 | 4.75 | 2.31 | 1.57 | 0.19 | 0.46 | 26.73 |
| Gresham 3W | 1.65 | 0.67 | 7.58 | 1.34 | 5.24 | 2.84 | 1.99 | 4.02 | 1.65 | 2.73 | 0.59 | 0.26 | 30.56 |
| Harlan County Lake | 0.82 | 0.90 | 6.65 | 1.38 | 5.19 | 1.80 | 4.33 | 4.35 | 2.56 | 1.39 | 0.27 | 0.06 | 29.70 |
| Hastings Airport | 1.05 | 0.93 | 8.16 | 1.36 | 4.84 | 0.86 | 2.78 | 4.03 | 1.72 | 1.83 | 0.40 | 0.10 | 28.06 |
| Hastings NWS Office | 1.05 | 0.93 | 8.51 | 1.39 | 4.65 | 0.78 | 3.12 | 4.12 | 1.71 | 1.86 | 0.37 | 0.14 | 28.63 |
| Hebron | 1.38 | 0.80 | 5.79 | 1.90 | 3.21 | 0.53 | 1.79 | 4.14 | 1.84 | 3.80 | 0.49 | 0.19 | 25.86 |
| Holdrege | 0.94 | 0.86 | 6.90 | 1.24 | 5.82 | 3.15 | 3.28 | 5.57 | 3.34 | 1.40 | 0.15 | 0.33 | 32.98 |
| Hubbell | 1.01 | 0.56 | 5.39 | 2.21 | 3.70 | 0.93 | 3.85 | 6.38 | 0.93 | 3.78 | 0.32 | 0.13 | 29.19 |
| Kearney Airport | 0.89 | 0.69 | 7.55 | 2.11 | 4.78 | 0.88 | 3.32 | 2.18 | 2.06 | 1.10 | 0.42 | 0.22 | 26.20 |
| Loup City | 0.79 | 0.73 | 5.56 | 1.82 | 3.42 | 0.66 | 3.05 | 2.55 | 3.14 | 1.40 | 0.47 | 0.23 | 23.82 |
| Miller | 0.52 | 0.80 | 6.20 | 1.64 | 4.24 | 0.70 | 2.77 | 5.25 | 2.19 | 1.69 | 0.45 | 0.12 | 26.57 |
| Minden | 0.62 | 0.65 | 7.97 | 1.22 | 7.67 | 1.29 | 3.23 | 3.72 | 1.36 | 1.84 | 0.24 | 0.14 | 29.95 |
| Naponee | 0.79 | 0.71 | 7.05 | 1.47 | 4.95 | 1.89 | 3.26 | 4.35 | 3.16 | 1.38 | 0.34 | 0.07 | 29.42 |
| Nelson | 0.99 | 0.74 | 6.25 | 1.65 | 6.35 | 1.84 | 3.76 | 2.56 | 1.70 | 2.94 | 0.26 | 0.22 | 29.26 |
| North Loup | 0.64 | 0.55 | 5.64 | 1.72 | 3.27 | MSG | MSG | MSG | MSG | MSG | MSG | 0.25 | MSG |
| Orleans 1W | 0.77 | 0.71 | 5.59 | 0.88 | 5.88 | 2.34 | 2.75 | 7.82 | 3.38 | 1.08 | 0.29 | 0.16 | 31.65 |
| Ord (airport) | 0.71 | 0.64 | 4.55 | 1.42 | 3.13 | 1.01 | 3.14 | 3.39 | 2.53 | 1.20 | 0.25 | 0.19 | 22.16 |
| Ord (in town) | 0.74 | 0.67 | 5.43 | 1.51 | 2.91 | 1.25 | 3.28 | 3.29 | 2.60 | 1.24 | 0.32 | 0.16 | 23.40 |
| Osceola | 1.32 | 0.67 | 8.93 | 1.96 | 3.46 | 3.70 | 3.14 | 7.75 | 1.85 | 2.91 | 0.31 | 0.10 | 36.10 |
| Oxford 6NNW | 0.54 | 0.51 | 5.87 | 0.83 | 6.74 | 1.64 | 6.72 | 3.19 | 4.09 | 0.82 | 0.21 | 0.06 | 31.22 |
| Polk | 1.13 | 0.70 | 8.25 | 1.48 | 3.96 | 3.69 | 1.18 | 6.42 | 1.77 | 2.57 | 0.39 | 0.03 | 31.57 |
| Ravenna | 0.84 | 0.76 | 6.18 | 1.84 | 4.16 | 0.95 | 1.75 | 2.71 | 1.39 | 1.48 | 0.46 | 0.24 | 22.76 |
| Red Cloud | 1.00 | 0.62 | 6.50 | 2.32 | 5.92 | 2.54 | 4.00 | 4.90 | 1.43 | 2.29 | 0.32 | 0.12 | 31.96 |
| St. Paul | 0.95 | 0.70 | 8.07 | 1.23 | 3.72 | 0.53 | 2.34 | 5.15 | 1.77 | 2.37 | 0.47 | 0.52 | 27.82 |
| Shelby 3NE | 1.21 | 0.66 | 8.50 | 1.80 | 4.28 | 3.75 | 2.09 | 8.23 | 1.82 | 3.30 | 0.14 | 0.27 | 36.05 |
| Shickley 4S | 1.24 | 0.68 | 6.34 | 1.76 | 4.67 | 2.33 | 1.95 | 2.60 | 1.35 | 2.90 | 0.28 | 0.44 | 26.54 |
| Superior | 0.91 | 0.47 | 5.59 | 1.41 | 4.72 | 1.18 | 4.22 | 5.01 | 1.50 | 2.76 | 0.37 | 0.08 | 28.22 |
| Wilsonville | 0.81 | 0.80 | 5.35 | 0.66 | 4.69 | 2.09 | 1.84 | 2.04 | 1.81 | 1.12 | 0.28 | 0.20 | 21.69 |
| York 3N | 1.79 | 0.69 | 9.02 | 1.62 | 5.41 | 1.60 | 2.61 | 3.49 | 0.78 | 2.54 | 0.38 | 0.40 | 30.33 |
WINTER 2020-2021 SOUTH CENTRAL NEBRASKA
COOPERATIVE OBSERVER SNOWFALL
The highest reported amount for the month/season indicated in BLUE, the lowest amount in RED.
T* indicates hail was reported during the month.
| Station | Sep | Oct | Nov | Dec | Jan | Feb | Mar | Apr | May | Season |
| Arcadia 2W | 0.0 | 4.6 | 2.1 | 10.4 | 11.0 | 14.2 | 0.7 | T | 0.0 | 43.0 |
| Beaver City | 0.0 | 2.0 | 0.4 | 7.1 | 9.0 | 9.5 | 0.0 | 1.0 | 0.0 | 29.0 |
| Belgrade | T* | 4.2 | 2.5 | 8.4 | 8.0 | 9.3 | 0.0 | T | 0.0 | 32.4 |
| Blue Hill 4SW | 0.0 | MSG | 0.4 | 8.3 | MSG | MSG | MSG | MSG | MSG | MSG |
| Cambridge | 0.0 | 3.0 | 0.5 | 10.9 | 8.0 | 10.0 | T | 3.0 | T* | 35.4 |
| Lexington 6SSE (Canaday) | 0.0 | 1.0 | 1.0 | 11.5 | 7.0 | 12.7 | 0.0 | 0.1 | 0.0 | 33.3 |
| Clay Center 6ESE | 0.0 | 1.8 | T | 7.2 | 13.0 | 13.5 | 0.0 | 0.3 | T* | 35.8 |
| Clay Center | 0.0 | 2.0 | T | 8.3 | 11.0 | 13.8 | 0.0 | 0.3 | 0.0 | 35.4 |
| Edison | 0.0 | 1.8 | 0.5 | 6.9 | 6.0 | 10.0 | T | 2.0 | 0.0 | 27.2 |
| Elwood 8S | 0.0 | 2.0 | 0.5 | 9.1 | 8.4 | 8.4 | T | 3.5 | 0.0 | 31.9 |
| Franklin | 0.0 | 1.5 | T | 3.5 | 8.5 | 13.5 | 0.0 | 3.0 | 0.0 | 30.0 |
| Geneva | 0.0 | 1.0 | 0.0 | 7.5 | 11.2 | 13.7 | 0.0 | 0.5 | 0.0 | 33.9 |
| Genoa 2W | 0.0 | 5.3 | 4.0 | 10.5 | 11.0 | 12.5 | 0.0 | T | 0.0 | 43.3 |
| Grand Island Airport | 0.0 | 0.7 | 0.8 | 12.0 | 12.6 | 13.4 | 0.0 | 0.2 | 0.0 | 39.7 |
| Greeley | 0.0 | 6.4 | 4.6 | 9.4 | 8.6 | 9.5 | 0.0 | T | 0.0 | 38.5 |
| Gresham 3W | 0.0 | 1.0 | T | 8.5 | 15.5 | 10.8 | 0.0 | T | 0.0 | 35.8 |
| Harlan County Lake | 0.0 | 3.0 | MSG | 3.9 | 10.0 | 15.0 | 0.0 | 3.0 | 0.0 | MSG |
| Hastings NWS | T* | 2.8 | 0.2 | 11.1 | 10.3 | 15.2 | 0.0 | 0.5 | 0.0 | 40.1 |
| Hebron | 0.0 | 0.3 | 0.0 | 5.6 | 13.4 | 18.7 | 0.0 | 2.0 | 0.0 | 40.0 |
| Holdrege | 0.0 | 2.0 | 1.0 | 12.8 | 10.0 | 8.5 | 0.0 | 3.0 | 0.0 | 37.3 |
| Hubbell | 0.0 | 0.2 | T | 4.5 | 12.5 | 12.5 | 0.0 | 2.0 | 0.0 | 31.7 |
| Kearney Airport | 0.0 | 2.0 | 0.8 | 11.0 | 7.7 | 12.0 | 0.0 | 3.3 | 0.0 | 36.8 |
| Loup City | 0.0 | 3.5 | 1.0 | 12.3 | 10.2 | 13.8 | 0.0 | T | 0.0 | 40.8 |
| Miller | 0.0 | 1.0 | 1.1 | 12.1 | 9.2 | 13.7 | 0.5 | 4.6 | 0.0 | 42.2 |
| Minden | 0.0 | 3.5 | 0.5 | 9.9 | 9.8 | 13.0 | 0.0 | 4.0 | T* | 40.7 |
| Naponee | 0.0 | 1.5 | 0.5 | 4.5 | 10.1 | 9.0 | 0.0 | 3.0 | 0.0 | 28.6 |
| Nelson | 0.0 | 0.4 | T | 5.5 | 11.6 | 14.6 | T | 2.4 | T* | 34.5 |
| North Loup | 0.0 | 6.1 | 2.5 | 9.0 | 9.2 | 11.5 | 0.0 | T | 0.0 | 38.3 |
| Orleans 1W | 0.0 | 2.8 | 0.4 | 6.3 | 10.1 | 9.9 | 0.0 | 2.4 | T* | 31.9 |
| Ord | 0.0 | 9.5 | 2.7 | 12.5 | 10.7 | 13.5 | T | T | 0.0 | 48.9 |
| Osceola | 0.0 | 1.2 | 1.4 | 13.5 | 11.4 | 10.1 | 0.0 | 0.2 | T* | 37.8 |
| Oxford 6NNW | 0.0 | 3.1 | 0.8 | 8.7 | 7.9 | 9.6 | 0.0 | 2.7 | 0.0 | 32.8 |
| Polk | 0.0 | 0.5 | 0.5 | 13.0 | 11.0 | 9.0 | 0.0 | T | 0.0 | 34.0 |
| Ravenna | 0.0 | 1.4 | 0.5 | 11.3 | 9.0 | 12.9 | 0.0 | T | 0.0 | 35.1 |
| Red Cloud | 0.0 | 0.5 | 0.0 | 3.0 | 10.1 | 14.0 | 0.0 | 2.0 | 0.0 | 29.6 |
| St. Paul | 0.0 | 0.9 | 2.3 | 13.0 | 9.9 | 13.7 | T | T | T* | 39.8 |
| Shelby 3NE | 0.0 | 1.4 | 1.1 | 16.1 | 11.0 | 15.2 | T | T | T* | 44.8 |
| Shickley 4S | 0.0 | T | T | 7.0 | 10.0 | 12.0 | 0.0 | T | T* | 29.0 |
| Superior | 0.0 | 0.5 | 0.0 | 4.5 | 10.8 | 11.7 | 0.0 | 3.3 | 0.0 | 30.8 |
| Wilsonville | 0.0 | 6.0 | 1.0 | 8.8 | 7.7 | 11.0 | 0.0 | 3.0 | 0.0 | 37.5 |
| York 3N | 0.0 | 1.2 | 0.4 | 10.5 | 13.9 | 12.5 | 0.0 | 0.1 | T* | 38.6 |
WINTER 2021-2022 SOUTH CENTRAL NEBRASKA
COOPERATIVE OBSERVER SNOWFALL
The highest reported amount for the month/season indicated in BLUE, the lowest amount in RED.
T* indicates snowfall was actually hail
| Station | Sep | Oct | Nov | Dec | Jan | Feb | Mar | Apr | May | Season |
| Arcadia 2W | 0.0 | 0.0 | 0.2 | 3.1 | 2.7 | |||||
| Beaver City | 0.0 | 0.0 | 0.0 | 0.5 | ||||||
| Belgrade | 0.0 | 0.0 | 0.0 | 2.5 | 1.0 | |||||
| Blue Hill 4SW | 0.0 | 0.0 | 0.6 | 0.4 | 2.6 | |||||
| Cambridge | 0.0 | 0.0 | 2.1 | 1.3 | 6.4 | |||||
| Lexington 6SSE (Canaday) | 0.0 | 0.0 | 1.5 | 1.5 | 2.5 | |||||
| Clay Center 6ESE | 0.0 | 0.0 | 0.3 | 0.3 | 2.5 | |||||
| Clay Center | 0.0 | 0.0 | 0.3 | 1.0 | 5.0 | |||||
| Edison | 0.0 | 0.0 | 0.5 | 2.0 | 6.0 | |||||
| Elwood 8S | 0.0 | 0.0 | 3.0 | 2.0 | ||||||
| Franklin | 0.0 | 0.0 | T | 0.5 | ||||||
| Geneva | 0.0 | 0.0 | T | 1.0 | 4.5 | |||||
| Genoa 2W | 0.0 | 0.0 | 0.0 | 2.0 | ||||||
| Grand Island Airport | 0.0 | 0.0 | 0.2 | 2.2 | 2.7 | |||||
| Greeley | 0.0 | 0.0 | T | 2.4 | 1.9 | |||||
| Gresham 3W | 0.0 | 0.0 | 0.0 | 1.0 | ||||||
| Harlan County Lake | 0.0 | 0.0 | 0.0 | 0.5 | ||||||
| Hastings NWS | 0.0 | 0.0 | 1.0 | 0.3 | 4.0 | |||||
| Hebron | 0.0 | 0.0 | 0.0 | 0.2 | 4.0 | |||||
| Holdrege | 0.0 | T* | T | 3.0 | 3.0 | |||||
| Hubbell | 0.0 | 0.0 | 0.0 | 0.1 | ||||||
| Kearney Airport | 0.0 | 0.0 | 1.3 | 2.8 | 1.5 | |||||
| Loup City | 0.0 | 0.0 | 0.5 | 3.0 | 0.5 | |||||
| Miller | 0.0 | T* | 1.5 | 2.6 | 2.0 | |||||
| Minden | 0.0 | 0.0 | 0.4 | 1.0 | 3.3 | |||||
| Naponee | 0.0 | 0.0 | 0.0 | 1.0 | ||||||
| Nelson | 0.0 | 0.0 | 0.0 | 0.4 | 3.7 | |||||
| North Loup | MSG | MSG | MSG | 2.2 | 1.0 | MSG | ||||
| Orleans 1W | 0.0 | 0.0 | 0.5 | 1.1 | 6.9 | |||||
| Ord | 0.0 | 0.0 | T | 3.0 | 2.8 | |||||
| Osceola | 0.0 | 0.0 | 0.0 | 1.0 | 2.1 | |||||
| Oxford 6NNW | 0.0 | 0.0 | 0.8 | 2.2 | 4.9 | |||||
| Polk | 0.0 | 0.0 | 0.0 | 0.5 | ||||||
| Ravenna | 0.0 | 0.0 | 1.0 | 2.5 | 1.5 | |||||
| Red Cloud | 0.0 | 0.0 | 0.0 | 0.0 | ||||||
| St. Paul | 0.0 | 0.0 | T | 2.5 | 1.5 | |||||
| Shelby 3NE | 0.0 | 0.0 | T | 0.4 | 2.3 | |||||
| Shickley 4S | 0.0 | T* | T | T | ||||||
| Superior | 0.0 | 0.0 | 0.1 | 0.2 | 4.2 | |||||
| Wilsonville | 0.0 | 0.0 | 0.1 | 2.0 | 4.5 | |||||
| York 3N | 0.0 | T* | T | 1.0 | 0.9 |
MSG...Missing due to no data available for month, or data appears unrepresentative
(*Please Note: All data presented here are preliminary and subject to revision. Final and certified climate data is available through National Centers for Environmental Information (NCEI).
2021 NORTH CENTRAL KANSAS
NWS COOPERATIVE OBSERVER PRECIPITATION
(for 6 counties in the NWS Hastings coverage area)
(see bottom tables for winter 2020-2021 and 2021-2022 seasonal snowfall)
The highest reported amount under each month indicated in BLUE, the lowest amount in RED.
According to official 30-year NCEI "normals" for 1991-2020, normal annual precipitation across the six-county area generally ranges from 24-28", with the lowest amounts in this range favoring the western-most counties of Phillips/Rooks and the highest amounts in this range within the eastern-most counties of Jewell/Mitchell.
| Station | Jan | Feb | Mar | Apr | May | Jun | July | Aug | Sep | Oct | Nov | Dec | 2021 Total |
| Beloit | 0.94 | 0.23 | 4.20 | 1.78 | 3.93 | 1.34 | 2.15 | 3.58 | 1.55 | 2.82 | 0.02 | 0.04 | 22.58 |
| Burr Oak 1N | MSG | MSG | MSG | MSG | MSG | MSG | MSG | MSG | MSG | MSG | MSG | MSG | MSG |
| Cawker City | 1.29 | 0.10 | 4.93 | 1.77 | 4.05 | 2.36 | 3.19 | 3.41 | 1.80 | 2.13 | 0.09 | 0.01 | 25.13 |
| Covert Rural | 0.88 | 0.08 | 4.94 | 2.98 | 6.87 | 1.43 | 0.92 | 3.66 | 2.91 | 1.62 | 0.08 | 0.06 | 26.43 |
| Glen Elder Lake | 0.92 | 0.23 | 3.66 | 1.79 | 4.11 | 1.62 | 3.32 | 4.41 | 2.71 | 2.72 | 0.09 | 0.08 | 25.66 |
| Ionia | 1.25 | 0.22 | 5.11 | 1.71 | 6.92 | 0.75 | 3.16 | 2.61 | 1.87 | 2.39 | 0.08 | 0.04 | 26.11 |
| Jewell | 1.19 | 0.36 | 5.31 | 1.57 | 5.56 | 0.76 | 2.74 | 3.76 | 1.48 | MSG | MSG | MSG | MSG |
| Kirwin Dam | 1.03 | 0.28 | 5.54 | 2.74 | 4.10 | 2.50 | 1.79 | 1.34 | 3.80 | 1.78 | 0.04 | 0.06 | 25.00 |
| Lebanon | 0.79 | 0.45 | 5.37 | 1.85 | 5.53 | 1.08 | 1.42 | 5.42 | 2.25 | 2.44 | 0.04 | 0.06 | 26.70 |
| Logan | 0.69 | 0.25 | 5.28 | 1.32 | 4.49 | 1.01 | 1.35 | 1.85 | 3.25 | 1.33 | 0.03 | 0.10 | 20.95 |
| Lovewell Dam | 1.43 | 0.67 | 5.70 | 1.46 | 4.11 | 1.25 | 2.55 | 4.45 | 2.05 | 2.70 | 0.26 | 0.09 | 26.72 |
| Natoma | 0.68 | 0.09 | 5.48 | 2.66 | 8.31 | 1.05 | 0.45 | 1.05 | 2.26 | 1.36 | 0.10 | 0.02 | 23.51 |
| Phillipsburg | 0.90 | 0.41 | 7.06 | 1.39 | 4.73 | 2.35 | 2.20 | 1.33 | 3.47 | 1.93 | 0.01 | 0.08 | 25.86 |
| Plainville 4WNW | 0.87 | 0.06 | 5.74 | 1.73 | 7.66 | 1.31 | 2.24 | 0.61 | 3.44 | 1.07 | 0.12 | T | 24.85 |
| Smith Center | 0.92 | 0.34 | 5.71 | 1.96 | 5.77 | 1.89 | 2.93 | 1.70 | 2.00 | 2.33 | 0.06 | 0.06 | 25.67 |
| Webster Dam | 0.67 | 0.13 | 5.14 | 1.64 | 3.93 | 3.98 | 2.30 | 1.07 | 3.52 | 1.70 | 0.10 | 0.14 | 24.32 |
WINTER 2020-2021 NORTH CENTRAL KANSAS
COOPERATIVE OBSERVER SNOWFALL
The highest reported amount for the month/season indicated in BLUE, the lowest amount in RED.
T* indicated hail was reported during the month.
| Station | Sep | Oct | Nov | Dec | Jan | Feb | Mar | Apr | May | Season |
| Beloit | 0.0 | 1.0 | 0.0 | 0.6 | 11.0 | 4.0 | 0.0 | 4.0 | 0.0 | 20.6 |
| Burr Oak 1N | 0.0 | MSG | MSG | MSG | MSG | MSG | MSG | MSG | MSG | MSG |
| Cawker City | 0.0 | 2.0 | 0.0 | T | 9.5 | 3.0 | 0.0 | 4.0 | 0.0 | 18.5 |
| Covert Rural | 0.0 | 4.0 | 0.0 | 1.5 | 8.0 | 2.5 | 0.0 | 7.0 | 0.0 | 23.0 |
| Ionia | 0.0 | 1.5 | T | 0.9 | 11.3 | 4.7 | 0.0 | 3.0 | 0.0 | 21.4 |
| Jewell | 0.0 | 1.5 | 2.0 | 3.0 | 8.5 | 5.0 | 0.0 | 1.5 | T* | 21.5 |
| Kirwin Dam | 0.0 | 0.8 | T | 2.0 | 9.3 | 4.0 | 0.0 | 2.0 | 0.0 | 18.1 |
| Lebanon | 0.0 | T | T | 1.0 | 10.3 | 10.4 | 0.0 | 2.6 | 0.0 | 24.3 |
| Logan | 0.0 | 1.0 | T | 1.5 | 8.0 | 5.0 | 0.0 | 2.0 | 0.0 | 17.5 |
| Lovewell Dam | 0.0 | MSG | T | MSG | 16.3 | 7.3 | 0.0 | MSG | 0.0 | MSG |
| Natoma | 0.0 | 2.0 | 0.0 | 1.5 | 7.0 | 2.5 | 0.0 | 7.0 | 0.0 | 20.0 |
| Phillipsburg | 0.0 | 1.0 | T | 2.1 | 9.8 | 8.3 | 0.0 | 0.5 | T* | 21.7 |
| Plainville 4WNW | 0.0 | 1.9 | 0.0 | 2.4 | 9.2 | 1.2 | 0.0 | 6.4 | 0.0 | 21.1 |
| Smith Center | 0.0 | 0.6 | T | 1.8 | 9.3 | 5.1 | 0.0 | 1.7 | T* | 18.5 |
| Webster Dam | 0.0 | 1.0 | 0.0 | MSG | 7.0 | 2.0 | 0.0 | 3.0 | 0.0 | 13.0 |
WINTER 2021-2022 NORTH CENTRAL KANSAS
COOPERATIVE OBSERVER SNOWFALL
The highest reported amount for the month/season indicated in BLUE, the lowest amount in RED.
T* indicated hail was reported during the month.
| Station | Sep | Oct | Nov | Dec | Jan | Feb | Mar | Apr | May | Season |
| Beloit | 0.0 | 0.0 | 0.0 | 0.0 | 6.3 | |||||
| Burr Oak 1N | MSG | MSG | MSG | MSG | MSG | MSG | ||||
| Cawker City | 0.0 | 0.0 | 0.0 | 0.0 | 7.5 | |||||
| Covert Rural | 0.0 | 0.0 | 0.0 | 0.0 | ||||||
| Ionia | 0.0 | 0.0 | 0.0 | 0.0 | 4.0 | |||||
| Jewell | 0.0 | MSG | MSG | MSG | MSG | MSG | ||||
| Kirwin Dam | 0.0 | 0.0 | 0.0 | 0.0 | ||||||
| Lebanon | 0.0 | T* | T | T | 6.5 | |||||
| Logan | 0.0 | T* | 0.0 | 0.5 | ||||||
| Lovewell Dam | 0.0 | 0.0 | 0.0 | 0.0 | ||||||
| Natoma | 0.0 | 0.0 | 0.0 | 0.0 | 6.5 | |||||
| Phillipsburg | 0.0 | 0.0 | 0.0 | 0.0 | ||||||
| Plainville 4WNW | 0.0 | 0.0 | 0.0 | T | 8.4 | |||||
| Smith Center | 0.0 | 0.0 | 0.0 | T | 8.0 | |||||
| Webster Dam | 0.0 | 0.0 | 0.0 | 0.0 |
MSG...Missing due to no data available for month, or data appears unrepresentative
(*Please Note: All data presented here are preliminary and subject to revision. Final and certified climate data is available through National Centers for Environmental Information (NCEI).
NWS Hastings 30-County Coverage Area (data mainly from NWS Cooperative Observers & CocCoRaHs/NeRAIN observers) |
(*Please Note: All data presented here are preliminary and subject to revision. Final and certified climate data is available through National Centers for Environmental Information (NCEI).
Nebraska Tri-Cities Extremes and Totals (Grand Island, Hastings, and Kearney airports):
(note: Grand Island/Hastings data are from NWS-maintained automated airport sensors (ASOS), except for snowfall which is manually measured. At Kearney, all official data is from the NWS Coop Observer located at the airport, as the automated airport sensor (AWOS) is unofficial.)
Extremes Across our ENTIRE 30-County Area:
Hottest Temperatures (actual day it occurred...not necessarily the date of the official ob)
Coldest Temperatures (actual day it occurred...not necessarily the date of the official ob)
Highest 2021 TOTAL Precipitation ("normal" annual precip across our area generally ranges 23-30"...lowest west/highest east)
Lowest 2021 TOTAL Precipitation (only includes stations with no more than 5 days of missing data)
Wettest Calendar Month (it was EXTREMELY UNUSUAL that this entire Top-10 list occurred in MARCH!)
Highest 24-HOUR Rain Totals (for a roughly 7am-7am period ending on the specified date)
Snowiest Calendar Month
Highest 48-Hour (or less) Snowfall
Please visit the following sites for a wealth of additional local climate information:
- NOWData....official temp/precip/snow data for any NWS observation site in our coverage area
- Daily/Monthly/Annual Precipitation Maps (maintained by NWS Hastings)
- 24 to 72 hour Observed Snowfall Maps (maintained by NWS Hastings)
- NWS Hastings Local Climate Page (various additional weather/climate info)
- High Plains Regional Climate Center (HPRCC)...information for the entire High Plains region (not just our coverage area)
 |
Media use of NWS Web News Stories is encouraged! Please acknowledge the NWS as the source of any news information accessed from this site. |
|