
Widespread, life-threatening considerable flash flooding is expected in south-central Texas through at least Friday. Catastrophic river flooding and rapid rises on small streams, arroyos, and typically dry washes are expected in the Texas Hill Country. Wildfire smoke is impacting air quality across much of the Great Lakes region into the Northeast U.S. with Air Quality Alerts in effect. Read More >
Overview/Narrative:
(BE SURE TO CLICK THE VARIOUS TABS BELOW FOR A VARIETY OF SEPTEMBER 2017 CLIMATE INFORMATION!)
|
Recap of September 2017 Weather for the 30-county NWS Hastings Coverage Area:
|
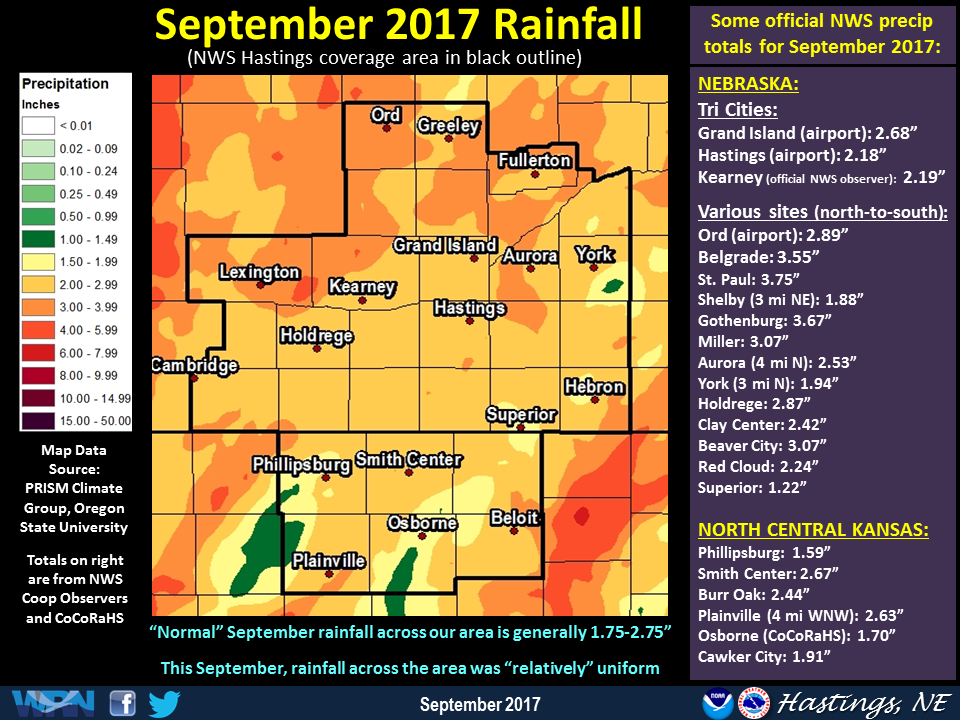 This graphic features a precipitation map for September 2017, along with a partial listing of official NWS/CoCoRaHS totals (Click image to enlarge) |
Grand Island & Hastings Details (Including 12-Month History):
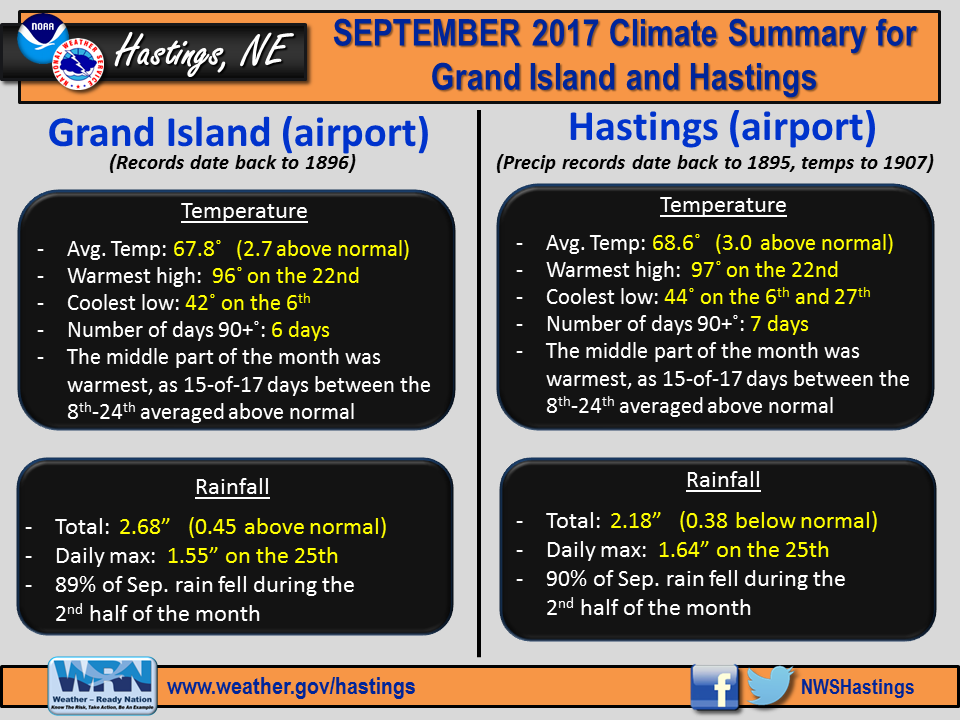 |
| Detailed Sep. 2017 info for Grand Island/Hastings (Click to enlarge) |
 |
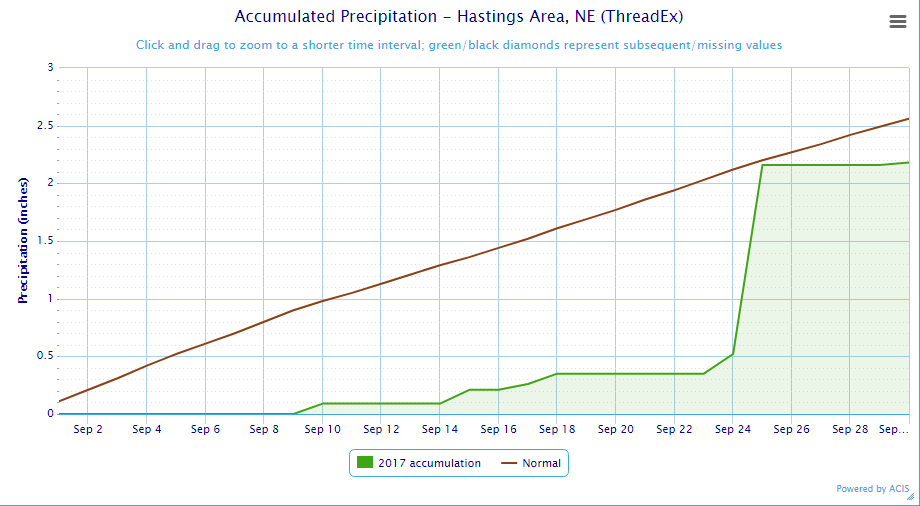 |
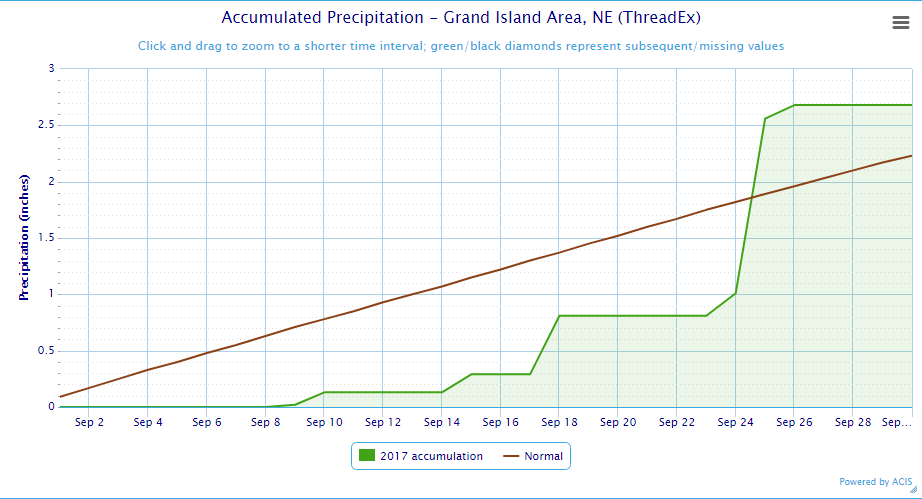
| Grand Island Precipitation Summary: The green line indicates cumulative observed precipitation for September 2017.The brown line indicates "normal" September precipitation based on 30-year data from 1981-2010. (click to enlarge) | Hastings Precipitation Summary: The green line indicates cumulative observed precipitation for September 2017. The brown line indicates "normal" September precipitation based on 30-year data from 1981-2010. (click to enlarge) |
| Grand Island (Regional Airport ASOS) - Oct. 2016 - Sep. 2017 | ||||||||||||
| Oct. | Nov. | Dec. | Jan. | Feb. | Mar. | Apr. | May | June | July | Aug. | Sep. | |
| Average High (F) | 70.7 | 57.3 | 37.3 | 34.6 | 50.8 | 54.4 | 63.1 | 72.7 | 87.5 | 88.9 | 81.3 | 80.5 |
| Average Low (F) | 42.6 | 32.7 | 14.5 | 17.9 | 24.8 | 30.0 | 39.2 | 49.6 | 61.2 | 66.6 | 58.9 | 55.0 |
| Average Temperature (F) | 56.7 | 45.0 | 25.9 | 26.3 | 37.8 | 42.2 | 51.1 | 60.3 | 74.4 | 77.8 | 70.1 | 67.8 |
| Departure From Normal | +4.5 | +6.9 | -0.8 | +1.2 | +8.7 | +2.8 | +0.5 | -0.9 | +3.1 | +1.6 | -3.9 | +2.7 |
| Precipitation (in) | 0.12 | 1.37 | 0.81 | 1.07 | 0.25 | 0.81 | 2.64 | 5.28 | 2.10 | 3.05 | 6.19 | 2.68 |
| Departure From Normal | -1.74 | +0.20 | +0.18 | +0.54 | -0.43 | -0.99 | +0.11 | +0.87 | -2.20 | -0.35 | +3.07 | +0.45 |
| Snowfall (in) | 0.0 | 0.4 | 1.4 | 2.4 | 3.5 | 1.2 | T | 0.3 | 0.0 | 0.0 | 0.0 | 0.0 |
| Departure From Normal | -1.0 | -2.7 | -3.7 | -4.1 | -2.8 | -4.2 | -1.5 | +0.3 | 0.0 | 0.0 | 0.0 | -0.1 |
| Hastings (Municipal Airport ASOS) - Oct. 2016 - Sep. 2017 | ||||||||||||
| Oct. | Nov. | Dec. | Jan. | Feb. | Mar. | Apr. | May | June | July | Aug. | Sep. | |
| Average High (F) | 71.3 | 57.4 | 37.7 | 35.7 | 51.4 | 55.4 | 63.4 | 72.8 | 86.3 | 88.9 | 81.7 | 81.2 |
| Average Low (F) | 44.0 | 34.2 | 15.6 | 19.4 | 25.8 | 31.3 | 40.7 | 49.5 | 62.1 | 67.6 | 59.8 | 55.9 |
| Average Temperature (F) | 57.6 | 45.8 | 26.6 | 27.6 | 38.6 | 43.4 | 52.1 | 61.1 | 74.2 | 78.2 | 70.7 | 68.6 |
| Departure From Normal (F) | +5.0 | +7.1 | -1.0 | +1.6 | +8.7 | +3.5 | +1.4 | -0.2 | +2.4 | +1.1 | -3.6 | +3.0 |
| Precipitation (in) | 0.22 | 1.46 | 0.61 | 0.83 | 0.27 | 1.08 | 3.24 | 6.42 | 1.79 | 4.71 | 5.10 | 2.18 |
| Departure From Normal (in) | -1.77 | +0.17 | 0.00 | +0.42 | -0.22 | -0.71 | +0.68 | +1.85 | -2.01 | +0.97 | +1.80 | -0.38 |
| Snowfall (in) | 0.0 | 0.1 | 1.0 | 3.7 | 4.3 | 1.2 | 0.2 | 0.6 | 0.0 | 0.0 | 0.0 | 0.0 |
| Departure From Normal (in) | -1.0 | -2.5 | -5.1 | -2.3 | -2.2 | -4.0 | -1.0 | +0.6 | 0.0 | 0.0 | 0.0 | -0.2 |
Kearney - 12 Month Climate History:
All data here is from the official NWS observer at Kearney airport, with 24-hour observations taken around 7 a.m. ** PLEASE NOTE: This official Kearney data often differs at least slightly from the unofficial data recorded by the automated airport system (KEAR) **
| Kearney Airport (Coop Observer) - Oct. 2016 - Sep. 2017 | ||||||||||||
| Oct. | Nov. | Dec. | Jan. | Feb. | Mar. | Apr. | May | June | July | Aug. | Sep. | |
| Average High (F) | 70.8 | 58.6 | 37.8 | 36.9 | 50.0 | 54.6 | 62.5 | 70.2 | 86.6 | 88.1 | 81.2 | 80.7 |
| Average Low (F) | 40.8 | 33.4 | 14.8 | 19.5 | 24.1 | 28.6 | 38.8 | 45.9 | 59.7 | 64.8 | 56.9 | 52.6 |
| Average Temperature (F) | 55.8 | 46.0 | 26.3 | 28.2 | 37.1 | 41.6 | 50.7 | 58.1 | 73.2 | 76.5 | 69.1 | 66.6 |
| Departure From Normal (F) | +4.9 | +9.0 | +0.4 | +3.6 | +9.0 | +3.9 | +2.0 | -1.4 | +3.4 | +1.8 | -3.5 | +3.1 |
| Precipitation (in) | 0.12 | 1.56 | 0.90 | 0.90 | 0.30 | 1.63 | 1.87 | 6.03 | 1.93 | 3.66 | 3.65 | 2.19 |
| Departure From Normal (in) | -1.92 | +0.54 | +0.33 | +0.41 | -0.25 | -0.16 | -0.36 | +1.85 | -2.00 | +0.38 | +0.57 | +0.12 |
| Snowfall (in) | 0.0 | 0.2 | 1.0 | 4.5 | 5.2 | 0.7 | T | 1.6 | 0.0 | 0.0 | 0.0 | 0.0 |
| Departure From Normal (in) | -0.7 | -2.9 | -2.5 | +0.1 | +0.1 | -3.9 | -1.8 | +1.6 | 0.0 | 0.0 | 0.0 | -0.2 |
Ord - 12 Month Climate History:
Winter precipitation totals often include NWS Cooperative Observer data due to the automated airport equipment under-measuring snowfall liquid equivalent.
| Ord (Evelyn Sharp Field Airport ASOS) - Oct. 2016 - Sep. 2017 | ||||||||||||
| Oct. | Nov. | Dec. | Jan. | Feb. | Mar. | Apr. | May | June | July | Aug. | Sep. | |
| Average High (F) | 70.3 | 56.7 | 37.6 | 34.1 | 48.4 | 53.7 | 61.7 | 69.7 | 86.3 | 90.3 | 81.4 | 78.0 |
| Average Low (F) | 37.4 | 28.1 | 9.3 | 14.2 | 19.8 | 28.7 | 37.9 | 44.1 | 56.9 | 64.1 | 56.3 | 51.2 |
| Average Temperature (F) | 53.8 | 42.4 | 23.5 | 24.1 | 34.1 | 41.2 | 49.8 | 56.9 | 71.6 | 77.2 | 68.8 | 64.6 |
| Departure From Normal (F) | +4.2 | +6.1 | -1.4 | -0.5 | +6.3 | +3.5 | +1.0 | -2.4 | +2.4 | +2.8 | -4.2 | +1.0 |
| Precipitation (in) | 0.09 | 1.26 | 0.41 | 1.15 | 0.79 | 1.83 | 4.25 | 3.10 | 0.59 | 2.53 | 5.93 | 2.89 |
| Departure From Normal (in) | -1.84 | +0.19 | -0.18 | +0.78 | +0.35 | +0.38 | +1.66 | -0.71 | -3.53 | -0.44 | +2.77 | +0.45 |
| Snowfall (in) | 0.0 | 3.0 | 2.7 | 11.9 | 10.4 | 1.9 | 1.0 | 6.0 | 0.0 | 0.0 | 0.0 | 0.0 |
| Departure From Normal (in) | -1.1 | -2.3 | -4.7 | +5.1 | +4.4 | -4.0 | -1.5 | +6.0 | 0.0 | 0.0 | 0.0 | 0.0 |
Smith Center, KS - 12 Month Climate History:
All data is from the official NWS observer, with 24-hour observations taken around 7 a.m. As a result, data may vary slightly from true "Calendar Day" totals.
| Smith Center KS (NWS Coop Observer) - Oct. 2016 - Sep. 2017 | ||||||||||||
| Oct. | Nov. | Dec. | Jan. | Feb. | Mar. | Apr. | May | June | July | Aug. | Sep. | |
| Average High (F) | 73.9 | 61.0 | 38.7 | 39.0 | 53.4 | 58.5 | 65.4 | 73.9 | 89.8 | 95.2 | 86.4 | 85.6 |
| Average Low (F) | 43.5 | 32.9 | 14.2 | 18.5 | 24.2 | 30.2 | 40.0 | 46.8 | 60.9 | 66.7 | 59.9 | 56.0 |
| Average Temperature (F) | 58.7 | 47.0 | 26.5 | 28.7 | 38.8 | 44.4 | 52.7 | 60.4 | 75.4 | 80.9 | 73.1 | 70.8 |
| Departure From Normal (F) | +3.9 | +6.6 | -2.3 | +1.0 | +6.8 | +2.8 | +0.2 | -3.3 | +1.4 | +1.2 | -4.1 | +2.6 |
| Precipitation (in) | 0.09 | 0.99 | 0.56 | 1.46 | 0.27 | 1.26 | 3.32 | 7.03 | 1.31 | 3.26 | 2.05 | 2.67 |
| Departure From Normal (in) | -1.79 | -0.23 | -0.10 | +0.97 | -0.31 | -0.61 | +1.05 | +3.11 | -2.30 | -0.61 | -1.25 | +0.63 |
| Snowfall (in) | 0.0 | 0.0 | 3.1 | 1.1 | 1.8 | 0.2 | 0.0 | 0.0 | 0.0 | 0.0 | 0.0 | 0.0 |
| Departure From Normal (in) | -0.4 | -1.8 | -0.1 | -2.6 | -2.3 | -2.4 | -0.6 | 0.0 | 0.0 | 0.0 | 0.0 | -0.2 |
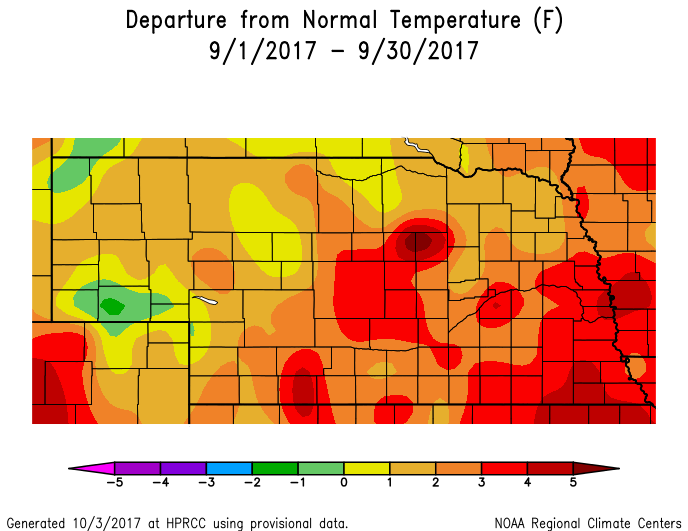
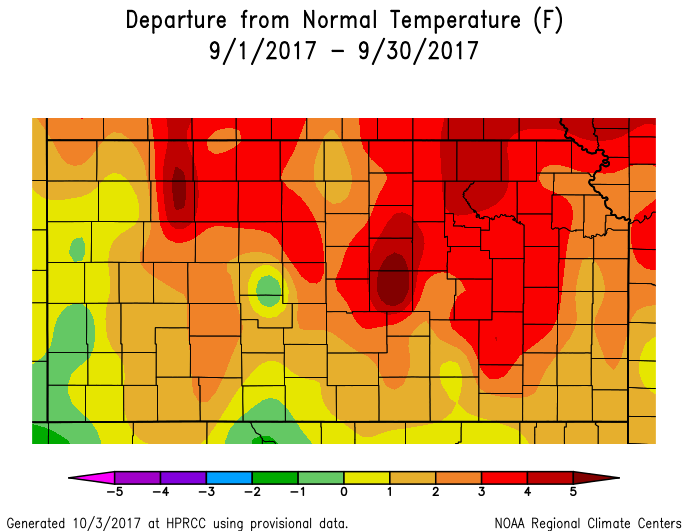
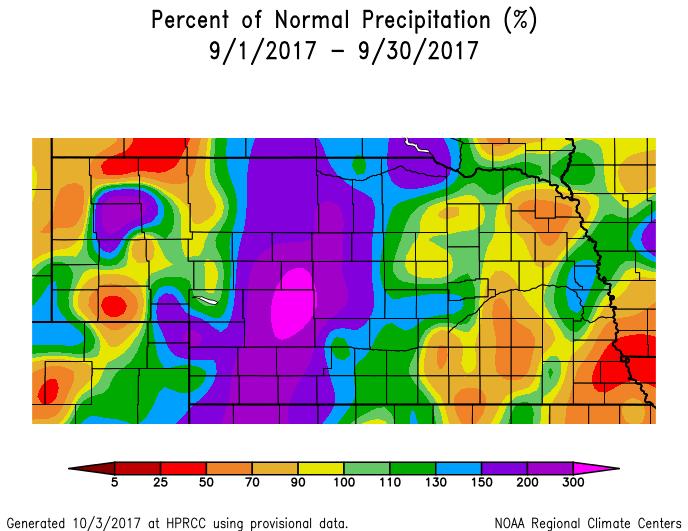
Temperature & Precipitation Departure From Normal Maps:
These images depict September 2017 monthly temperature departure from normal & precipitation percent-of-normal for both Nebraska & Kansas. Images are courtesy of the High Plains Regional Climate Center (HPRCC). Please note: These maps occasionally contain "bullseyes" of errant data. For precipitation, you can also generate departure from normal/percent-of-normal maps using the NWS AHPS page
 |
 |
 |
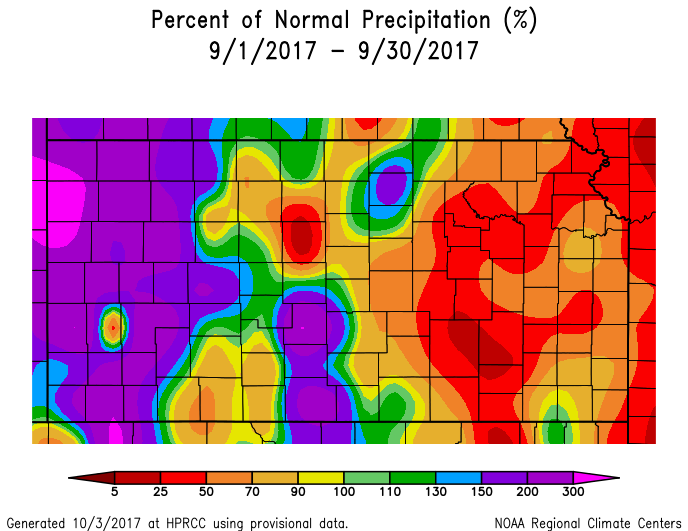 |
| Departure from Normal Temperature - NE (left) & KS (right) | Percent of Normal Precipitation - NE (left) & KS (right) | ||
Drought:
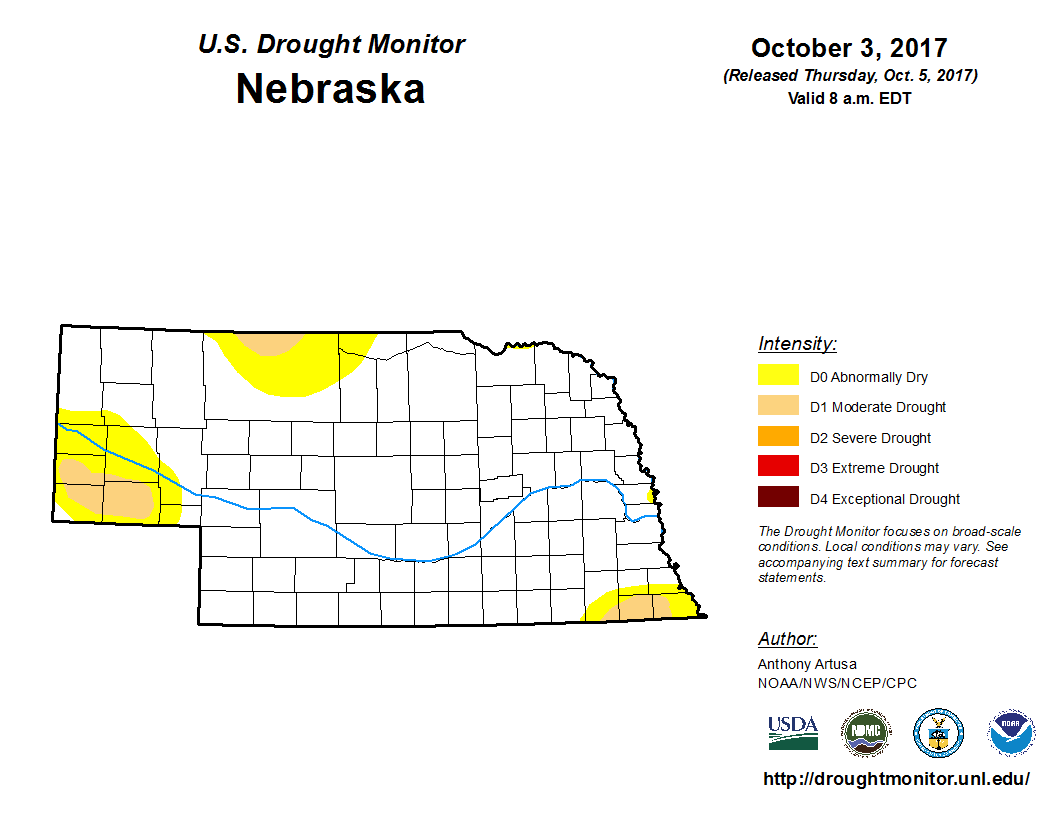
The following drought images, current as of October 3, 2017, are courtesy of the U.S. Drought Monitor
Brief summary of changes during September for the NWS Hastings coverage area:
Given that September rainfall was generally "near-normal" for most of the NWS Hastings coverage area, many counties saw no change in weekly Drought Monitor categories, and some areas (especially in north central Kansas) saw improvement.
More specifically, literally the entire Nebraska portion of the local area (24 counties) was void of all drought categories whatsoever at month's end. Farther south in our 6 local north central Kansas counties, there was improvement noted. Namely, the area of Moderate Drought (D1) that had encompassed parts of several counties when September began had shrunk to now only include parts of southern Osborne and far southwestern Mitchell counties. Meanwhile, most of Phillips, Smith and Jewell counties were void of all drought categories whatsoever.
 |
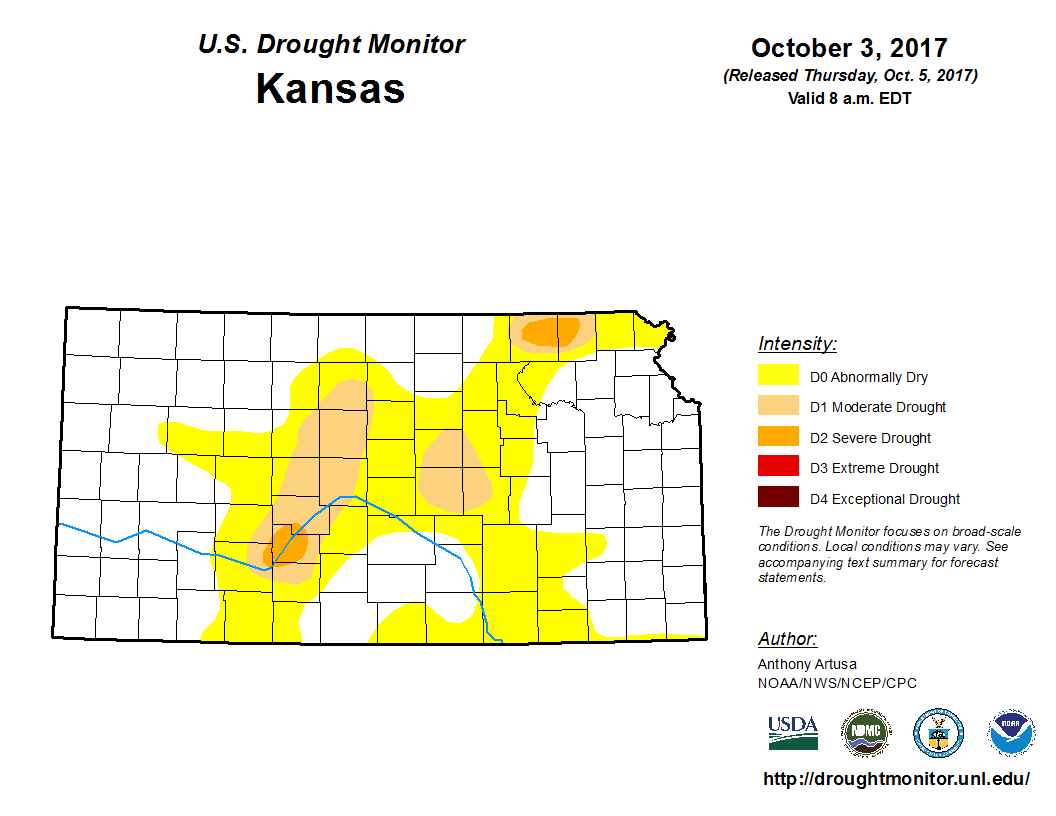 |
| Drought Monitor for Nebraska (left) & Kansas (right). Valid as of October 3, 2017 (click to enlarge) | |
Monthly Extremes for the NWS Hastings Coverage Area:
...A FEW OF THE HOTTEST HIGH TEMPERATURES DURING SEPTEMBER 2017...
(all data from NWS cooperative observers or automated airport sites, with the date in parentheses)
105 degrees...Webster Dam KS (19th)
102 degrees...2 SW Alton KS (21st) - 4WNW Plainville KS (19th)
101 degrees...Harlan County Lake (21st)
100 degrees...Kirwin Dam KS (21st) - Smith Center KS (22nd) - Franklin (21st) - Beaver City (14th)
...A FEW OF THE COOLEST LOW TEMPERATURES DURING SEPTEMBER 2017...
(all data from NWS cooperative observers or automated airport sites)
36 degrees...Greeley (6th)
38 degrees...Cambridge (6th) - Edison (28th) - 2 SW Alton KS (6th) - Ord airport (6th)
39 degrees...Beaver City (28th) - Lexington airport (6th)
40 degrees...Red Cloud (6th) - Minden (27th) - Ravenna (28th) - Superior (7th) - 3 N York (6th)
...A FEW OF THE HIGHEST MONTHLY RAINFALL TOTALS DURING SEPTEMBER 2017...
(all data from NWS cooperative observers or CoCoRaHS/NeRAIN observers unless indicated)
3.75"...St. Paul
3.67"...Gothenburg
3.57"...1 NNE Central City
3.55"...Belgrade
3.48"...Ravenna
3.30"...Edison
3.28"...5 SSW Scottsville, KS
...A FEW OF THE LOWEST MONTHLY RAINFALL TOTALS DURING SEPTEMBER 2017...
(all data from NWS cooperative observers or automated airport sites unless specified)
1.22"...Superior - Covert, KS
1.27"...Logan, KS
1.43"...1 ENE McCool Junction
1.50"...Ionia, KS
1.59"...Phillipsburg, KS
1.78"...Mankato, KS
1.88"...3 NE Shelby
 |
Media use of NWS Web News Stories is encouraged! Please acknowledge the NWS as the source of any news information accessed from this site. |
|

