
This page is a dedicated self brief resource for EMs.
For information on a particular hazard, just click on the appropriate tab above.
 |
|
|
|||||||||||||||||||||
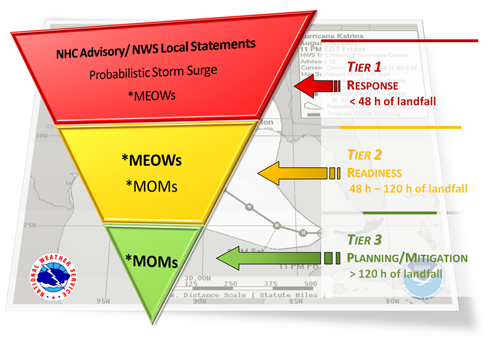
The general briefing slide is an overview of the weather threats with resources for additional information. For high-impact events, more detailed information will be provided via traditional decision support services.
Click here for Watch, Warning, and Advisory Criteria
|
|
Sea Level Rise ViewerView sea level rise and potential coastal flooding impact areas via an interactive interface for any location along the Continental U.S. Coastline. |
|
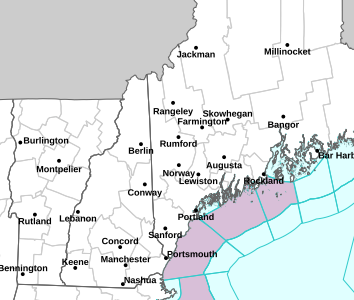
Coastal Flood Exposure MapCommunity discussion planner about hazards and impact maps or your local area. |
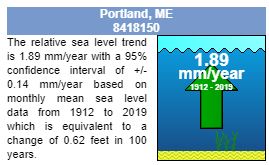 |
Sea Level TrendLocal sea level trends measured by tide measurement gauges. |
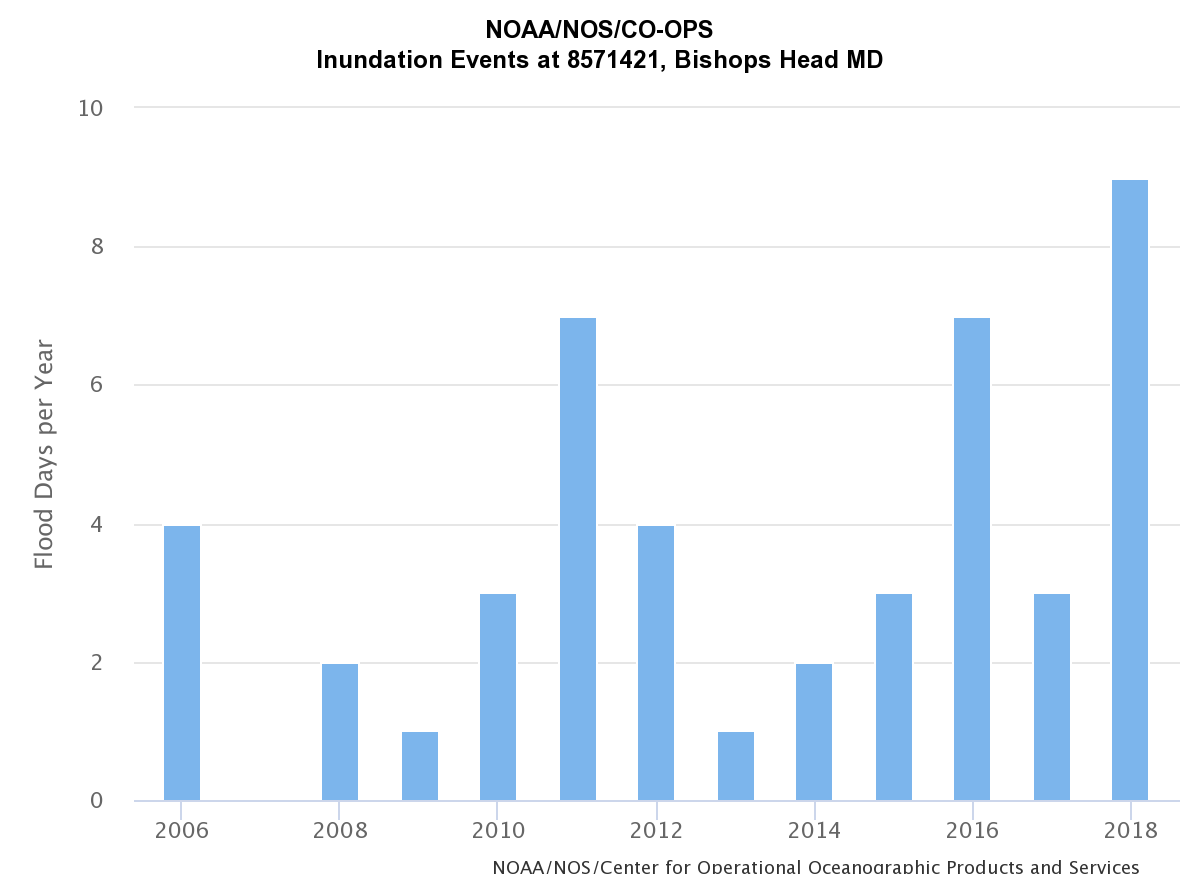 |
NOS Inundation DashboardContains forecasted water levels in addition to historical inundation data at specific tide gauges. |
Forecasted Flood Level Guidance
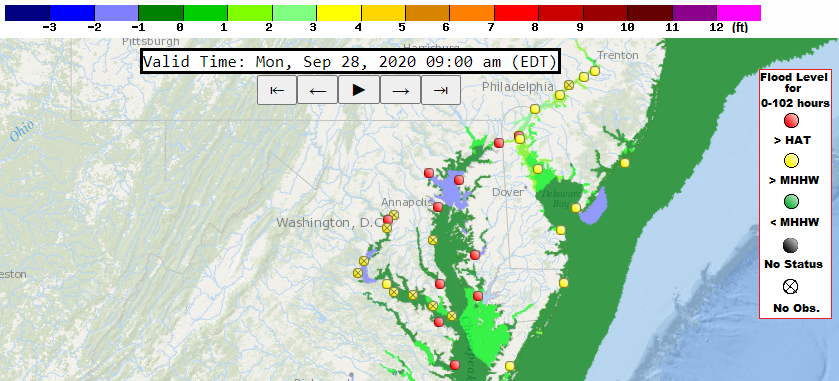 |
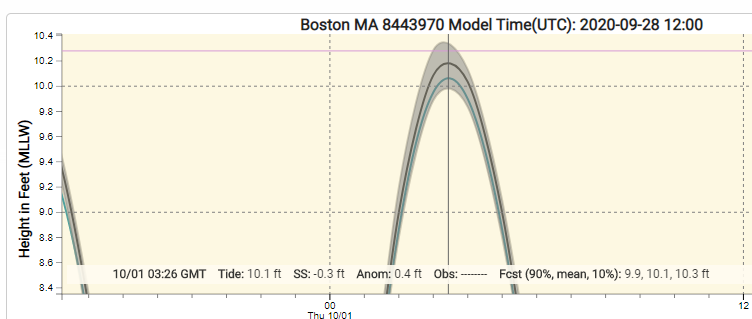
ETSS Storm Surge ModelThis product is experimental total water level model guidance for tide gauges. Water level guidance is for extra-tropical storms. |
 |
PETSS Storm Surge ModelThis product is experimental total water level probabilistic model guidance for tide gauges. Water level guidance is for extra-tropical storms. |
 |
ESTOFS Storm Surge ModelThis product is experimental total water level model guidance for tide gauges. Water level guidance is for extra-tropical storms. |
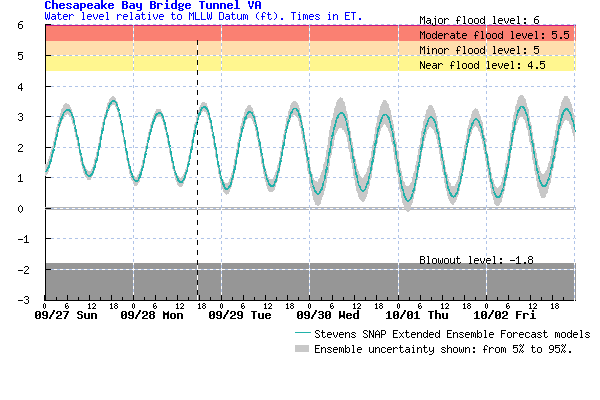 |
Stevens Flood Advisory SystemThis product is experimental total water level probabilistic model guidance for tide gauges. |
National Ocean Service & USGS Resources
 |
NOS Tides & CurrentsHomepage to numerous coastal water level resources. |
 |
NOS Sea Level & Coastal Flooding InformationHomepage to national source for coastal inundation data and sea level trends. |
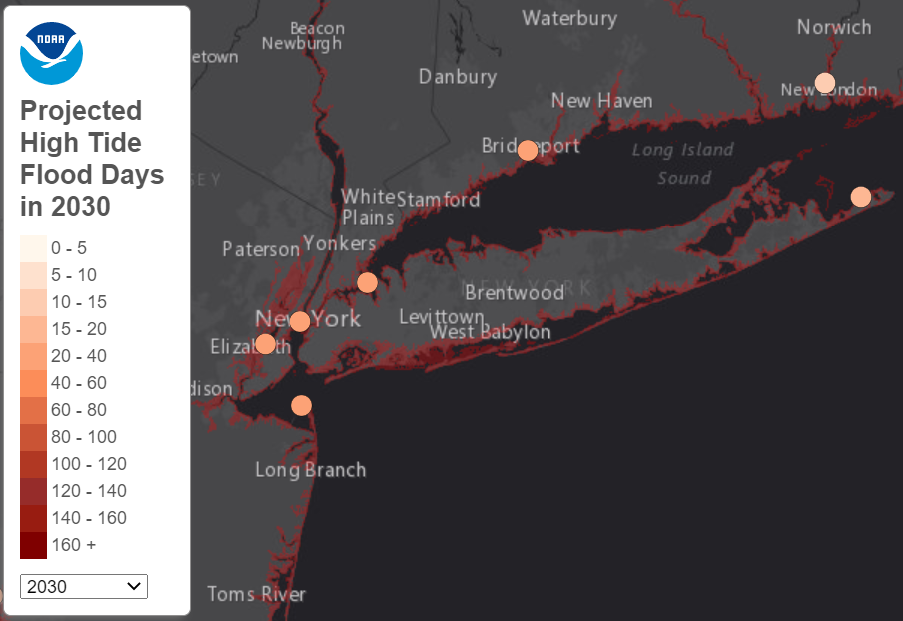 |
The State of High Tide FloodingInterface that displays "sunny day" flood occurrence along the U.S. coastline. Tool also displays potential future high tide flood days in the future. |
.PNG) |
NOS High Tide Flooding Bulletins & ReportsNOAA seasonal high tide bulletins show when regions around the nation may experience higher than normal tides. |
.PNG) |
USGS Coastal Change Hazards PortalInteractive portal to coastal change science and data for our Nation's coasts. |
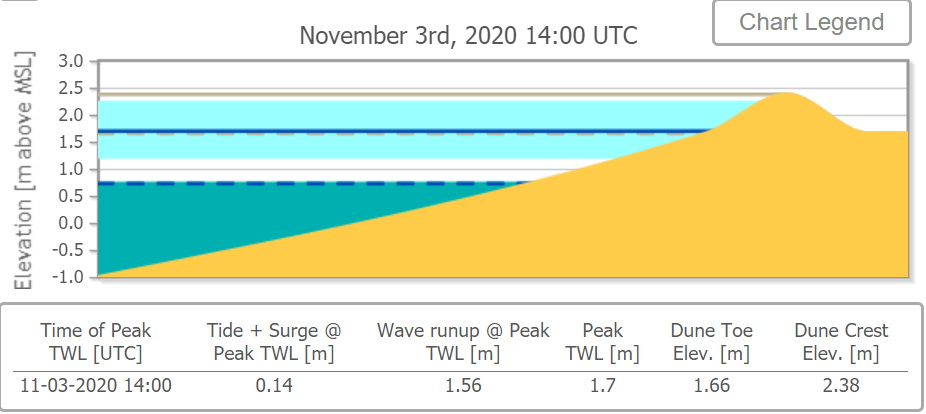 |
USGS Total Water Level & Coastal Change Forecast ViewerTool displays total water level forecasts and coastal change predictions along the U.S. coastline using local beach characteristics. This tool graphically displays dune erosion/overtopping potential. |
FEMA Coastal Flood Resources
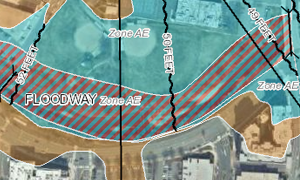 |
FEMA Flood MapsFEMA flood map service is the official public source for flood hazard information produced in support of the National Flood Insurance Program. |
 |
FEMA Coastal Flood RiskFEMA homepage for coastal flooding resources. Includes risk mapping, mitigation planning and flood insurance studies. |
 |
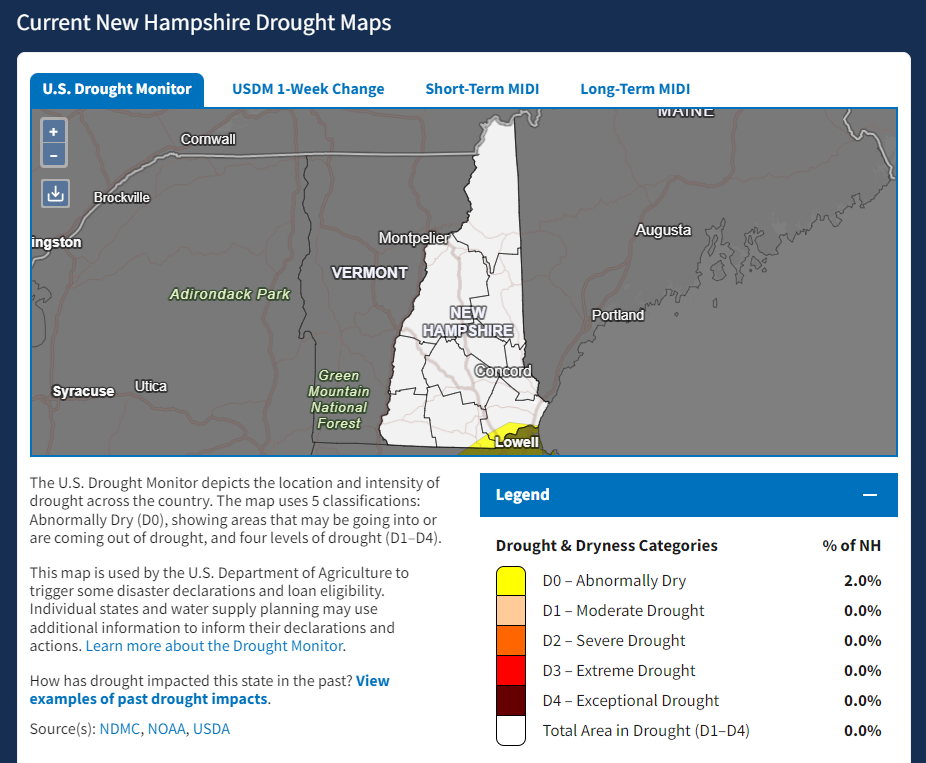
New Hampshire Drought MonitorMap displays the USDA Drought Monitor for the state of New Hampshire. Drought monitor is updated weekly every Thursday. |
 |
Maine Drought MonitorMap Displays the USDA Monitor for the state of Maine. Drought monitor is updated weekly every Thursday |
 |
New Hampshire Drought.gov MonitorNOAA / NIDIS drought focused page for the state of Maine |
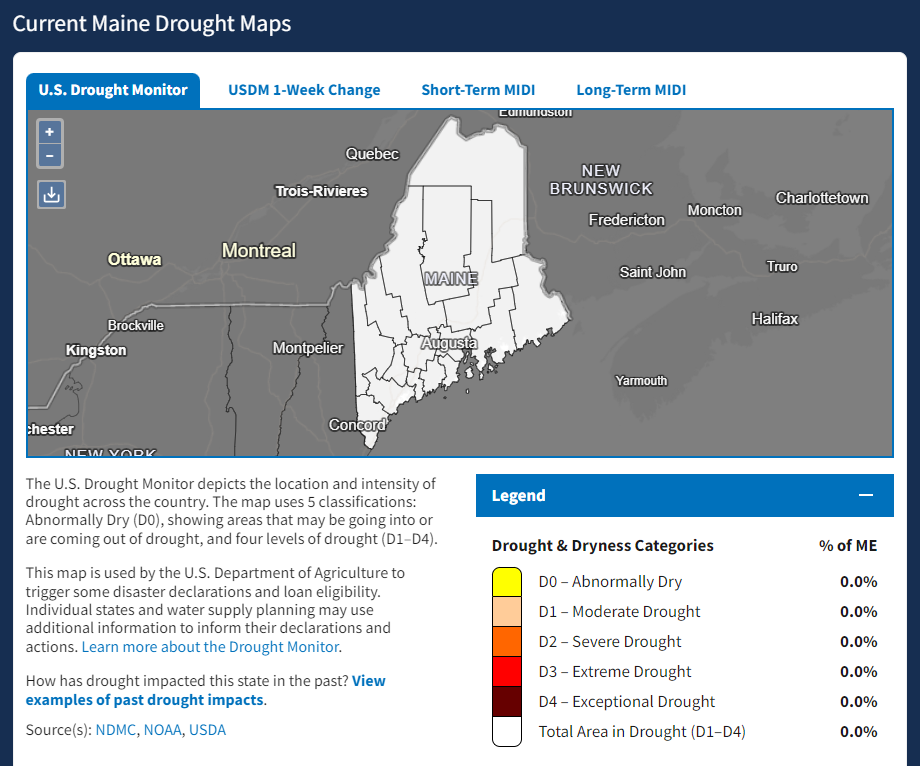 |
Maine Drought.gov MonitorNOAA / NIDIS drought focused page for the state of Maine. |
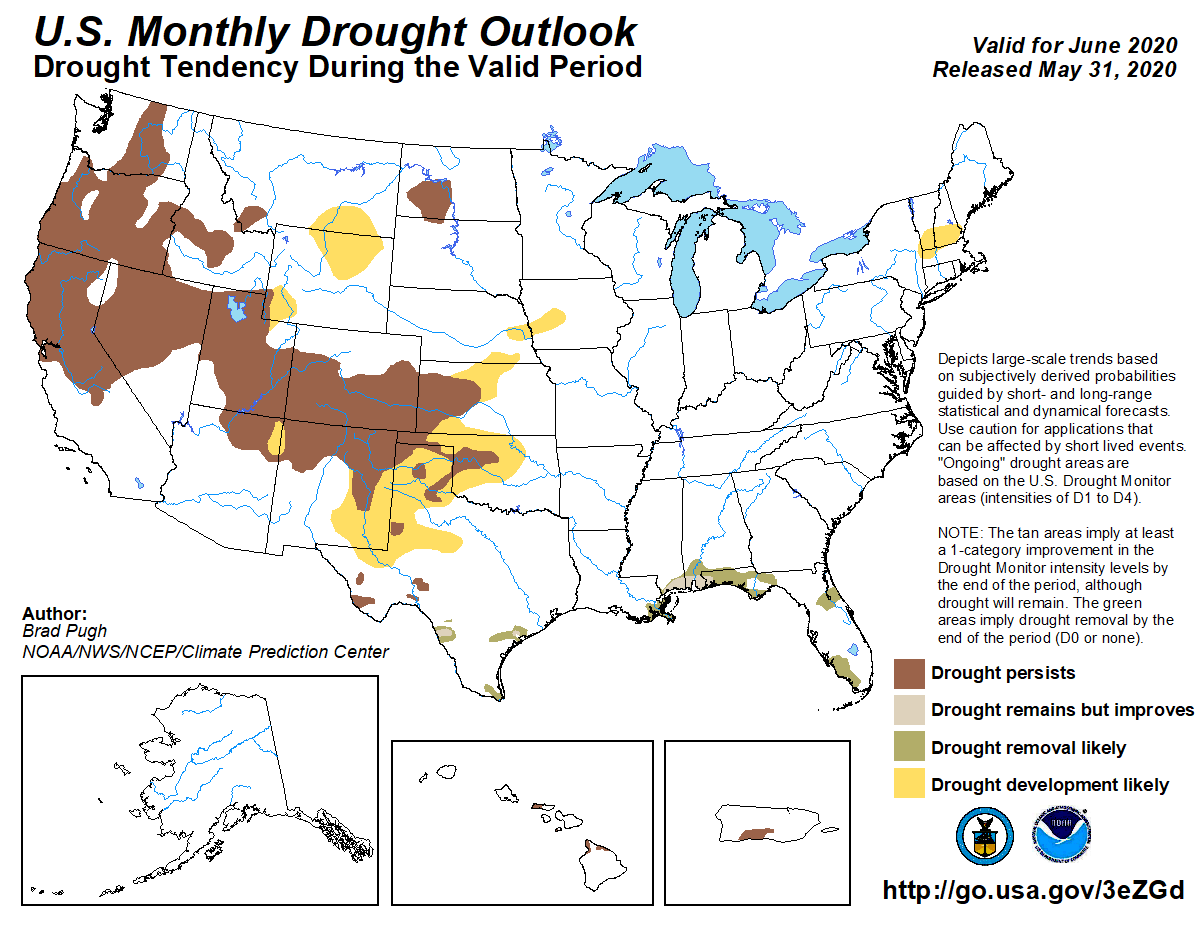 |
Drought OutlookU.S. Monthly Drought Outlook displays the probability of drought development or improvement. Outlook is updated monthly at the beginning of each month. |
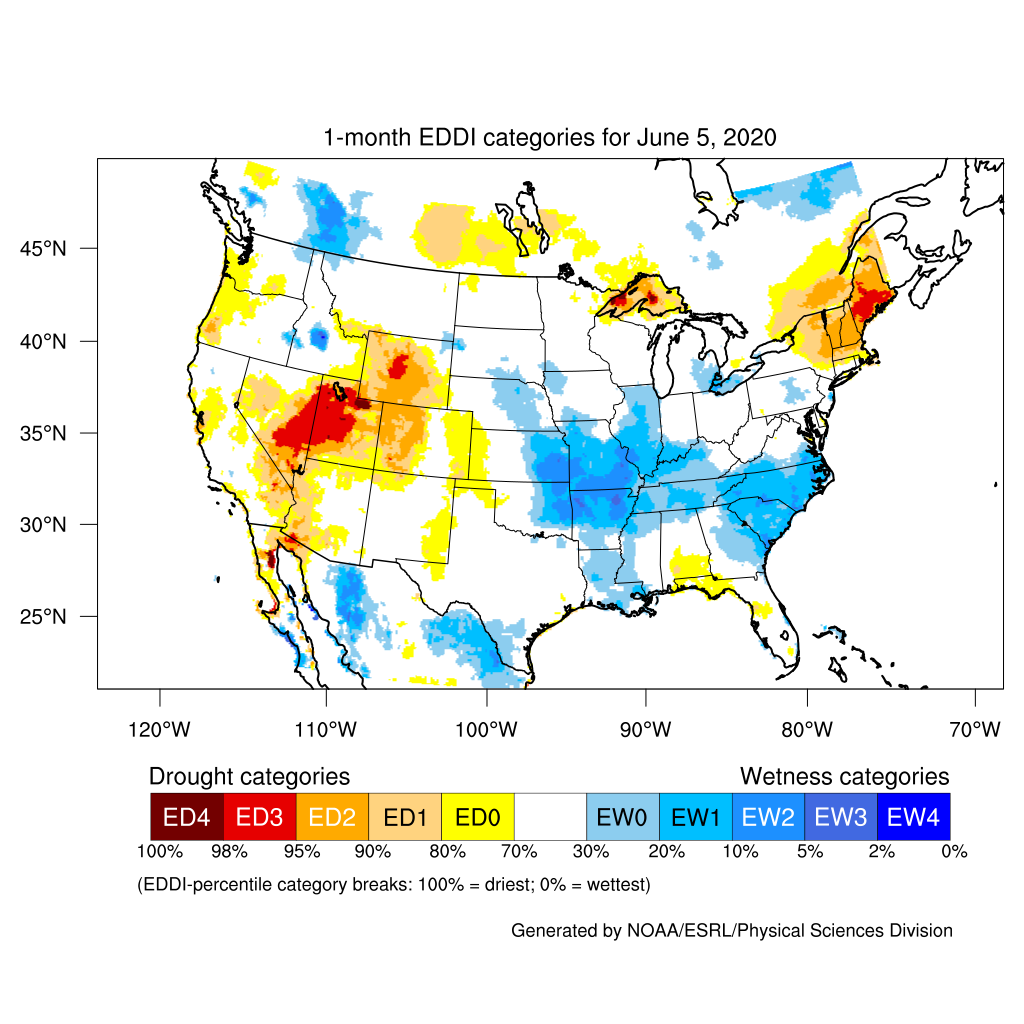 |
Evaporative Demand Drought IndexThe EDDI maps display atmospheric evaporative demand anomalies across a timescale of interest relative to its climatology to indicate the spatial extent and severity of drought. |
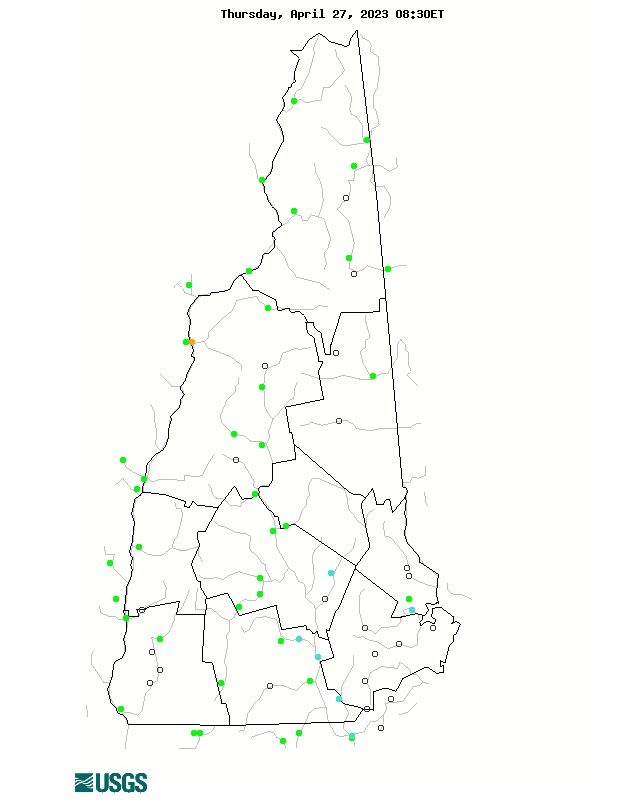 |
USGS New Hampshire Water Conditions MapMap displays USGS river gauge water flow compared to normal for the current time of year. |
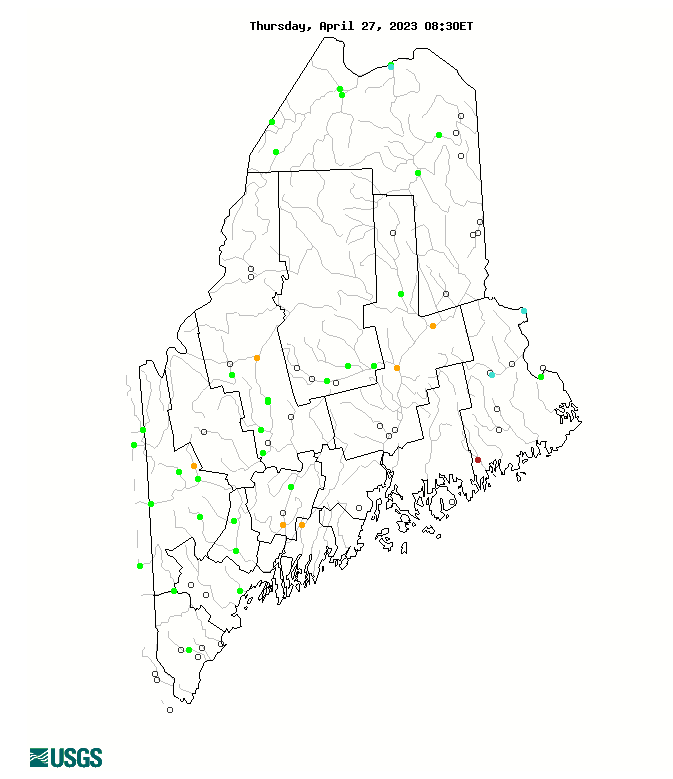 |
USGS Maine Water Conditions MapMap displays USGS river gauge water flow compared to normal for the current time of year.
|
 |
Total Soil Moisture AnomalyMap displays the total soil moisture anomaly for the past week and/or month. |
|
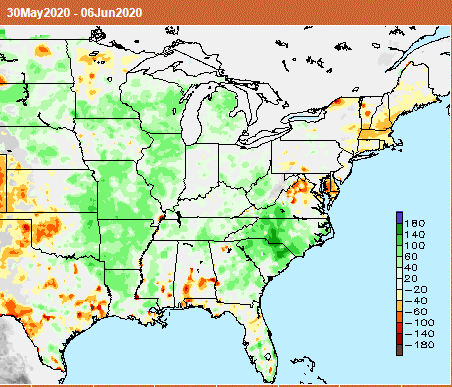
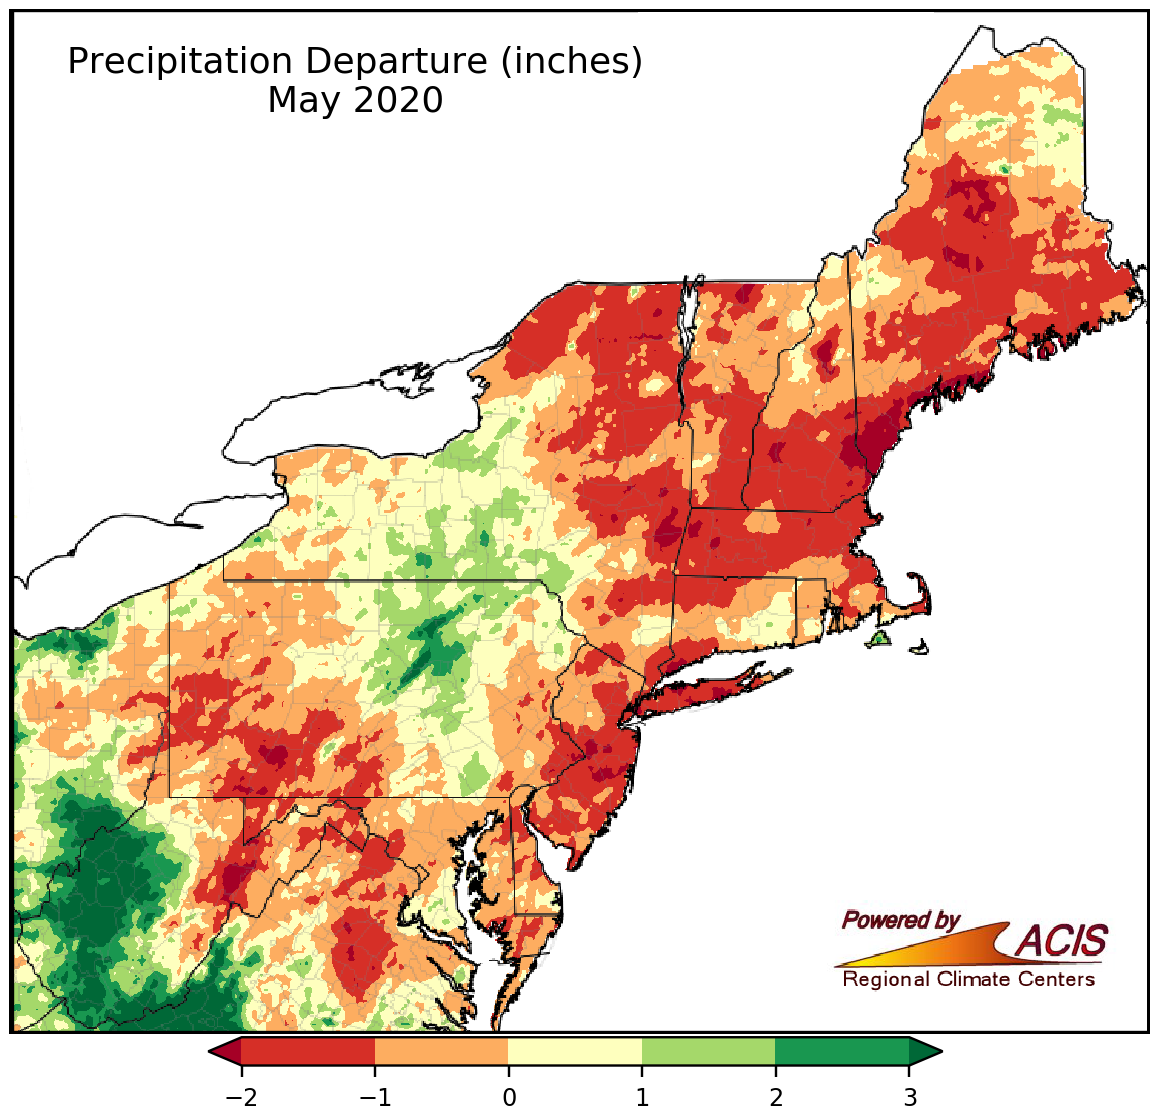
Northeast Regional Climate Center Precipitation AnomalyNumerous maps that display monthly precipitation anomalies across the northeast. |
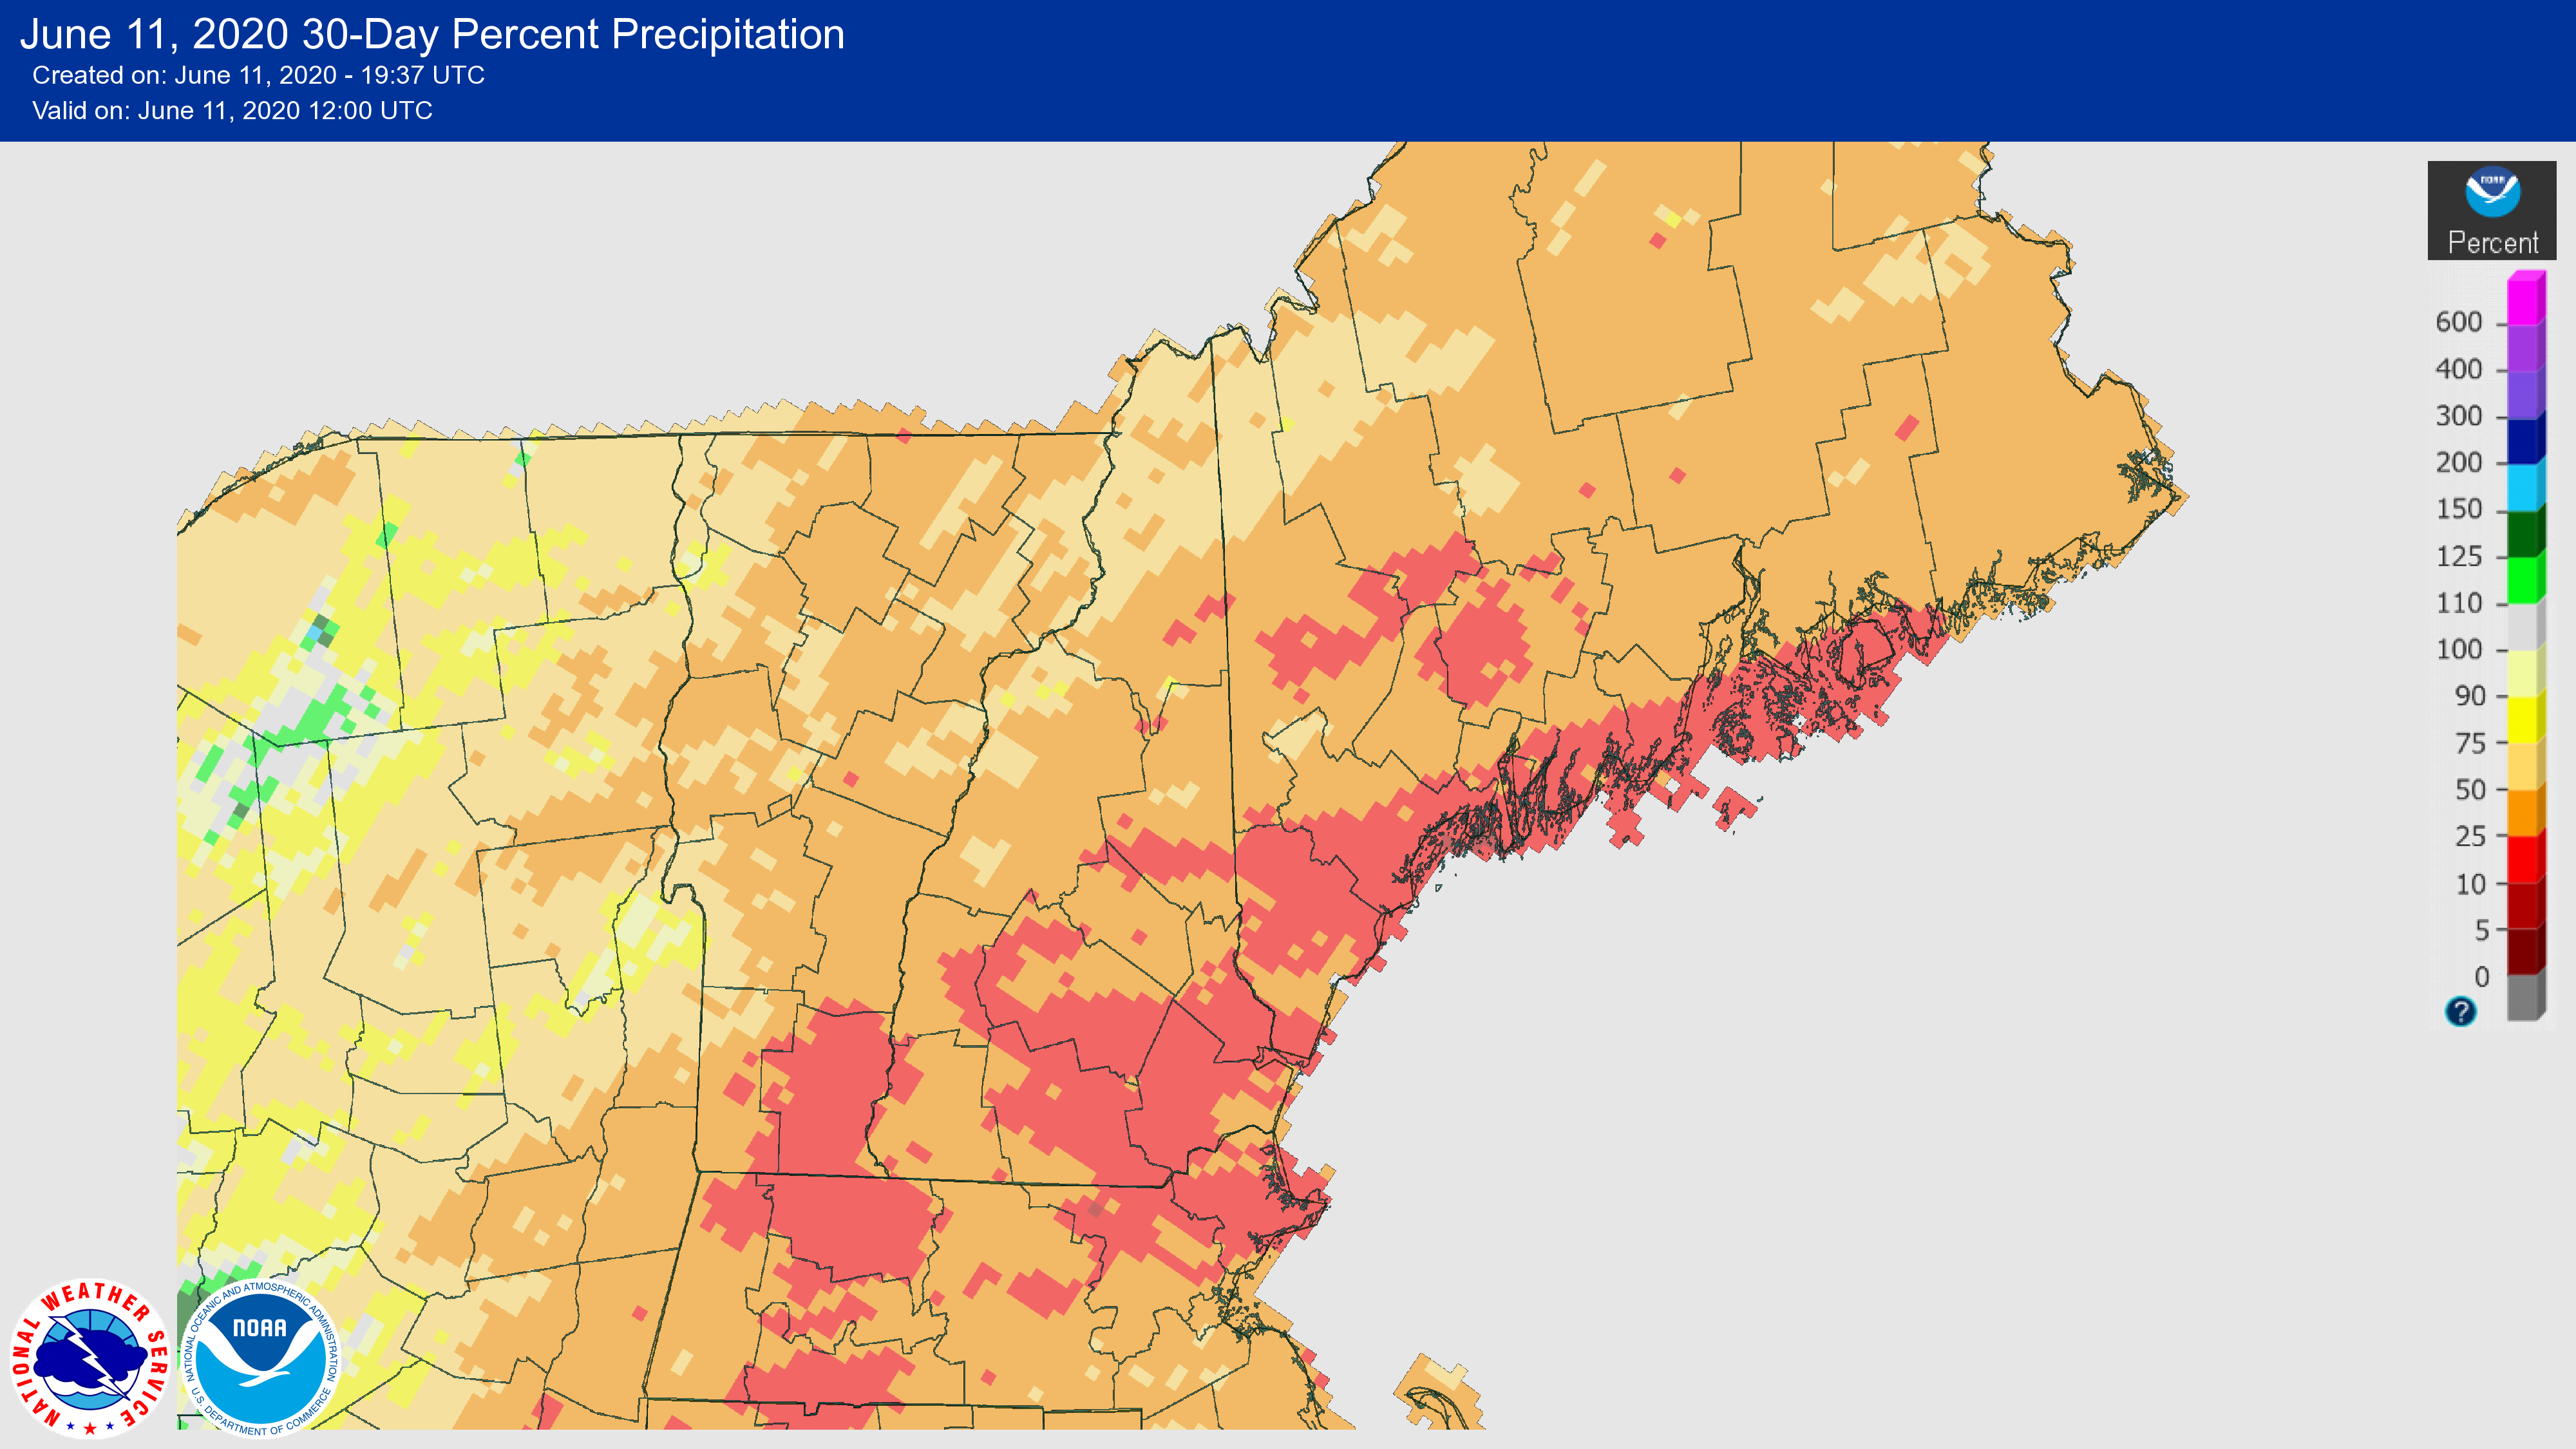 |
NWS Precipitation Departure from NormalMap displays quantitative precipitation estimates that can be displayed in monthly or weekly displays. |
 |
Climate Prediction Center Long Range OutlooksMaps display weekly and monthly precipitation outlooks. |
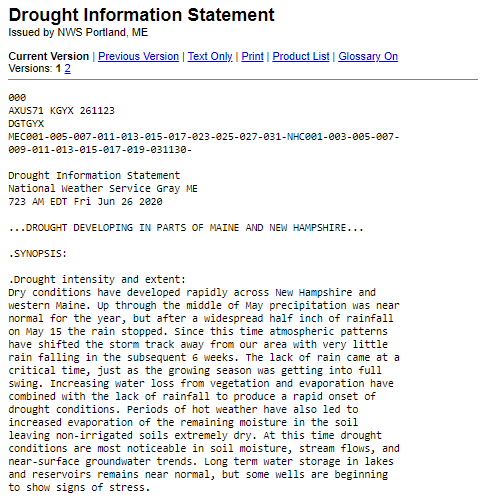 |
Local Drought Information StatementText based information product issued bi-weekly during active drought periods. |
 |
Northeast DEWS DashboardDrought site run by the Northeast Regional Climate Center. |
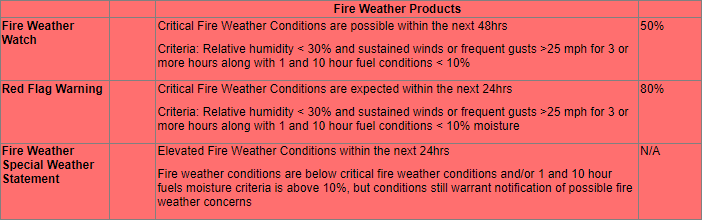
Red Flag Event Criteria |
|
1) Forest fuel conditions dry enough to support dangerous fire behavior. This shall be coordinated with the New Hampshire Forest Protection Bureau, and the Maine Forest Service.
|
|
2) Weather conditions which could result in dangerous fire behavior. Generally, this is caused by a combination of strong winds and low relative humidity.
|
 |
|
Note: Both forest fuels and weather conditions must be expected to issue a Red Flag Warning. |
|
|
Request Spot WeatherSubmit a SPOT weather request for prescribed or wildfires. |
Fire Weather ForecastFire Weather Forecast for New Hampshire and Maine |
|
|
Today's Maximum Wind GustsMap displays today's maximum wind gusts as measure in mph. Map gets updated every time the NWS in Gray produces a new grid. |
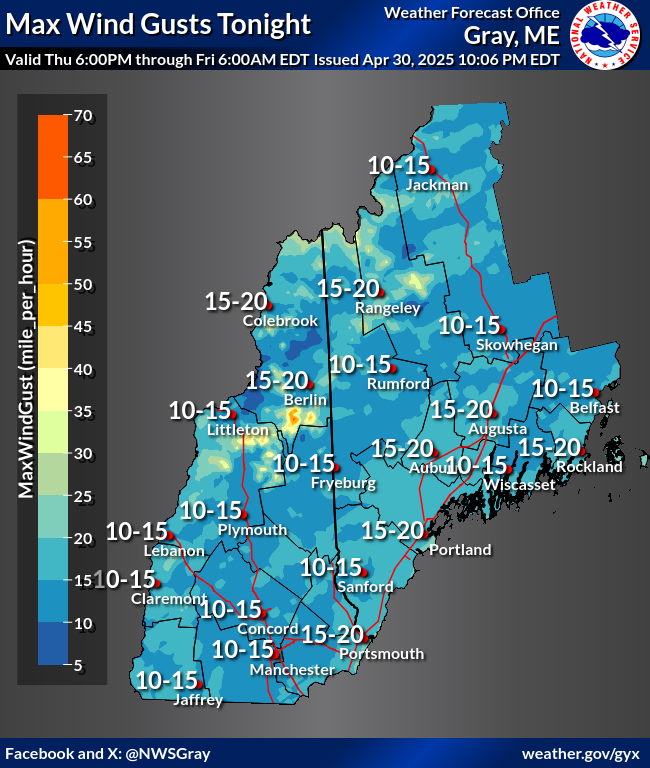 |
Tonight's Maximum Wind GustsMap displays today's maximum wind gusts as measure in mph. Map gets updated every time the NWS in Gray produces a new grid. |
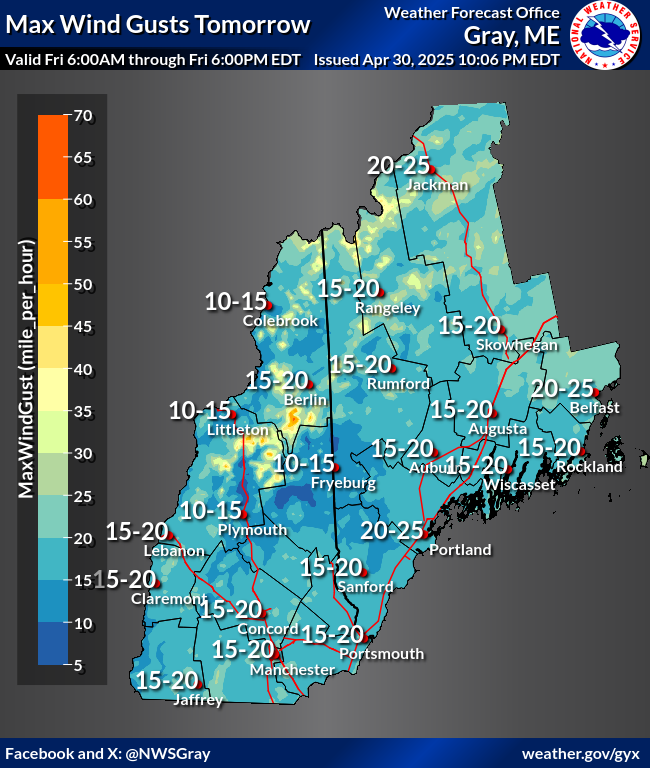 |
Tomorrow's Maximum Wind GustsMap displays tomorrow's maximum wind gusts as measure in mph. Map gets updated every time the NWS in Gray produces a new grid. |
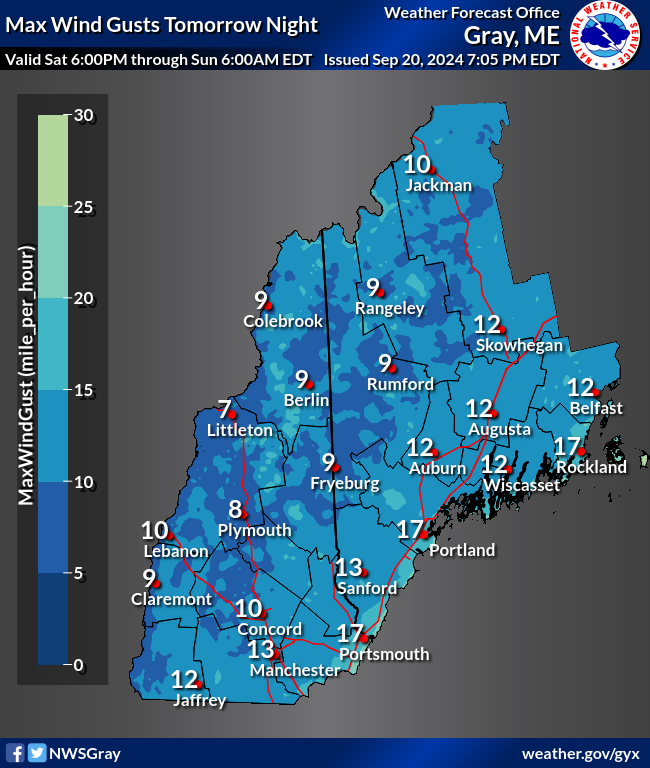 |
Tomorrow Night's Maximum Wind GustsMap displays tomorrow's maximum wind gusts as measure in mph. Map gets updated every time the NWS in Gray produces a new grid. |
|
|
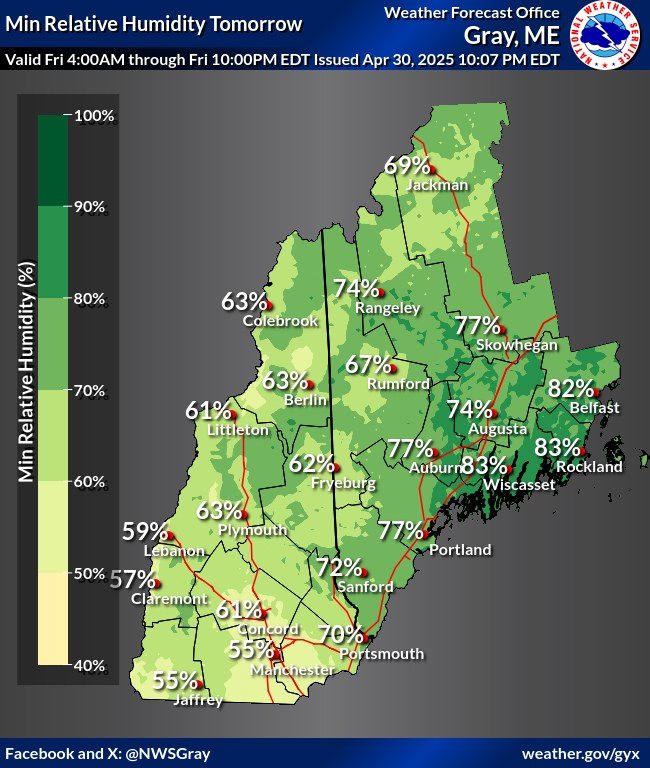
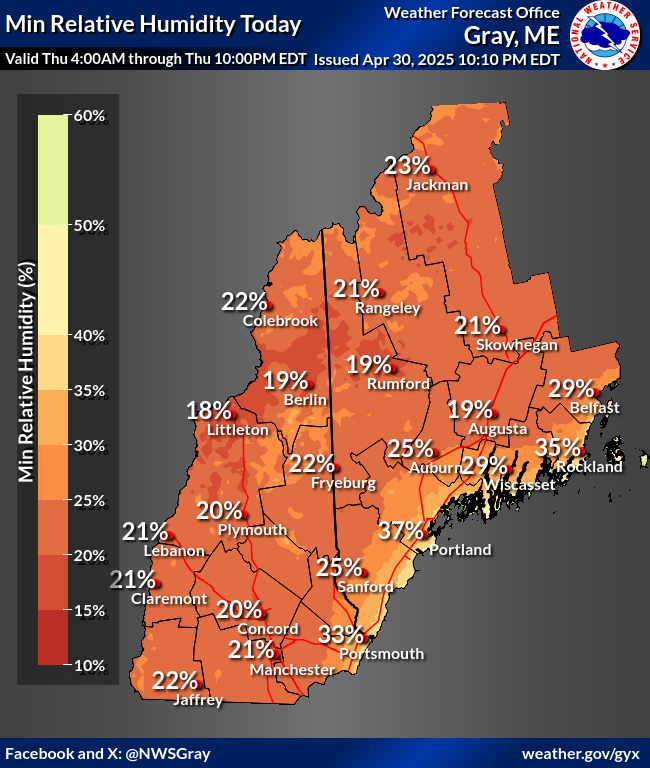
Day 1 Min RHMap displays 24 hour minimum relative humidity values for Day 1. Map is updated every time the forecaster issues a new forecast. |
 |
Day 2 Min RHMap displays 24 hour minimum relative humidity values for Day 2. Map is updated every time the forecaster issues a new forecast.
|
Day 1 OutlookThe Day 1 Outlook covers the 24-hour period from 12Z on the morning of product issuance to 12Z the following morning, with the update covering the 19-hour period from 17Z at issuance to 12Z the following morning. |
Day 2 OutlookThe Day 2 Outlook covers the following 24-hour period after Day 1 out to 48 hours. The Day 2 Fire Weather Outlook is scheduled for issuance at 10Z and is updated at 20Z. |
 Day 3-8 Fire Wx Discussion Day 3-8 Fire Wx Discussion |
Day 3-8 OutlookThe Day 3-8 Outlook covers the period of 48 to 192 hours from 12Z on the morning of product issuance. The Day 3-8 Fire Weather Outlook is scheduled for issuance at 22Z. |
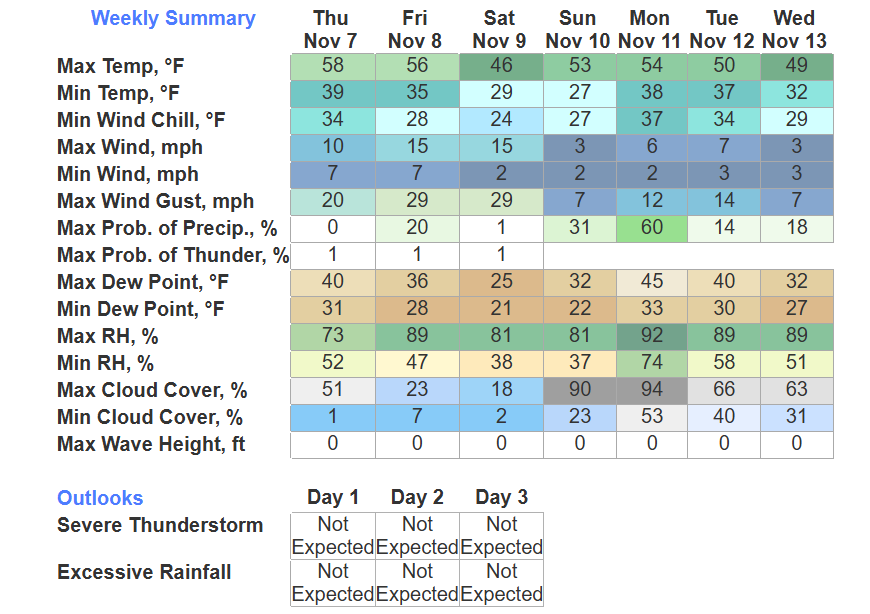 |
IDSS Forecast PointsThe NWS NDFD point based forecast tool. Provides detailed hourly weather resolution forecasts, in addition to weekly daily summary chart. |
Weather HazardsMap displays active watch, warnings, advisories and short term forecasts in the lower 48 states. Map automatically refreshes every five minutes. |
Surface AnalysisThe Weather Prediction Center (WPC) produces surface maps which depicts the analysis of highs, lows, fronts, troughs, outflow boundaries, squall lines, and drylines. |
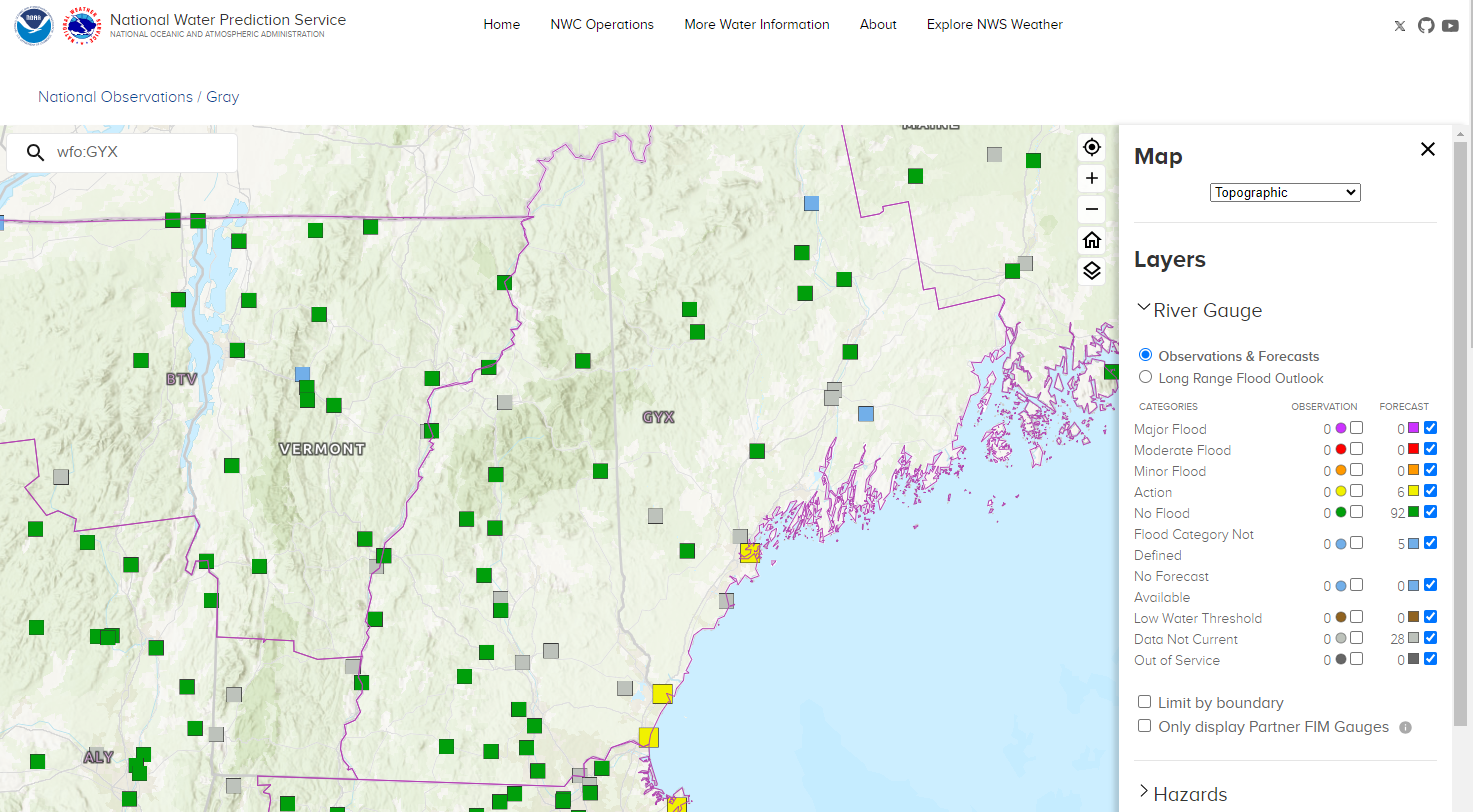 |
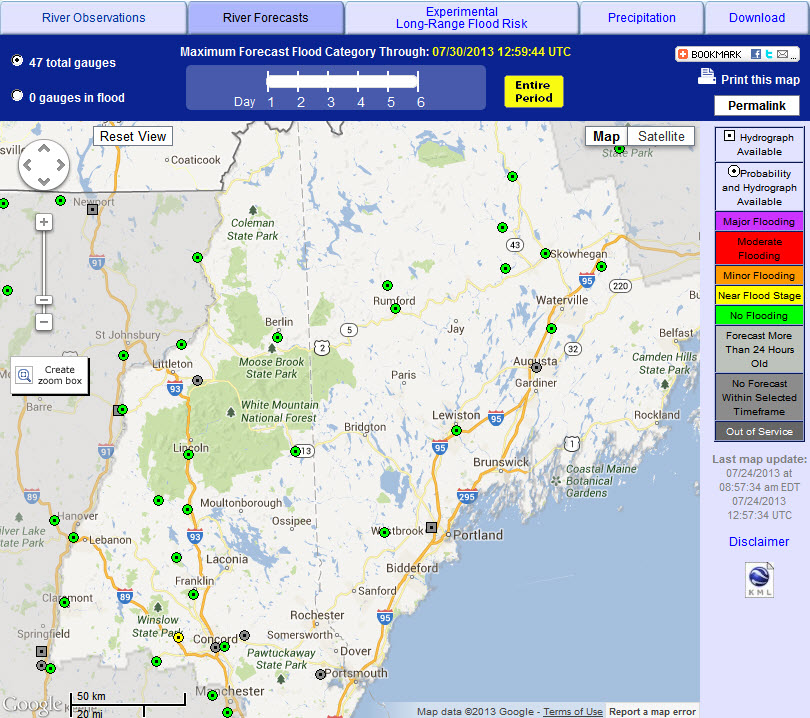
River Forecast PointsMap displays river points in Maine and New Hampshire. Just click on the point where you want a forecast. Map is updated every time a new observation or forecast is generated. |
 |
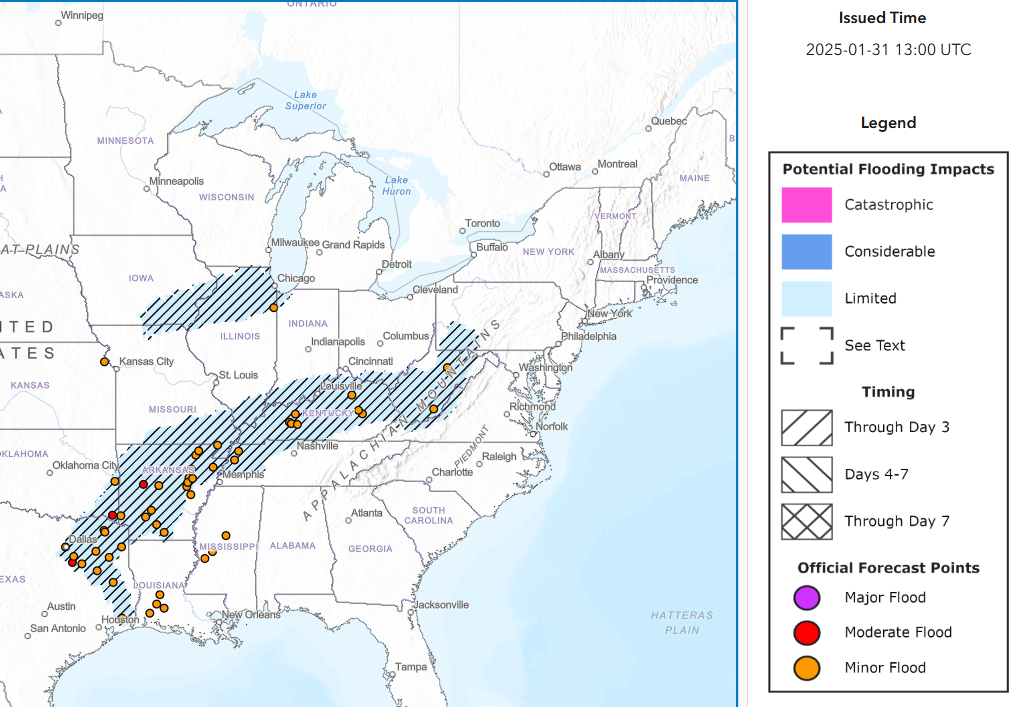
Significant River Flood OutlookThis Flood Outlook is intended to provide a general outlook for significant river flooding. It is not intended to depict all areas of minor flooding or small-scale events such as localized flooding and/or flash flooding. |
||
 |
Ensemble River ForecastsThe objective of this information is to provide short lead-time (<7 days) ensemble river forecasts using forcing fields provided by various meteorological ensemble systems.
This is guidance information and not official river forecast levels! |
 |
|
||
|
|
|||||
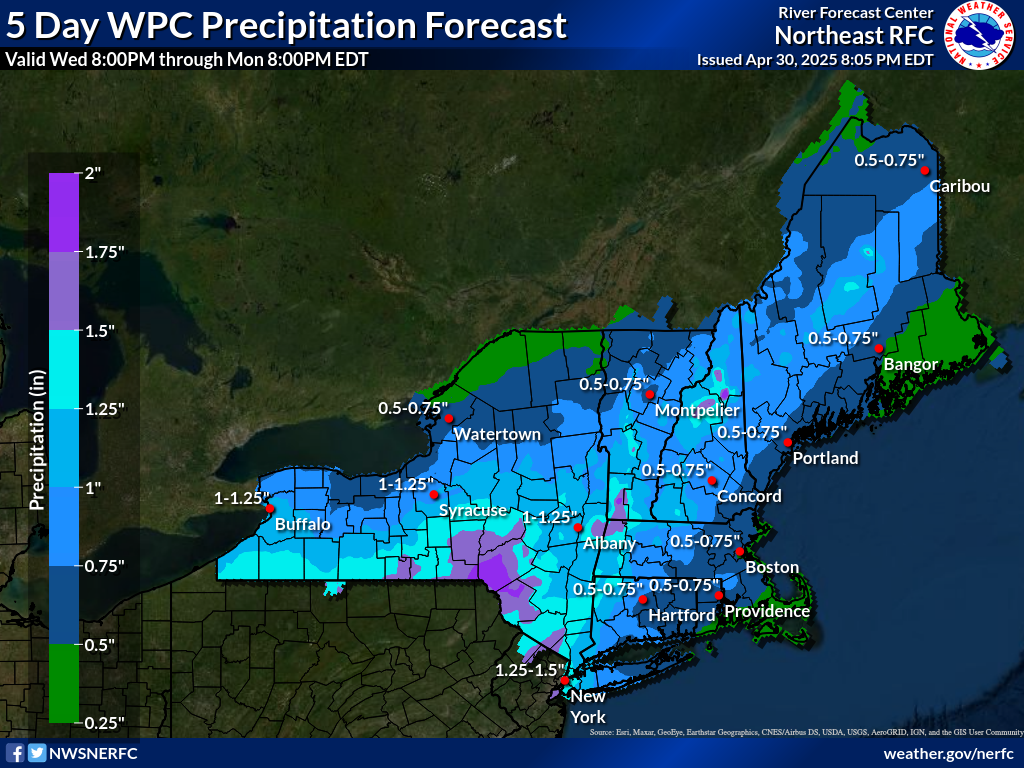 |
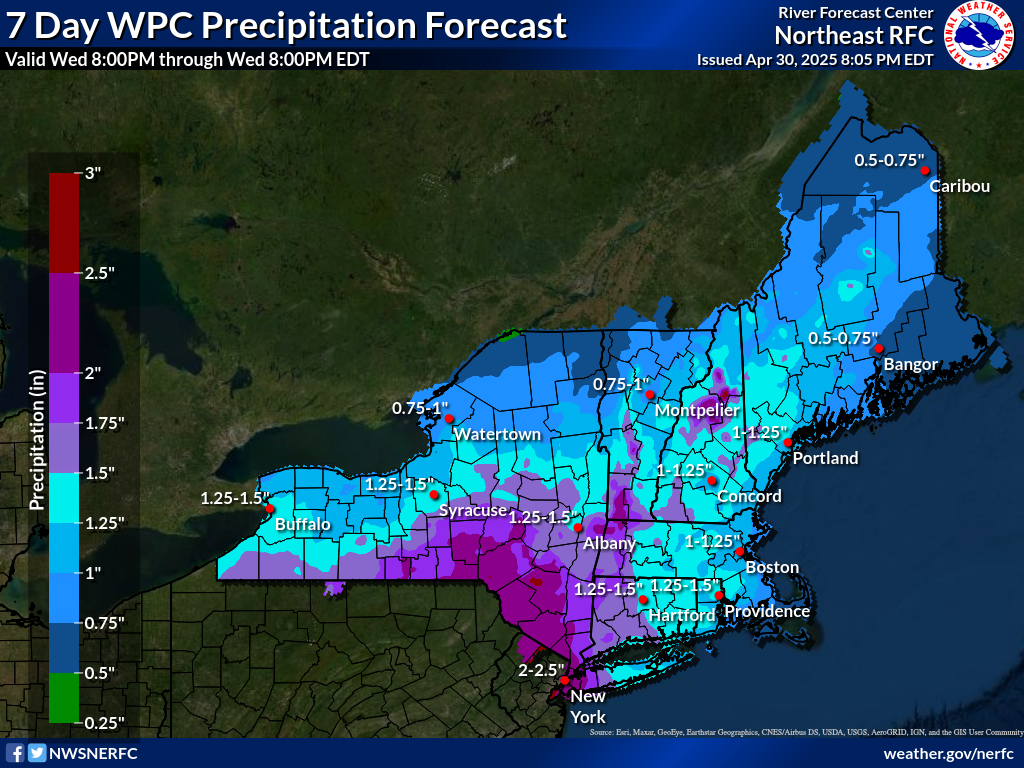
Weather Prediction Center 5-Day OutlookLong range precipitation outlook over the next 5 days provided by the Weather Prediction Center. Weather Prediction Center 7-Day OutlookLong range precipitation outlook over the next 7 days provided by the Weather Prediction Center. |
 |
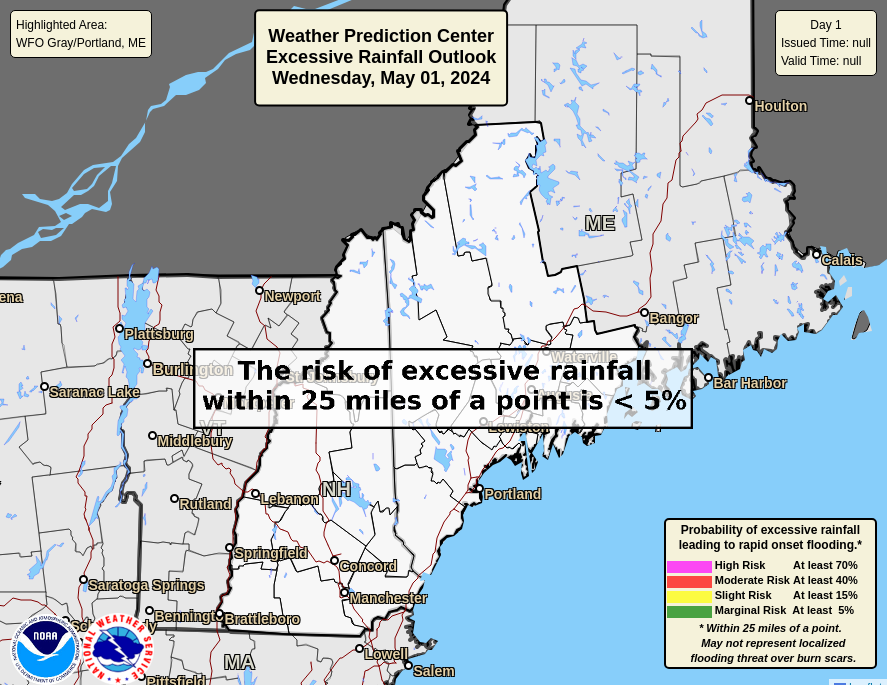
Weather Prediction Center Excessive Rainfall Outlook Day 1Flash flood threat products from WPC Excessive Rainfall Outlook Day 2
Excessive Rainfall Outlook Day 3 |
||
Probabilistic Precipitation PortalThe purpose of these experimental probabilistic liquid precipitation products is to provide customers and partners a range of liquid precipitation possibilities, to better communicate forecast uncertainties. |
 |
National Water Center Flood Outlook ProductThis experimental product combines a depiction of current flood conditions based on the latest river level observations with an assessment of flood risk, leveraging various sources of NWS water resources forecast information. This experimental product is issued twice daily, at 12Z and 21Z. |
|||
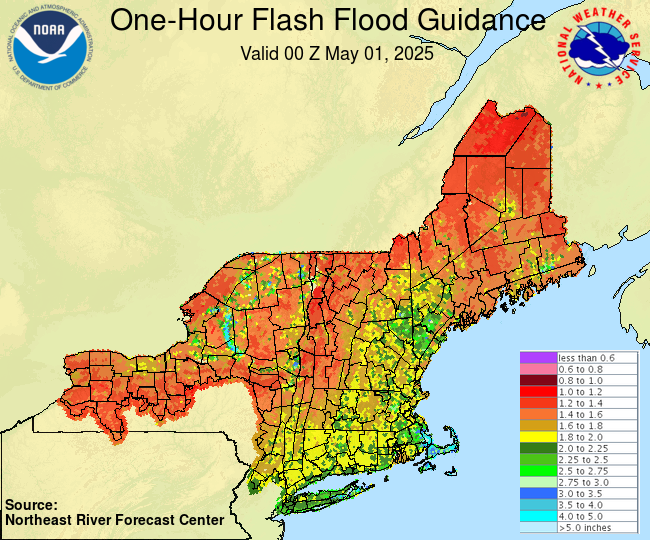 |
Flash Flood GuidanceFlash Flood Guidance is an estimate of the amount of rainfall required over a given area during a given duration to cause small streams to flood issued by Northeast River Forecast Center.
|
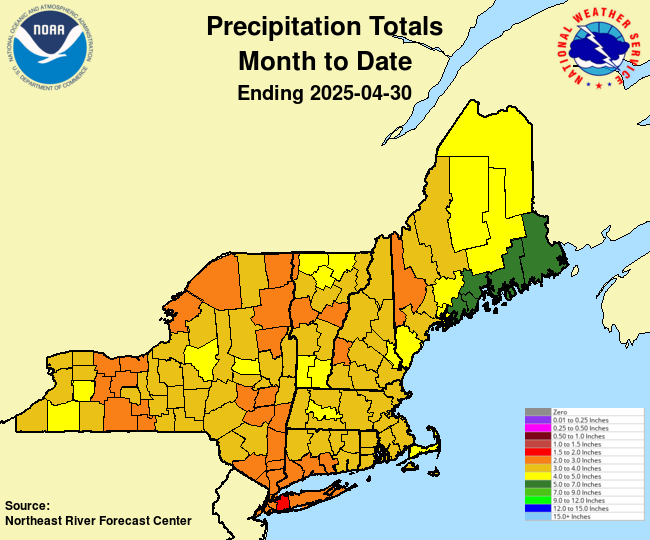 |
Precipitation / DepartureThe precipitation totals used in these graphics and the accompanying text products are from the 6-hourly county mean areal precipitation calculated for use in the NERFC's Community Hydrologic Prediction System. |
||
 |
Weather HazardsMap displays active watch, warnings, advisories and short term forecasts in the lower 48 states. Map automatically refreshes every five minutes. |
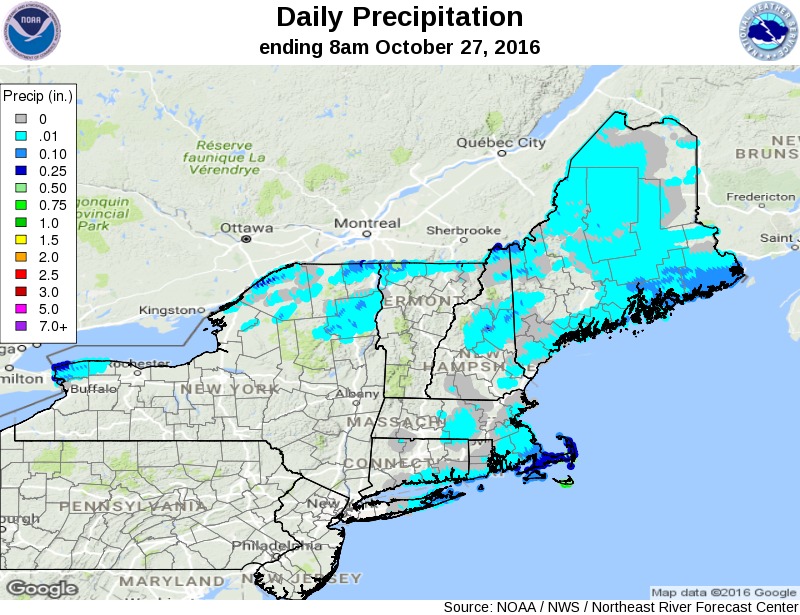 |
Observed PrecipitationNortheast River Forecast Center |
||
|
|
|||||
 |
Historical StreamflowMap of real-time streamflow compared to historical streamflow for the day of the year. |
 |
National Snow AnalysesIncludes data on snow water equivalent, snow depth and more. The data can be view for a day or animated for a two week period or a seaon. NERFC: Observed Snow Maps |
 |
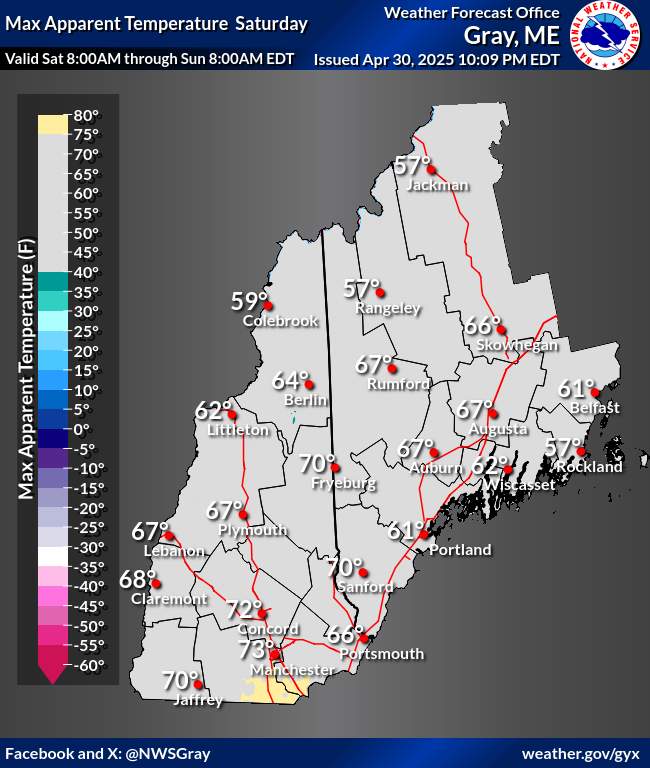
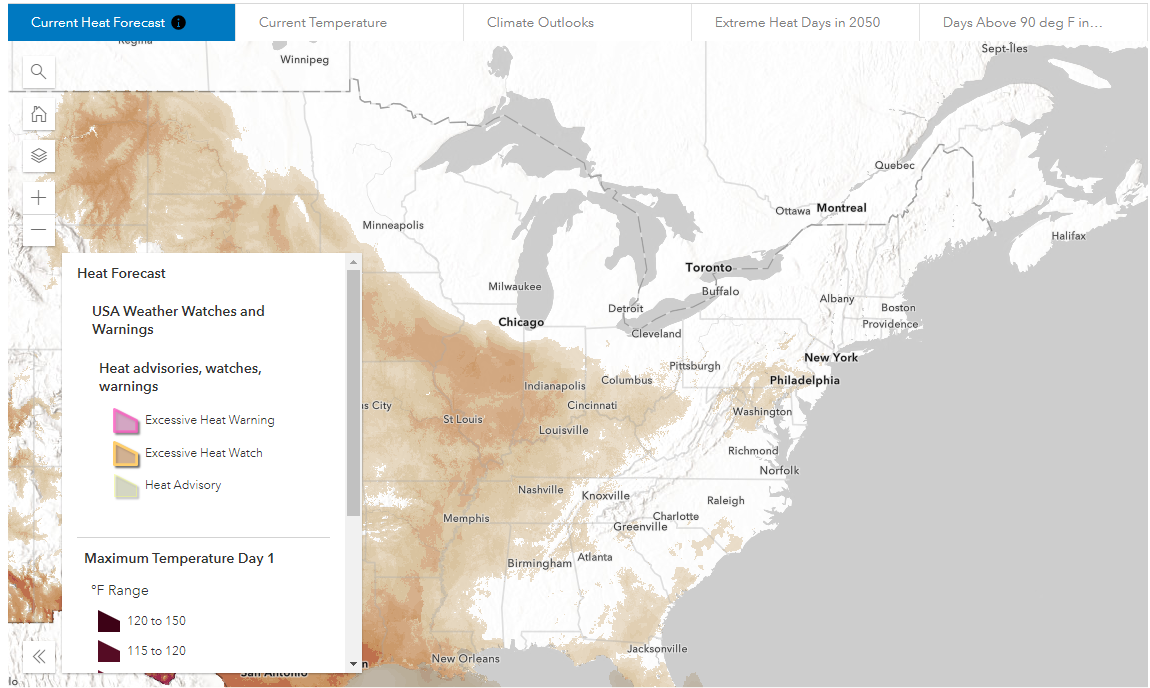
24 Hour Maximum Heat IndexMap displays the 24 Hour maximum heat index. Map gets updated every time the NWS in Gray produces a new grid. |
 |
Day 2 Maximum Heat IndexMap displays the Day 2 maximum heat index. Map gets updated every time the NWS in Gray produces a new grid |
 |
Day 3 Maximum Heat IndexMap displays the Day 3 maximum heat index. Map gets updated every time the NWS in Gray produces a new grid. |
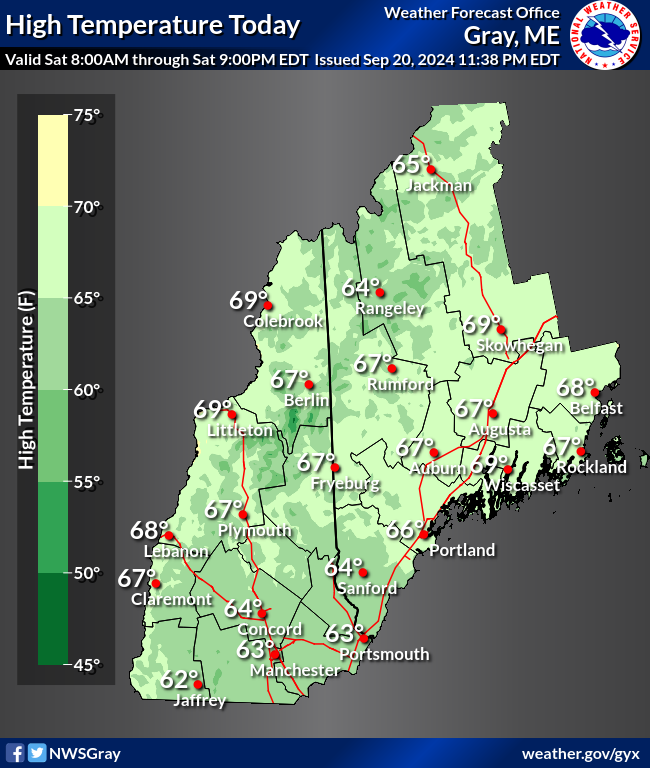 |
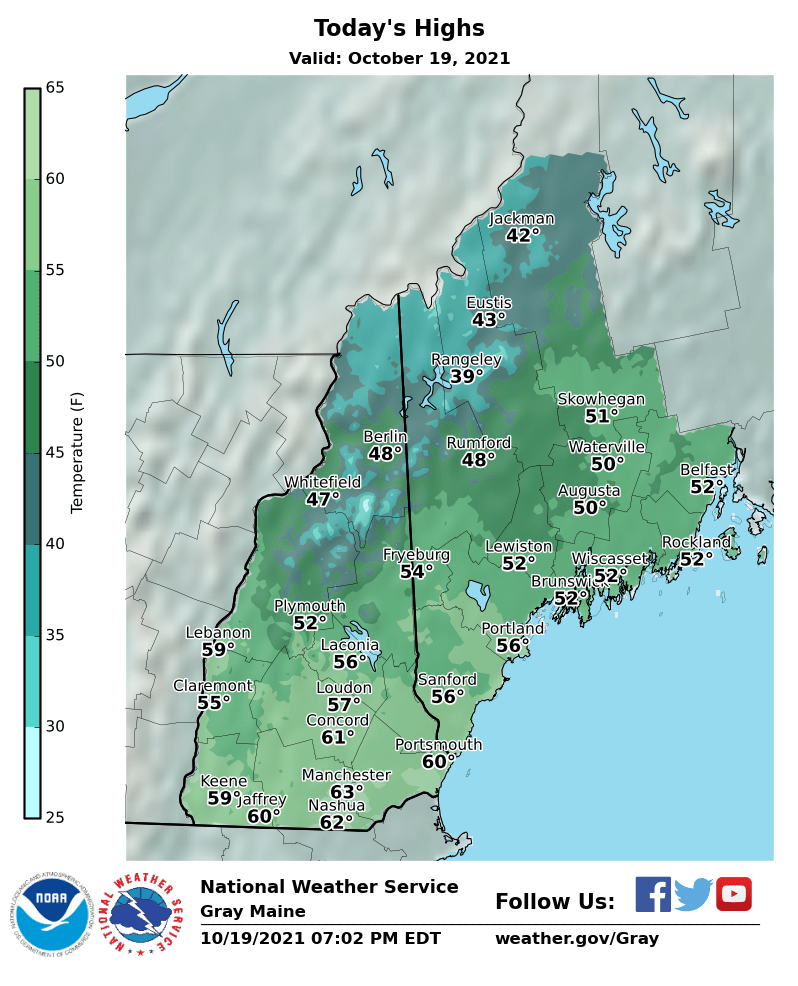
Day 1 Maximum TemperatureMap displays the maximum temperature for Day 1. Map gets updated every time the NWS in Gray produces a new grid. |
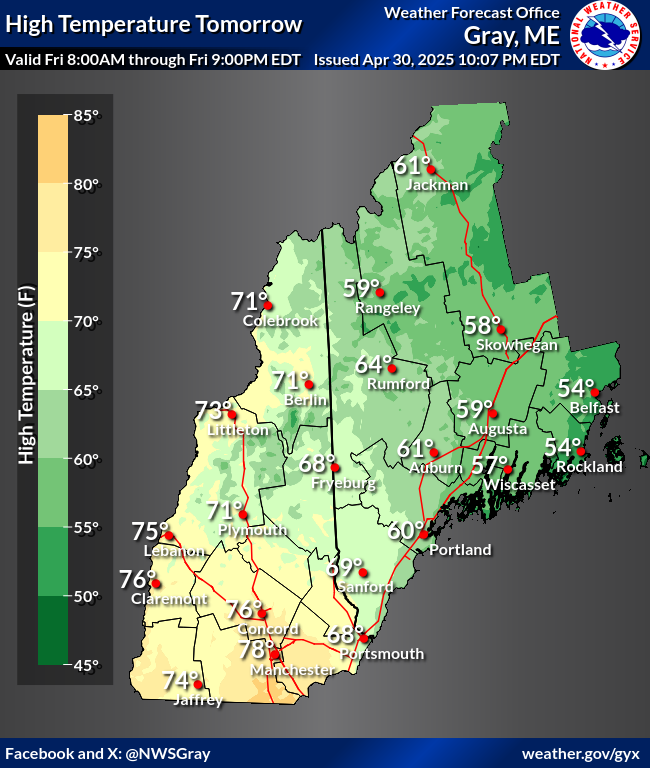 |
Day 2 Maximum TemperatureMap displays the maximum temperature for Day 2. Map gets updated every time the NWS in Gray produces a new grid. |
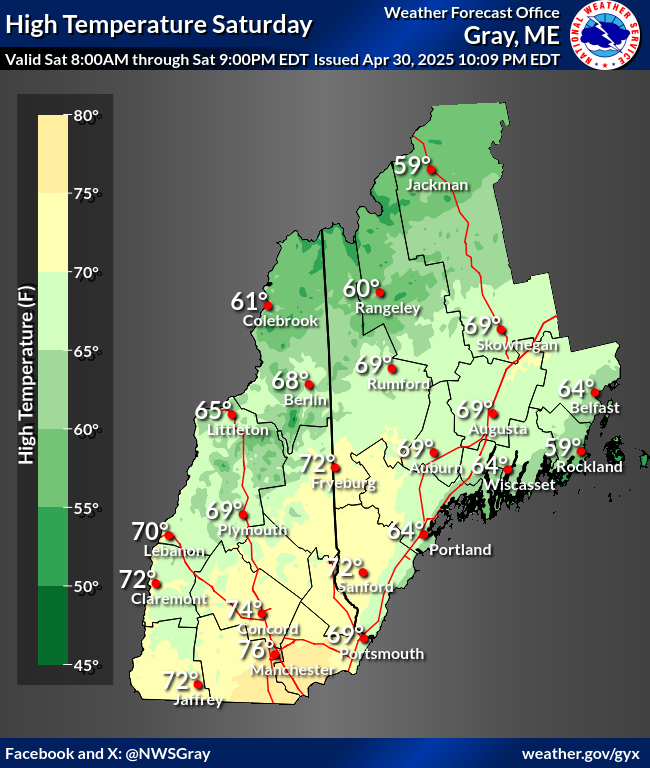 |
Day 3 Maximum TemperatureMap displays the maximum temperature for Day 3. Map gets updated every time the NWS in Gray produces a new grid. |
 |
WPC Day 4-7 Heat Index GuidanceMaps display long term heat index value forecasts from the NWS Weather Prediction Center. |
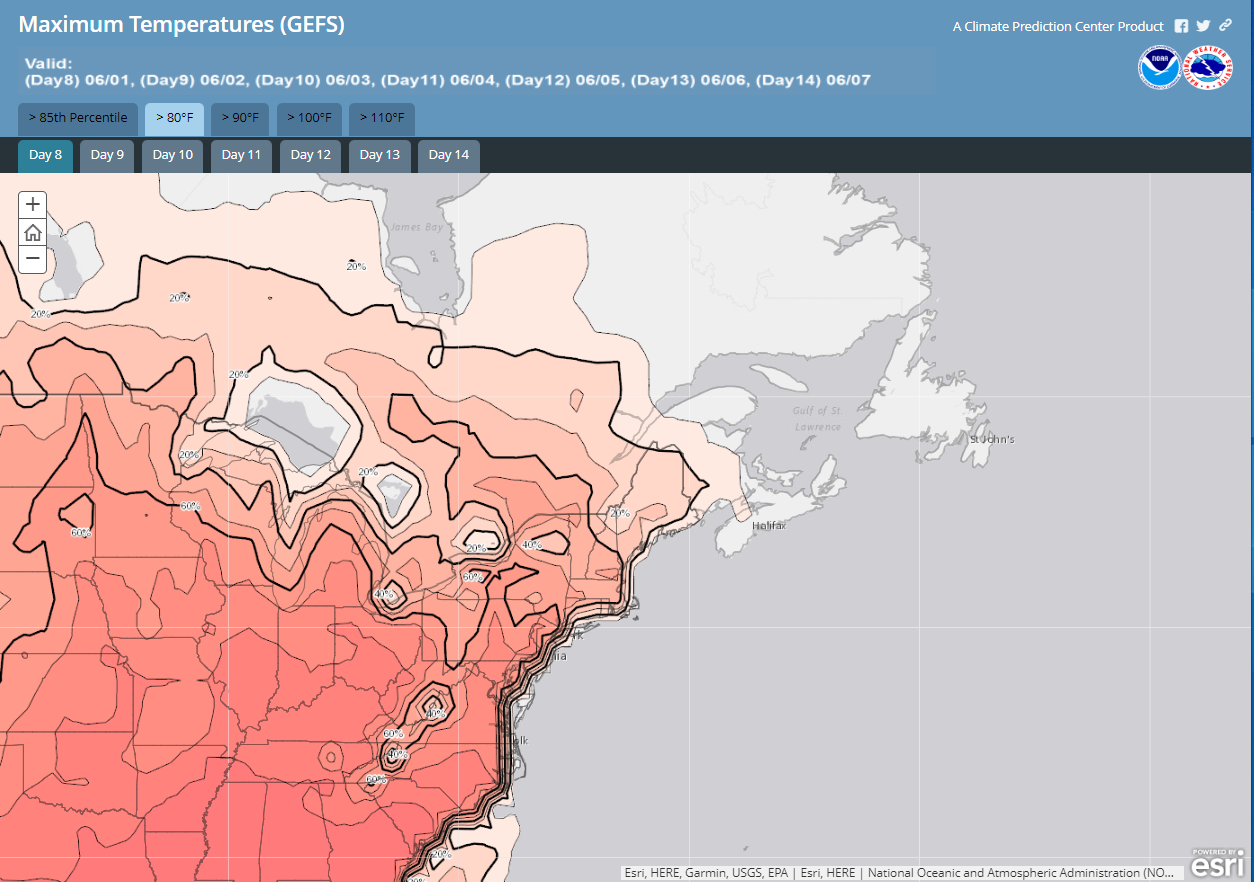 |
CPC Week 2 Extreme TemperatureDynamic graphics that provide daily probabilities of reaching certain extreme temperatures in the day 8-14 forecast period. |
 |
Climate Prediction Center Week 2 Heat HazardsRisk of Hazardous Temperatures during the week 2 forecast. |
 |
Digital Heat Index Forecast MapsInteractive map which displays the hour-by-hour heat index forecast for the entire forecast region. |
 |
Wet Bulb Global Temperature Day 1WBGT is a composite parameter that estimates the effect of temperature, humidity, wind chill, and solar radiation on humans. If you work or exercise in direct sunlight, WBGT is an effective means of assessing heat stress to persons involved in outdoor physical activity. |
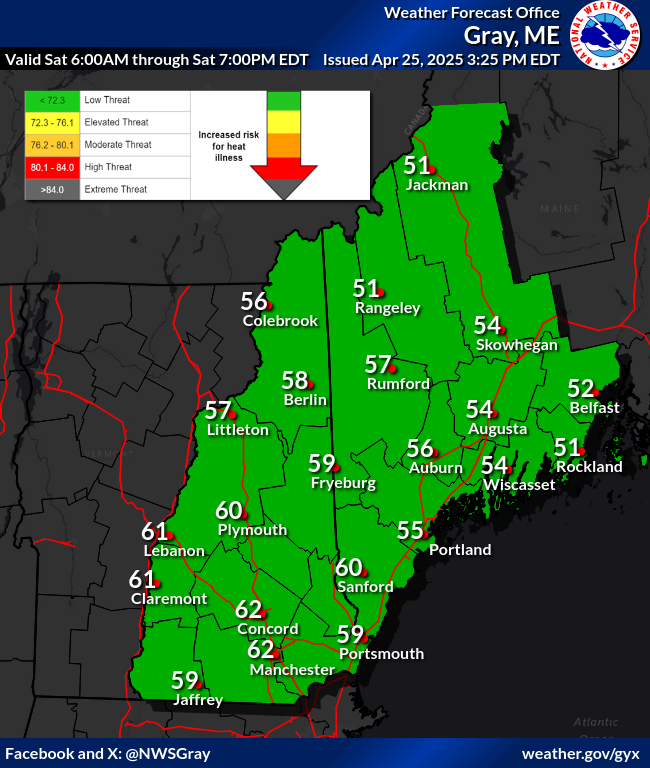 |
Wet Bulb Global Temperature Day 2WBGT is a composite parameter that estimates the effect of temperature, humidity, wind chill, and solar radiation on humans. If you work or exercise in direct sunlight, WBGT is an effective means of assessing heat stress to persons involved in outdoor physical activity. |
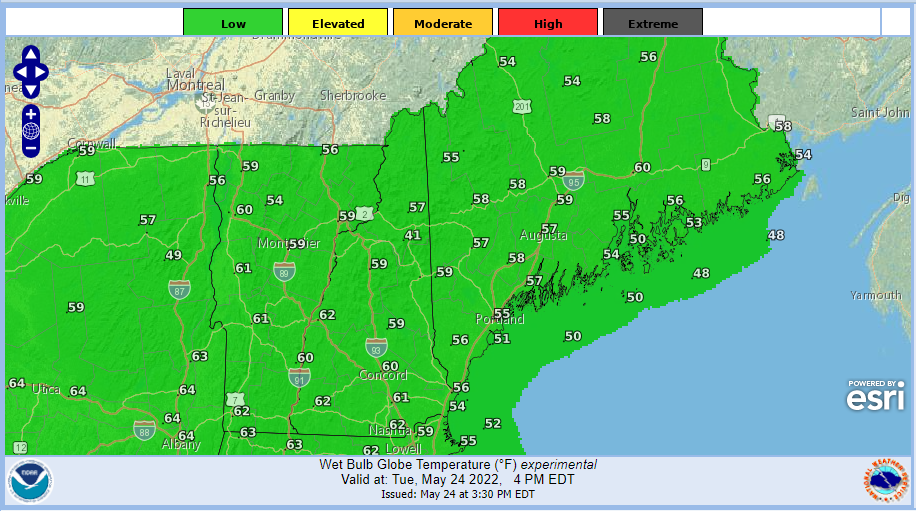 |
Web Bulb Globe TemperatureWBGT is a composite parameter that estimates the effect of temperature, humidity, wind chill, and solar radiation on humans. If you work or exercise in direct sunlight, WBGT is an effective means of assessing heat stress to persons involved in outdoor physical activity. |
 |
NIHHIS HeatNational Integrated Heat Health Information System dynamic website that displays current heat headlines, forecasts, future climate projections and additional heat tools. |
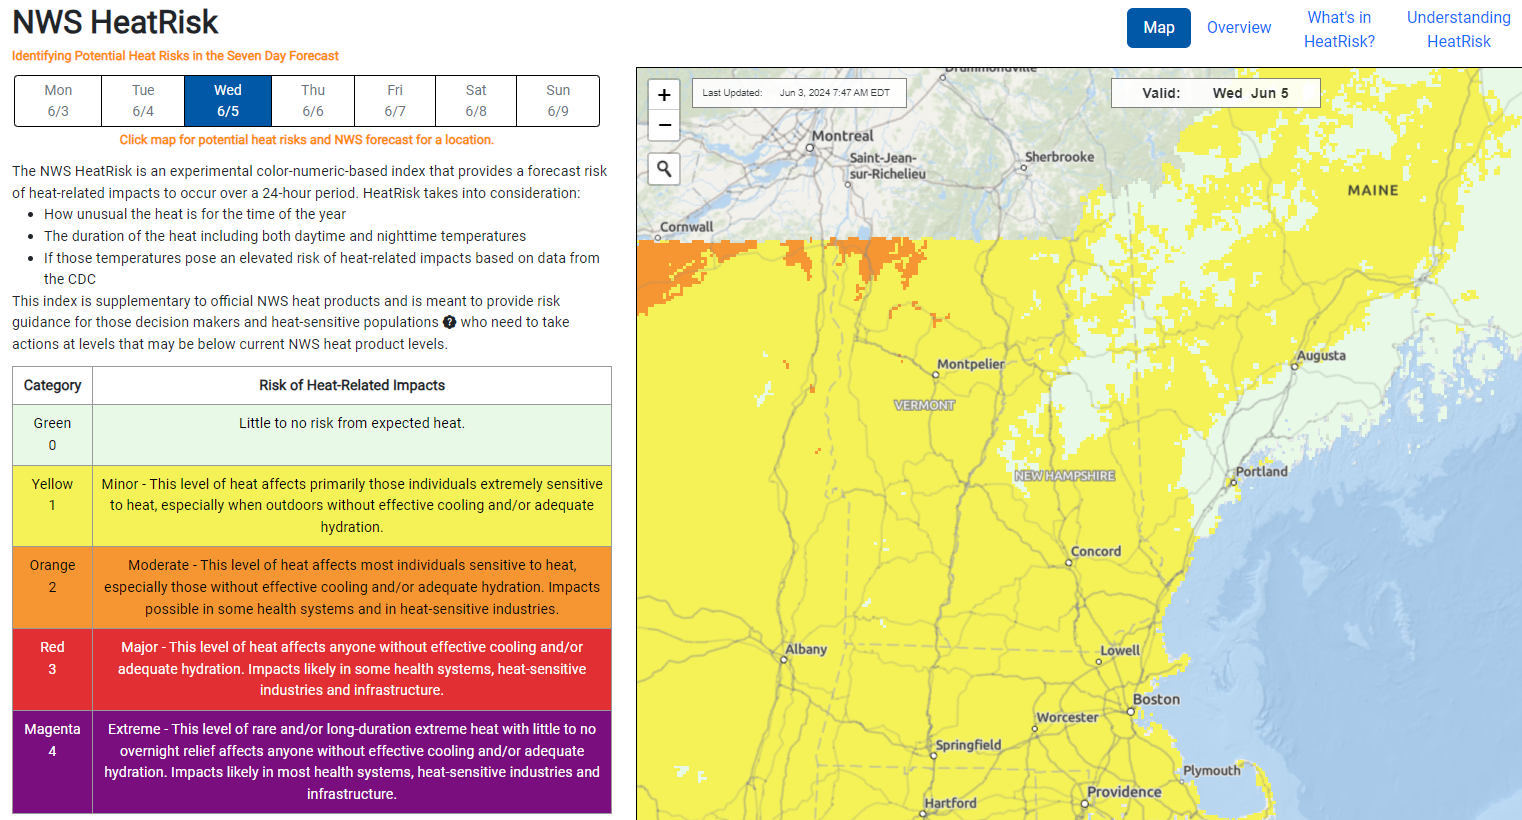 |
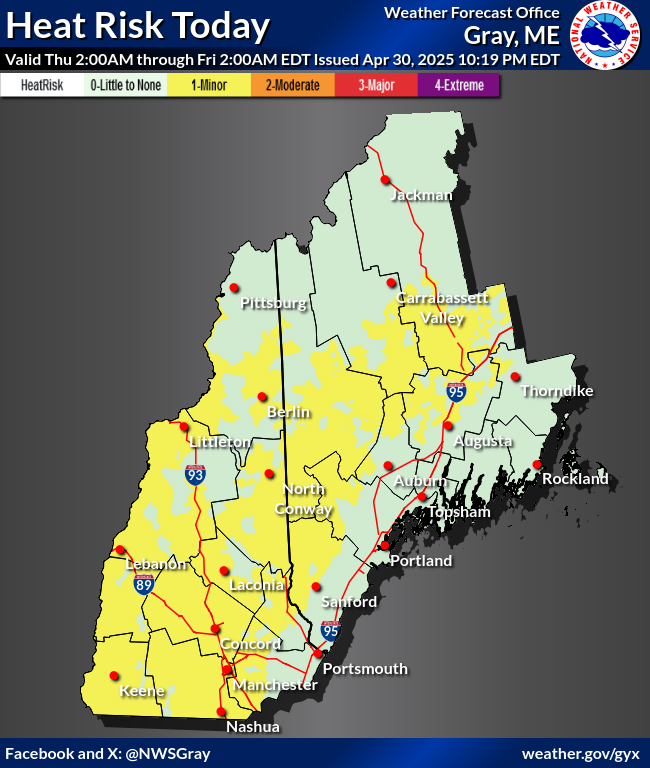
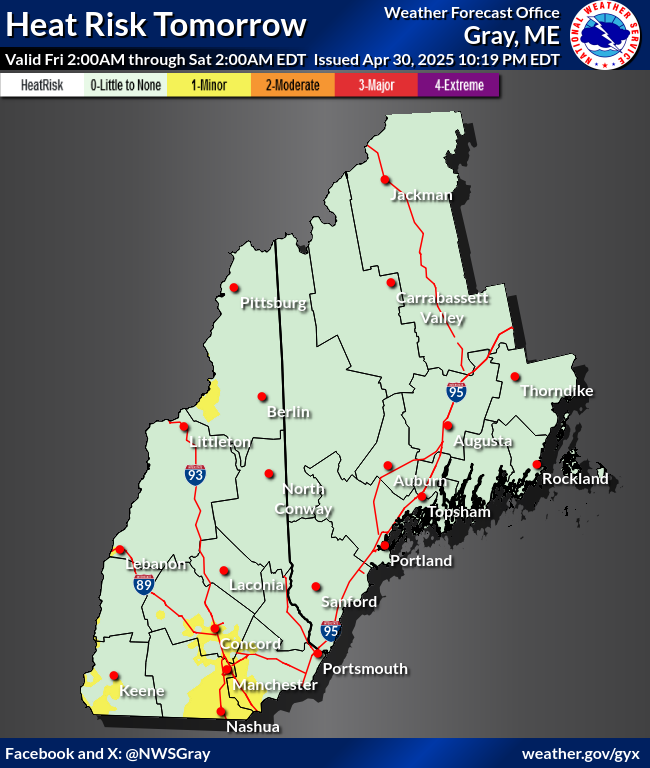
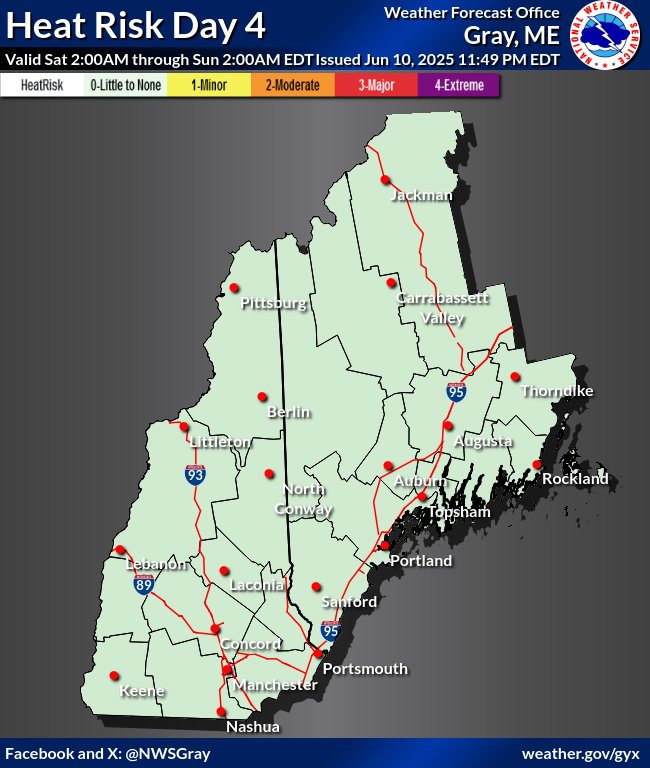
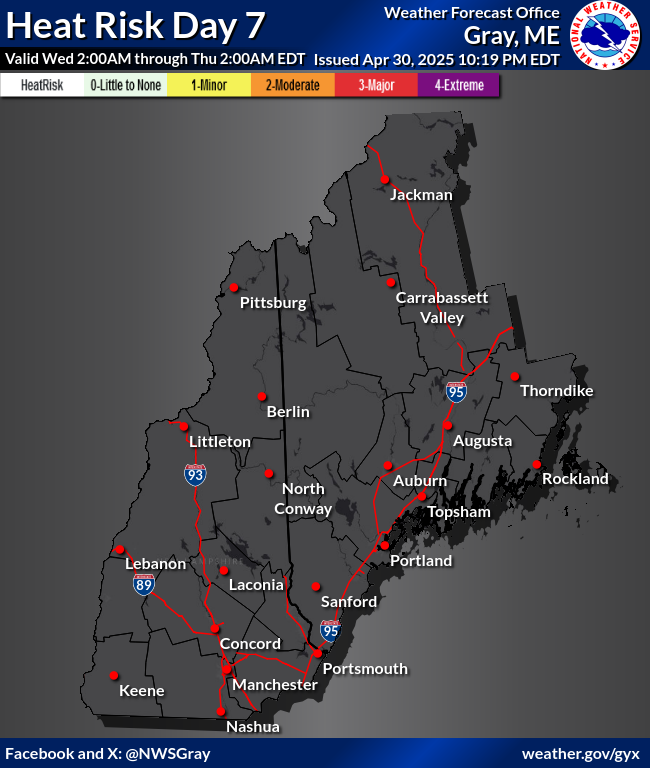
Heat Risk Digital MapsThe NWS HeatRisk is an experimental color-numeric-based index that provides a forecast risk of heat-related impacts to occur over a 24-hour period. |
|
Heat Risk Local GraphicsForecasts: TodayTomorrowDay 3Day 4Day 5Day 6Day 7 |
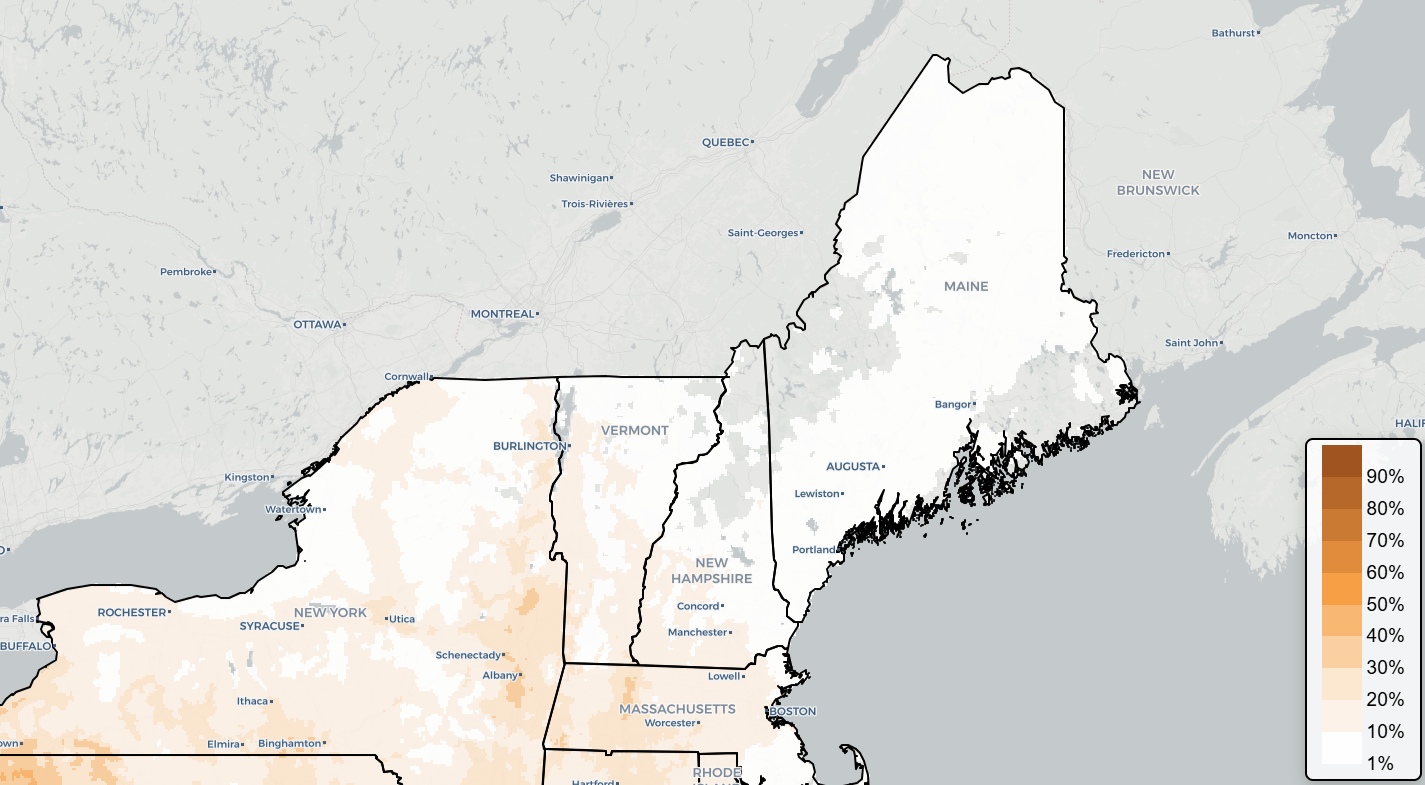 |
Probabilistic Heat RiskProbabilistic HeatRisk is based on the NWS HeatRisk framework. This is a tool that provides a forecast risk of heat-related impacts using a five-tier scale. |
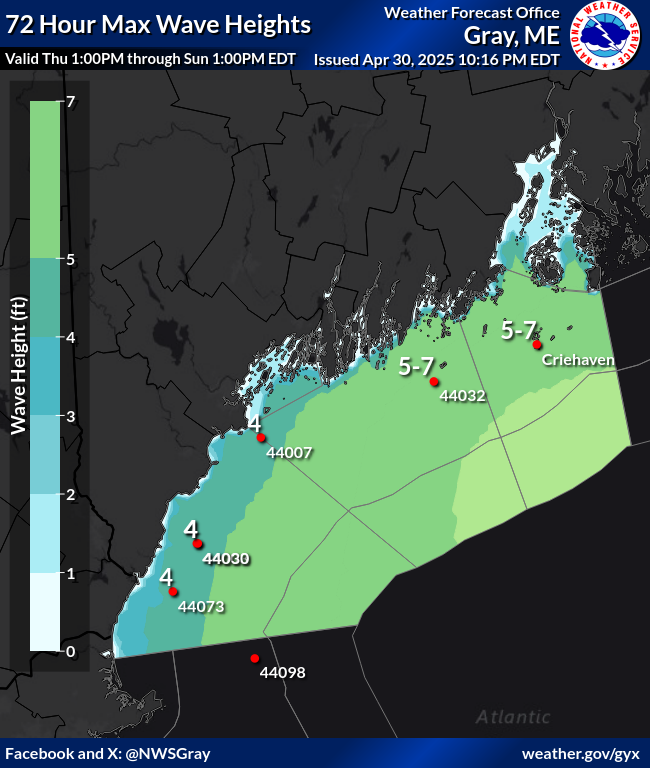 |
3 Day Max Wave Height for southern Maine and New HampshireMap displays 3-Day Maximum Wave Height. Map is updated every time the forecaster issues a new forecast. |
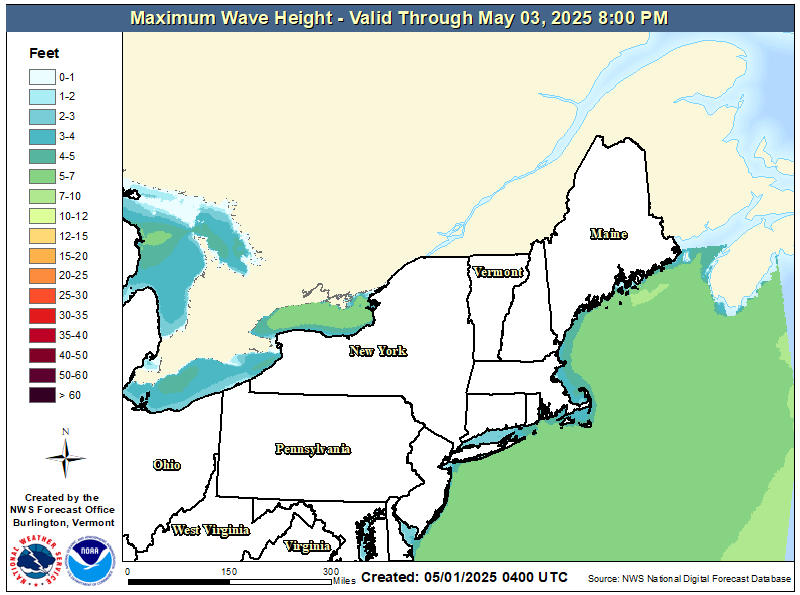 |
Maximum Wave Height for NortheastMap displays 3-Day Maximum Wave Height for the entire Northeast United States. Map is updated every time the forecaster issues a new forecast. |
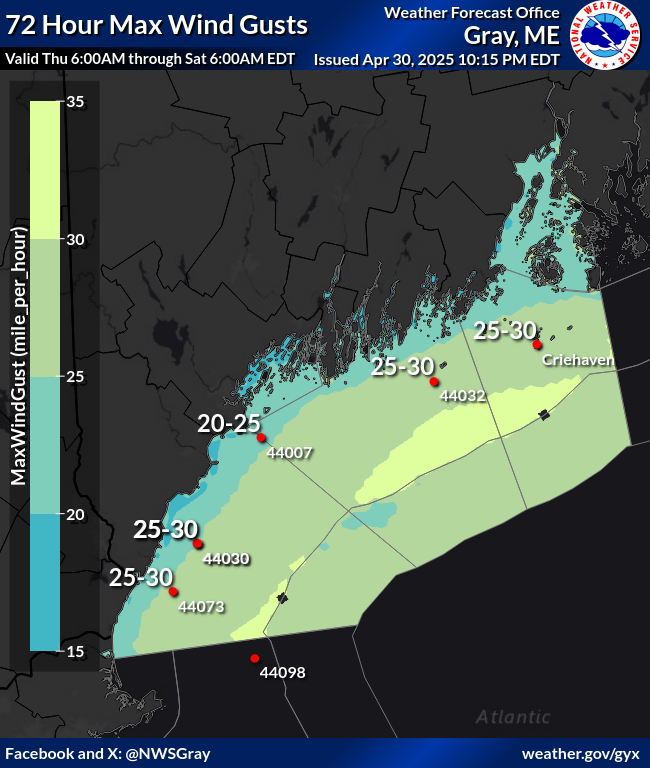 |
Maximum Wind GustMap displays 3-Day Maximum Wind Gust for southern Maine and New Hampshire. Map is updated every time the forecaster issues a new forecast. |
||
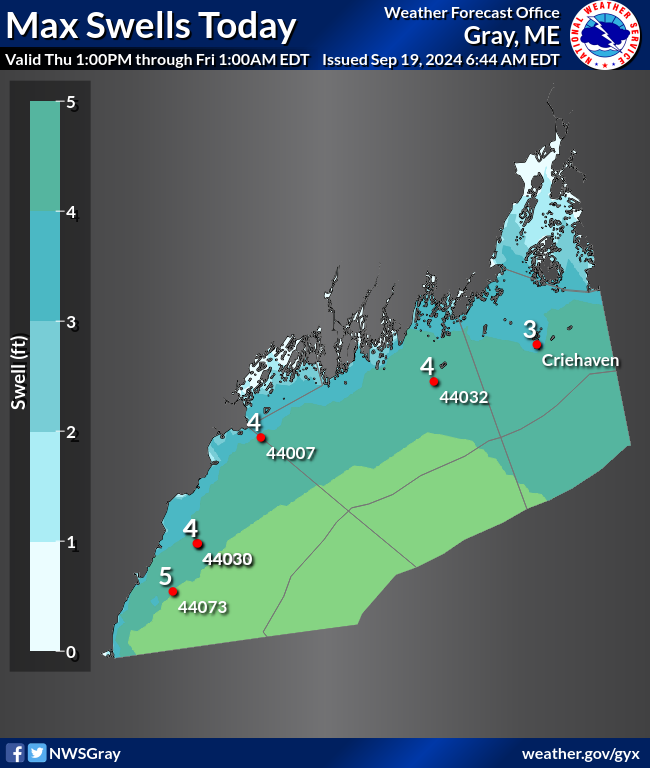 |
Maximum Swells TodayMap displays today's maximum swell. Map is updated every time the forecaster issues a new forecast. |
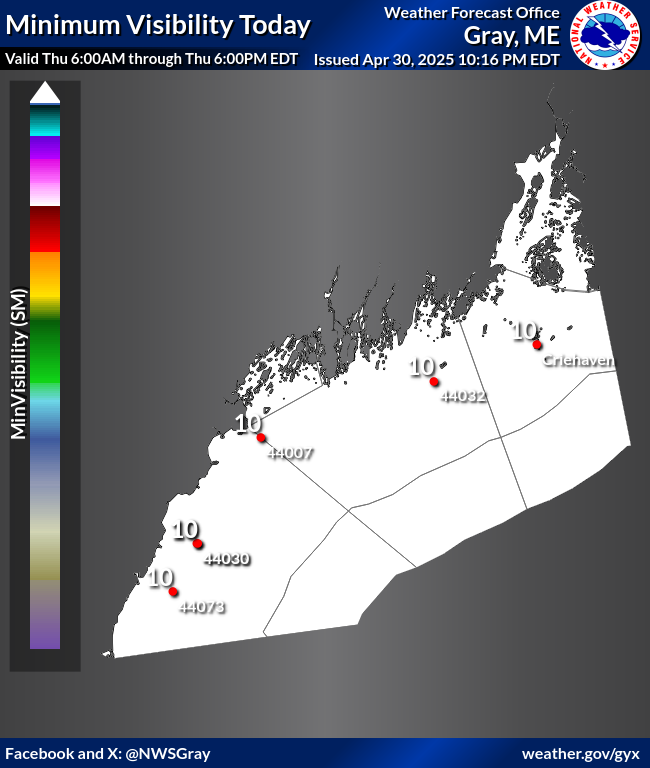 |
Minimum Visibility TodayMap displays minimum visibility today. Map is updated every time the forecaster issues a new forecast. |
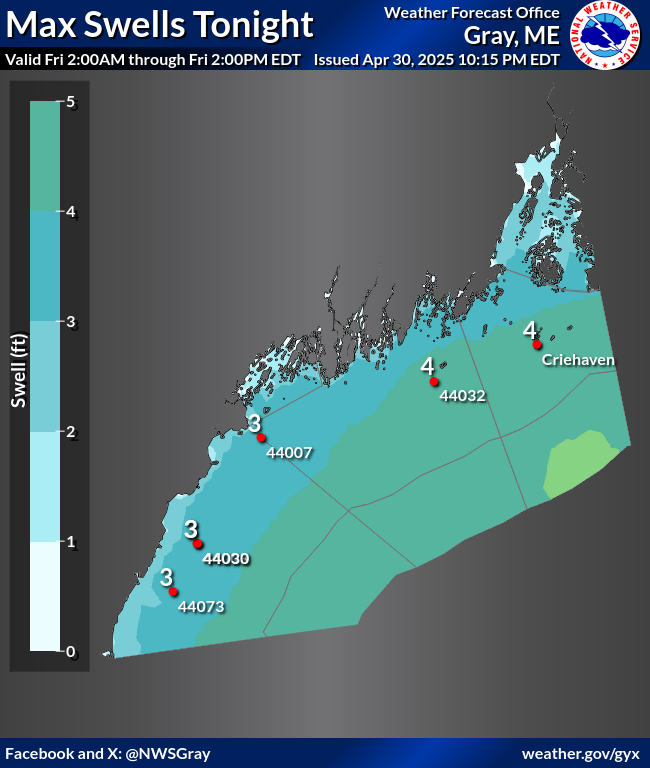 |
Maximum Swells TonightMap displays tonight's maximum swell. Map is updated every time the forecaster issues a new forecast. |
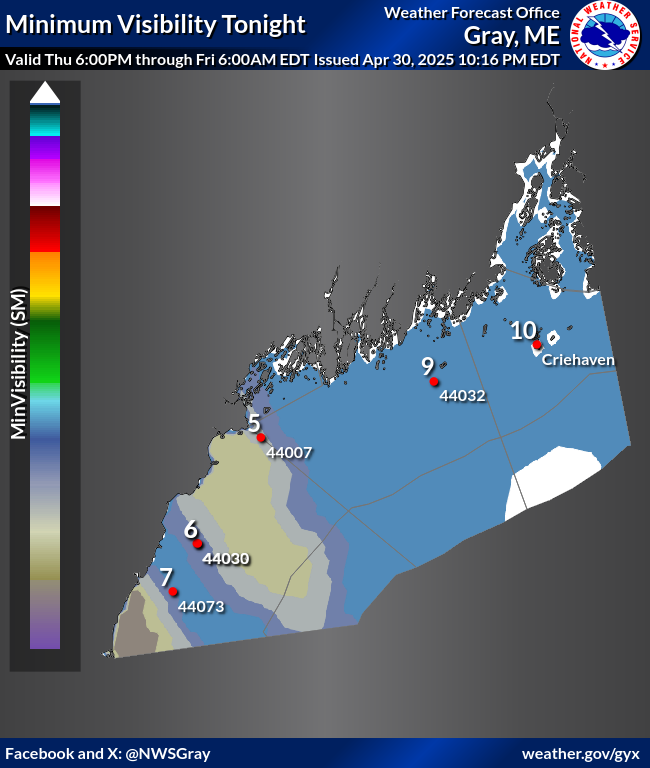 |
Minimum Visibility TonightMap displays minimum visibility tonight. Map is updated every time the forecaster issues a new forecast. |
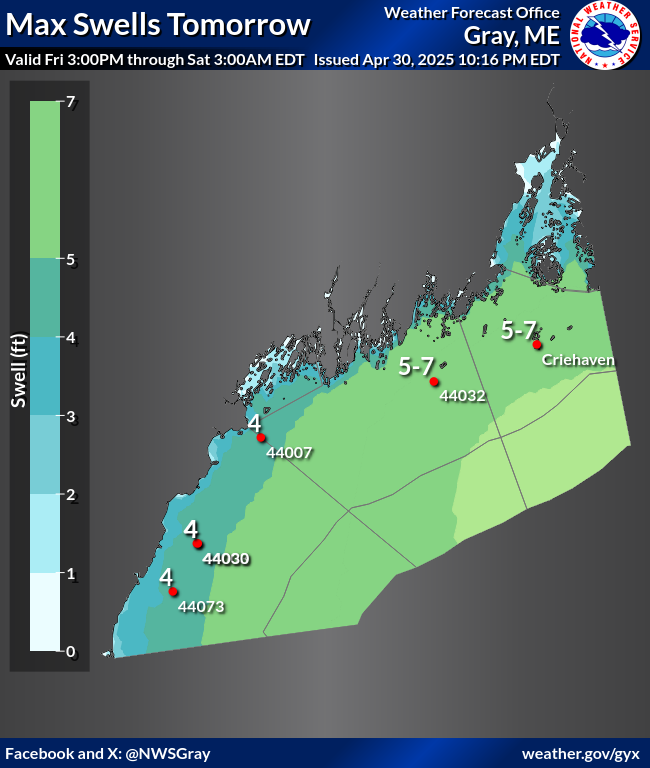 |
Maximum Swells TomorrowMap displays tomorrow's maximum swell. Map is updated every time the forecaster issues a new forecast. |
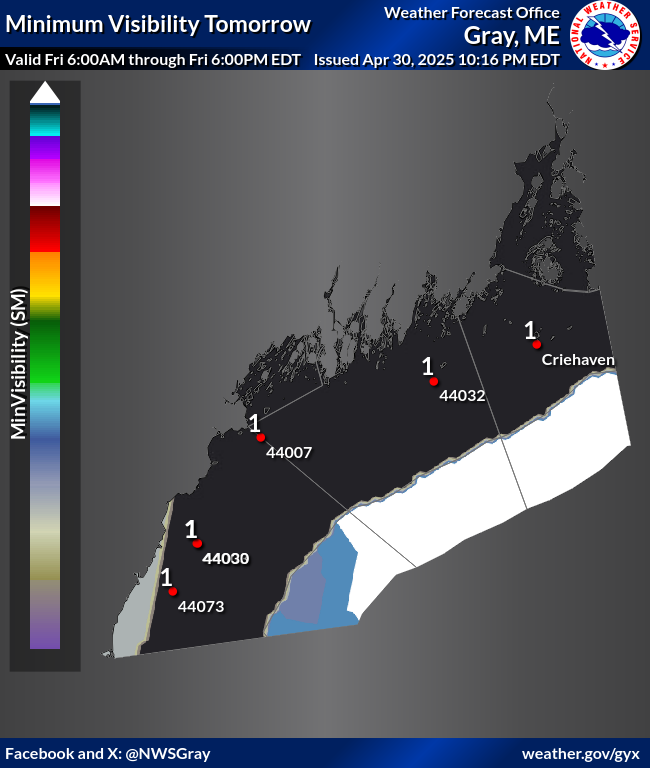 |
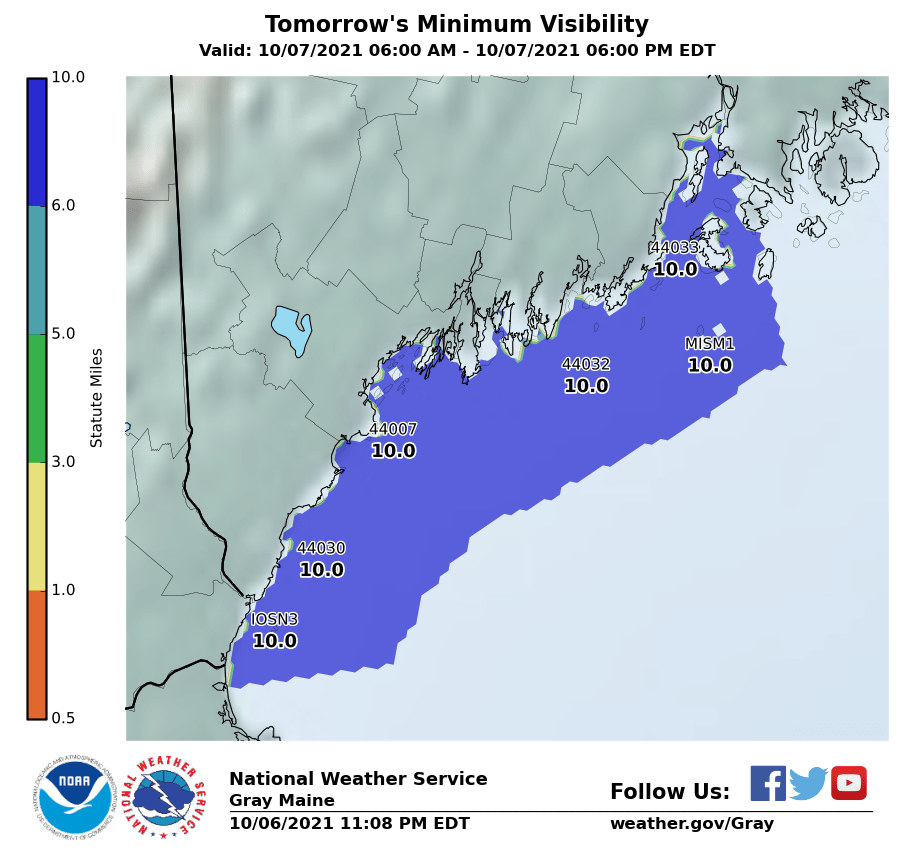
Minimum Visibility TomorrowMap displays minimum visibility tomorrow. Map is updated every time the forecaster issues a new forecast.
|
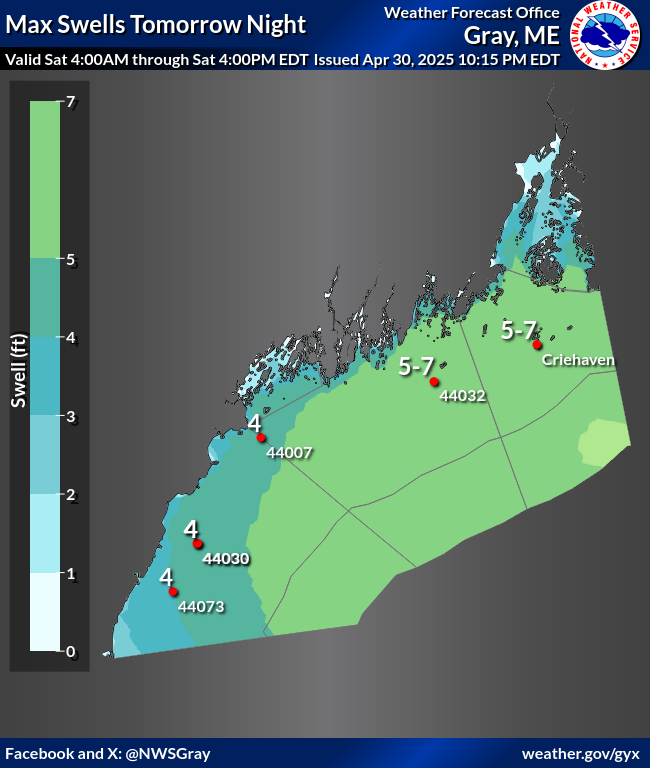 |
Maximum Swells Tomorrow NightMap displays tomorrow night's maximum swell. Map is updated every time the forecaster issues a new forecast. |
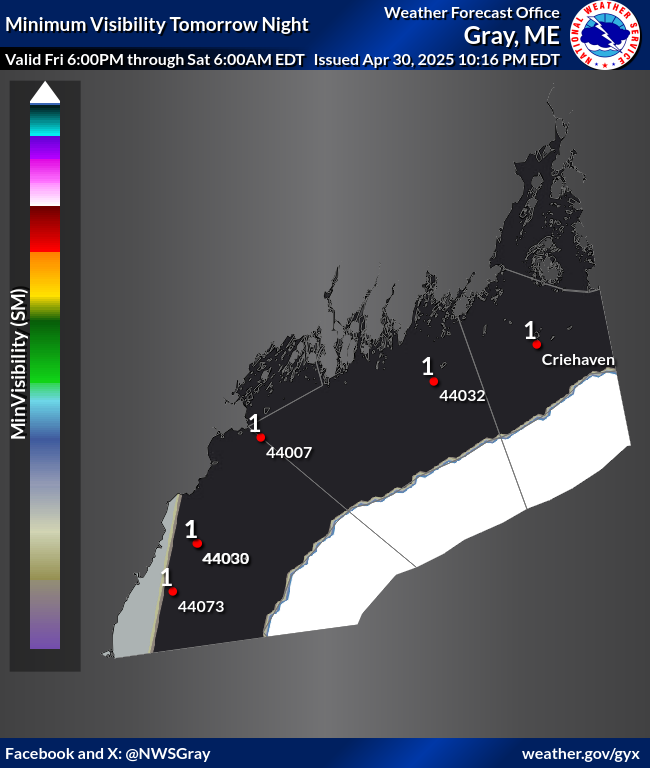 |
Minimum Visibility Tomorrow NightMap displays minimum visibility tomorrow night. Map is updated every time the forecaster issues a new forecast.
|
Local Winter/Spring Flood Outlook Product (ESF)
|
|||
|
|
River Forecast PointsMap displays river points in Maine and New Hampshire. Just click on the point where you want a forecast. Map is updated every time a new observation or forecast is generated. |
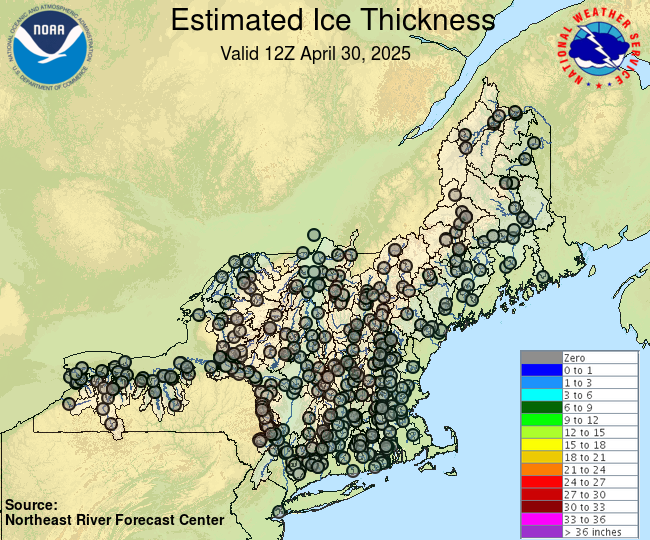 |
Latest Estimated River Ice thicknessCurrent estimated river ice thickness from Northeast River Forecast Center |
|
|
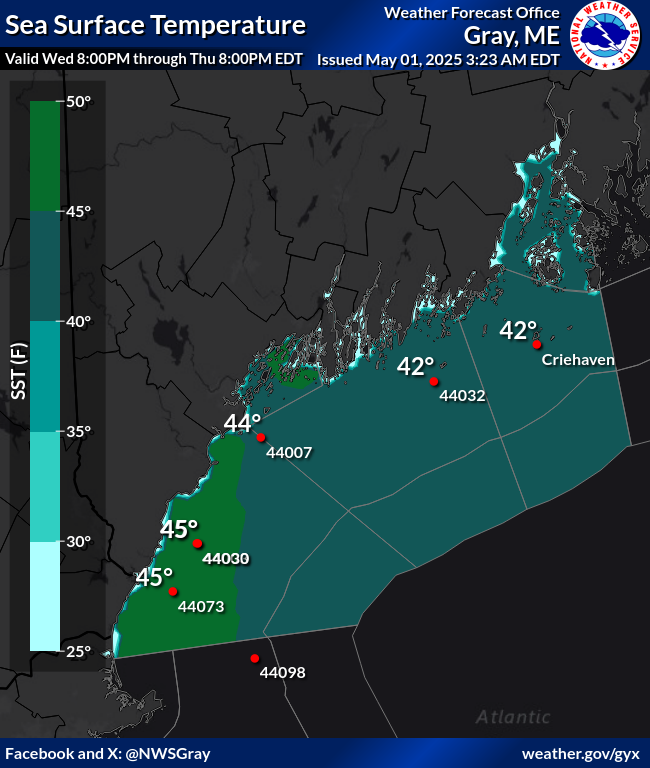
Sea Surface TemperatureObserved SST from satellite and buoy observations.
|
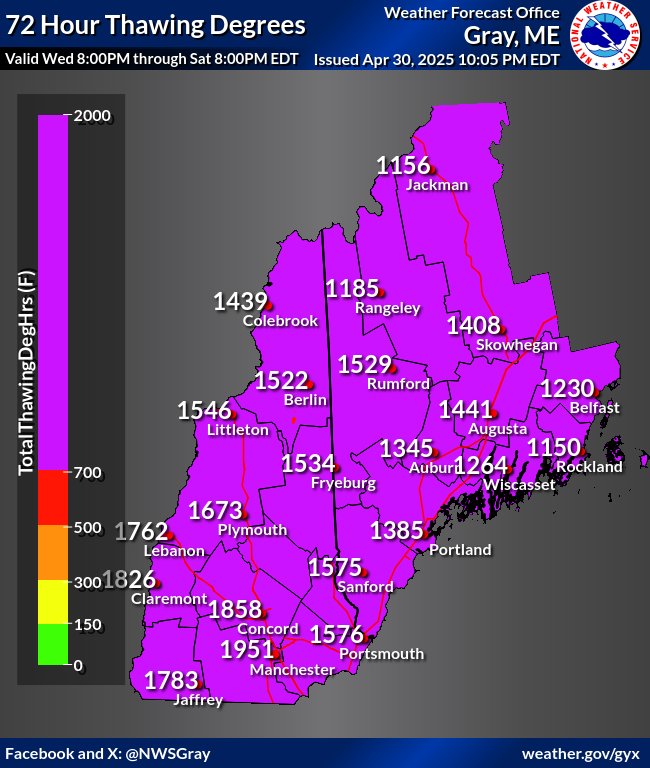 |
72 hour Thawing degree hoursShows next 72 hours of Total Thawing degree hours. |
 |
Day 1 Maximum TemperatureMap displays the maximum temperature for day one. Map gets updated every time the NWS in Gray produces a new forecast. |
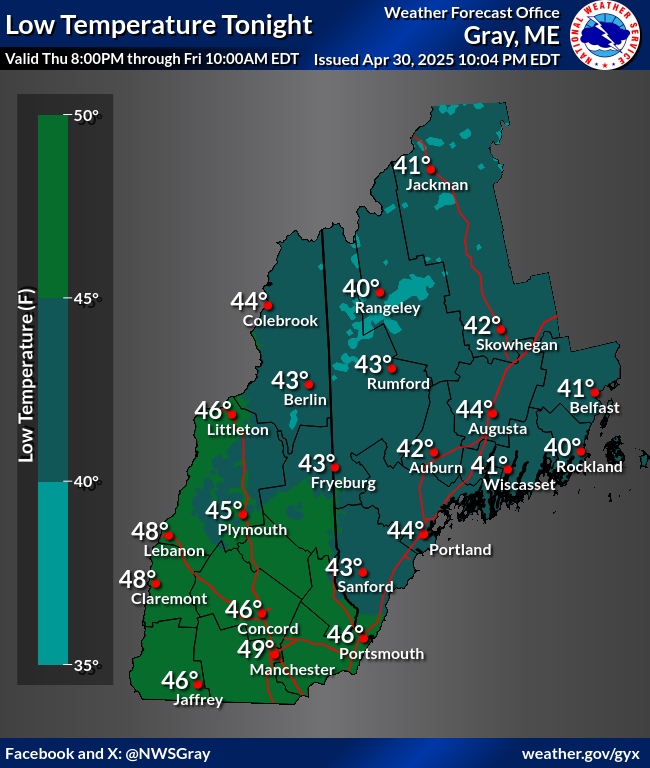 |
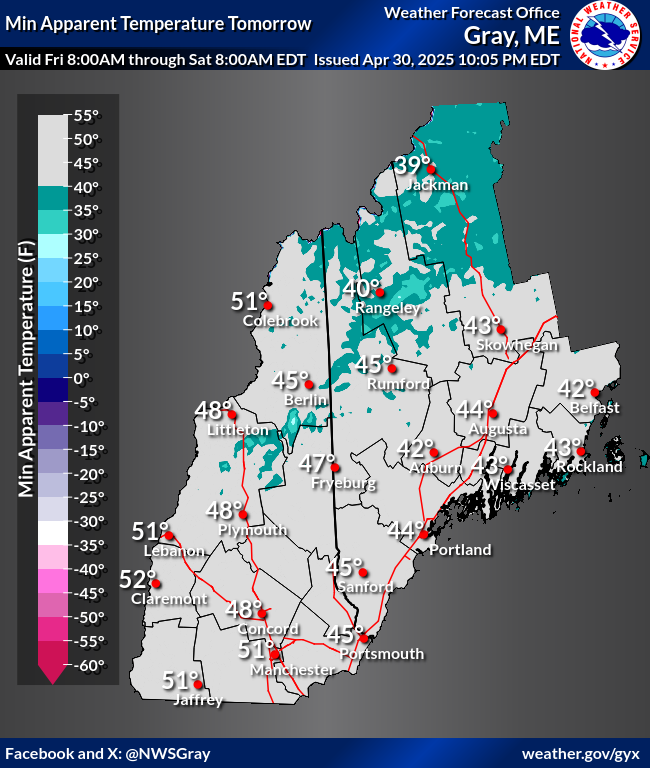
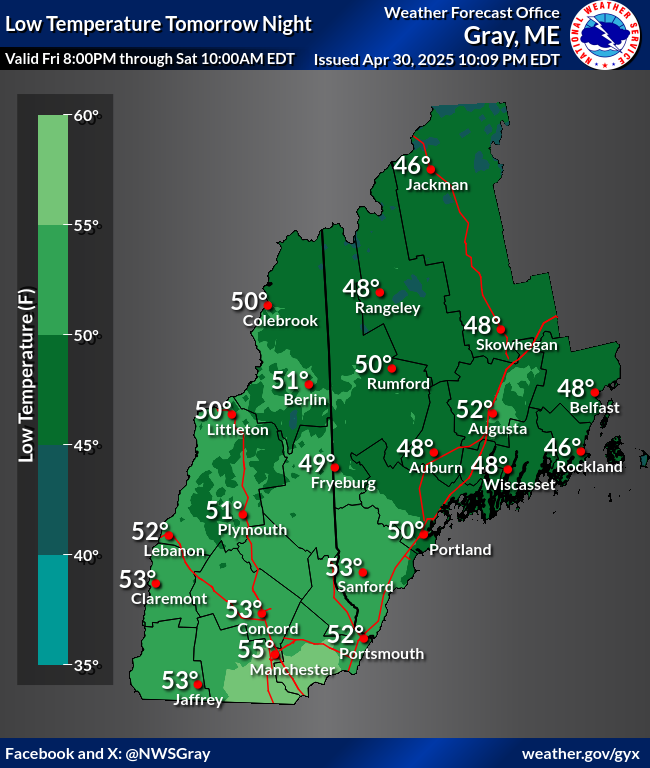
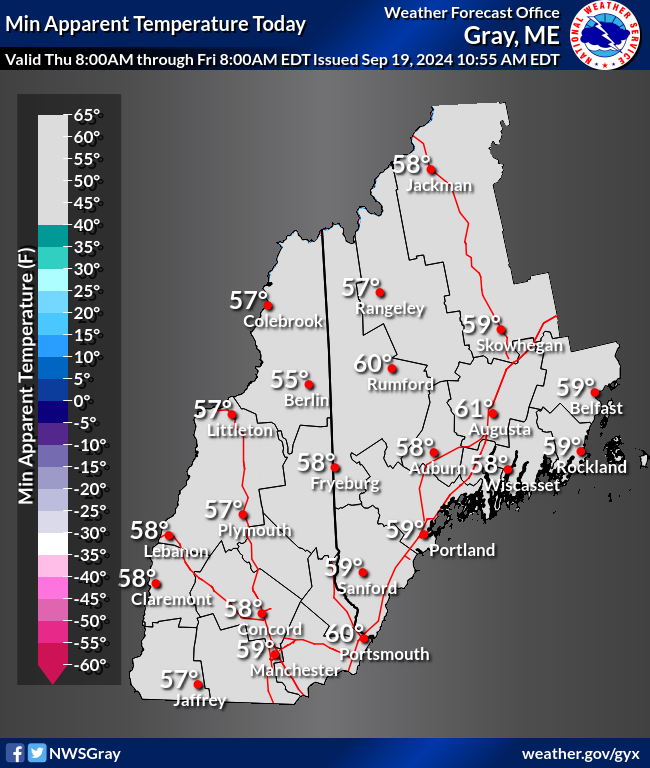
Minimum Temperature Day 1Shows forecasted minimum temperature for the first day of the forecast period. |
 |
Day 2 Maximum TemperatureMap displays the maximum temperature for day two. Map gets updated every time the NWS in Gray produces a new forecast.
|
|
Minimum Temperature Day 2Shows forecasted minimum temperature for the second day of the forecast. |
 |
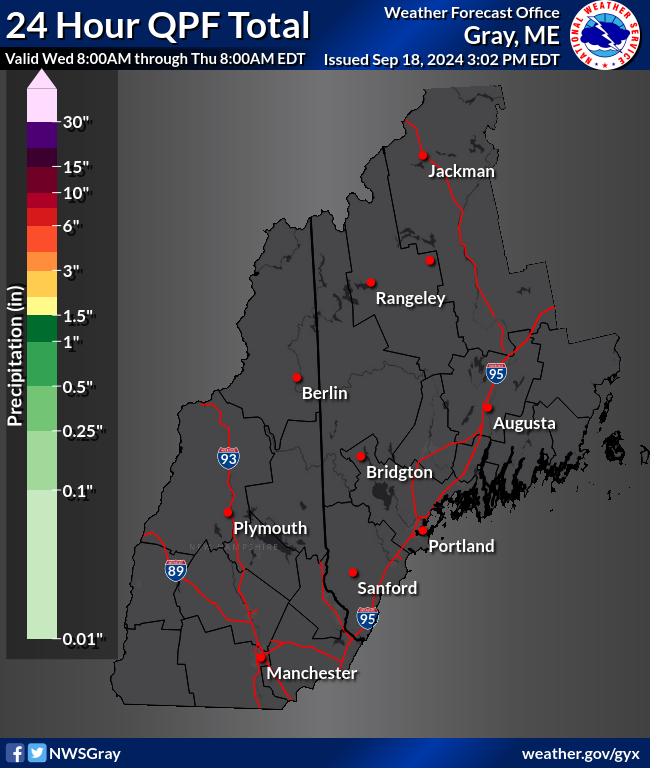
24 Hour Total Precipitation ForecastShows forecasted precipitation for the first day of the forecast. |
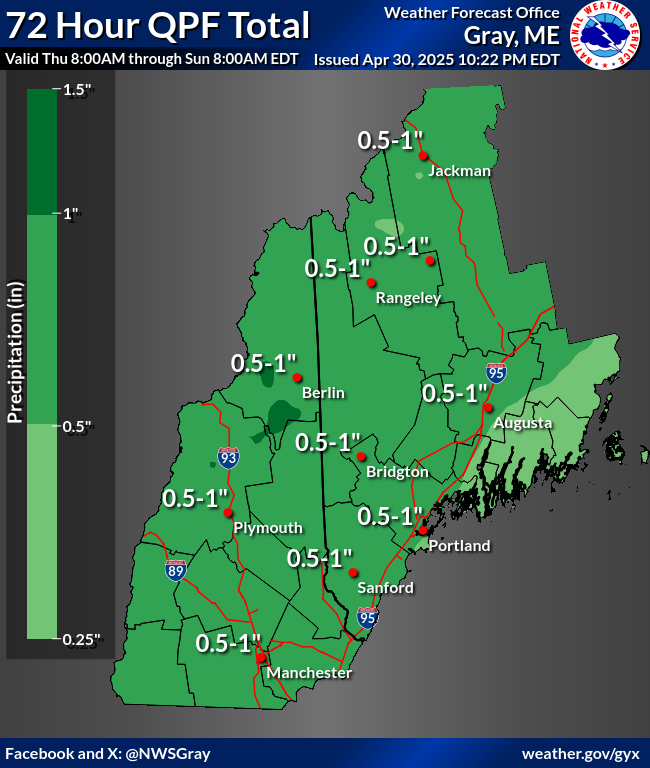 |
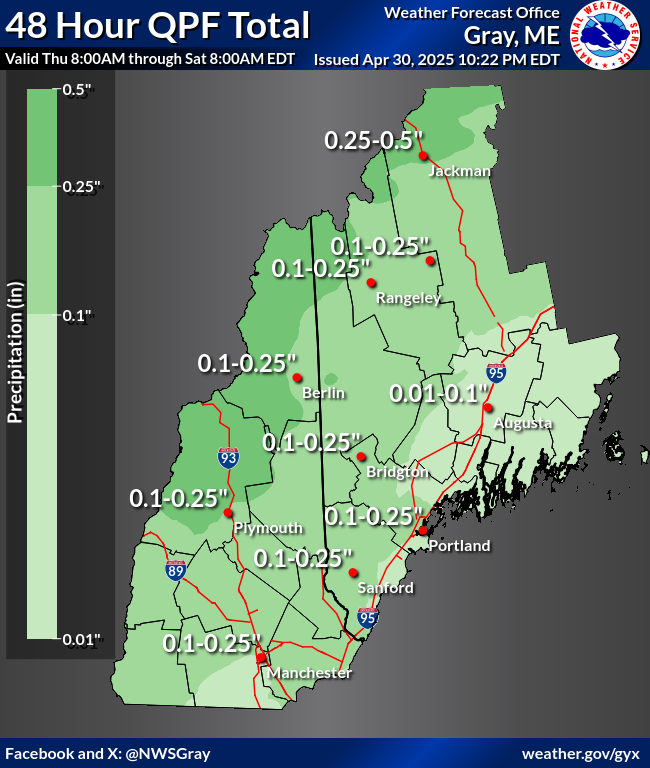
3 Day Total Precipitation ForecastShows forecasted precipitation for the first three days of the forecast. |
|
|
Snowpack TemperatureSnowpack Temperature analysis informs you how close the snowpack is to the freezing point. Once the snowpack approaches freezing (red) it is melting. |
Snow DensitySnow density analysis informs you how dense the snow is and can be used to help determine how "ripe" the snowpack is to melt. Typically > 40 is a "ripe" snowpack. |
|
|
|
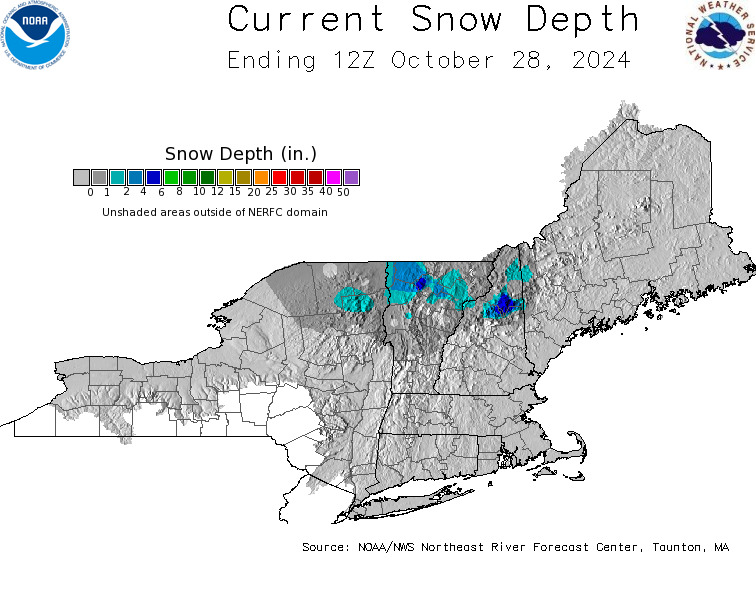
Current Snow DepthShows current analysis of the snow depth in inches. |
Snow Water EquivalentSnow Water Equivalent analysis in inches of water. How many inches of water our stored in the snowpack. |
|
 |
Northeast River Forecast Center Snow
|
Maine Cooperative Snow SurveyManual survey measurements taken by numerous agencies across the state. Maps are updated monthly from January through February and weekly March through April. |
|
 |
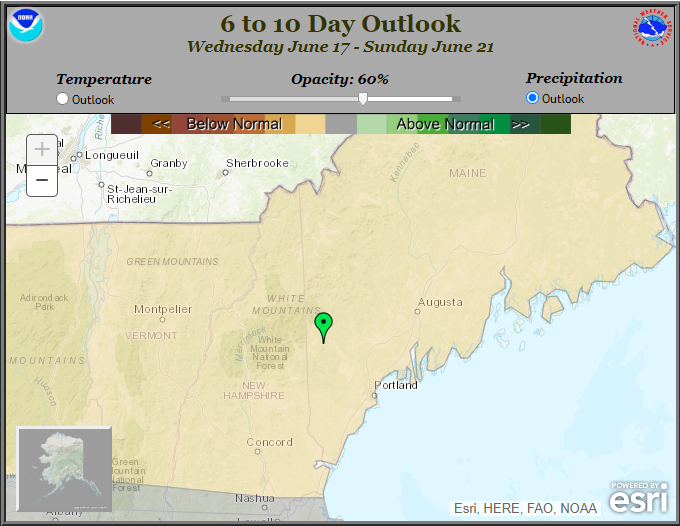
CPC 6 to 10 Day OutlookPrecipitation and Temperature probabilities compared to normal. |
|
CPC 8 to 14 Day OutlookPrecipitation and Temperature probabilities compared to normal. |
|
|
RadarWSR-88D Doppler Radar Gray | Boston | Burlington | Albany Northeast SectorNationwide
|
 |
Storm Prediction Center Overview Graphic / MapRadar of the contiguous United States with Storm Prediction Center (SPC) products - Day 1. |
Convection OutlooksConvective outlook for organized severe thunderstorms over the contiguous United States. |
 |
Current WatchesGraphic showing any severe thunderstorm and tornado watches which are in effect over the contiguous United States.
|
Surface AnalysisThe Weather Prediction Center (WPC) produces surface maps which depicts the analysis of highs, lows, fronts, troughs, outflow boundaries, squall lines, and drylines. |
 |
Mesoscale DiscussionsDescribe what is currently happening, what is expected in the next few hours, the meteorological reasoning for the forecast, and when / where SPC plans to issue the watch. |
LSR PlotterThese reports are preliminary and are plotted and listed "as is" from NWS Local Storm Reports usually sent in realtime.
|
Storm ReportsThese reports are preliminary and are plotted and listed "as is" from NWS Local Storm Reports usually sent in realtime. |
 |
Forecast ToolsIncluding upper air maps, upper air soundings, mesoanalysis graphics, Short-Range Ensemble Forecast (SREF), Storm-Scale Ensemble of Opportunity (SSEO) and Compmap. |
 |
Mesoscale AnalysisNine fixed regional sectors and a national sector provide hourly gridded mesoanalysis graphics across the CONUS. |
 |
Upper Air SoundingsSkew-T charts for all observed soundings across the United States. An archive of seven days of data is available. |
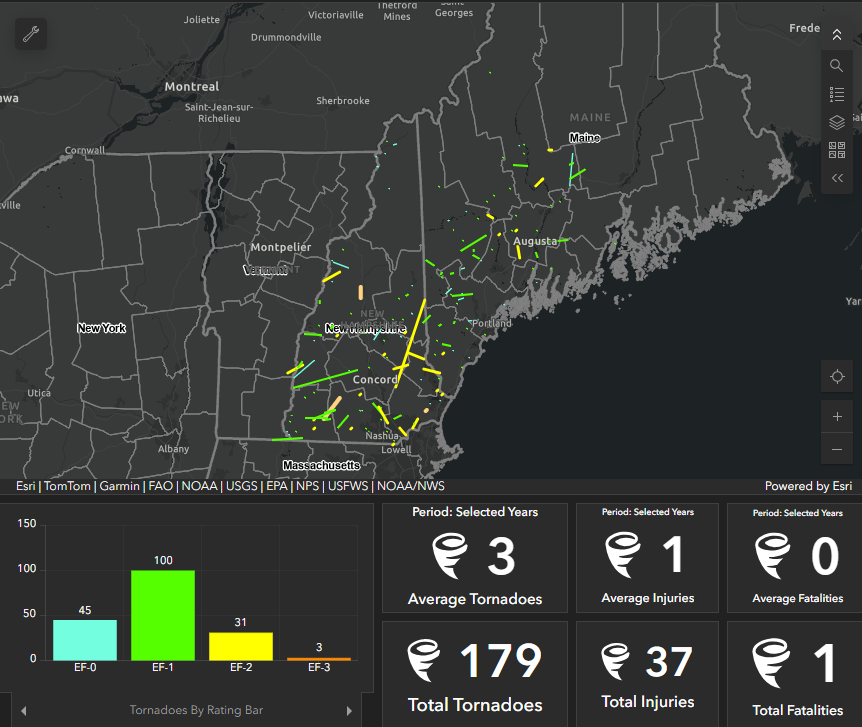 |
National Severe Weather ArchiveA web-based GIS application that geographically displays the Storm Prediction Center’s (SPC) severe storm report database on a map. The severe storm report database includes tornado, hail, and wind reports gathered from every local NWS WFO across the CONUS. |
|
|
Gray Maine Tropical PageContains virtually all relevant information on tropical storms that may affect southern Maine and New Hampshire. |

|
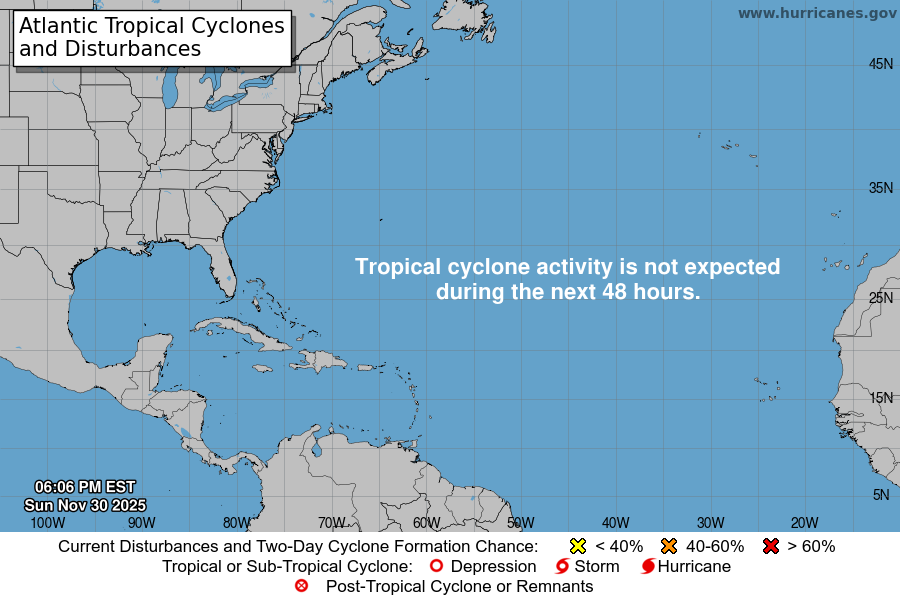
Graphical Tropical Weather OutlookHighlights the location of areas of disturbed weather and shows the 48 hour probabilistic genesis potential. |
|
|
Tropical Cyclone ClimatologyThe official hurricane season for the Atlantic Basin (the Atlantic Ocean, the Caribbean Sea, and the Gulf of America) is from June 1st to November 30th. |
 |
Tropical Atlantic Satellite Imagery
|
|
|
Storm SurgeAlong the coast, storm surge is often the greatest threat to life and property from a hurricane. The size of a storm surge for a particular location depends on a number of factors. Storm surge is very sensitive to the shape of the coast, and to changes in storm track, intensity, forward speed, and size. Tidal height at the time of maximum storm surge is an important factor. |
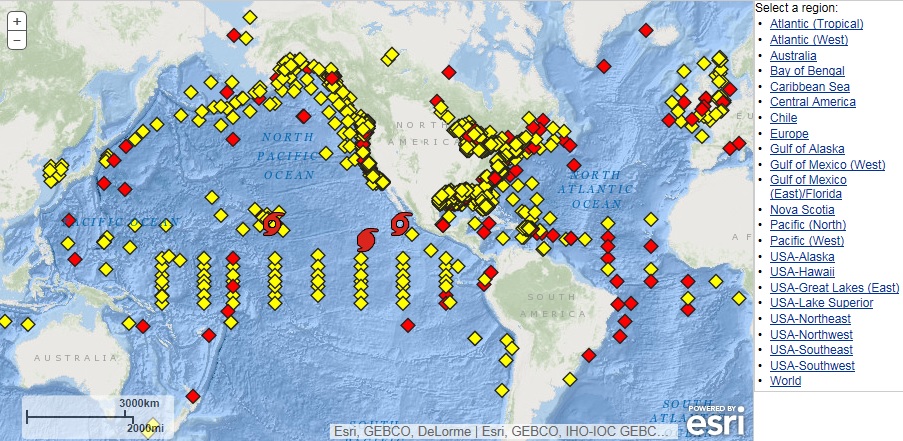 |
National Data Buoy CenterNDBC provides hourly observations from a network of about 90 buoys and 60 Coastal Marine Automated Network stations. All stations measure wind (speed/direction/gust) and barometric pressure and air temperature. |
|
Saffir-Simpson Hurricane Wind Scale
Category 1 to 5 rating based on a hurricane's sustained wind speed. |
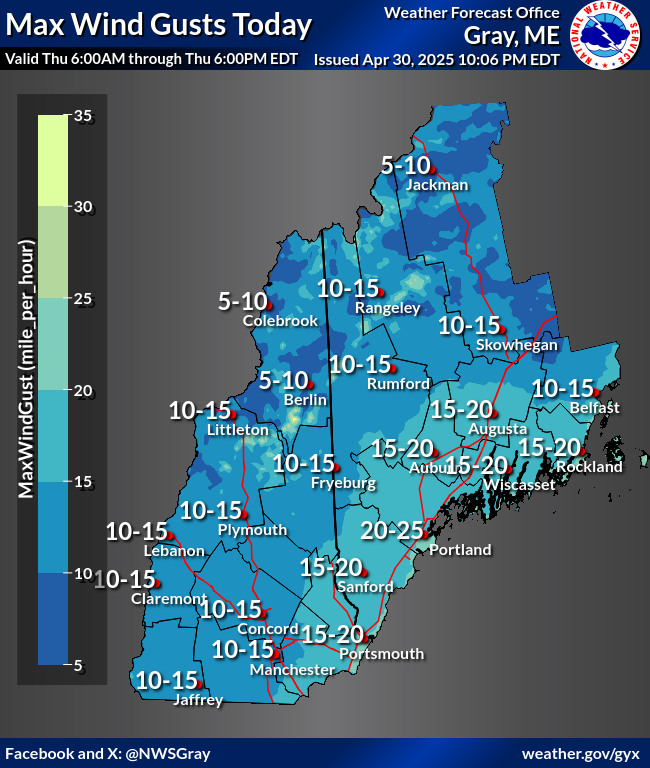 |
Today's Maximum Wind GustsMap displays today's maximum wind gusts as measure in mph. Map gets updated every time the NWS in Gray produces a new grid. |
|
Tonight's Maximum Wind GustsMap displays today's maximum wind gusts as measure in mph. Map gets updated every time the NWS in Gray produces a new grid. |
 |
Tomorrow's Maximum Wind GustsMap displays tomorrow's maximum wind gusts as measure in mph. Map gets updated every time the NWS in Gray produces a new grid. |
|
Tomorrow Night's Maximum Wind GustsMap displays tomorrow's maximum wind gusts as measure in mph. Map gets updated every time the NWS in Gray produces a new grid. |
|
|
Storm Total Snow and Probabilistic Snowfall ForecastsShows current Snow forecast and probabilities. The time is variable as it pertains to each specific storm. |
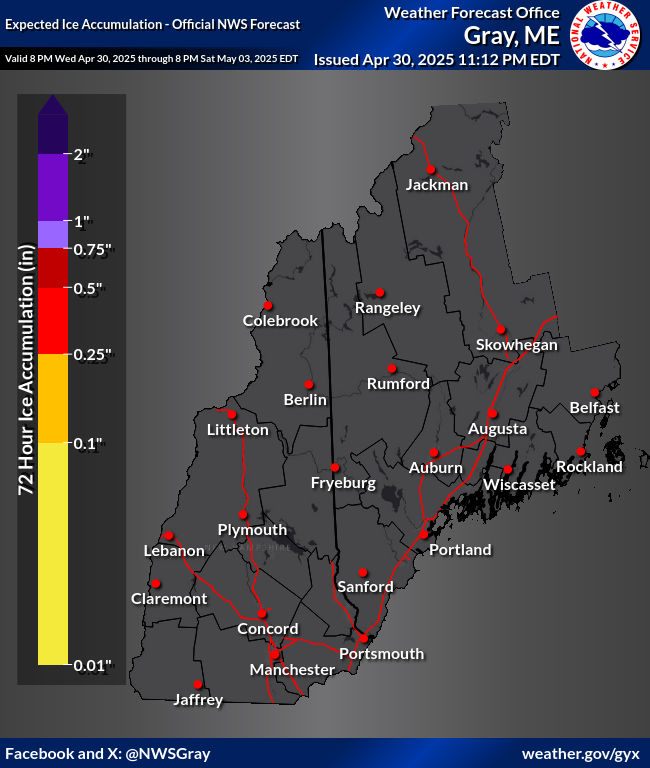 |
Storm Total Ice ForecastShows current Storm Total Snow forecast. The time is variable as it pertains to each specific storm. |
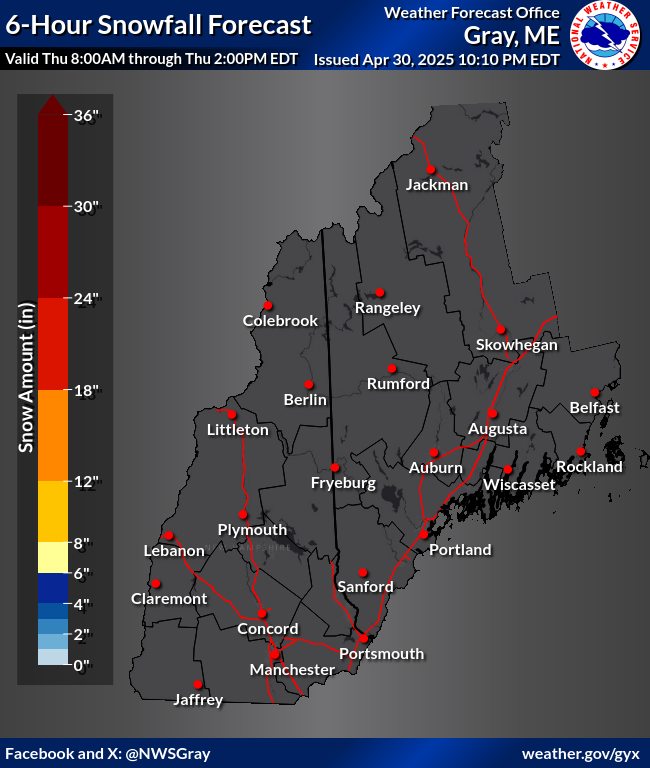 |
Cumulative SnowfallShows forecasted snowfall accumulations on a cumulative timescale over 72 hours. |
|
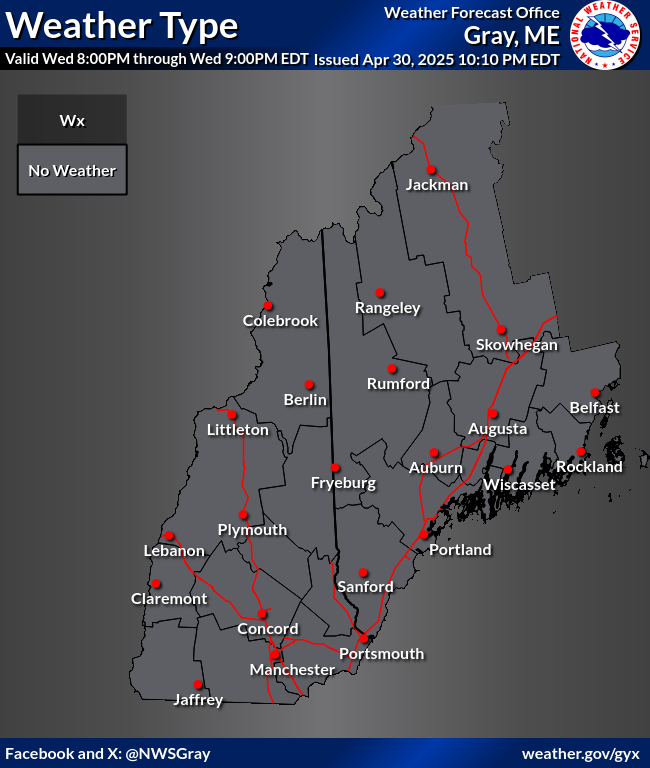
Weather Type ForecastsDisplays forecasted precipitation types over the next 72 hours. |
|
24 Hour Total Precipitation ForecastShows forecasted precipitation for the first day of the forecast. |
|
3 Day Total Precipitation ForecastShows forecasted precipitation for the first three days of the forecast. |
|
Day 1 Maximum TemperatureMap displays the maximum temperature for day one. Map gets updated every time the NWS in Gray produces a new grid. |
|
Minimum Temperature Day 1Shows forecasted minimum temperature for the first day of the forecast. |
|
Day 2 Maximum TemperatureMap displays the maximum temperature for day two. Map gets updated every time the NWS in Gray produces a new grid.
|
|
Minimum Temperature Day 2Shows forecasted minimum temperature for the second day of the forecast. |
|
|
Day 1 Minimum Wind Chill TemperatureShows forecasted minimum wind chill temperatures for the first day of the forecast period. |
 |
Day 2 Minimum Wind Chill TemperatureSnows forecasted minimum wind chill temperatures for the second day of the forecast period. |
National Snow AnalysesIncludes data on snow water equivalent, snow depth and more. The data can be view for a day or animated for a two week period or a season. NERFC: Observed Snow Maps |
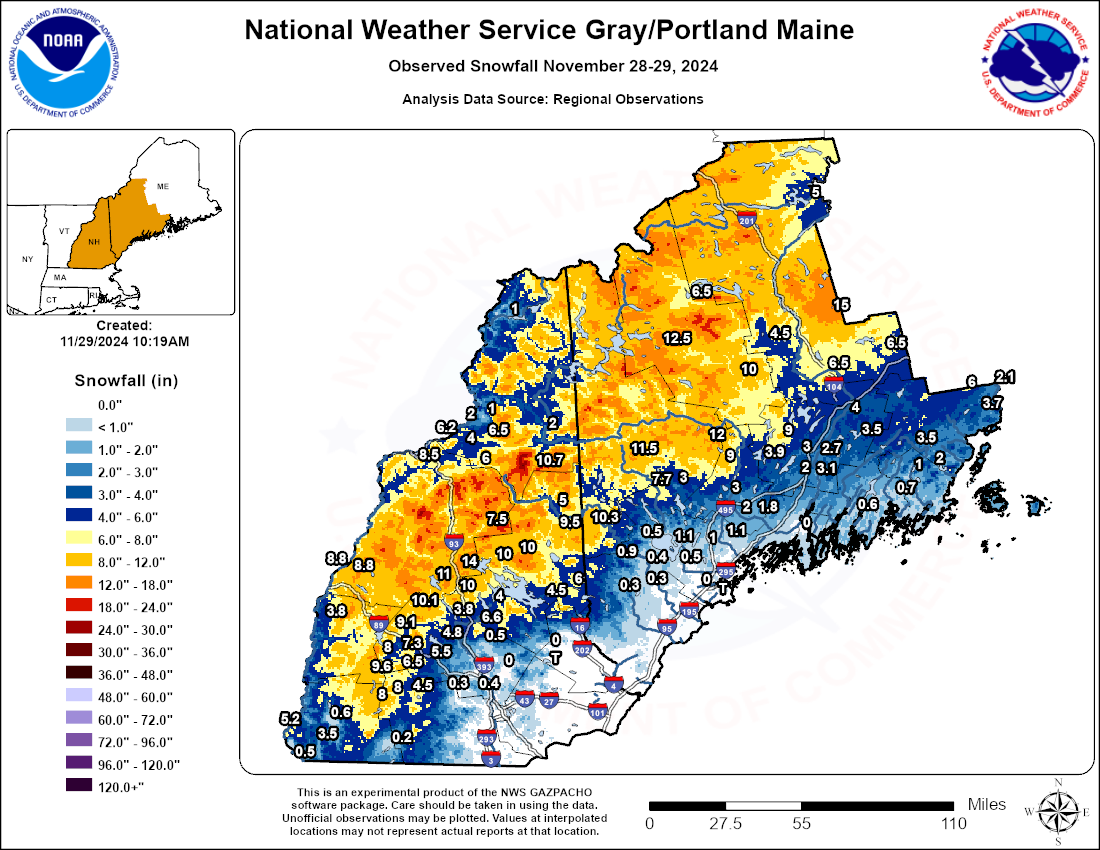 |
Snowfall ReportsThese resources can be used for snow and ice observations. - Latest Snowfall Report Text Listing
|


