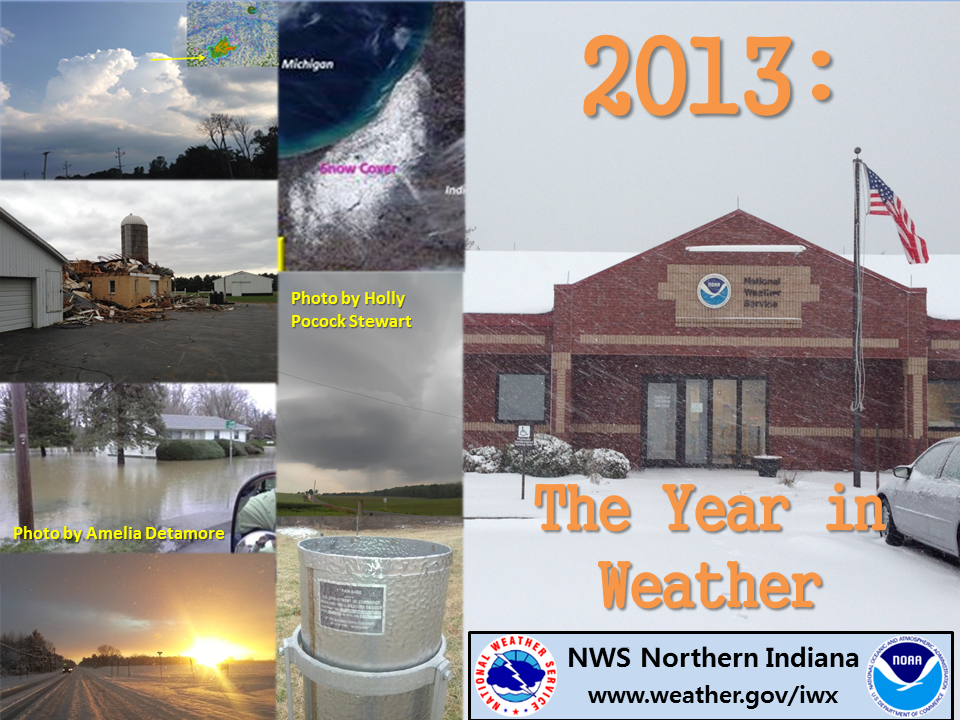
A look back at the year in weather across Northern Indiana, Southwest Lower Michigan and Northwest Ohio
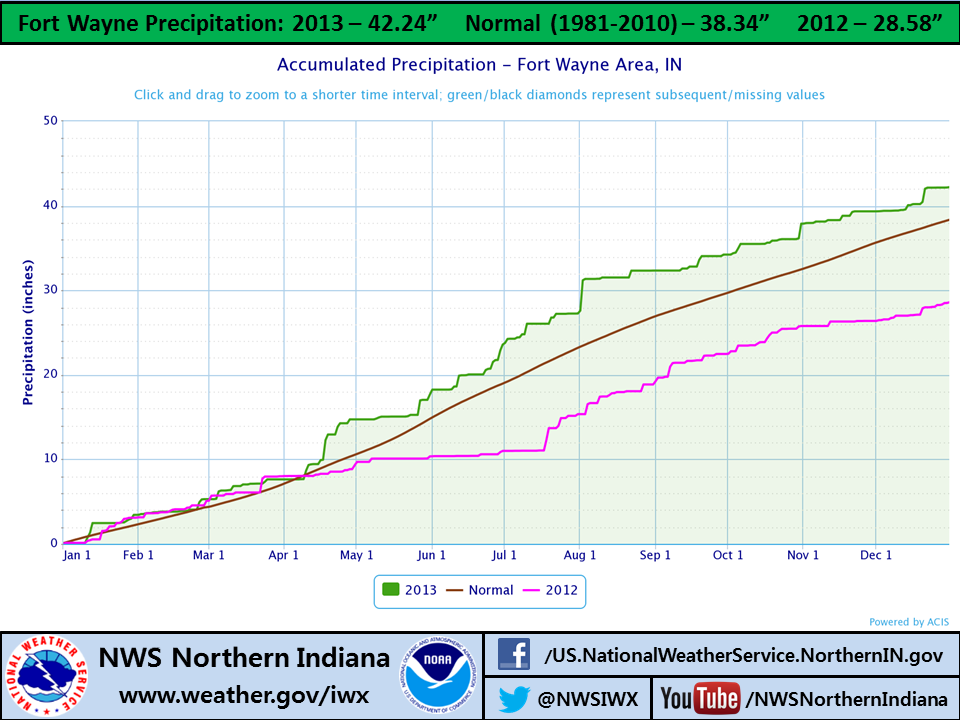
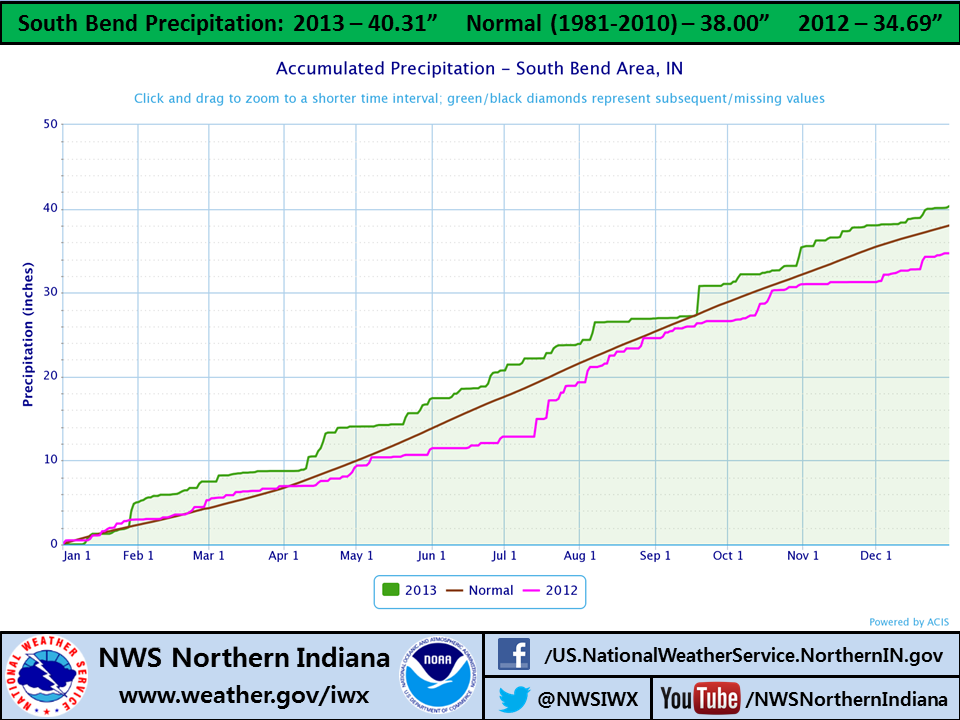
2013 was a cool and wet year compared to normal across the region. After a nearly record warm 2012 across the area, temperatures in 2013 were much cooler on average. The average temperature for 2013 at Fort Wayne was 49.8 degrees F, which is 0.7 degrees F below normal. South Bend's average 2013 temperature was 49.3 degrees F, 0.5 degrees F below normal. A major drought across the region in 2012 left precipitation totals well below normal for Fort Wayne and South Bend. However, 2013 was a different story. Fort Wayne received nearly 14 more inches of precipitation in 2013 than 2012. The 2013 total of 42.24 inches is 3.87 inches above normal, and ranks as the T-11th wettest year on record. South Bend received 40.35 inches of precipitation in 2013, which is only less than 6 inches below the total for 2012. However, 2013 was the 29th wettest year on record at South Bend, as the precipitation total was 2.35 inches above normal. Early/mid September heat brough the warmest temperatures of the year across the area, while an Arctic cold snap in early December brought the first sub-zero temperatures to Fort Wayne and South Bend in over 1000 days.
 |
 |
We've created a website with maps of Monthly, Seasonal, Annual, and Climate Normal Precipitation and Snowfall for northern Indiana, southern Lower Michigan, and northwest Ohio. These maps are generated from National Weather Service observing stations. They will be generated and posted within the first few days of each new period (month, season, year)
Monthly and Seasonal Precipitation Maps
The following links will take you to the annual climate summaries for Fort Wayne and South Bend.
000
CXUS53 KIWX 011943
CLAFWA
INDCLMFWA 000
TTAA00 KIWX 011409
CLIMATE REPORT
NATIONAL WEATHER SERVICE NORTHERN INDIANA
907 AM EST WED JAN 1 2014
...................................
...THE FORT WAYNE CLIMATE SUMMARY FOR THE YEAR OF 2013...
CLIMATE NORMAL PERIOD 1981 TO 2010
CLIMATE RECORD PERIOD 1897 TO 2013
WEATHER OBSERVED NORMAL DEPART LAST YEAR`S
VALUE DATE(S) VALUE FROM VALUE
NORMAL
.............................................................
TEMPERATURE (F)
RECORD
HIGH 106 06/28/2012
06/25/1988
07/14/1936
LOW -24 01/12/1918
HIGHEST 95 09/11 MM MM 106
09/10
LOWEST -4 12/12 MM MM 3
AVG. MAXIMUM 59.3 60.3 -1.0 64.5
AVG. MINIMUM 40.4 40.6 -0.2 43.0
MEAN 49.8 50.5 -0.7
DAYS MAX >= 90 8 13.4 -5.4 42
DAYS MAX <= 32 49 39.4 9.6 19
DAYS MIN <= 32 140 123.2 16.8 119
DAYS MIN <= 0 1 6.5 -5.5 0
PRECIPITATION (INCHES)
RECORD
MAXIMUM 54.58 1990
MINIMUM 24.40 1962
TOTALS 42.21 38.34 3.87 28.58
DAILY AVG. 0.12 0.11 0.01 0.08
DAYS >= .01 131 133.9 -2.9 123
DAYS >= .10 73 76.7 -3.7 72
DAYS >= .50 28 24.6 3.4 15
DAYS >= 1.00 10 8.2 1.8 6
SNOWFALL (INCHES)
RECORDS
TOTAL 61.6 1982
TOTALS 39.8 33.5 6.3 30.8
SINCE 7/1 10.9 10.6 0.3 9.6
SNOWDEPTH AVG. 0 MM MM 0
DAYS >= TRACE 80 32.5 47.5 47
DAYS >= 1.0 12 10.0 2.0 12
GREATEST
SNOW DEPTH 10 03/06 5
DEGREE_DAYS
HEATING TOTAL 6254 6102 152 5100
SINCE 7/1 MM 2328 MM MM
COOLING TOTAL 856 809 47 1108
SINCE 1/1 856 809 47 1108
..............................................................
WIND (MPH)
AVERAGE WIND SPEED 8.7
HIGHEST WIND SPEED/DIRECTION 41/260 DATE 11/17
HIGHEST GUST SPEED/DIRECTION 63/260 DATE 06/24
SKY COVER
POSSIBLE SUNSHINE (PERCENT) MM
AVERAGE SKY COVER 0.70
NUMBER OF DAYS FAIR 21
NUMBER OF DAYS PC 109
NUMBER OF DAYS CLOUDY 132
AVERAGE RH (PERCENT) 74
WEATHER CONDITIONS. NUMBER OF DAYS WITH
THUNDERSTORM 0 MIXED PRECIP 4
HEAVY RAIN 25 RAIN 42
LIGHT RAIN 116 FREEZING RAIN 4
LT FREEZING RAIN 15 HAIL 0
HEAVY SNOW 3 SNOW 19
LIGHT SNOW 73 SLEET 9
FOG 236 FOG W/VIS <= 1/4 MILE 22
HAZE 96
- INDICATES NEGATIVE NUMBERS.
R INDICATES RECORD WAS SET OR TIED.
MM INDICATES DATA IS MISSING.
T INDICATES TRACE AMOUNT.
$$
JANUARY
...JANUARY WAS LIKE A WEATHER ROLLER COASTER...
DRAMATIC UPS AND DOWNS IN TEMPERATURES DURING THE MONTH MADE IT FEEL
LIKE A WEATHER ROLLER COASTER. HIGH TEMPERATURES TOPPED OUT IN THE
MIDDLE 60S AND LOW TEMPERATURES BOTTOMED OUT AROUND ZERO DEGREES.
JANUARY ALSO SAW ABOVE NORMAL PRECIPITATION WITH A FEW DAYS OF
MODERATE TO HEAVY RAINFALL. THIS HELPED RAISE WATER LEVELS ON AREA
LAKES AND RIVERS AND EVEN LED TO SOME MODERATE FLOODING ON AREA
RIVERS.
THE ROLLER COASTER RIDE BEGAN WITH TEMPERATURES BELOW NORMAL AND
RELATIVELY DRY CONDITIONS TO START THE MONTH. A JANUARY THAW
OCCURRED DURING THE SECOND WEEK AS HIGHS CLIMBED INTO THE 50S AND
TOPPED OUT IN THE UPPER 50S ON JANUARY 12TH. THE HIGH ON THIS DAY IN
FORT WAYNE WAS 59. THIS WARM UP WAS ALSO ACCOMPANIED BY OVER TWO
INCHES OF MUCH NEEDED RAINFALL WHICH OCCURRED BETWEEN THE 10TH AND
13TH. HOWEVER...THIS ABUNDANT RAINFALL ON TOP OF THE FROZEN GROUND
LED TO MODERATE FLOODING ON SOME RIVERS. THE WARM RESPITE WAS SHORT
LIVED AS MORE SEASONABLE TEMPERATURES RETURNED ON THE
14TH...FOLLOWED BY A MILD WARM UP ON THE 19TH.
SNOWFALL THROUGH JANUARY 20TH WAS WELL BELOW NORMAL WITH ONLY TWO
TENTHS OF AN INCH BEING RECORDED. THE REMAINDER OF THE MONTH WAS A
DIFFERENT STORY AS THE FIRST SIGNIFICANT ARCTIC OUTBREAK OF THE
SEASON BROUGHT TEMPERATURES CRASHING TO THE SINGLE DIGITS BY THE
21ST. THE 22ND WAS THE COLDEST DAY OF THE WINTER SEASON SO FAR WITH
A HIGH OF ONLY 14 AND A LOW OF 3 IN FORT WAYNE.
ANOTHER SIGNIFICANT WARMING TREND BEGAN ON THE 27TH WITH
TEMPERATURES RECOVERING BACK TO A RECORD 64 DEGREES ON THE 29TH.
THIS CRUSHED THE PREVIOUS RECORD OF 55 SET IN 1988. A SECOND ARCTIC
RUSH QUICKLY FOLLOWED TO END THE MONTH AS TEMPERATURES PLUMMETED
INTO THE TEENS ON THE 31ST. RAINFALL OF JUST UNDER AN INCH FELL
AHEAD OF THIS ARCTIC COLD FRONT. NEARLY ALL OF THE MONTHLY SNOWFALL
FELL OVER THE LAST WEEK OF JANUARY WITH 2.4 INCHES DURING THIS
PERIOD.
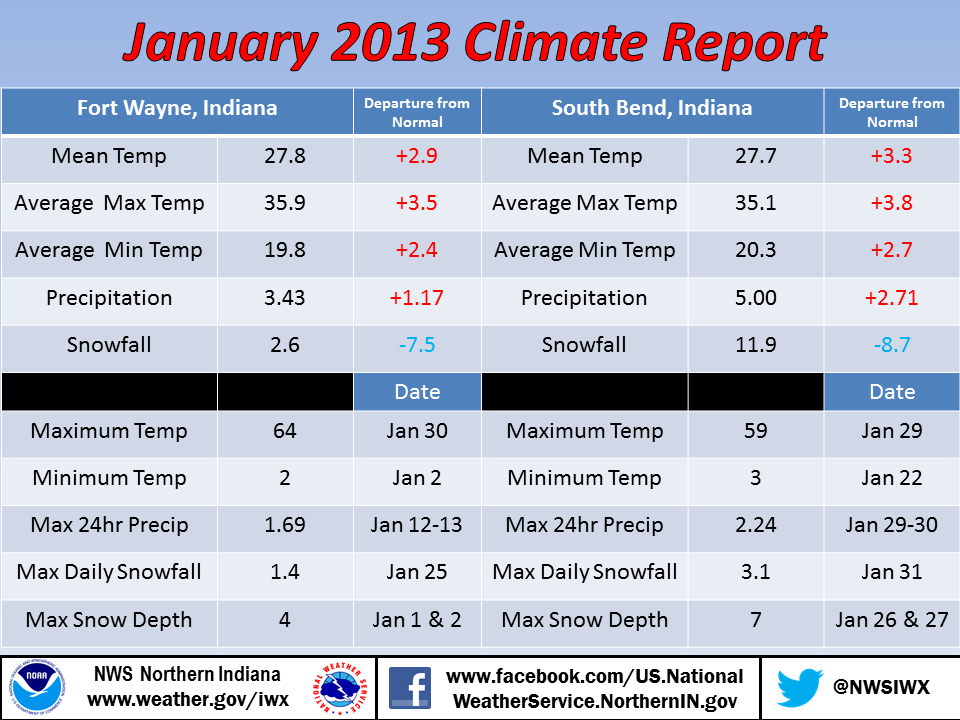
THE AVERAGE MONTHLY TEMPERATURE WAS 27.8 DEGREES...2.9 DEGREES ABOVE
NORMAL. THIS RANKS AS THE 35TH WARMEST JANUARY SINCE 1912. THE
HIGHEST TEMPERATURE FOR THE MONTH WAS 64 ON JANUARY 30TH. THIS WAS A
RECORD FOR THE DAY AND ALSO THE WARMEST JANUARY TEMPERATURE SINCE
JANUARY 7TH 2008 WHEN THE HIGH WAS A BALMY 66 DEGREES. THIS ALSO
TIED AS THE 5TH WARMEST JANUARY TEMPERATURE SINCE 1912. JANUARY ALSO
HAD TWO DAYS IN THE 60S...THE 29TH AND 30TH. THERE HAVE BEEN 8 OTHER
YEARS SINCE 1912 WITH AT LEAST TWO 60 DEGREE DAYS. THE MOST WAS 4 IN
1950. THE LAST YEAR WITH AT LEAST TWO 60 DEGREE DAYS WAS 2005.
THE LOWEST TEMPERATURE WAS 2 ON THE 2ND. THE LAST TIME FORT WAYNE
WAS COLDER THAN THIS WAS ON FEBRUARY 10TH 2011 WHEN THE LOW WAS 13
BELOW ZERO. THIS WAS ALSO THE LAST TIME THE TEMPERATURE WAS BELOW
ZERO.
THE MONTHLY PRECIPITATION WAS 3.43 INCHES...1.17 INCHES ABOVE
NORMAL. THIS WAS THE 18TH WETTEST JANUARY SINCE 1912. THE GREATEST
24 HOUR PRECIPITATION WAS ON THE 12TH AND 13TH WHEN 1.69 INCHES
FELL. THE 1.14 INCHES WHICH FELL ON THE 13TH BROKE A DAILY RECORD
FOR THE DATE AND TIED AS THE 20TH WETTEST JANUARY DAY SINCE 1912. IT
WAS ALSO THE WETTEST JANUARY DAY SINCE 2008 WHEN 1.19 INCHES FELL ON
JANUARY 8TH.
SNOWFALL FOR THE MONTH WAS OFFICIALLY 2.6 INCHES...7.5 INCHES BELOW
NORMAL. THIS RANKS AS THE 19TH LOWEST JANUARY SNOWFALL TOTAL SINCE
1912.
FEBRUARY
...BELOW NORMAL TEMPERATURES...PRECIPITATION AND SNOWFALL AT FORT
WAYNE...
AFTER A JANUARY WITH ABOVE NORMAL PRECIPITATION...FEBRUARY SAW
PRECIPITATION DROP BACK BELOW NORMAL ALONG WITH BELOW NORMAL
SNOWFALL. TEMPERATURES WERE SLIGHTLY BELOW NORMAL AS WELL.
THE WEATHER PATTERN DURING THE MONTH OF FEBRUARY WAS MORE TYPICAL OF
WINTER ACROSS MUCH OF THE UNITED STATES. SEVERAL STRONG WINTER
STORMS IMPACTED THE COUNTRY STARTING WITH A CRIPPLING BLIZZARD AND
HEAVY SNOW OVER THE ATLANTIC SEABOARD AND ENDING WITH TWO POTENT
HEAVY SNOW PRODUCING BLIZZARDS OVER THE CENTRAL UNITED STATES. OUR
LOCAL AREA WAS LEFT IN THE MIDDLE WITH A COMBINATION OF RESIDUAL
SNOWFALL FROM THE MIDWEST STORMS AND SEVERAL WEAKER CLIPPER SYSTEMS
WHICH BROUGHT RAIN AND SNOW TO THE REGION DURING THE MONTH.
WHILE TEMPERATURES OVER THE MONTH AVERAGED SLIGHTLY BELOW
NORMAL...THERE WERE BRIEF PERIODS OF BITTER COLD AIR AS WELL AS VERY
MILD AIR. ON ONE OCCASION...THE EXCHANGE BETWEEN A COLDER REGIME AND
WARMER REGIME HAPPENED IN JUST ONE DAY. THE HIGH TEMPERATURE ON
FEBRUARY 17TH WAS 28 DEGREES AFTER A MORNING LOW OF 11. THE
VERY NEXT DAY SAW A MILD HIGH TEMPERATURE OF 52 DEGREES WITH LIGHT
WINDS AND AMPLE SUNSHINE WHICH MADE IT FELL MUCH WARMER.
THE AVERAGE MONTHLY TEMPERATURE WAS 27.0 DEGREES...1.0 DEGREES
BELOW NORMAL. THE HIGHEST TEMPERATURE WAS 52 ON THE 18TH WHILE THE
COLDEST TEMPERATURE WAS 5 DEGREES ON THE FIRST.
PRECIPITATION FOR FEBRUARY WAS 1.48 INCHES...0.40 INCHES BELOW
NORMAL. THIS RANKS AS THE 53RD DRIEST FEBRUARY ON RECORD. THE
GREATEST 24 HOUR PRECIPITATION WAS ON THE 26TH WITH 0.86 INCHES
RECORDED. THERE WERE 10 DAYS WITH MEASURABLE PRECIPITATION.
SNOWFALL FOR THE MONTH WAS 5.9 INCHES...1.4 INCHES BELOW NORMAL.
THIS RANKS AS THE 53RD LEAST SNOWIEST FEBRUARY ON RECORD.
MARCH
...WHAT A DIFFERENCE A YEAR MAKES...
MARCH 2013 WAS A COLD MONTH WITH ABOVE NORMAL SNOWFALL AND BELOW
NORMAL PRECIPITATION. THIS WAS A DRASTIC DIFFERENCE FROM MARCH 2012
WHICH SAW NUMEROUS RECORDS FOR WARMTH BROKEN...INCLUDING RECORD HIGH
TEMPERATURES ON NINE CONSECUTIVE DAYS AND TEN CONSECUTIVE DAYS WITH
HIGH TEMPERATURES AT OR ABOVE 70. MARCH 2013 HAD JUST A SINGLE DAY
WITH A HIGH TEMPERATURE OF 60 DEGREES...AND THAT WAS ON THE LAST DAY
OF THE MONTH. THERE WERE ONLY 3 DAYS WITH AN AVERAGE TEMPERATURE
ABOVE NORMAL AND A STREAK OF 15 STRAIGHT DAYS WITH AN AVERAGE
TEMPERATURE BELOW NORMAL.
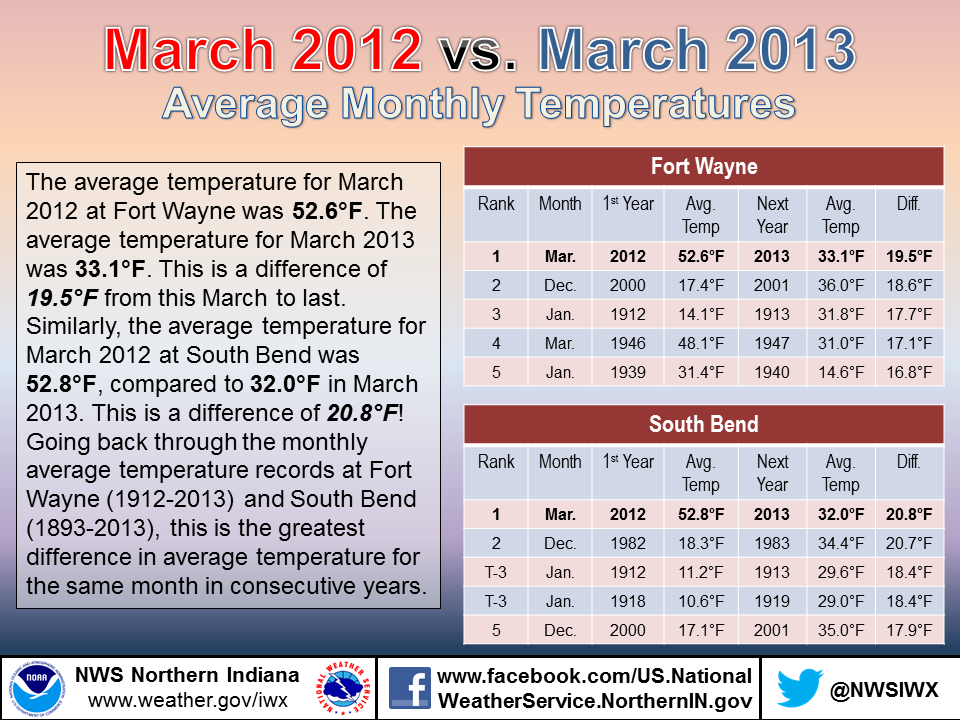
THE AVERAGE MONTHLY TEMPERATURE THIS MARCH WAS 33.1...5.3 DEGREES
BELOW NORMAL. THIS RANKED AS THE 18TH COLDEST MARCH ON RECORD. IN
CONTRAST...MARCH 2012 WAS THE WARMEST MARCH ON RECORD WITH A MONTHLY
AVERAGE TEMPERATURE OF 52.6 DEGREES. THIS DIFFERENCE OF 19.5 DEGREES
BETWEEN MONTHLY AVERAGE TEMPERATURES IN MARCH 2012 VS 2013 IS THE
GREATEST DIFFERENCE BETWEEN ANY MONTHLY AVERAGE TEMPERATURE FOR THE
SAME MONTH IN CONSECUTIVE YEARS.
THE HIGHEST TEMPERATURE THIS MONTH WAS 60 ON THE 31ST AND THE
COLDEST TEMPERATURE WAS 11 ON THE 21ST. IN MARCH 2012...THE HIGHEST
TEMPERATURE WAS A RECORD 87 DEGREES.
PRECIPITATION FOR THE MONTH WAS 2.34 INCHES...0.37 INCHES BELOW
NORMAL. THIS RANKED AS THE 36TH DRIEST MARCH SINCE 1912.
IRONICALLY...MORE PRECIPITATION FELL IN MARCH 2012...2.90 INCHES...
WHEN IT WAS WARMER AND CONSIDERED BY MANY TO BE MORE PLEASANT
COMPARED TO THIS MARCH. MEASURABLE PRECIPITATION THIS MONTH WAS
RECORDED ON 13 DAYS WHILE A TRACE OR MORE WAS RECORDED ON 20 DAYS.
DESPITE NEARLY 70 PERCENT OF THE DAYS HAVING SOME FORM OF
PRECIPITATION...ONLY 6 DAYS HAD A TENTH OR MORE. THE HIGHEST DAILY
PRECIPITATION TOTAL WAS 0.88 INCHES ON THE 5TH.
EVEN THOUGH PRECIPITATION WAS BELOW NORMAL...SNOWFALL WAS WELL ABOVE
NORMAL THIS MONTH. A TOTAL OF 18.1 INCHES WAS RECORDED...14.0 INCHES
ABOVE NORMAL. THIS RANKED AS THE 3RD SNOWIEST MARCH SINCE 1912. UP
UNTIL THIS MONTH...THE TOTAL SNOWFALL FOR THE SEASON WAS 20.4
INCHES...8 INCHES BELOW NORMAL. SO WHILE THE OFFICIAL SNOWFALL FOR
THE 3 WINTER MONTHS WAS BELOW NORMAL...SNOWFALL FOR THE ENTIRE
WINTER SEASON WILL BE ABOVE NORMAL.
APRIL
...VERY WET MONTH WITH BELOW NORMAL TEMPERATURES...
APRIL 2013 WAS A COLD MONTH WITH MUCH ABOVE NORMAL PRECIPITATION AND
BELOW NORMAL SNOWFALL ACROSS THE AREA. AFTER A SNOWY MARCH...APRIL
WAS CHARACTERIZED BY MORE TYPICAL SPRING-LIKE WEATHER SYSTEMS
THAT CAUSED DRASTIC SWINGS IN TEMPERATURES AND SEVERAL ROUNDS OF
HEAVY RAINFALL. THIS HEAVY RAINFALL LED TO WIDESPREAD FLOODING OF
RIVERS AND LOW LYING AREAS DURING THE LAST HALF OF THE MONTH AND
ERADICATED ANY REMAINING ABNORMALLY DRY AREAS ON THE US DROUGHT
MONITOR.
THE AVERAGE MONTHLY TEMPERATURE FOR APRIL WAS 48.2 DEGREES...1.8
DEGREES BELOW NORMAL. THIS RANKED AS THE 41ST COLDEST APRIL ON
RECORD SINCE 1913. THE HIGHEST TEMPERATURE THIS MONTH WAS 81 ON THE
9TH AND THE COLDEST TEMPERATURE WAS 20 ON THE 2ND AND 3RD.
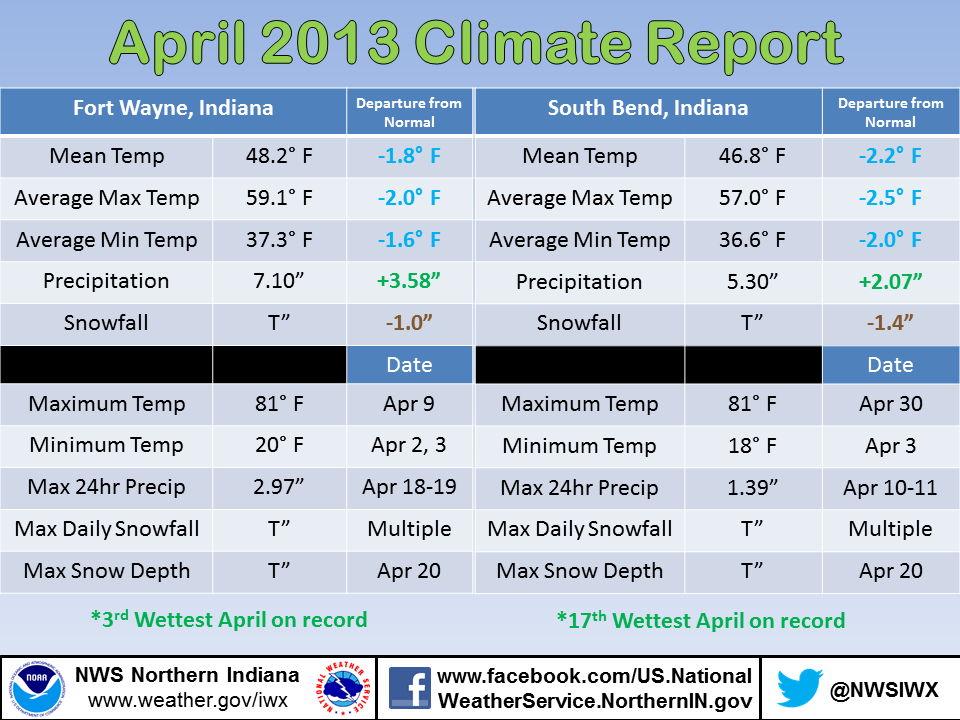
PRECIPITATION FOR THE MONTH WAS 7.10 INCHES...3.58 INCHES ABOVE
NORMAL. THIS RANKED AS THE 3RD WETTEST APRIL ON RECORD...JUST 0.09
INCHES SHORT OF THE RECORD SET IN 1944! THIS WAS ALSO THE MOST
PRECIPITATION SEEN IN ANY MONTH AT FORT WAYNE SINCE MAY 2011 WHEN
10.17 INCHES WAS RECORDED. MEASURABLE PRECIPITATION THIS MONTH WAS
RECORDED ON 12 DAYS WHILE A TRACE OR MORE WAS RECORDED ON 19 DAYS.
AN INCH OF PRECIPITATION OR MORE WAS RECORDED ON 2 DAYS THIS MONTH
WITH THE HIGHEST DAILY PRECIPITATION TOTAL OF 2.97 INCHES ON THE
18TH-19TH.
ONLY A TRACE OF SNOWFALL WAS RECORDED AT FORT WAYNE FOR THE MONTH OF
APRIL. THIS WAS 1.0 INCHES BELOW NORMAL. A TRACE OF SNOWFALL WAS
ACTUALLY RECORDED ON 4 DAYS.
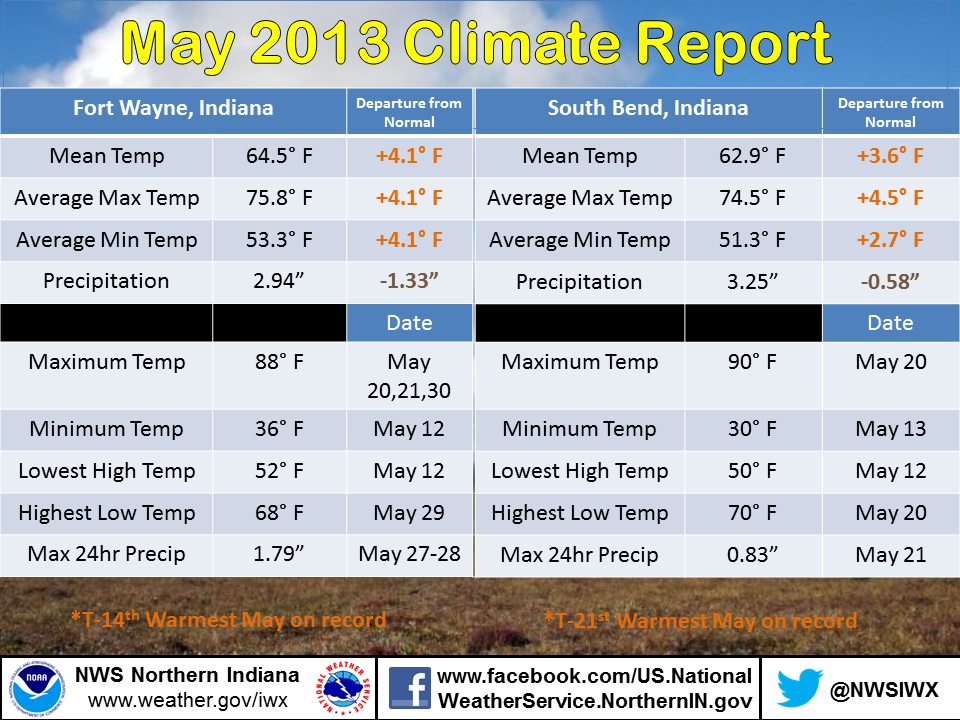
MAY
...A DRY BEGINNING BUT A WET ENDING TO MAY...
MAY BEGAN WARM AND VERY DRY AFTER A COOL AND WET APRIL. JUST A
LITTLE OVER A QUARTER OF AN INCH OF RAIN FELL BETWEEN THE FIRST AND
THE 21ST OF MAY...BUT OVER TWO AND A HALF INCHES OF RAIN FELL
BETWEEN THE 22ND AND 31ST. A DAILY RECORD RAINFALL OCCURRED ON THE
27TH WHEN 1.72 INCHES OF RAIN FELL AT THE AIRPORT. THIS BROKE THE
OLD RECORD OF 1.16 INCHES FROM 1985.
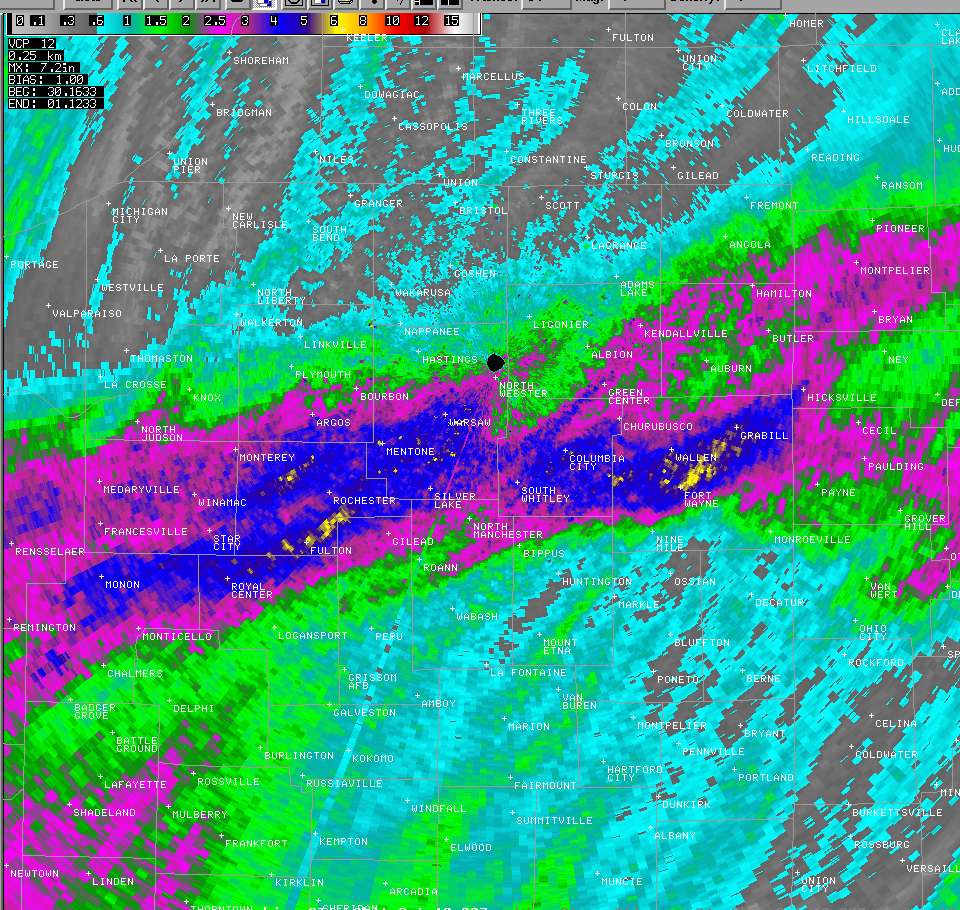
A SERIES OF THUNDERSTORMS COMPLEXES BROUGHT MAJOR FLASH FLOODING TO
THE REGION ON THE NIGHT OF THE 31ST INTO THE MORNING OF THE FIRST.
ALTHOUGH THE AIRPORT ONLY RECEIVED JUST OVER A HALF INCH BEFORE
MIDNIGHT AND AGAIN AFTER MIDNIGHT ON JUNE 1ST...MANY AREAS OF FORT
WAYNE FROM POINTS DOWNTOWN AND NORTH RECEIVED OVER FIVE INCHES OF
RAINFALL IN A FEW HOURS.
HIGH TEMPERATURES WERE ABOVE 70 DEGREES DURING THE FIRST TEN DAYS OF
THE MONTH AND HIGHS WERE AT OR ABOVE 70 ON 24 DAYS DURING THE MONTH.
DESPITE BEING A RELATIVELY WARM MONTH...THERE WAS A LARGE CONTRAST
IN TEMPERATURES. THE WARMEST HIGH TEMPERATURE WAS 88 ON THE
20TH...21ST AND 30TH...WHILE THE COOLEST HIGH TEMPERATURE WAS JUST
52 DEGREES ON THE 12TH. THE COOLEST TEMPERATURE WAS A LOW OF 36 ON
THE 12TH.
THE AVERAGE MONTHLY TEMPERATURE FOR MAY WAS 64.5 DEGREES...4.1
DEGREES ABOVE NORMAL. THIS RANKS AS THE T-14TH WARMEST MAY ON
RECORD. PRECIPITATION FOR THE MONTH WAS 2.94 INCHES...1.33 INCHES
BELOW NORMAL. THIS RANKS AS THE 41ST DRIEST MAY ON RECORD.
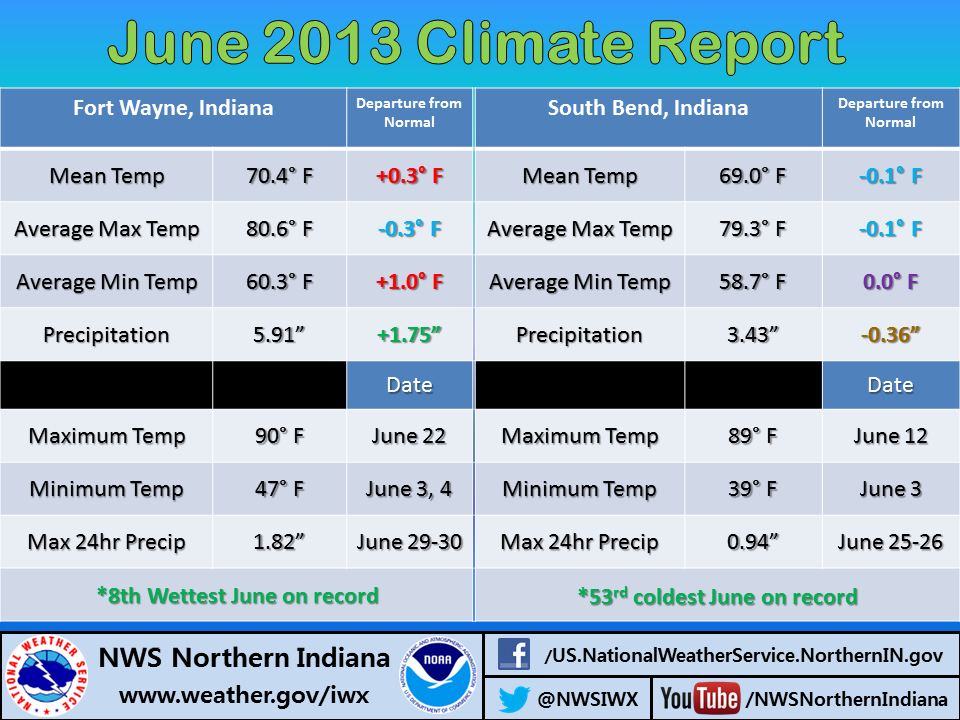
JUNE
...A WET MONTH WITH NEAR NORMAL TEMPERATURES...
WHAT A DIFFERENCE A YEAR MAKES! AT THIS TIME IN JUNE 2012...THE AREA
WAS SUFFERING FROM AN EXTENSIVE DROUGHT WITH A HEAT WAVE THAT SAW
TEMPERATURES HIT THE TRIPLE DIGIT MARK. THIS JUNE STARTED WITH
COOLER TEMPERATURES AND BELOW NORMAL RAINFALL AND ENDED WITH A WEEK
OF ABOVE NORMAL TEMPERATURES AND SEVERAL ROUNDS OF SEVERE WEATHER
AND HEAVY RAINFALL.
THE AVERAGE MONTHLY TEMPERATURE FOR JUNE WAS 70.4 DEGREES...0.3
DEGREES ABOVE NORMAL. THIS RANKED AS THE 57TH COLDEST JUNE ON RECORD
SINCE 1913. THE HIGHEST TEMPERATURE THIS MONTH WAS 90 ON THE 22ND.
THIS MARKED THE FIRST 90 DEGREE DAY AT FORT WAYNE IN 2013. THIS
MARKED A NOTICEABLE DIFFERENCE FROM JUNE 2012 WHICH SAW 12 90+
DEGREE DAYS! THE COLDEST TEMPERATURE WAS 47 ON THE 3RD AND 4TH.
PRECIPITATION FOR THE MONTH WAS 5.91 INCHES...1.75 INCHES ABOVE
NORMAL. THIS RANKED AS THE 8TH WETTEST JUNE ON RECORD...2.64 INCHES
SHORT OF THE RECORD SET IN 2000. MEASURABLE PRECIPITATION THIS MONTH
WAS RECORDED ON 15 DAYS WHILE A TRACE OR MORE WAS RECORDED ON 18
DAYS. AN INCH OF PRECIPITATION OR MORE WAS RECORDED ON 2 DAYS THIS
MONTH WITH THE HIGHEST DAILY PRECIPITATION TOTAL OF 1.28 INCHES ON
THE 12TH.
JULY
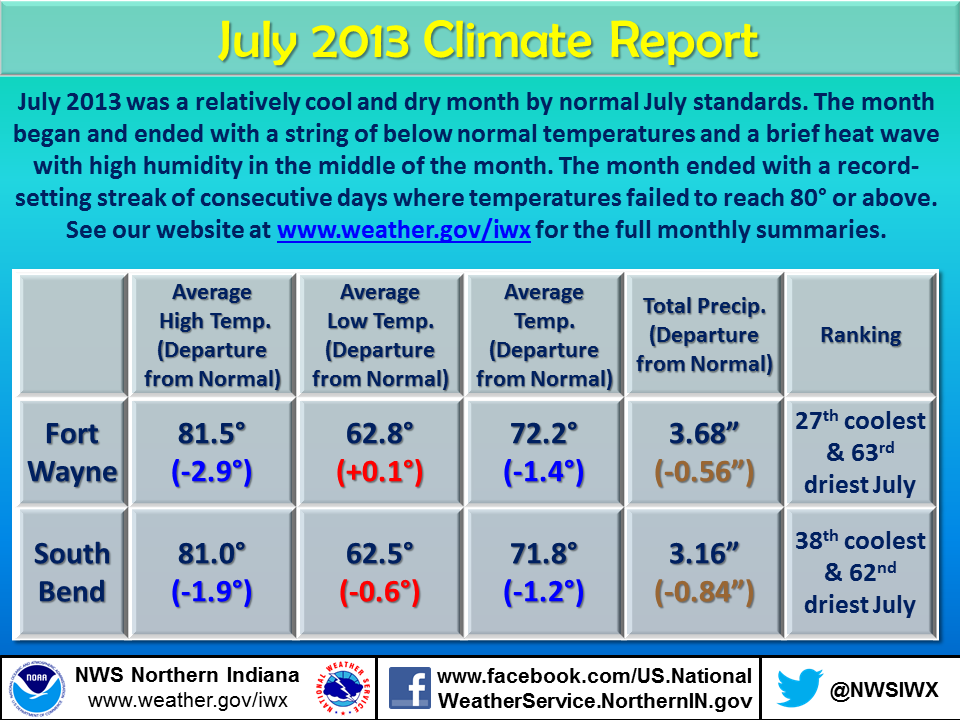
...A RELATIVELY COOL JULY WITH BELOW NORMAL RAINFALL AT FORT WAYNE...
THE MONTH OF JULY BEGAN AND ENDED WITH A STRING OF BELOW NORMAL
TEMPERATURES...WITH THE STRING AT THE END OF THE MONTH BEING A
RECORD. THERE WAS A BRIEF HEAT WAVE WITH HIGH HUMIDITY IN THE MIDDLE
OF THE MONTH. HIGH TEMPERATURES REACHED THE LOWER 90S DURING THIS
STRETCH WHILE LOW TEMPERATURES REMAINED IN THE LOWER TO MIDDLE 70S.
THE FIRST FOUR DAYS OF JULY EXPERIENCED BELOW NORMAL AVERAGE
TEMPERATURES WHILE 6 OF THE FIRST 7 DAYS WERE AT OR BELOW NORMAL.
JULY ENDED WITH THE LAST NINE STRAIGHT DAYS BEING BELOW NORMAL WITH
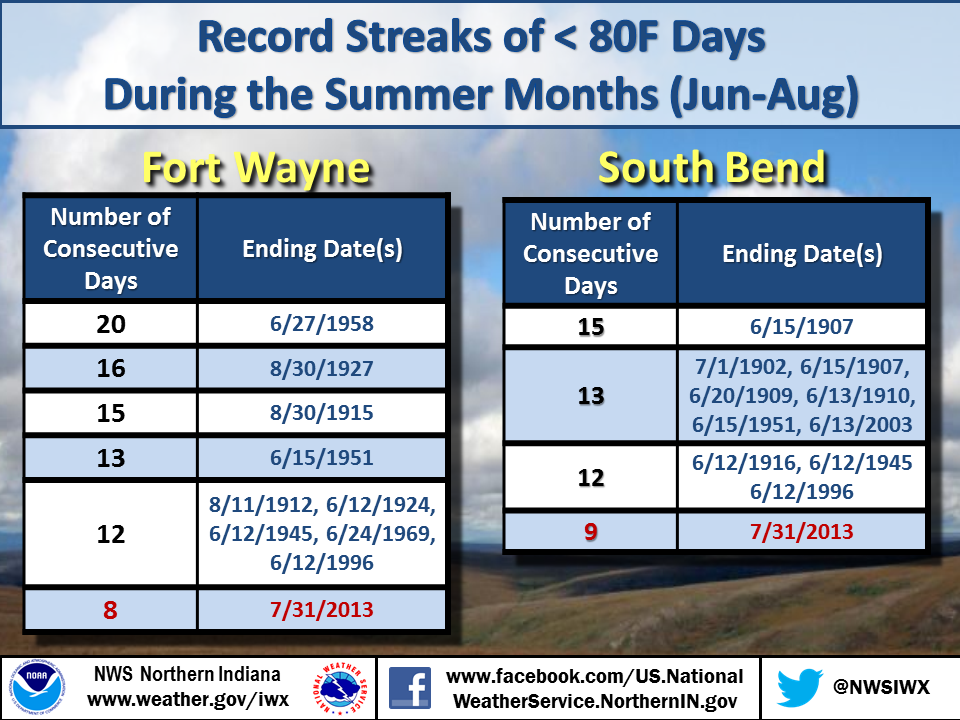
HIGH TEMPERATURES BELOW 80 DEGREES ON THE LAST 8 DAYS. THIS TIED THE
JULY RECORD FOR CONSECUTIVE NUMBER OF DAYS WITH HIGH TEMPERATURES
BELOW 80 DEGREES. THE PREVIOUS RECORD WAS 8 ENDING ON JULY 30 2004
AND JULY 8 1924. THERE WERE A TOTAL OF 17 DAYS THIS MONTH WITH
AVERAGE TEMPERATURES BELOW NORMAL. A RECORD LOW HIGH TEMPERATURE WAS
SET ON THE 28TH WHEN THE HIGH ONLY REACHED 69 DEGREES. THIS BROKE
THE PREVIOUS RECORD OF 71 SET IN 1969 AND 1925.
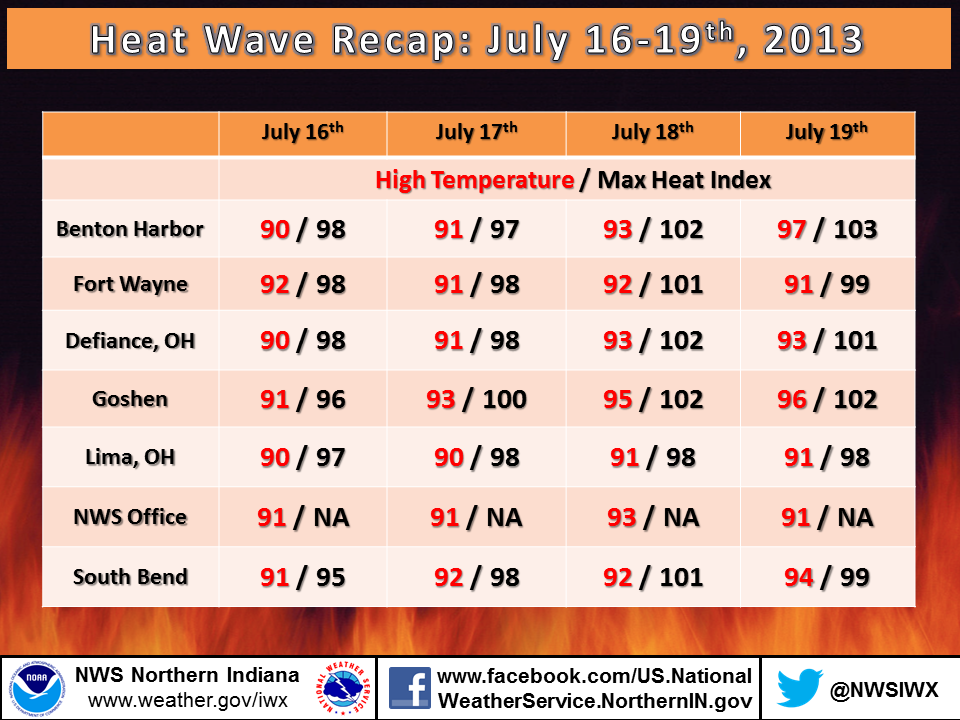
THE HEAT WAVE BEGAN AROUND JULY 14TH AND ENDED AROUND THE 19TH.
THERE WERE 4 DAYS OF TEMPERATURES AT OR ABOVE 90 WITH THE HOTTEST
TEMPERATURE OF 92 OCCURRING ON THE 16TH AND 18TH. IT WAS ALSO A VERY
MUGGY PERIOD AS DEW POINTS WERE GENERALLY IN THE LOWER TO MIDDLE
70S. THIS ALLOWED HEAT INDICES TO CLIMB INTO THE UPPER 90S AND LOWER
100S.
THE AVERAGE MONTHLY TEMPERATURE AT FORT WAYNE WAS 72.2 WHICH WAS 1.4
DEGREES BELOW NORMAL. THIS RANKED AS THE 27TH COOLEST JULY ON
RECORD. THE ONE WEEK OF HEAT IN THE MIDDLE OF THE MONTH HELPED RAISE
THE OVERALL AVERAGE TEMPERATURE. JULY 2009 WAS THE COOLEST JULY ON
RECORD WITH AN AVERAGE MONTHLY TEMPERATURE OF 68.9 DEGREES.
JULY PRECIPITATION WAS 3.68 INCHES...0.56 INCHES BELOW NORMAL. THIS
RANKED AS THE 63RD DRIEST JULY ON RECORD. MEASURABLE PRECIPITATION
FELL ON 11 DAYS WITH 7 DAYS SEEING A TENTH OF AN INCH OR GREATER...2
DAYS WITH A HALF INCH OR GREATER...AND 1 DAY WITH AN INCH OR MORE.
THE GREATEST 24 HOUR PRECIPITATION FELL ON JULY 10TH WHEN 1.25
INCHES WAS RECORDED. WHILE JULY PRECIPITATION WAS BELOW NORMAL...THE
RAINFALL WAS GENERALLY SPACED OUT OVER THE MONTH. THE GREATEST
NUMBER OF DAYS WITH NO MEASURABLE PRECIPITATION WAS 9 DAYS BETWEEN
JULY 11TH AND JULY 19TH. THE MONTH BEGAN WITH AT LEAST A TRACE OF
RAINFALL ON EACH DAY BETWEEN THE FIRST AND 10TH.
AUGUST
...RELATIVELY COOL AND WET IN AUGUST AT FORT WAYNE...
ALTHOUGH AUGUST ENDED WITH A STRETCH OF WARMER WEATHER...THE MONTH
AS A WHOLE WAS CHARACTERIZED BY BELOW NORMAL TEMPERATURES AT FORT
WAYNE. THE FIRST 24 DAYS OF THE MONTH ONLY HAD 4 DAYS WITH A HIGH
TEMPERATURE ABOVE 82 DEGREES. THE TEMPERATURE DID NOT REACH 90
DEGREES ON ANY OF THE FIRST 24 DAYS...AND 11 OF THESE DAYS HAD HIGH
TEMPERATURES THAT DID NOT REACH 80 DEGREES. THE COOLEST HIGH
TEMPERATURE FOR THE MONTH WAS 72 DEGREES ON THE 13TH AND 14TH.
THE LAST 7 DAYS OF THE MONTH WERE MUCH WARMER AT FORT WAYNE...WITH
THE HIGH TEMPERATURE REACHING 82 DEGREES EVERY DAY DURING THIS
STRETCH...AND AT LEAST 85 DEGREES 6 OUT OF THE 7 DAYS. THERE WERE NO
90 DEGREE DAYS IN AUGUST AT FORT WAYNE...BECOMING THE 1ST AUGUST
WITHOUT REACHING 90 DEGREES SINCE 2004...AND ONLY THE 6TH SUCH
AUGUST IN THE LAST 30 YEARS.
THE AVERAGE TEMPERATURE FOR AUGUST AT FORT WAYNE WAS 70.8
DEGREES...WHICH IS 0.7 DEGREES BELOW NORMAL. THIS TIES WITH 1989 AS
THE 34TH COOLEST AUGUST ON RECORD SINCE 1913. THE HIGHEST
TEMPERATURE FOR THE MONTH WAS 89 ON THE 27TH...AND THE COLDEST
TEMPERATURE FOR THE MONTH WAS 48 ON THE 14TH AND 15TH.
5.08 INCHES OF PRECIPITATION FELL AT SOUTH BEND IN AUGUST...WHICH IS
1.44 INCHES ABOVE NORMAL. THIS IS THE 11TH WETTEST AUGUST ON RECORD
SINCE 1913. ALTHOUGH THE MONTH AS A WHOLE WAS WET...OVER HALF OF THE
TOTAL MONTHLY RAINFALL FELL IN A 24 HOUR PERIOD ON THE 2ND AND 80
PERCENT OF THE TOTAL RAINFALL FELL ON THE FIRST THREE DAYS OF THE
MONTH. JUST 0.99 INCHES FELL AFTER AUGUST 3RD. MEASURABLE
PRECIPITATION FELL ON ONLY 7 DAYS...WITH THE HIGHEST 24 HOUR
RAINFALL TOTAL OF 3.75 INCHES ON THE 2ND AND 3RD. THE 3.59 INCHES OF
RAIN THAT FELL ON THE SECOND SET A NEW DAILY RAINFALL
RECORD...BEATING THE PREVIOUS RECORD OF 1.71 INCHES IN 1921. IT WAS
ALSO THE 9TH WETTEST CALENDAR DAY ON RECORD AND THE 4TH WETTEST
AUGUST CALENDAR DAY ON RECORD AT FORT WAYNE.
SEPTEMBER
...NEAR NORMAL TEMPERATURES WITH BELOW NORMAL PRECIPITATION...
SEPTEMBER ENDED WITH TEMPERATURES NEAR NORMAL AND PRECIPITATION
BELOW NORMAL. THERE WERE 13 DAYS WITH BELOW NORMAL TEMPERATURES AND
JUST TWO DAYS WITH AN AVERAGE TEMPERATURE OF MORE THAN 9 DEGREES
BELOW NORMAL...SEPTEMBER 13TH AND 14TH. IRONICALLY THESE TWO COLDEST
DAYS FOLLOWED THE THREE WARMEST DAYS OF THE MONTH...SEPTEMBER 9TH
THROUGH THE 11TH. THIS PERIOD HELPED BOOST THE AVERAGE MONTHLY
TEMPERATURE TO JUST ABOVE NORMAL. DURING THIS STRETCH...HIGH
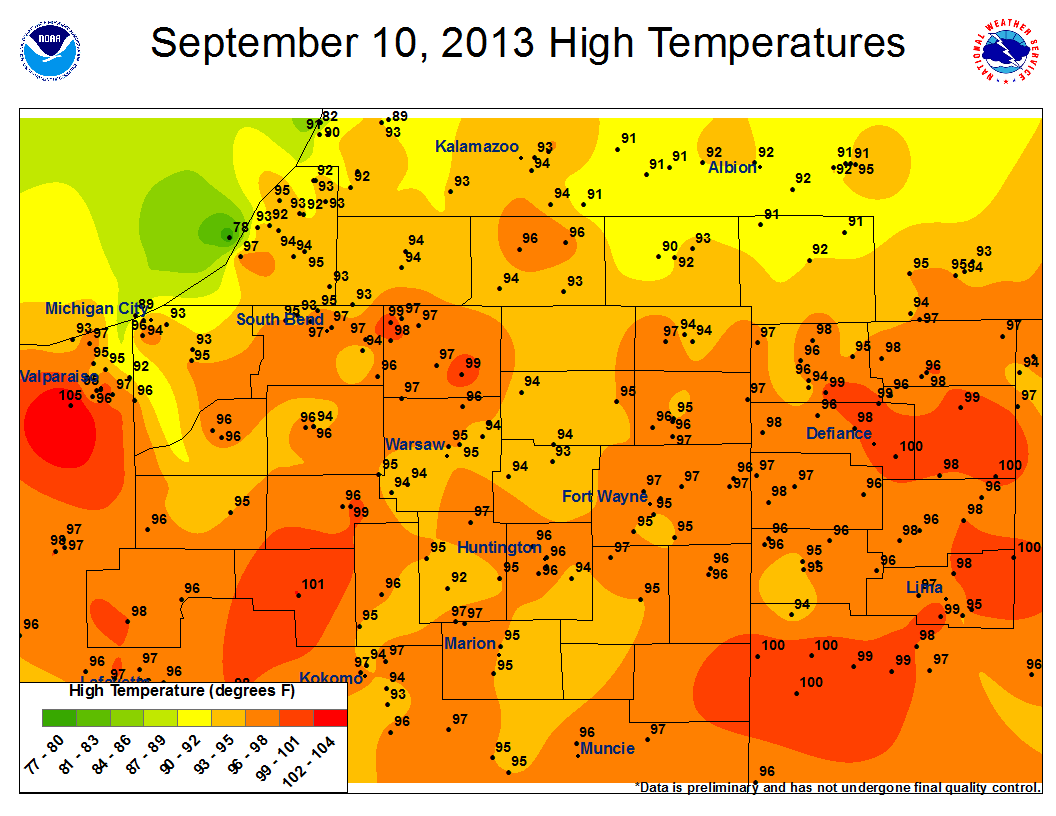
TEMPERATURES WERE IN THE 90S EACH DAY.
SEPTEMBER 10TH WAS THE WARMEST DAY OF THE MONTH AND YEAR WITH A HIGH
OF 95 AND A LOW OF 73...MAKING THE AVERAGE TEMPERATURE 17 DEGREES
ABOVE NORMAL. THERE HAVE ONLY BEEN 9 PREVIOUS YEARS IN WHICH THE
HIGHEST TEMPERATURE OF THE YEAR OCCURRED IN SEPTEMBER. THE LAST TIME
WAS IN 2008. SEPTEMBER 10TH IS THE FOURTH LATEST DAY FOR THE HIGHEST
TEMPERATURE OF THE YEAR. SEPTEMBER 15TH 1927 AND 1939 ARE THE LATEST
DATES FOR THE HIGHEST TEMPERATURE OF THE YEAR. THE HIGH WAS 99 IN
1939 AND 95 IN 1927.
THE AVERAGE MONTHLY TEMPERATURE FOR SEPTEMBER WAS 64.8...0.5 DEGREES
ABOVE NORMAL. THIS TIES 2009 FOR THE 56TH COOLEST SEPTEMBER ON
RECORD DATING BACK TO 1912. THE AVERAGE HIGH TEMPERATURE WAS
77.1...1.1 DEGREES ABOVE NORMAL. THE AVERAGE LOW TEMPERATURE WAS
52.5...JUST 0.1 DEGREES BELOW NORMAL. THERE WERE 3 DAYS WITH HIGHS
AT OR ABOVE 90. THE COLDEST TEMPERATURE OF THE MONTH WAS 37 WHICH
OCCURRED ON SEPTEMBER 14TH.
PRECIPITATION WAS JUST 1.89 INCHES...0.91 INCHES BELOW NORMAL. MORE
THAN HALF OF THIS PRECIPITATION...1.24 INCHES...FELL IN THE 24 HOUR
PERIOD ON THE 19TH AND 20TH. SEPTEMBER 2013 RANKED AS THE 34TH
DRIEST SEPTEMBER ON RECORD.
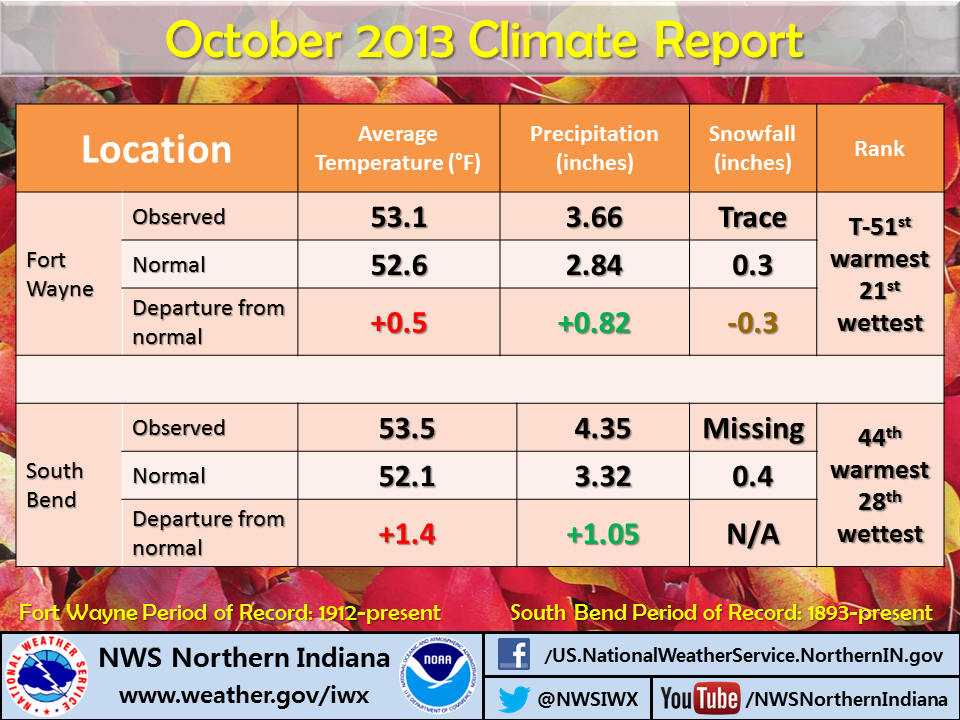
OCTOBER
...A WET END TO AN OTHERWISE QUIET OCTOBER...
OCTOBER 2013 HAD A VERY WARM START AT FORT WAYNE...WITH THE 4 OF THE
FIRST 5 DAYS OF THE MONTH HAVING AN AVERAGE TEMPERATURE OF 13
DEGREES OR MORE ABOVE NORMAL. AFTER NEAR NORMAL TEMPERATURES THROUGH
THE MIDDLE PART OF THE MONTH...A PATTERN SHIFT BROUGHT WELL BELOW
NORMAL TEMPERATURES TO THE REGION BEGINNING ON THE 22ND. THIS HELPED
BRING MIXED PRECIPITATION OVER A FOUR DAY PERIOD...WITH SOME AREAS
SOUTH OF FORT WAYNE RECEIVING THEIR FIRST ACCUMULATING SNOWFALL OF
THE SEASON.
AN INTERESTING STATISTIC FROM THIS WILD SWING IN TEMPERATURES: THERE
WERE ONLY 10 DAYS BETWEEN 80 DEGREE TEMPERATURES AND FREEZING
TEMPERATURES. THE LAST 80 DEGREE DAY OF THE MONTH OCCURRED ON THE
12TH...AND THE FIRST FREEZE OF THE SEASON OCCURRED ON THE 22ND. THE
HIGHEST TEMPERATURE OF THE MONTH WAS 85 DEGREES WHICH OCCURRED ON
THE 4TH...AND THE LOWEST TEMPERATURE OF THE MONTH WAS 28 WHICH
OCCURRED ON THE 25TH. OVERALL...THE AVERAGE TEMPERATURE FOR THE
MONTH OF OCTOBER ENDED UP NEAR NORMAL AT FORT WAYNE. THE AVERAGE
TEMPERATURE WAS 53.1 DEGREES...WHICH IS 0.5 DEGREES ABOVE NORMAL.
THIS TIES AS 51ST WARMEST OCTOBER ON RECORD SINCE 1912.
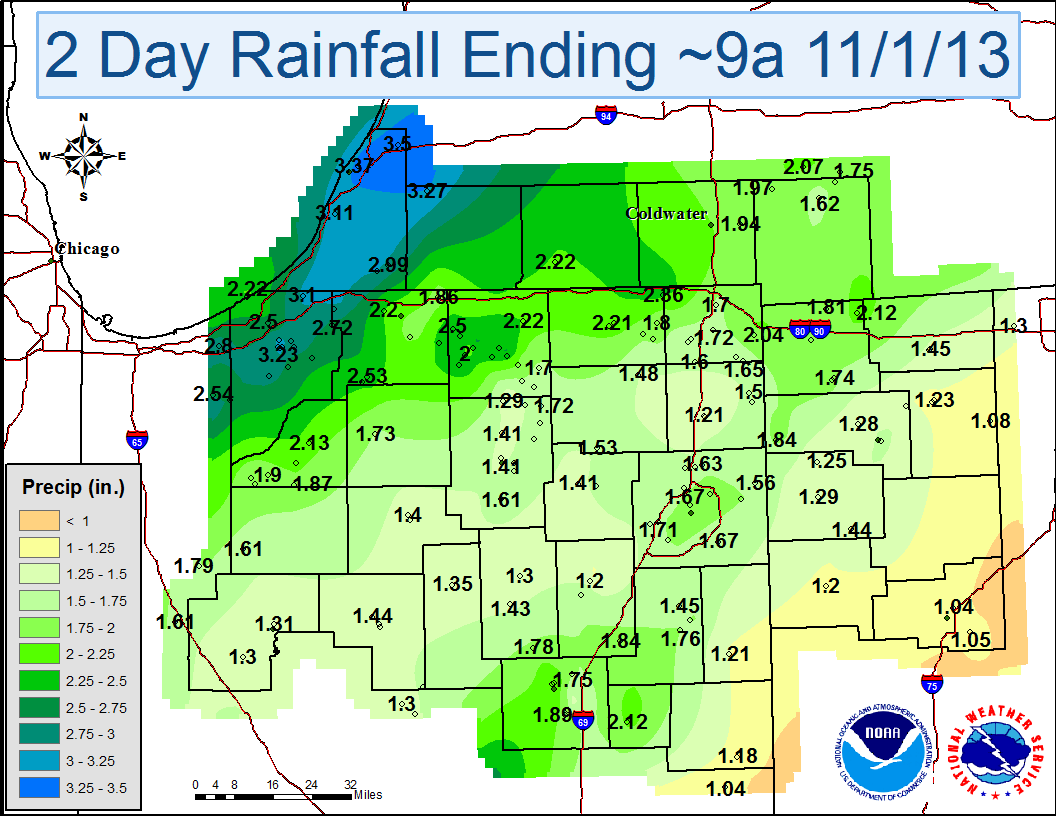
THE MONTH OF OCTOBER WAS DRY AT FORT WAYNE...WITH ONLY 1.93 INCHES
OF RAINFALL OVER THE FIRST 30 DAYS OF THE MONTH. HOWEVER...A STRONG
FALL STORM TRACKED TOWARD THE GREAT LAKES REGION OVER THE LAST TWO
DAYS OF THE MONTH...BRINGING OVER AN INCH OF RAINFALL ON HALLOWEEN.
THE TOTAL PRECIPITATION FOR THE MONTH WAS 3.66 INCHES...WHICH IS 0.82
INCHES ABOVE NORMAL. THIS RANKS AS THE 21ST WETTEST OCTOBER ON
RECORD SINCE 1912. MEASURABLE RAINFALL FELL ON 12 DAYS DURING
OCTOBER...WITH THE GREATEST 24 HOUR RAINFALL TOTAL BEING 1.74 INCHES
WHICH FELL ON THE 30TH AND 31ST.
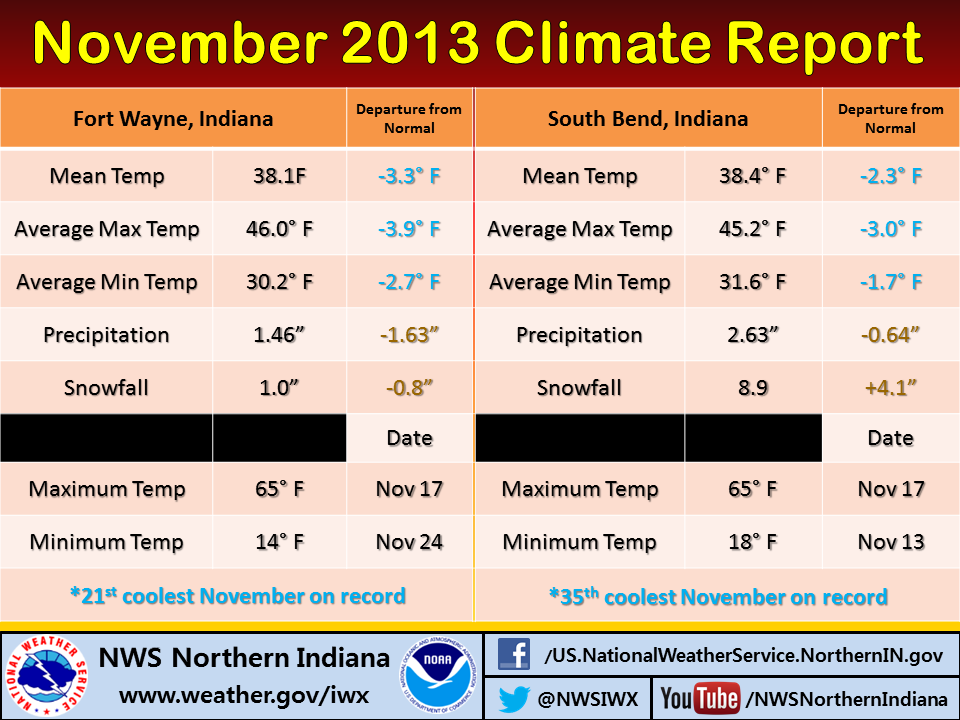
NOVEMBER
...A RELATIVELY COLD AND DRY NOVEMBER...
OVERALL NOVEMBER WAS COLDER THAN NORMAL WITH BELOW NORMAL
PRECIPITATION AND SNOWFALL. THIS WAS IN CONTRAST TO PARTS OF
NORTHWEST INDIANA WHICH SAW SNOWFALL TOTALS WELL ABOVE NORMAL DUE TO
LAKE EFFECT SNOW. HALF OF THE SNOW IN FORT WAYNE FELL ON THE 11TH
WITH 0.5 INCHES MEASURED. THE OTHER HALF INCH WAS SPREAD OVER THE
23RD...25TH AND 27TH.
THE MONTH WAS CHARACTERIZED BY SEVERAL LARGE SWINGS IN TEMPERATURES
AS TWO STRONG ARCTIC COLD FRONTS BROUGHT VERY COLD TEMPERATURES INTO
THE REGION. SANDWICHED BETWEEN THESE ARCTIC INTRUSIONS WAS A BRIEF
BUT SIGNIFICANT WARMUP WHICH LED TO A RECORD SETTING SEVERE WEATHER
AND TORNADO OUTBREAK ACROSS INDIANA. FOLLOWING THE FIRST BRIEF
ARCTIC PLUNGE ON THE 11TH THROUGH 13TH...TEMPERATURES WARMED QUICKLY
WITH HIGHS BACK INTO THE 60S BY THE 17TH. THIS WAS THE WARMEST DAY
OF THE MONTH WITH THE HIGH REACHING 65 AT FORT WAYNE AHEAD OF THE
SECOND ARCTIC COLD FRONT. THIS FRONT WAS ASSOCIATED WITH A
PRELIMINARY COUNT OF 28 TORNADOES ACROSS INDIANA...BREAKING THE
RECORD FOR MOST TORNADOES IN A SINGLE DAY IN NOVEMBER AND BEING THE
THIRD MOST TORNADOES FOR ANY DAY OF THE YEAR IN INDIANA. THE CLOSEST
TORNADO TO FORT WAYNE WAS AN EF1 TORNADO IN NORTHEAST VAN WERT
COUNTY.
THE AVERAGE MONTHLY TEMPERATURE WAS 38.1...3.3 DEGREES BELOW NORMAL.
THIS RANKS AS THE 21ST COOLEST NOVEMBER ON RECORD DATING BACK TO 1912.
THE HIGHEST TEMPERATURE WAS 65 ON THE 17TH AND THE COLDEST WAS 14 ON
THE 24TH. THERE WERE 3 DAYS WITH TEMPERATURES REMAINING AT OR BELOW
32 DEGREES. THIS TIED FOR 26TH PLACE FOR NUMBER OF NOVEMBER DAYS WITH
HIGH TEMPERATURES BELOW FREEZING.
PRECIPITATION FOR NOVEMBER WAS 1.46 INCHES...1.63 INCHES
BELOW NORMAL. THIS RANKED AS THE 20TH DRIEST NOVEMBER ON RECORD. THE
OFFICIAL SNOWFALL WAS 1.0 INCHES...0.8 INCHES BELOW NORMAL. THIS
RANKED AS THE 44TH LEAST SNOWIEST NOVEMBER.
DECEMBER
...A COLD MONTH WITH NEAR NORMAL PRECIPITATION...
DECEMBER WAS ANOTHER COLD MONTH WITH NEAR NORMAL PRECIPITATION. THE
MONTH ACTUALLY BEGAN RELATIVELY MILD WITH HIGH TEMPERATURES IN THE
40S AND 50S FOR THE FIRST 5 DAYS. THE HIGHEST TEMPERATURE OF THE
MONTH WAS 59 ON BOTH THE 4TH AND 5TH. THIS OCCURRED AHEAD OF A
STRONG ARCTIC COLD FRONT WHICH HELPED ESTABLISH THE VERY COLD AIR
FOR MUCH OF THE REMAINDER OF DECEMBER. AVERAGE DAILY TEMPERATURES
BETWEEN THE 6TH AND 18TH WERE ALL BELOW NORMAL AND 6 OF THESE DAYS
HAD TEMPERATURES AT LEAST 10 DEGREES BELOW NORMAL. TEMPERATURES DID
MODERATE BRIEFLY FROM THE 19TH TO THE 22ND BUT THIS PERIOD ALSO
EXPERIENCED MODERATE TO HEAVY RAINFALL WHICH RESULTED IN MODERATE
FLOODING ACROSS THE LOCAL AREA. OVER HALF OF THE MONTHLY
PRECIPITATION FELL DURING THIS PERIOD...WITH 1.56 INCHES OCCURRING
ON THE 21ST...BREAKING A RECORD FOR PRECIPITATION ON THIS DATE.
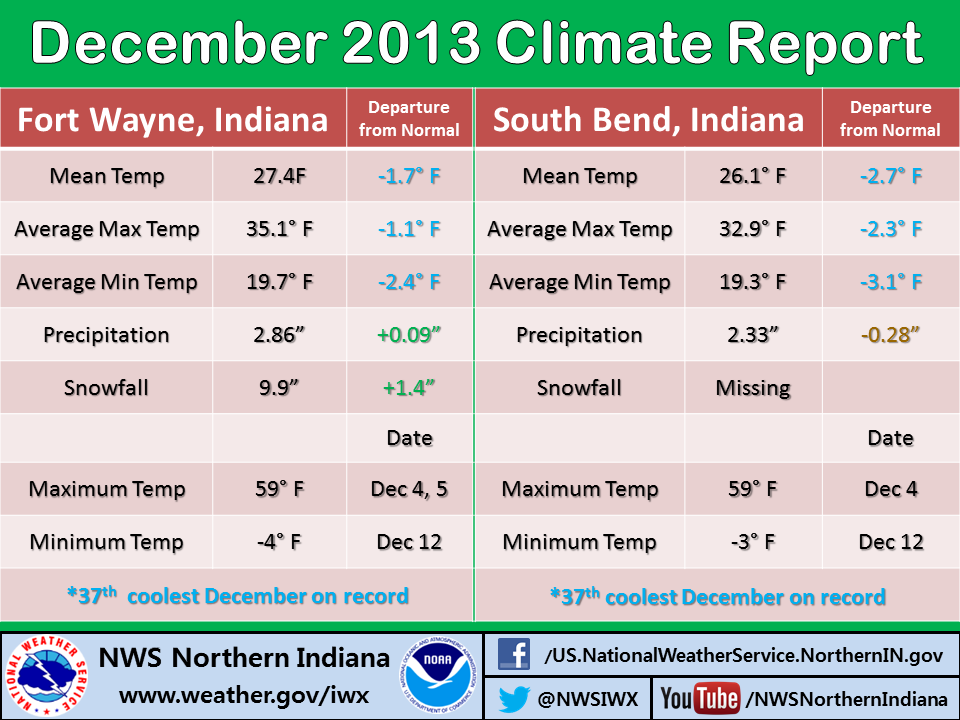
THE AVERAGE TEMPERATURE FOR DECEMBER WAS 27.4 DEGREES...1.7 DEGREES
BELOW NORMAL. THIS RANKED AS THE 37TH COLDEST DECEMBER ON RECORD.
THE COLDEST TEMPERATURE OF THE MONTH WAS -4 DEGREES ON THE 12TH.
PRECIPITATION FOR THE MONTH WAS 2.86 INCHES...0.09 INCHES ABOVE
NORMAL. THIS RANKED AS THE 36TH WETTEST DECEMBER ON RECORD. SNOWFALL
FOR DECEMBER WAS 9.9 INCHES WHICH WAS 1.4 INCHES ABOVE NORMAL. THE
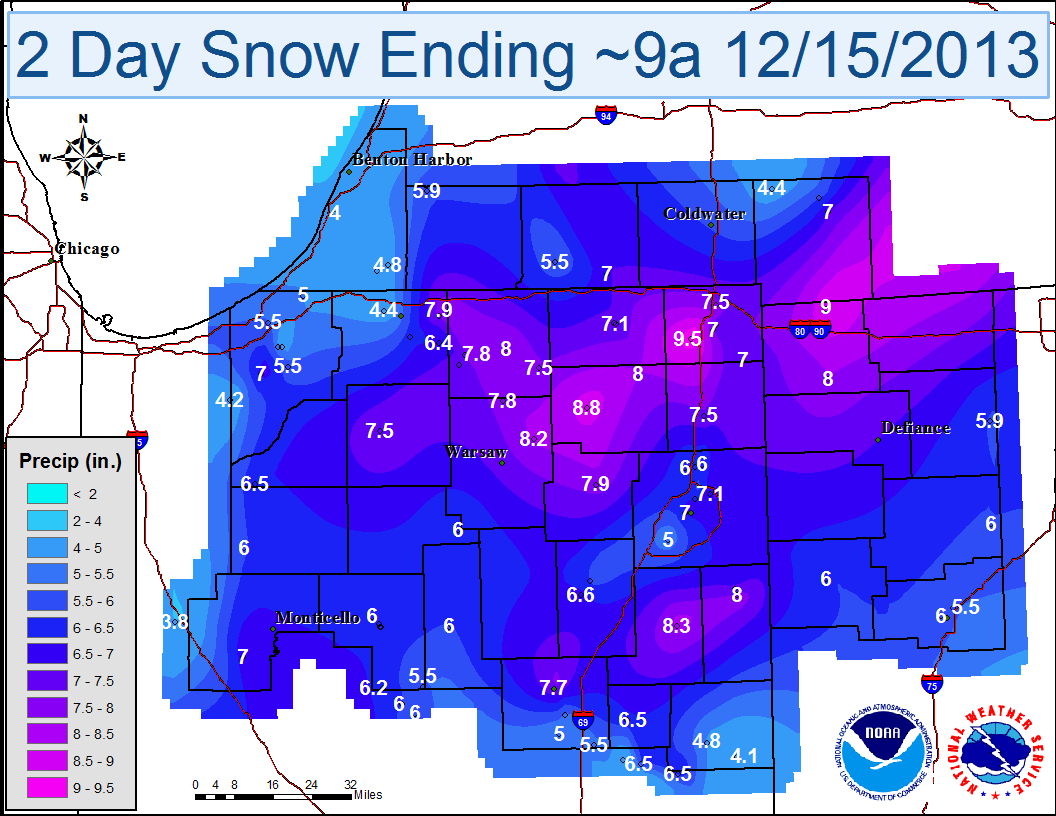
GREATEST AMOUNT OF SNOWFALL OCCURED ON DECEMBER 14 WHEN 4.6 INCHES FELL.
000
CXUS53 KIWX 011944
CLASBN

INDCLMSBN 000
TTAA00 KIWX 011409


CLIMATE REPORT
NATIONAL WEATHER SERVICE NORTHERN INDIANA
907 AM EST WED JAN 1 2014

...................................

...THE SOUTH BEND CLIMATE SUMMARY FOR THE YEAR OF 2013...

CLIMATE NORMAL PERIOD 1981 TO 2010
CLIMATE RECORD PERIOD 1893 TO 2013

WEATHER         OBSERVED          NORMAL  DEPART  LAST YEAR`S
                 VALUE   DATE(S)  VALUE   FROM    VALUE
                                          NORMAL
.............................................................
TEMPERATURE (F)
RECORD
 HIGH             109   07/24/1934
 LOW              -22   01/20/1943
                        01/25/1897
HIGHEST            97   09/10        MM      MM      102
LOWEST             -3   12/12        MM      MM        3
AVG. MAXIMUM     58.4              58.8    -0.4     63.1
AVG. MINIMUM     40.2              40.8    -0.6     43.5
MEAN             49.3              49.8    -0.5
DAYS MAX >= 90     10               9.7     0.3       33
DAYS MAX <= 32     52              44.6     7.4       21
DAYS MIN <= 32    135             122.7    12.3      112
DAYS MIN <= 0       1               5.3    -4.3        0

PRECIPITATION (INCHES)
RECORD
 MAXIMUM        55.61   1990
 MINIMUM        25.15   1963
TOTALS          40.35             38.00    2.35    34.69
DAILY AVG.       0.11              0.10    0.01     0.09
DAYS >= .01       157             145.4    11.6      135
DAYS >= .10        88              78.3     9.7       90
DAYS >= .50        26              23.4     2.6       18
DAYS >= 1.00        6               7.2    -1.2        4

SNOWFALL (INCHES)
RECORDS
 TOTAL          141.7   1978
TOTALS             MM              66.6      MM     54.6
SINCE 7/1          MM              22.5      MM      9.1
SNOWDEPTH AVG.     MM               MM       MM        0
DAYS >= TRACE      MM              44.9      MM       45
DAYS >= 1.0        MM              20.4      MM       17
GREATEST
 SNOW DEPTH        MM                                 8

DEGREE_DAYS
HEATING TOTAL    6426              6298     128     5260
 SINCE 7/1         MM              2391      MM       MM
COOLING TOTAL     828               773      55     1115
 SINCE 1/1        828               773      55     1115
..............................................................

WIND (MPH)
AVERAGE WIND SPEED              8.7
HIGHEST WIND SPEED/DIRECTION    53/260    DATE  06/24
HIGHEST GUST SPEED/DIRECTION    68/230    DATE  11/17

SKY COVER
POSSIBLE SUNSHINE (PERCENT)   MM
AVERAGE SKY COVER           0.50
NUMBER OF DAYS FAIR           86
NUMBER OF DAYS PC             81
NUMBER OF DAYS CLOUDY         95

AVERAGE RH (PERCENT)     71

WEATHER CONDITIONS. NUMBER OF DAYS WITH
THUNDERSTORM              0     MIXED PRECIP               0
HEAVY RAIN               32     RAIN                      58
LIGHT RAIN              118     FREEZING RAIN              2
LT FREEZING RAIN          6     HAIL                       1
HEAVY SNOW                7     SNOW                      20
LIGHT SNOW               78     SLEET                      0
FOG                     195     FOG W/VIS <= 1/4 MILE     21
HAZE                     88

-  INDICATES NEGATIVE NUMBERS.
R  INDICATES RECORD WAS SET OR TIED.
MM INDICATES DATA IS MISSING.
T  INDICATES TRACE AMOUNT.

$$

JANUARY

...JANUARY WAS LIKE A WEATHER ROLLER COASTER...

DRAMATIC UPS AND DOWNS IN TEMPERATURES DURING THE MONTH MADE IT FEEL
LIKE A WEATHER ROLLER COASTER. HIGH TEMPERATURES TOPPED OUT NEAR 60
DEGREES AND LOW TEMPERATURES BOTTOMED OUT AROUND ZERO DEGREES.
JANUARY ALSO SAW ABOVE NORMAL PRECIPITATION WITH A FEW DAYS OF
MODERATE TO HEAVY RAINFALL. THIS HELPED RAISE WATER LEVELS ON AREA
LAKES AND RIVERS AND EVEN LED TO SOME MINOR FLOODING.

THE ROLLER COASTER RIDE BEGAN WITH TEMPERATURES SLIGHTLY BELOW
NORMAL AND RELATIVELY DRY CONDITIONS TO START THE MONTH.
A JANUARY THAW OCCURRED DURING THE SECOND WEEK AS HIGHS CLIMBED INTO
THE 40S AND TOPPED OUT IN THE UPPER 50S ON JANUARY 12TH. THE HIGH ON
THIS DAY IN SOUTH BEND WAS 58. THIS WARM UP WAS ALSO ACCOMPANIED BY
OVER AN INCH OF MUCH NEEDED RAINFALL WHICH OCCURRED BETWEEN THE 10TH
AND 13TH. THIS WARM RESPITE WAS SHORT LIVED AS MORE SEASONABLE
TEMPERATURES RETURNED ON THE 13TH...FOLLOWED BY A MILD WARM UP ON
THE 19TH.

SNOWFALL THROUGH JANUARY 20TH WAS WELL BELOW NORMAL WITH ONLY THREE
TENTHS OF AN INCH BEING RECORDED. THE REMAINDER OF THE MONTH WAS A
DIFFERENT STORY AS THE FIRST SIGNIFICANT ARCTIC OUTBREAK OF THE
SEASON BROUGHT TEMPERATURES CRASHING TO THE SINGLE DIGITS BY THE
21ST. THE 22ND WAS THE COLDEST DAY OF THE WINTER SEASON SO FAR WITH
A HIGH OF ONLY 9 AND A LOW OF 3 IN SOUTH BEND. LAKE EFFECT SNOWFALL
KICKED IN AND SOUTH BEND RECEIVED OVER 7 INCHES OF SNOW BETWEEN THE
20TH AND 26TH WHILE SOME LOCATIONS IN LOWER MICHIGAN RECEIVED A FOOT
OR MORE.

ANOTHER SIGNIFICANT WARMING TREND BEGAN ON THE 27TH WITH
TEMPERATURES RECOVERING BACK TO NEAR 60 BY THE 29TH. A SECOND ARCTIC
RUSH QUICKLY FOLLOWED AS TEMPERATURES PLUMMETED INTO THE TEENS ON
THE 31ST. RAINFALL OF OVER TWO INCHES FELL AHEAD OF THIS ARCTIC COLD
FRONT AND LAKE EFFECT SNOWFALL OF OVER 4 INCHES FOLLOWED IN ITS
WAKE.

THE AVERAGE MONTHLY TEMPERATURE WAS 27.7 DEGREES...3.3 DEGREES ABOVE
NORMAL. THIS RANKS AS THE 34TH WARMEST JANUARY SINCE 1893. THE
HIGHEST TEMPERATURE FOR THE MONTH WAS 59 ON JANUARY 29TH. THIS WAS
THE WARMEST JANUARY TEMPERATURE SINCE JANUARY 7TH 2008 WHEN THE HIGH
WAS A BALMY 65 DEGREES. THE LOWEST TEMPERATURE WAS 3 ON THE 22ND.
THE LAST TIME SOUTH BEND WAS COLDER THAN THIS WAS ON FEBRUARY 11TH
2011 WHEN THE LOW WAS 2 DEGREES. THE LAST TIME THE TEMPERATURE WAS
BELOW ZERO IN SOUTH BEND WAS FEBRUARY 10TH 2011 WHEN THE LOW WAS
NINE DEGREES BELOW ZERO.

THE MONTHLY PRECIPITATION WAS 5.00 INCHES...2.71 INCHES ABOVE
NORMAL. THE GREATEST 24 HOUR PRECIPITATION WAS ON THE 29TH AND 30TH
WHEN 2.24 INCHES FELL. THE MONTH RANKS AS THE 5TH WETTEST ON RECORD.
THE 1.94 INCHES WHICH FELL ON THE 29TH BROKE A RECORD FOR THE DATE
AND WAS ALSO THE 4TH WETTEST JANUARY DAY ON RECORD. IT WAS ALSO THE
WETTEST JANUARY DAY SINCE 1967 WHEN 2.12 INCHES FELL ON JANUARY
26TH.

SNOWFALL FOR THE MONTH AT SOUTH BEND WAS OFFICIALLY 11.9
INCHES...8.7 INCHES BELOW NORMAL. THIS RANKS AS THE 43RD LOWEST
JANUARY SNOWFALL TOTAL SINCE 1893.


FEBRUARY

...A WET AND SNOWY MONTH WITH NEAR NORMAL TEMPERATURES...

FEBRUARY ENDED A STRING OF MONTHS WITH BELOW NORMAL SNOWFALL THIS
WINTER AT SOUTH BEND. PRECIPITATION WAS ABOVE NORMAL FOR THE THIRD
STRAIGHT MONTH AND TEMPERATURES AVERAGED JUST A LITTLE BELOW NORMAL.

THE WEATHER PATTERN DURING THE MONTH OF FEBRUARY WAS MORE TYPICAL OF
WINTER ACROSS MUCH OF THE UNITED STATES. SEVERAL STRONG WINTER
STORMS IMPACTED THE COUNTRY STARTING WITH A CRIPPLING BLIZZARD AND
HEAVY SNOW OVER THE ATLANTIC SEABOARD AND ENDING WITH TWO POTENT
HEAVY SNOW PRODUCING BLIZZARDS OVER THE CENTRAL UNITED STATES. OUR
LOCAL AREA WAS LEFT IN THE MIDDLE WITH A COMBINATION OF RESIDUAL
SNOWFALL FROM THE MIDWEST STORMS AND MODERATE TO AT TIMES HEAVY LAKE
EFFECT SNOW. SEVERAL WEAKER CLIPPER SYSTEMS ALSO BROUGHT RAIN AND
SNOW TO THE REGION DURING THE MONTH.

WHILE TEMPERATURES OVER THE MONTH AVERAGED NEAR NORMAL...THERE WERE
BRIEF PERIODS OF BITTER COLD AIR AS WELL AS VERY MILD AIR. ON ONE
OCCASION...THE EXCHANGE BETWEEN A COLDER REGIME AND WARMER REGIME
HAPPENED IN JUST ONE DAY. THE HIGH TEMPERATURE ON FEBRUARY 17TH WAS
28 DEGREES AFTER A MORNING LOW OF 11 AND ONE INCH OF SNOWFALL. THE
VERY NEXT DAY SAW A MILD HIGH TEMPERATURE OF 52 DEGREES WITH LIGHT
WINDS AND AMPLE SUNSHINE WHICH MADE IT FELL MUCH WARMER.

THE AVERAGE MONTHLY TEMPERATURE WAS 26.8 DEGREES...0.8 DEGREES BELOW
NORMAL. THE HIGHEST TEMPERATURE WAS 52 ON THE 18TH WHILE THE COLDEST
TEMPERATURE WAS 3 DEGREES ON THE FIRST.

PRECIPITATION FOR FEBRUARY WAS 2.25 INCHES...0.46 INCHES ABOVE
NORMAL. THIS RANKS AS THE 25TH WETTEST FEBRUARY ON RECORD. THE
GREATEST 24 HOUR PRECIPITATION WAS ON THE 26TH WITH 0.52 INCHES
RECORDED. THERE WERE 16 DAYS WITH MEASURABLE PRECIPITATION.

SNOWFALL FOR THE MONTH WAS 24.6 INCHES...10.4 INCHES ABOVE NORMAL.
THIS RANKS AS THE 9TH SNOWIEST FEBRUARY ON RECORD AND THE SECOND
YEAR IN A ROW WHERE FEBRUARY SNOWFALL EXCEEDED 24 INCHES.


MARCH

...WHAT A DIFFERENCE A YEAR MAKES...

MARCH 2013 WAS A COLD MONTH WITH ABOVE NORMAL SNOWFALL AND BELOW
NORMAL PRECIPITATION. THIS WAS A DRASTIC DIFFERENCE FROM MARCH 2012
WHICH SAW NUMEROUS RECORDS FOR WARMTH BROKEN...INCLUDING RECORD HIGH
TEMPERATURES ON NINE CONSECUTIVE DAYS AND NINE CONSECUTIVE DAYS WITH
HIGH TEMPERATURES AT OR ABOVE 70. MARCH 2013 DID NOT SEE A SINGLE
DAY WITH A HIGH TEMPERATURE OF 60 DEGREES. THERE WERE ONLY 5 DAYS
WITH AN AVERAGE TEMPERATURE ABOVE NORMAL AND 15 STRAIGHT DAYS WITH
AN AVERAGE TEMPERATURE BELOW NORMAL.

THE AVERAGE MONTHLY TEMPERATURE THIS MARCH WAS 32.0...5.5 DEGREES
BELOW NORMAL. THIS RANKED AS THE 16TH COLDEST MARCH ON RECORD. IN
CONTRAST...MARCH 2012 WAS THE WARMEST MARCH ON RECORD WITH A MONTHLY
AVERAGE TEMPERATURE OF 52.8 DEGREES. THIS DIFFERENCE OF 20.8 DEGREES
BETWEEN MONTHLY AVERAGE TEMPERATURES IN MARCH 2012 VS 2013 IS THE
GREATEST DIFFERENCE BETWEEN ANY MONTHLY AVERAGE TEMPERATURE FOR THE
SAME MONTH IN CONSECUTIVE YEARS.

THE HIGHEST TEMPERATURE THIS MONTH WAS 59 ON THE 10TH AND 31ST AND
THE COLDEST TEMPERATURE WAS 13 ON THE 8TH. IN MARCH 2012...THE
HIGHEST TEMPERATURE WAS A RECORD 85 DEGREES.

PRECIPITATION FOR THE MONTH WAS JUST 1.26 INCHES...1.16 INCHES BELOW
NORMAL. THIS RANKED AS THE 13TH DRIEST MARCH ON RECORD.
IRONICALLY...MORE PRECIPITATION FELL IN MARCH 2012...1.67 INCHES...
WHEN IT WAS WARMER AND CONSIDERED BY MANY TO BE MORE PLEASANT
COMPARED TO THIS MARCH. MEASURABLE PRECIPITATION THIS MONTH WAS
RECORDED ON 12 DAYS WHILE A TRACE OR MORE WAS RECORDED ON 22 DAYS.
DESPITE 70 PERCENT OF THE DAYS HAVING SOME FORM OF
PRECIPITATION...ONLY 2 DAYS HAD A TENTH OR MORE. THE HIGHEST DAILY
PRECIPITATION TOTAL WAS 0.72 INCHES ON THE 5TH.

EVEN THOUGH PRECIPITATION WAS BELOW NORMAL...SNOWFALL WAS ABOVE
NORMAL THIS MONTH. A TOTAL OF 12.2 INCHES WAS RECORDED...5.1 INCHES
ABOVE NORMAL. THIS RANKED AS THE 29TH SNOWIEST MARCH.

APRIL

...VERY WET MONTH WITH BELOW NORMAL TEMPERATURES...

APRIL 2013 WAS A COLD MONTH WITH MUCH ABOVE NORMAL PRECIPITATION AND
BELOW NORMAL SNOWFALL ACROSS THE AREA. AFTER A SNOWY MARCH...APRIL
WAS CHARACTERIZED BY MORE TYPICAL SPRING-LIKE WEATHER SYSTEMS
THAT CAUSED DRASTIC SWINGS IN TEMPERATURES AND SEVERAL ROUNDS OF
HEAVY RAINFALL. THIS HEAVY RAINFALL LED TO WIDESPREAD FLOODING OF
RIVERS AND LOW LYING AREAS DURING THE LAST HALF OF THE MONTH AND
ERADICATED ANY REMAINING ABNORMALLY DRY AREAS ON THE US DROUGHT
MONITOR.

THE AVERAGE MONTHLY TEMPERATURE AT SOUTH BEND FOR APRIL WAS 46.8
DEGREES...2.2 DEGREES BELOW NORMAL. THIS RANKED AS THE 31ST COLDEST
APRIL ON RECORD. THE HIGHEST TEMPERATURE THIS MONTH WAS 81 ON THE
30TH AND THE COLDEST TEMPERATURE WAS 18 ON THE 3RD.

PRECIPITATION FOR THE MONTH WAS 5.30 INCHES...2.07 INCHES ABOVE
NORMAL. THIS RANKED AS THE 17TH WETTEST APRIL ON RECORD. MEASURABLE
PRECIPITATION THIS MONTH WAS RECORDED ON 15 DAYS WHILE A TRACE OR
MORE WAS RECORDED ON 20 DAYS. THE HIGHEST DAILY PRECIPITATION TOTAL
WAS 1.39 INCHES ON THE 10TH-11TH.

ONLY A TRACE OF SNOWFALL WAS RECORDED AT SOUTH BEND FOR THE MONTH OF
APRIL. THIS WAS 1.4 INCHES BELOW NORMAL. A TRACE OF SNOWFALL WAS
ACTUALLY RECORDED ON 5 DAYS.


MAY

...A DRY BEGINNING BUT A WET ENDING TO MAY...

MAY BEGAN WARM AND VERY DRY AFTER A COOL AND WET APRIL. JUST A
QUARTER OF AN INCH OF RAIN FELL BETWEEN THE FIRST AND THE 20TH OF
MAY BUT NEARLY THREE INCHES OF RAIN FELL BETWEEN THE 21ST AND 31ST.
THERE WAS ALSO A LACK OF SEVERE WEATHER THROUGHOUT THE
MONTH...HOWEVER A SERIES OF THUNDERSTORM COMPLEXES OVER THE LAST
THREE DAYS OF THE MONTH BROUGHT DAMAGING WINDS AND FLASH FLOODING TO
PORTIONS OF THE REGION.

HIGH TEMPERATURES WERE ABOVE 70 DEGREES DURING THE FIRST
NINE DAYS OF THE MONTH AND HIGHS WERE AT OR ABOVE 70 ON 23 DAYS
DURING THE MONTH. DESPITE BEING A RELATIVELY WARM MONTH...THERE WAS
A LARGE CONTRAST IN TEMPERATURES. THE WARMEST HIGH TEMPERATURE WAS
90 ON THE 20TH WHILE THE COOLEST HIGH TEMPERATURE WAS JUST 50
DEGREES ON THE 12TH. THERE WAS A LOW TEMPERATURE RECORD TIED AS
WELL. THE LOW ON MAY 13TH WAS 30 DEGREES...TYING THE OLD RECORD SET
IN 1996 AND 1928. ON MAY 21ST...A RECORD WARM LOW TEMPERATURE OF 70
DEGREES OCCURRED...TYING THE OLD RECORD SET IN 1911.

THE AVERAGE MONTHLY TEMPERATURE FOR MAY WAS 62.9 DEGREES...3.6
DEGREES ABOVE NORMAL. THIS RANKS AS THE T-21ST WARMEST MAY ON
RECORD. PRECIPITATION FOR THE MONTH WAS 3.25 INCHES...0.58 INCHES
BELOW NORMAL. THIS RANKS AS THE 58TH DRIEST MAY ON RECORD.

JUNE

...TYPICAL JUNE WEATHER AT SOUTH BEND...

WHAT A DIFFERENCE A YEAR MAKES! AT THIS TIME IN JUNE 2012...THE AREA
WAS SUFFERING FROM AN EXTENSIVE DROUGHT WITH A HEAT WAVE THAT SAW
TEMPERATURES HIT THE TRIPLE DIGIT MARK. THIS JUNE STARTED WITH
COOLER TEMPERATURES AND BELOW NORMAL RAINFALL AND ENDED WITH A WEEK
OF ABOVE NORMAL TEMPERATURES AND SEVERAL ROUNDS OF SEVERE WEATHER
AND HEAVY RAINFALL.

THE AVERAGE MONTHLY TEMPERATURE FOR JUNE WAS 69.0 DEGREES...0.1
DEGREES BELOW NORMAL. THIS RANKED AS THE 53RD COLDEST JUNE ON
RECORD. THE HIGHEST TEMPERATURE THIS MONTH WAS 89 ON THE 12TH. THIS
MARKED THE FIRST JUNE WITHOUT A 90 DEGREE DAY SINCE JUNE 1993. THIS
WAS ALSO IN CONTRAST FROM JUNE 2012 WHICH SAW 9 90 DEGREE DAYS! THE
COLDEST TEMPERATURE WAS 39 ON THE 3RD.

PRECIPITATION FOR THE MONTH WAS 3.43 INCHES...0.36 INCHES BELOW
NORMAL. THIS DOES NOT RANK IN THE TOP 50 WETTEST OR DRIEST JUNES ON
RECORD. MEASURABLE PRECIPITATION THIS MONTH WAS RECORDED ON 15 DAYS
WHILE A TRACE OR MORE WAS RECORDED ON 18 DAYS. NO DAY SAW AN INCH OF
PRECIPITATION OR MORE THIS MONTH WITH THE HIGHEST DAILY
PRECIPITATION TOTAL OF 0.93 INCHES ON THE 25TH.

JULY

...A RELATIVELY COOL JULY WITH BELOW NORMAL RAINFALL AT SOUTH BEND...

THE MONTH OF JULY BEGAN AND ENDED WITH A STRING OF BELOW NORMAL
TEMPERATURES...WITH THE STRING AT THE END OF THE MONTH BEING A
RECORD. THERE WAS A BRIEF HEAT WAVE WITH HIGH HUMIDITY IN THE
MIDDLE OF THE MONTH. HIGH TEMPERATURES REACHED THE MIDDLE 90S DURING
THIS STRETCH WHILE LOW TEMPERATURES REMAINED IN THE LOWER TO MIDDLE
70S.

THE FIRST FIVE DAYS OF JULY EXPERIENCED BELOW NORMAL AVERAGE
TEMPERATURES...AND THE FIRST 80 DEGREE DAY OF THE MONTH DIDN`T OCCUR
UNTIL THE 5TH. JULY ENDED WITH THE LAST NINE DAYS BEING BELOW NORMAL
WITH HIGH TEMPERATURES BELOW 80 DEGREES ON EACH DAY. THIS BROKE THE
JULY RECORD FOR CONSECUTIVE NUMBER OF DAYS WITH HIGH TEMPERATURES
BELOW 80 DEGREES. THE PREVIOUS RECORD WAS 8 ENDING ON JULY 27 1992
AND JULY 12 1918. THERE WERE A TOTAL OF 18 DAYS THIS MONTH WITH
AVERAGE TEMPERATURES BELOW NORMAL. A RECORD LOW TEMPERATURE WAS TIED
ON THE 24TH WITH A LOW OF 50...WHICH WAS ALSO THE COOLEST
TEMPERATURE OF THE MONTH. RECORD LOW HIGH TEMPERATURES WERE SET ON
THE 2ND AND 28TH AS WELL.

THE HEAT WAVE BEGAN AROUND JULY 14TH AND ENDED ON THE 19TH. THERE
WERE 4 DAYS OF TEMPERATURES AT OR ABOVE 90 WITH THE HOTTEST
TEMPERATURE OF 94 OCCURRING ON THE 19TH. THE LOW TEMPERATURE ON THIS
DAY ONLY DROPPED TO 76 DEGREES. THE AVERAGE TEMPERATURE ON THIS DAY
WAS 85...MAKING IT THE HOTTEST DAY OF THE YEAR SO FAR. IT WAS ALSO A
VERY MUGGY PERIOD AS DEW POINTS WERE GENERALLY IN THE LOWER TO
MIDDLE 70S. THIS ALLOWED HEAT INDICES TO CLIMB INTO THE UPPER 90S
AND LOWER 100S.

THE AVERAGE MONTHLY TEMPERATURE AT SOUTH BEND WAS 71.8 WHICH WAS 1.2
DEGREES BELOW NORMAL. THIS RANKED AS THE 38TH COOLEST JULY ON
RECORD. THE ONE WEEK OF HEAT IN THE MIDDLE OF THE MONTH HELPED RAISE
THE OVERALL AVERAGE TEMPERATURE. JULY 2009 WAS THE COOLEST JULY ON
RECORD WITH AN AVERAGE MONTHLY TEMPERATURE OF 68.3 DEGREES.

JULY PRECIPITATION WAS 3.16 INCHES...0.84 INCHES BELOW NORMAL. THIS
RANKED AS THE 62ND DRIEST JULY ON RECORD. MEASURABLE PRECIPITATION
FELL ON 10 DAYS WITH 8 DAYS SEEING A TENTH OF AN INCH OR GREATER AND
4 DAYS WITH A HALF INCH OR GREATER. THE GREATEST 24 HOUR
PRECIPITATION FELL ON JULY 21ST AND 22ND WHEN 0.79 INCHES WAS
RECORDED. WHILE JULY PRECIPITATION WAS BELOW NORMAL...THE RAINFALL
WAS SPACED OUT OVER THE MONTH. THE GREATEST NUMBER OF DAYS WITH NO
MEASURABLE PRECIPITATION AT SOUTH BEND WAS JUST 5 DAYS BETWEEN JULY
3RD AND JULY 7TH AND AGAIN FROM JULY 10TH TO JULY 14TH.
HOWEVER...THE PERIOD JULY 10TH THROUGH JULY JULY 17TH ONLY SAW 0.01
INCHES OF PRECIPITATION.

AUGUST

...RELATIVELY COOL AND DRY IN AUGUST AT SOUTH BEND...

ALTHOUGH AUGUST ENDED WITH A STRETCH OF WARMER WEATHER...THE MONTH
AS A WHOLE WAS CHARACTERIZED BY BELOW NORMAL TEMPERATURES AT SOUTH
BEND. THE FIRST 24 DAYS OF THE MONTH ONLY HAD 3 DAYS WITH A HIGH
TEMPERATURE ABOVE 82 DEGREES. THE TEMPERATURE DID NOT REACH 90
DEGREES ON ANY OF THE FIRST 24 DAYS...AND 12 OF THESE DAYS HAD HIGH
TEMPERATURES THAT DID NOT REACH 80 DEGREES. THE COOLEST HIGH
TEMPERATURE FOR THE MONTH WAS 69 DEGREES ON THE 13TH.

THE LAST 7 DAYS OF THE MONTH WERE MUCH WARMER AT SOUTH BEND...WITH
THE HIGH TEMPERATURE REACHING 80 DEGREES EVERY DAY DURING THIS
STRETCH...AND AT LEAST 85 DEGREES 6 OUT OF THE 7 DAYS. THE HIGH
TEMPERATURE REACHED 93 DEGREES ON BOTH THE 27TH AND 30TH...BECOMING
ONLY THE 6TH AND 7TH 90 DEGREE DAYS OF 2013.

THE AVERAGE TEMPERATURE FOR AUGUST AT SOUTH BEND WAS 70.4
DEGREES...WHICH IS 0.9 DEGREES BELOW NORMAL. THIS TIES WITH 1970 AND
2008 AS THE 38TH COOLEST AUGUST ON RECORD. THIS IS THE THIRD
CONSECUTIVE MONTH OF BELOW NORMAL AVERAGE TEMPERATURES AT SOUTH
BEND. THE HIGHEST TEMPERATURE FOR THE MONTH WAS 93 ON THE 27TH AND
30TH...AND THE COLDEST TEMPERATURE WAS 46 ON THE 14TH.

3.03 INCHES OF PRECIPITATION FELL AT SOUTH BEND IN AUGUST...WHICH IS
0.73 INCHES BELOW NORMAL. THIS IS THE 48TH DRIEST AUGUST ON RECORD.
MEASURABLE PRECIPITATION FELL ON ONLY 7 DAYS...WITH THE HIGHEST 24
HOUR RAINFALL TOTAL OF 1.28 INCHES ON THE 7TH. THIS WAS ALSO THE
FOURTH CONSECUTIVE MONTH WITH BELOW NORMAL PRECIPITATION AT SOUTH
BEND.

SEPTEMBER

...A RELATIVELY WARM AND SURPRISINGLY WET SEPTEMBER...

SEPTEMBER ENDED WITH ABOVE NORMAL TEMPERATURES AND ABOVE NORMAL
PRECIPITATION...BUT MOST OF THE PRECIPITATION FELL ON JUST ONE
DAY...SEPTEMBER 19TH. THERE WERE 10 DAYS WITH BELOW NORMAL
TEMPERATURES AND JUST ONE DAY WITH AN AVERAGE TEMPERATURE OF MORE
THAN 9 DEGREES BELOW NORMAL...SEPTEMBER 14TH. THERE WAS ONE VERY
WARM STRETCH WHICH HELPED BOOST THE AVERAGE MONTHLY TEMPERATURE TO
ABOVE NORMAL...THAT WAS FROM SEPTEMBER 9TH THROUGH SEPTEMBER 11TH.
DURING THIS STRETCH...HIGH TEMPERATURES WERE IN THE 90S EACH DAY.

SEPTEMBER 10TH WAS THE WARMEST DAY OF THE MONTH AND YEAR WITH A HIGH
OF 97 AND A LOW OF 74...MAKING THE AVERAGE TEMPERATURE 20 DEGREES
ABOVE NORMAL. THERE HAVE ONLY BEEN 13 PREVIOUS YEARS IN WHICH THE
HIGHEST TEMPERATURE OF THE YEAR OCCURRED IN SEPTEMBER. THE LAST TIME
WAS IN 2008. THIS DATE ALSO TIED WITH 1900 AS THE THIRD LATEST DAY
FOR THE HIGHEST TEMPERATURE OF THE YEAR. SEPTEMBER 19TH 1906 IS THE
LATEST DATE FOR THE HIGHEST TEMPERATURE AND THE HIGH WAS 95 ON THAT
DATE.

THE AVERAGE MONTHLY TEMPERATURE FOR SEPTEMBER WAS 65.6...1.7 DEGREES
ABOVE NORMAL. THIS TIES 1985 FOR THE 34TH WARMEST SEPTEMBER ON
RECORD DATING BACK TO 1893. THE AVERAGE HIGH TEMPERATURE WAS
77.1...3.1 DEGREES ABOVE NORMAL. THE AVERAGE LOW TEMPERATURE WAS
54.1...JUST 0.4 DEGREES ABOVE NORMAL. THERE WERE 3 DAYS WITH HIGHS
AT OR ABOVE 90. THE COLDEST TEMPERATURE OF THE MONTH WAS 40 WHICH
OCCURRED ON SEPTEMBER 14TH AND 23RD.

PRECIPITATION WAS 4.12 INCHES...0.59 INCHES ABOVE NORMAL.
HOWEVER...3.59 INCHES FELL IN THE 24 HOUR PERIOD ON THE 18TH AND
19TH. THE DAILY TOTAL ON THE 19TH WAS 3.44 INCHES. THIS BROKE THE
OLD RECORD FOR THE DATE OF 2.24 INCHES SET IN 1960. THIS ALSO RANKED
AS THE 11TH WETTEST DAY ON RECORD. SEPTEMBER 2013 RANKED AS THE 35TH
WETTEST SEPTEMBER ON RECORD.

OCTOBER

...A WET END TO AN OTHERWISE QUIET OCTOBER...

OCTOBER 2013 HAD A VERY WARM START AT SOUTH BEND...WITH THE FIRST 5
DAYS OF THE MONTH HAVING AN AVERAGE TEMPERATURE OF 11 DEGREES OR
MORE ABOVE NORMAL. AFTER NEAR NORMAL TEMPERATURES THROUGH THE MIDDLE
PART OF THE MONTH...A PATTERN SHIFT BROUGHT WELL BELOW NORMAL
TEMPERATURES TO THE REGION BEGINNING ON THE 22ND. THIS HELPED
TRIGGER LAKE EFFECT MIXED PRECIPITATION OVER A FOUR DAY PERIOD...WITH
SOME AREAS ACROSS MICHIANA RECEIVING THEIR FIRST ACCUMULATING
SNOWFALL OF THE SEASON.

AN INTERESTING STATISTIC FROM THIS WILD SWING IN TEMPERATURES: THERE
WERE ONLY 18 DAYS BETWEEN 80 DEGREE TEMPERATURES AND FREEZING
TEMPERATURES. THE LAST 80 DEGREE DAY OF THE MONTH OCCURRED ON THE
4TH...AND THE FIRST FREEZE OF THE SEASON OCCURRED ON THE 22ND. THE
HIGHEST TEMPERATURE OF THE MONTH WAS 82 DEGREES WHICH OCCURRED ON
THE 2ND...AND THE LOWEST TEMPERATURE OF THE MONTH WAS 28 WHICH
OCCURRED ON THE 25TH. OVERALL...THE AVERAGE TEMPERATURE FOR THE
MONTH OF OCTOBER ENDED UP SLIGHTLY ABOVE NORMAL AT SOUTH BEND. THE
AVERAGE TEMPERATURE WAS 53.5 DEGREES...WHICH IS 1.4 DEGREES ABOVE
NORMAL. THIS RANKS AS THE 44TH WARMEST OCTOBER ON RECORD.

THE MONTH OF OCTOBER WAS RELATIVELY DRY FOR THE FIRST 29 DAYS...WITH
ONLY 2.15 INCHES OF PRECIPITATION. HOWEVER...A STRONG FALL STORM
TRACKED TOWARD THE GREAT LAKES REGION OVER THE LAST TWO DAYS OF THE
MONTH...BRINGING AN INCH OR MORE OF RAINFALL ON EACH OF THE LAST TWO
DAYS OF THE MONTH. THE TOTAL PRECIPITATION FOR THE MONTH WAS 4.35
INCHES...WHICH IS 1.03 INCHES ABOVE NORMAL. THIS RANKS AS THE 28TH
WETTEST OCTOBER ON RECORD. MEASURABLE RAINFALL FELL ON 12 DAYS
DURING OCTOBER...WITH THE GREATEST 24 HOUR RAINFALL TOTAL BEING 2.00
WHICH FELL ON THE 30TH AND 31ST.


NOVEMBER

...A COLD AND SNOWY NOVEMBER...

OVERALL NOVEMBER WAS COLDER THAN NORMAL WITH BELOW NORMAL
PRECIPITATION BUT ABOVE NORMAL SNOWFALL. MOST OF THE SNOWFALL WAS
ATTRIBUTED TO LAKE EFFECT SNOW...WITH THE HEAVIEST AMOUNTS
FALLING ON THE 26TH AND 27TH AT THE OFFICIAL REPORTING SITE IN SOUTH
BEND. THIS EVENT PRODUCED 12 TO 16 INCHES OF SNOW ACROSS BERRIEN
COUNTY AND EXTREME WESTERN CASS COUNTY IN MICHIGAN AND 10 TO 12
INCHES ACROSS NORTH CENTRAL ST. JOSEPH COUNTY IN INDIANA. A SWATH OF
4 TO 7 INCHES OF SNOW FELL OVER MUCH OF MARSHALL...NORTHEAST STARKE
AND FAR EASTERN LAPORTE COUNTIES.

THE FIRST SIGNIFICANT LAKE EFFECT SNOW EVENT ACTUALLY OCCURRED A FEW
WEEKS EARLIER ON THE 11TH AND 12TH. HEAVY LAKE EFFECT SNOW FROM THIS
EVENT FELL OVER MOST OF BERRIEN AND LAPORTE COUNTIES AS WELL AS
PORTIONS OF WESTERN ST. JOSEPH COUNTY AND STARKE COUNTY IN INDIANA.
A MAXIMUM OF 17 INCHES FELL IN ST. JOSEPH MICHIGAN WHILE THE
OFFICIAL SOUTH BEND OBSERVATION WAS JUST 1.8 INCHES ON THE EASTERN
FLANK OF THIS HEAVY SNOW BAND.

SANDWICHED BETWEEN THESE SIGNIFICANT LAKE EFFECT SNOW EVENTS WAS A
RECORD SETTING SEVERE WEATHER AND TORNADO OUTBREAK ACROSS INDIANA.
FOLLOWING THE FIRST BRIEF ARCTIC PLUNGE ON THE 11TH AND
12TH...TEMPERATURES WARMED QUICKLY WITH HIGHS BACK INTO THE 60S BY
THE 16TH. THE WARMEST DAY OF THE MONTH CAME ON THE 17TH WHEN HIGHS
REACHED 65 AT SOUTH BEND AHEAD OF A POTENT COLD FRONT. THIS FRONT
WAS ASSOCIATED WITH A PRELIMINARY COUNT OF 28 TORNADOES ACROSS
INDIANA...BREAKING THE RECORD FOR MOST TORNADOES IN A SINGLE DAY IN
NOVEMBER AND BEING THE THIRD MOST TORNADOES FOR ANY DAY OF THE YEAR
IN INDIANA. THE CLOSEST TORNADO TO SOUTH BEND WAS AN EF1 TORNADO IN
CASSOPOLIS MICHIGAN.

THE AVERAGE MONTHLY TEMPERATURE WAS 38.4...2.3 DEGREES BELOW NORMAL.
THIS RANKS AS THE 35TH COOLEST NOVEMBER ON RECORD DATING BACK TO 1894.
THE HIGHEST TEMPERATURE WAS 65 ON THE 17TH AND THE COLDEST WAS 18 ON
THE 13TH. THERE WERE 6 DAYS WITH TEMPERATURES REMAINING AT OR BELOW
32 DEGREES. THIS TIED FOR 5TH PLACE FOR NUMBER OF NOVEMBER DAYS WITH
HIGH TEMPERATURES BELOW FREEZING.

PRECIPITATION FOR NOVEMBER WAS 2.63 INCHES...0.64 INCHES
BELOW NORMAL. THIS RANKED AS THE 61ST DRIEST NOVEMBER ON RECORD. THE
OFFICIAL SNOWFALL WAS 8.9 INCHES...4.1 INCHES ABOVE NORMAL. THIS
RANKED AS THE 32ND SNOWIEST NOVEMBER. 1977 HOLDS THE RECORD FOR
SNOWIEST NOVEMBER ON RECORD WITH 30.3 INCHES. PARTS OF THE MICHIANA
REGION ACTUALLY SAW MUCH MORE SNOWFALL FROM THE LAKE EFFECT EVENTS.
SOME LOCATIONS IN BERRIEN COUNTY HAVE ALREADY SEEN BETWEEN TWO AND
THREE FEET OF SNOW.


DECEMBER

...A COLD MONTH WITH NEAR NORMAL PRECIPITATION...

DECEMBER WAS ANOTHER COLD MONTH WITH NEAR NORMAL PRECIPITATION. THE
MONTH ACTUALLY BEGAN RELATIVELY MILD WITH HIGH TEMPERATURES IN THE
40S AND 50S FOR THE FIRST 5 DAYS. THE HIGHEST TEMPERATURE OF THE
MONTH WAS 59 ON THE 4TH. THIS OCCURRED AHEAD OF A
STRONG ARCTIC COLD FRONT WHICH HELPED ESTABLISH THE VERY COLD AIR
FOR MUCH OF THE REMAINDER OF DECEMBER. AVERAGE DAILY TEMPERATURES
BETWEEN THE 6TH AND 18TH WERE ALL BELOW NORMAL AND 8 OF THESE DAYS
HAD TEMPERATURES AT LEAST 10 DEGREES BELOW NORMAL. TEMPERATURES DID
MODERATE BRIEFLY FROM THE 19TH TO THE 22ND BUT THIS PERIOD ALSO
EXPERIENCED MODERATE TO HEAVY RAINFALL WHICH RESULTED IN MODERATE
FLOODING ACROSS THE LOCAL AREA. 0.72 INCHES OF PRECIPITATION OCCURRED ON
THE 21ST. THE AVERAGE TEMPERATURE FOR DECEMBER WAS 26.1 DEGREES...2.7 DEGREES
BELOW NORMAL. THIS RANKED AS THE 37TH COLDEST DECEMBER ON RECORD.
THE COLDEST TEMPERATURE OF THE MONTH WAS -3 DEGREES ON THE 12TH.

PRECIPITATION FOR THE MONTH WAS 2.33 INCHES...0.28 INCHES BELOW
NORMAL. THIS RANKED AS THE 56TH DRIEST DECEMBER ON RECORD. SNOWFALL
FOR DECEMBER WAS MISSING.
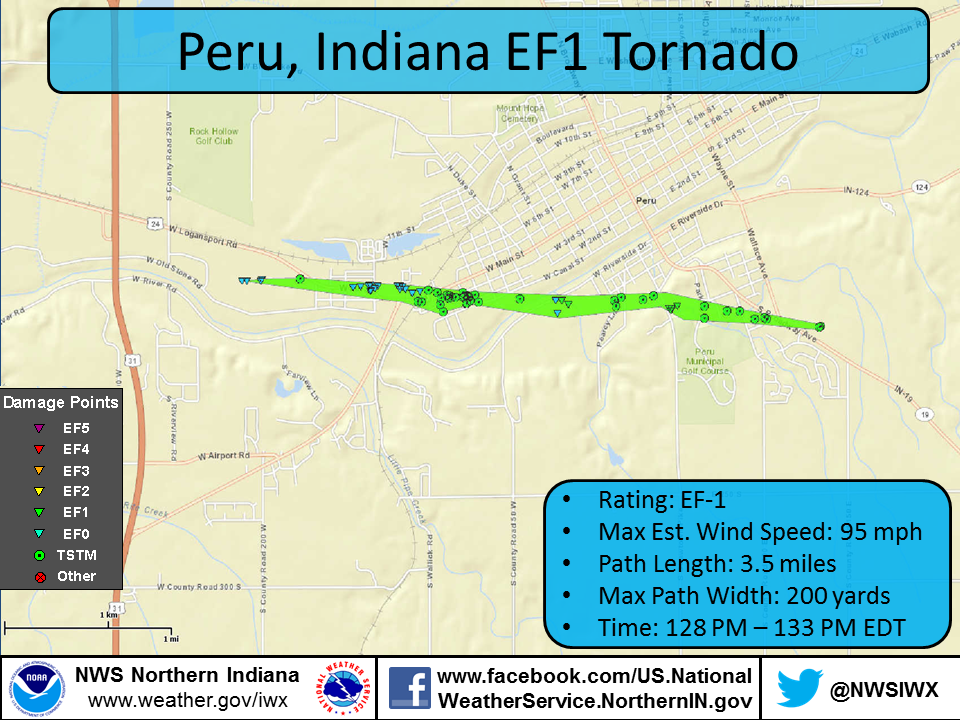
After only 1 tornado in 2012, 2013 was quite active with 23 tornadoes recorded across the NWS Northern Indiana County Warning Area (CWA), 6 EF0, 10 EF1, 6 EF2 and 1 EF3 on the Enhanced Fujita Scale (EF scale). The map below shows the locations, dates and EF rating of every tornado in 2013 across the CWA.

Month by Month Review
January
|
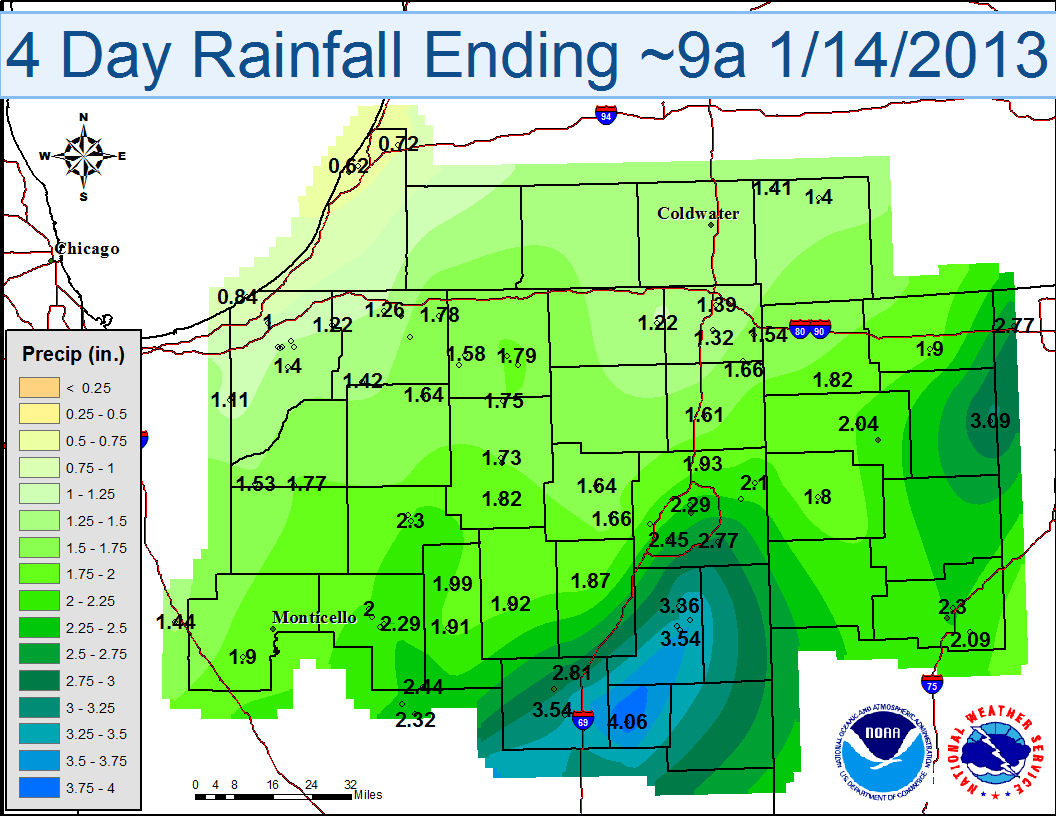
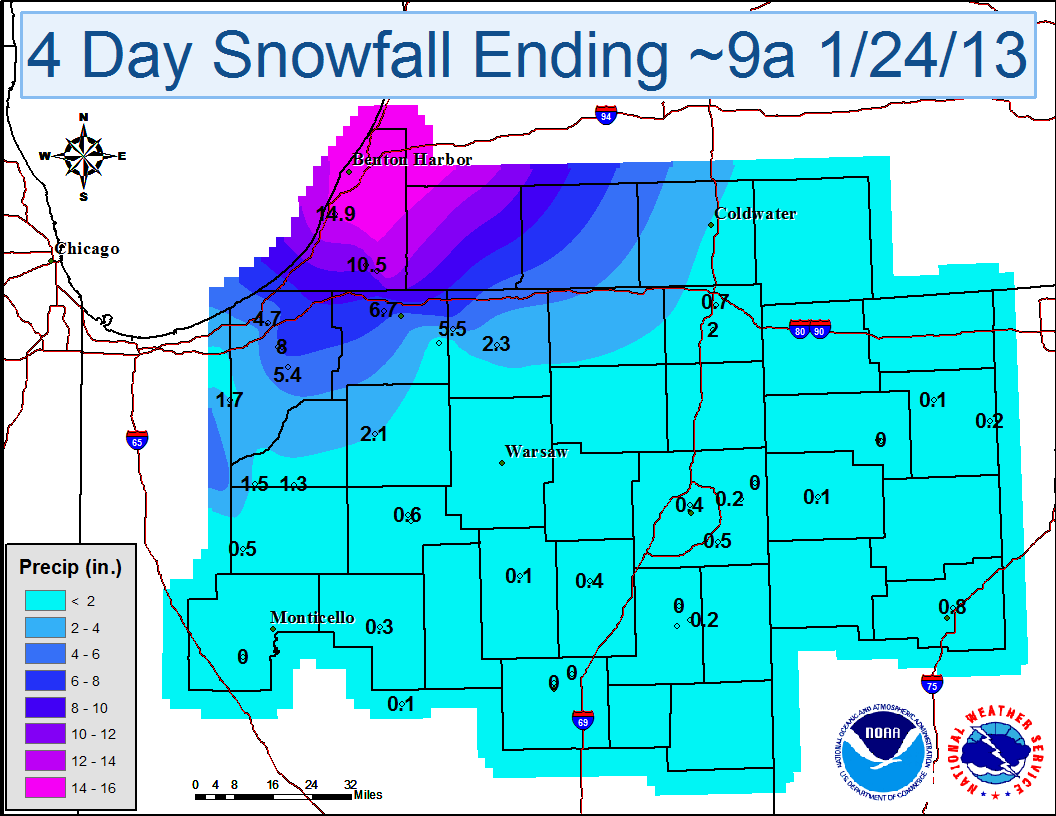
January 2013 was a roller coaster month with dramatic ups and downs in temperatures. The roller coaster ride began with temperatures slightly below normal and dry conditions to start the month. A thaw occurred during the second week as temperatures topped out in the 50s by the 12th. This warm-up was also accompnaied by over an inch of much needed rainfall. More seasonable temperatures returned by mid-month. Snowfall through the third week was well below normal until the first significant arctic outbreak of the season brought much colder temperatures and lake effect snowfall. Some locations in lower Michigan received a foot of snow or more. Another significant warming trend began on the 27th with tempeatures nearing 60 degrees by the 29th. A second arctic rush quickly followed for the end of the month with temperatures plummeting into the teens. Moderate to heavy rainfall fell ahead of this arctic cold front and lake effect snowfall of over 4 inches followed in its wake. The month ended up with above normal temperatures, above normal rainfall, and below normal snowfall.
|
|
A series of strong low pressure systems moved through the Great Lakes during a four day span. These systems brought between one and four inches of rain to the area. This heavy rainfall, coupled with snow melt in southeastern areas caused minor to moderate flooding along some area rivers.
|
 |
|
Cold temperatures and persistent northwesterly flow caused significant snowfall accumulations in areas downwind of Lake Michigan. We received some reports of locally higher amounts, but generally 6-12 inches of snow was common across Berrien and Cass counties in Michigan and La Porte and St. Joseph counties in Indiana.
|
 |
February
|
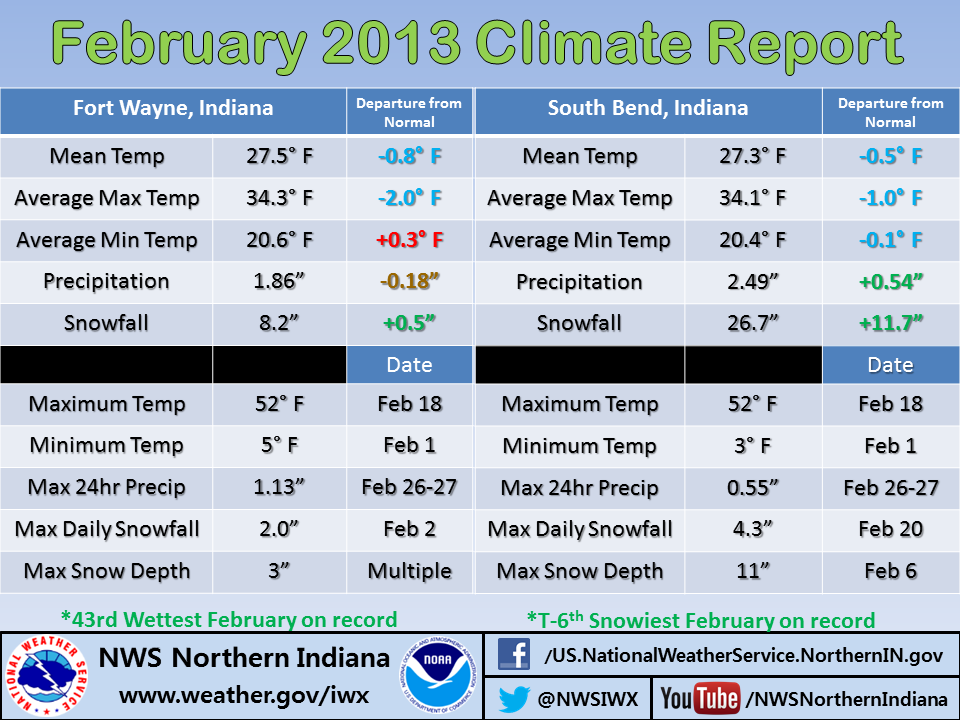
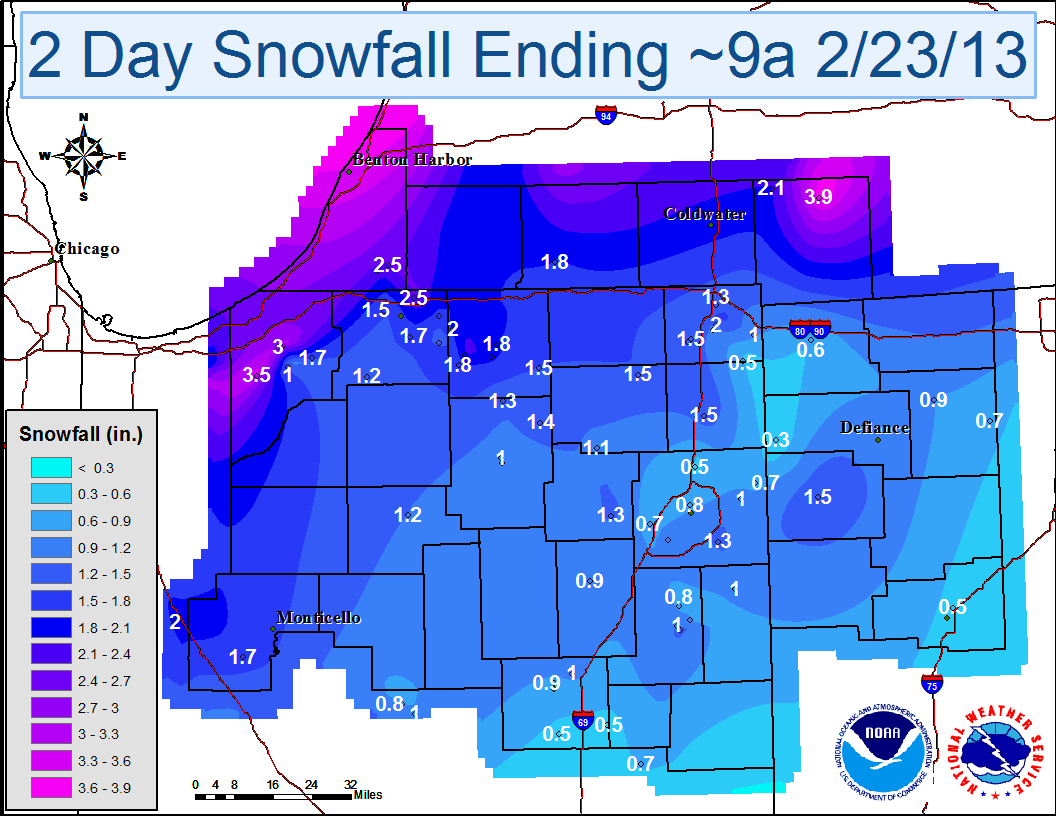
After a warm and wet January, February saw a weather pattern more typical of winter across most of the United States. Several strong winter storms impacted the country starting with a crippling blizzard and heavy snow over the Atlantic Seaboard and ending with 2 potent blizzards over the central US. The local area was left in the middle with a combination of residual snowfall from the Midwest storms and several weaker clipper systems which brought rain and snow to the region. While temperatures over the month averaged slightly below normal, there were brief periods of bitter cold air as well as mild air. The month ended with below normal precipitation and snowfall at Fort Wayne and near normal preciptation and above normal snowfall at South Bend.
|
|
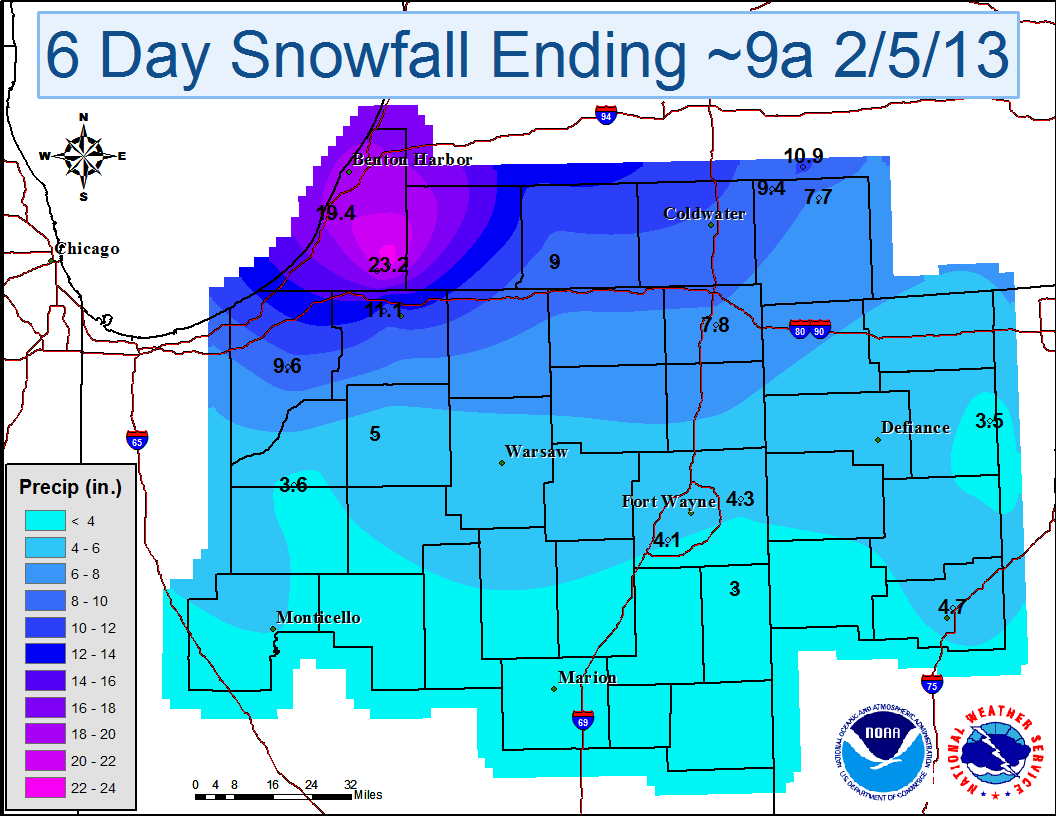
After a warmer than average January, February began with much colder temperatures and snow. System and lake-effect snow combined to give some locations in the northwest over a foot of snow in the first 5 days of the month.
|
 |
|
A strong winter storm system moved from the Plains into the Midwest overnight on February 21st into the daylight hours on February 22nd. With subfreezing temperatures, freezing rain and at times sleet, mixed in with snow to create hazardous travel conditions across the local area. Snowfall totals across the area were generally in the 1 to 3 inch range, with ice accumulations of 0.10 inch or less. Thunder and lightning were also reported during the early morning hours in several locations due to the powerful dynamics of the storm system!
|
 |
|
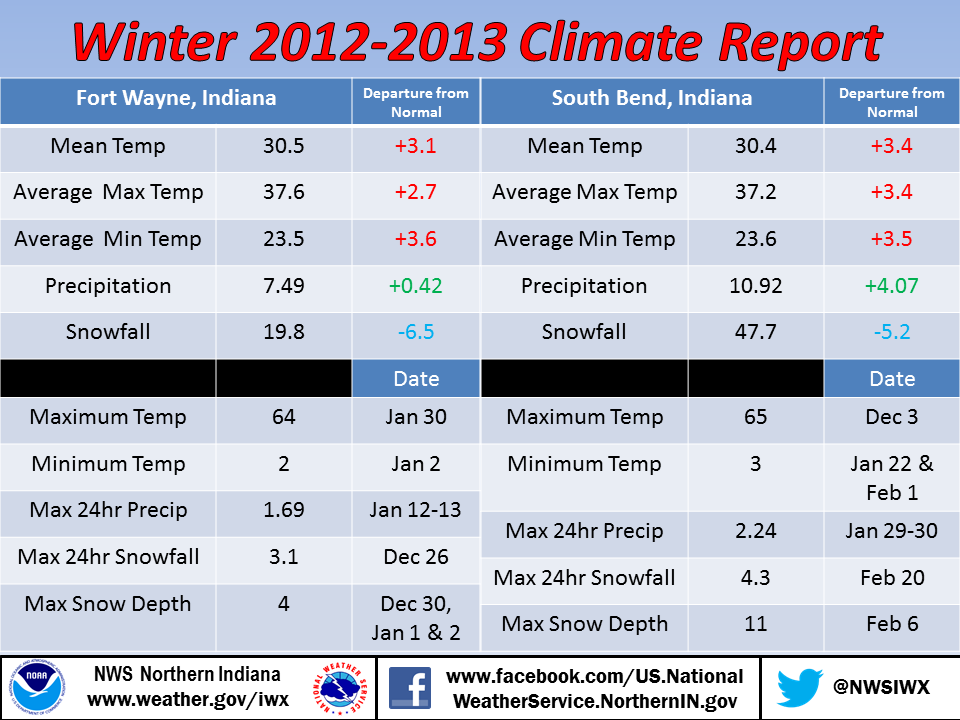
The winter of 2012-2013 (December-February) was characterized by above normal temperatures across the area. Due to warmer temperatures, much of the precipitation fell as rain instead of snow. Fort Wayne received only 19.8 inches of snowfall, which was 6.5 inches below normal. South Bend received only 47.7 inches of snowfall, which was 5.2 inches below normal.
|
 |
March
|
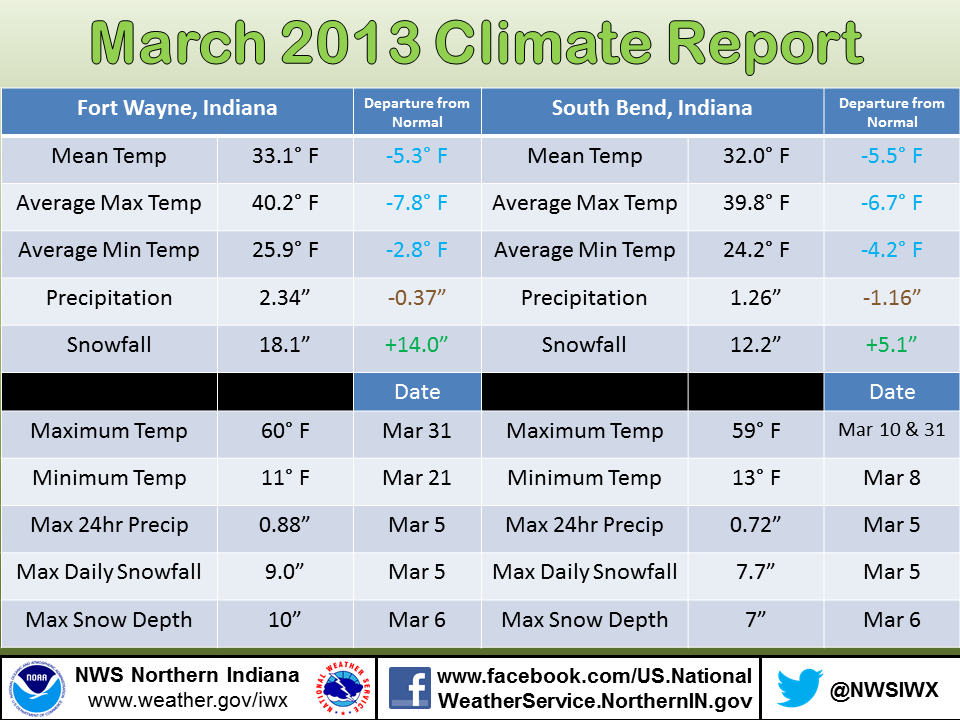
March 2013 was a cold month with above normal snowfall and below normal precipitation. This was a drastic difference from March 2012 which saw numerous records for warmth broken with 9 consecutive days with high temperatures above 70°. March 2013 did not see a single day with temperatures above 60° and only 5 days with an average temperatures above normal.
|
|
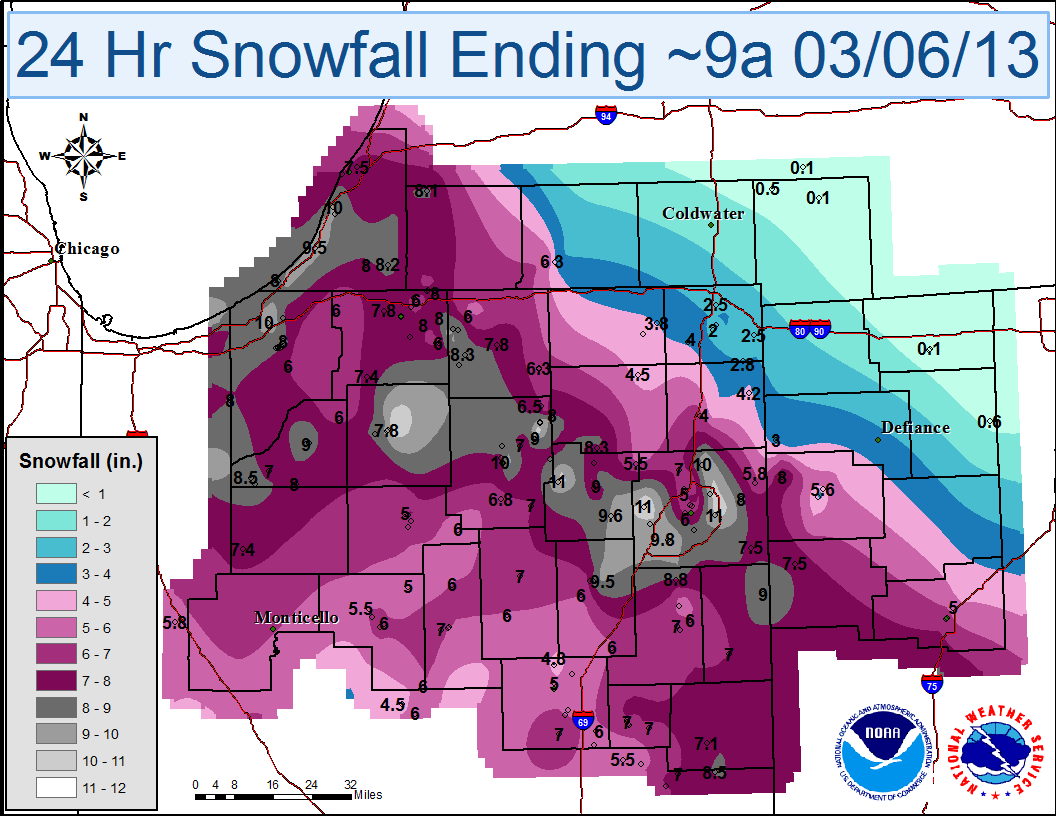
A strong low pressure system developed across the northern Plains and intensified as it moved across the Ohio Valley and middle Mississippi Valley on March 5th, 2013. Heavy snow developed across the region and impacted the local area beginning during the afternoon of March 5th and continued overnight into the early morning hours of March 6th.
|
 |
|
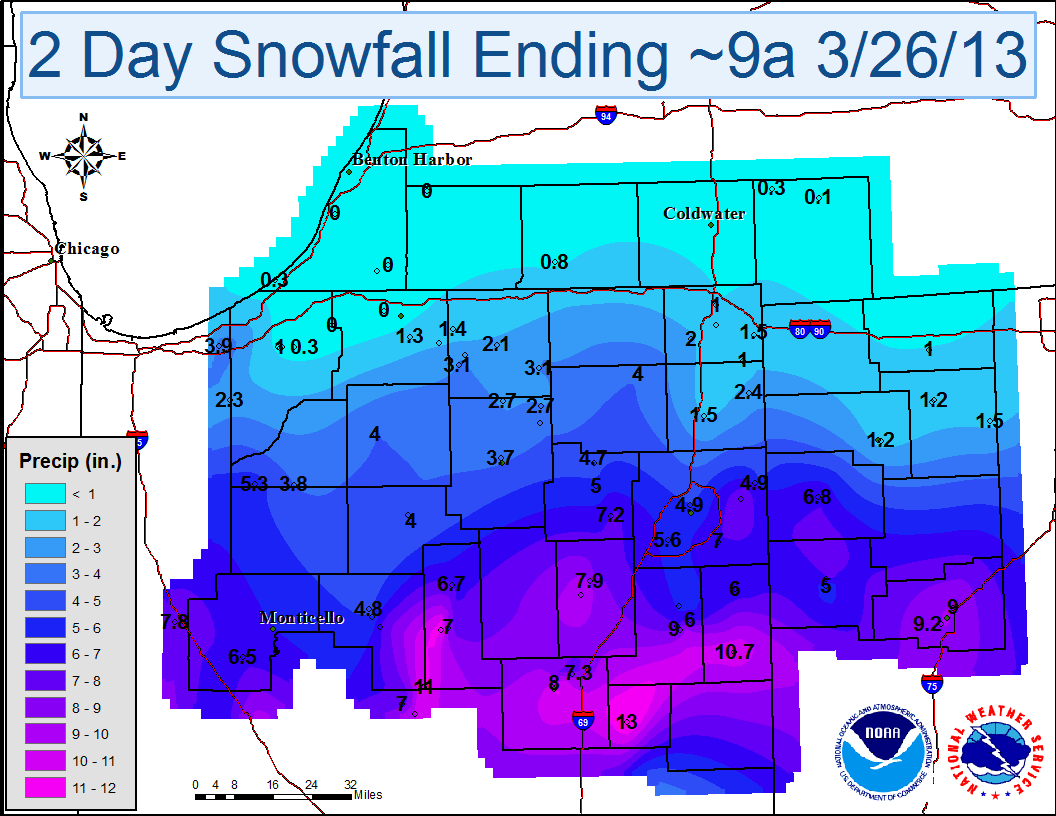
An early spring snowstorm blanketed portions of the local area overnight on March 24th into the morning hours of March 25th. The local area was on the northern fringe of the heaviest snow across the region as a strong low pressure system moved northeast from the central Plains into the Ohio Valley.
|
 |
|
Below average temperatures across the local area lasted for almost the entire month of March 2013, outside of a few days. This was in stark contrast to March 2012, when much above average temperatures resided over the area and numerous all-time temperatures records were set.
|
 |
April
|
April 2013 was a cold, rainy month. After a snowy March, April was characterized by more typical spring-like weather systems that caused drastic swings in temperatures and several rounds of heavy rainfall. This heavy rainfall led to widespread flooding of rivers and low lying areas during the last half of the month and eradicated any remaining abnormally dry areas on the U.S. Drought Monitor. It was the 3rd wettest April on record at Fort Wayne with 7.10 inchesm just 0.09 inches short of the record set in 1944!
|
|
A large low pressure system and associated warm and cold fronts brought several rounds of heavy rainfall to the local area from April 16th into the morning of April 19th, 2013. This heavy rainfall caused minor to major river flooding and flooding of other low-lying areas, creeks, ditches, and streams.
|
 |
May
|
May 2013 began warm and very dry after a cool and wet April. Despite being a warm month, there was a large contrast in temperatures. There was also a lack of severe weather throughout the month, but a series of thunderstorm complexes over the last three days of the month brought damaging winds and flash flooding to portions of the area.
|
|
Training thunderstorms formed along an outflow boundary on the night of May 31st and dropped an incredible amount of rainfall to portions of the forecast area. A swath through the central portion of the area saw between 2 to 5 inches of rainfall with a few locations near 5.5 inches!
|
 |
June
|
What a difference a year makes! In June 2012, the area was suffering from an extensive drought with a heat wave that saw temperatures hit the triple digit mark. June 2013 started with cooler temperatures and below normal rainfall and ended with a week of abnove normal temperatures and several rounds of severe weather and heavy rainfall. June also saw the first 90 degree day of the year at Fort Wayne. This marked a noticeable difference from June 2012 which saw 12 90+ degree days. South Bend failed to reach 90 degrees during the month, which marked the first June without a 90 degree day snice June 1993.
|
|
A combination of supercell thunderstorms and bowing line segments, with many areas of rotation, moved through northern Indiana and northwest Ohio during the evening and overnight hours of Wednesday, June 12, 2013. Overnight and into the early hours of Thursday morning, June 13, the storms organized into a forward propapgating MCS (Mesoscale Convective System) as it progressed eastward to the coast.
|
 |
|
An active period of weather impacted the NWS Northern Indiana area during Saturday, June 22nd to Thursday, June 27th, 2013. During this period, several rounds of showers and thunderstorms moved across the local area. Some of these storms became severe, producing damaging winds, large hail, and torrential downpours.
|
 |
July
|
The month of July 2013 began and ended with a string of below normal temperatures, with the string at the end of the month being a record. There was a brief heat wave with high humidity in the middle of the month where high temperatures reached the low 90s and low temperatures remained in the 70s.
|
|
A strong cold front moved through the local area during the early afternoon hours on Wednesday July 10th, 2013. Moderate to extreme instability ahead of the cold front allowed for thunderstorms to fire and rapidly become severe as they merged into a line of thunderstorms that moved east/southeast from northern Indiana over into northwest Ohio. This line of severe thunderstorms continued east into Pennsylvania before weakening on the East Coast.
|
 |
|
A heat wave began around July 14th and ended on the 19th. There were days with temperatures at or above 90 degrees with the hottest temperatures occuring on the 18th and 19th. It was also a very muggy period as dew points were generally in the low to mid 70s.
|
 |
|
July ended with a stretch of below normal temperatures with high temperatures below 80 degrees each day. This broke the July record for consecutive number of days with high temperatures below 80 degree days.
|
 |
August
|
Although August 2013 ended with a stretch of warmer weather, the month as a whole was characterized by below normal temperatures. Fort Wayne experienced its 11th wettest August on record with 5.08 inches of rain. Over half of this total fell on the first 3 days of the month with 3.59 inches falling on the 2nd. That ranked as the 9th wettest calendar day on record. South Bend saw only 3.03 inches of rain, below normal for the month. This was the 4th consecutive month with below normal precipitation at South Bend.

|
|
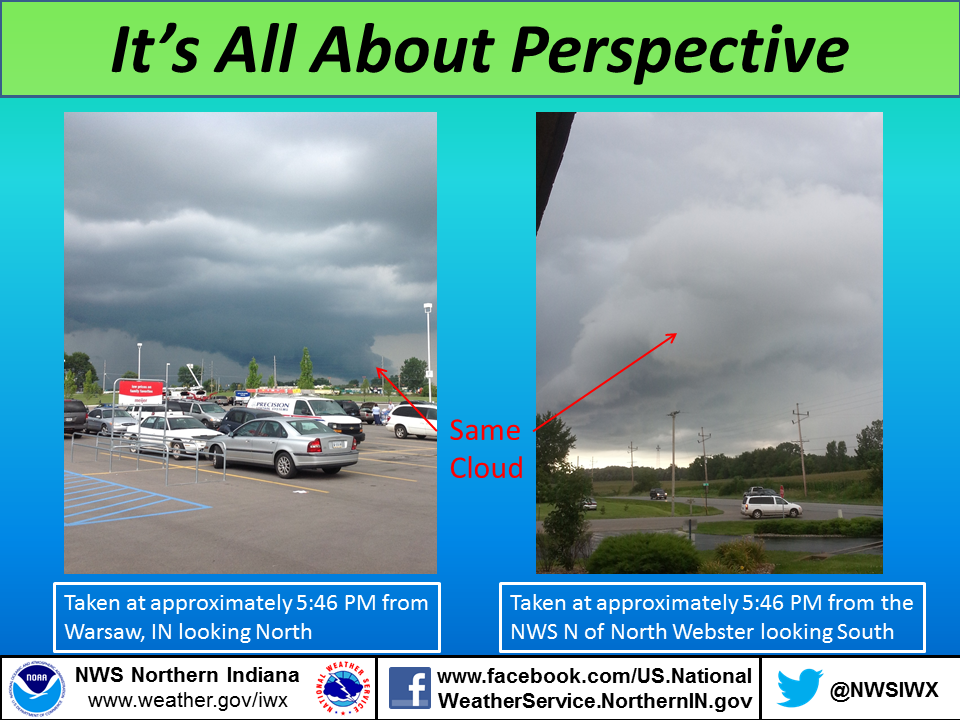
Thunderstorms fired ahead of a cold front across the local area during the afternoon and evening hours on Wednesday, August 7th. While most of the storms remained below severe limits with mainly heavy rainfall and frequent lightning, a few of the storms did pulse up briefly to severe levels and a few damaging wind gusts. We also received reports that tornado sirens were sounded in the Goshen area due to public reports of a funnel cloud and/or tornado. These turned out to be false reports as low-hanging clouds were mistaken for a funnel cloud.
|
 |
|
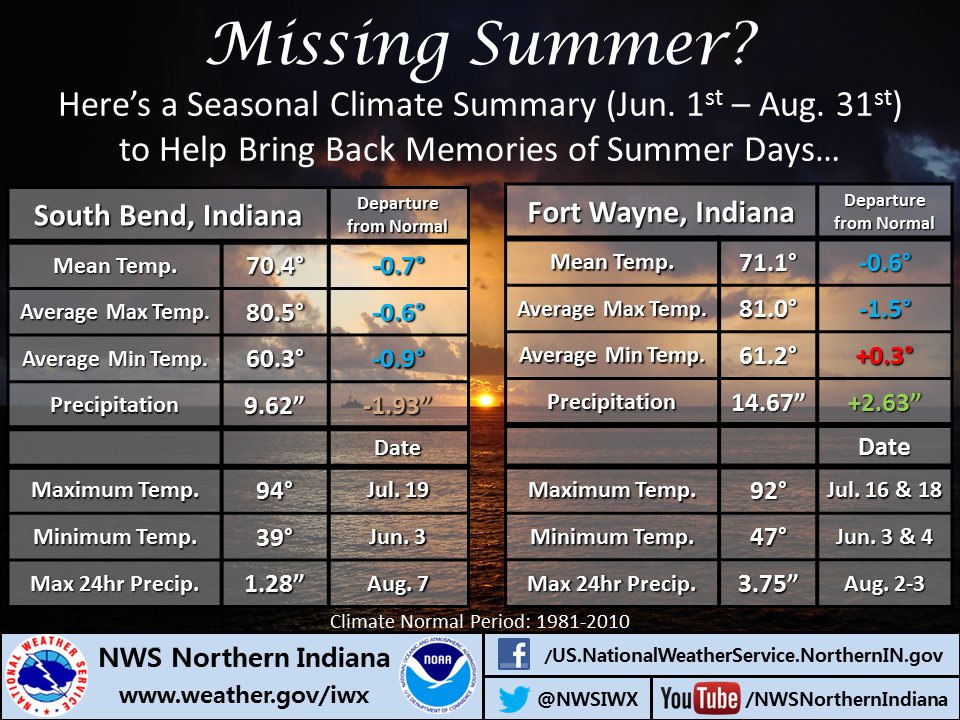
Overall the summer of 2013 will be remembered as a relatively mild summer with a few streaks of hot weather. Despiate numerous days with average temperatures below normal, the overall summer ended just a degree below normal thanks to a few stretches of very hot weather. Fort Wayne saw above normal precipitation in June and August while July was below normal. Most of the August precipitation fell in teh first 3 days, skewing the monthly total. Most of August was very dry. South Bend saw below normal precipitation each month. These drier conditions began to show in the U.S. Drought Monitor as abnormally dry conidtions expanded across the region in late August.
|
 |
September
|
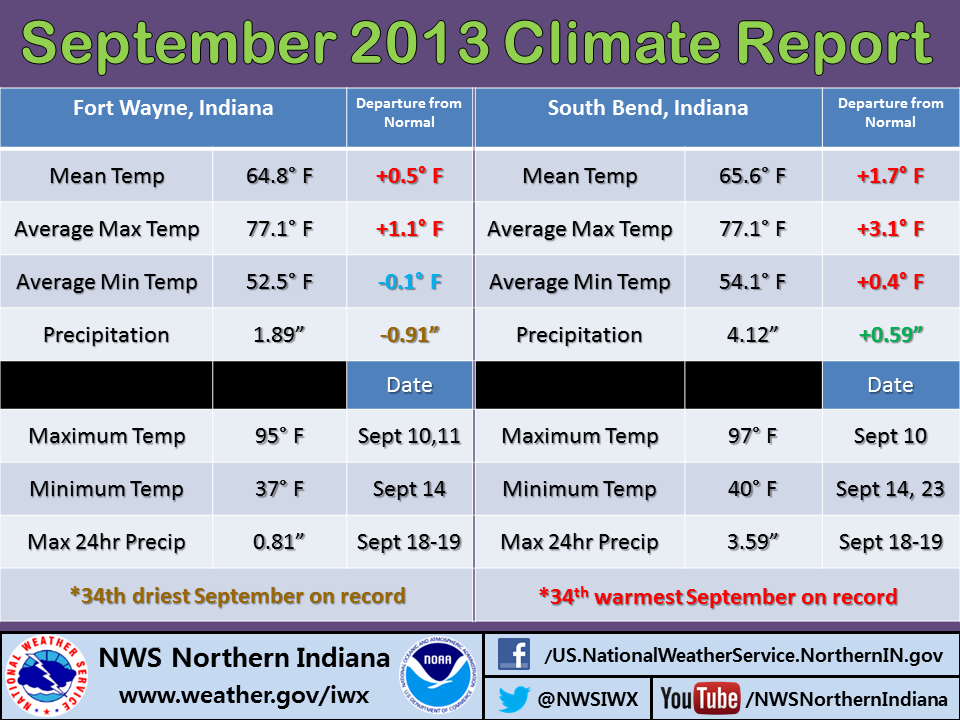
September 2013 was a relatively warm month. There was one very warm stretch which helped boost the average monthly temperature to above normal, from September 9th through September 11th. High temperatures were in the 90s each day. September 10 was the warmest day of the month and of the year at South Bend with a high of 97 and a low of 74. It was also the hottest day of the yer at Fort Wayne with a high of 95 and a low of 73. There have only been 13 previous years at South Bend and 9 previous years at Fort Wayne in which the highest temperature of the year occurred in September. The month ended up with below normal precipitation at Fort Wayne and above normal precipitation at South Bend, but most of that precipitation fell in just one day.
|
|
A ridge of high pressure across the central and eastern United States brought a blast of late summer heat to the northern Indiana, southwest lower Michigan and northwest Ohio areas. This brought a return to temperatures in 90s.
|
 |
October
|
October 2013 had a wet end to an otherwise quiet month. The month got off to a very warm start with several days of above average temperatures (10 degrees or more). After near normal temperatures through the middle part of the month, a pattern shift brought well-below normal temperatures to the area beginning on the 22nd. There were only 10 days between 80 degree temperatures and freezing temperatures. The pattern shift helped bring mixed precipitation over a four day period, with some areas receiving their first accumulating snowfall of the season. The start of the month was very dry, however a strong fall storm tracked toward the Great Lakes region over the last two days of the month, making for a very wet Halloween.
|
|
A strong low pressure system and associated cold front moved across the region on the night of October 30th through October 31st, 2013. The system brought heavy rainfall to the local area with storm total precipitation in the 1 to 3.5 inch range. It was the wettest Halloween on record at Fort Wayne with 1.73" and the 2nd wettest at South Bend with 1.20." Gusty winds of 25-45 mph also accompanied the system, making for a wet and windy Halloween.
|
 |
November
|
November 2013 was a cold month with below normal precipitation and snowfall at Fort Wayne and above normal snowfall at South Bend. Most of the snowfall was due to lake effect snow. The month was characterized by several large swings in temperatures as two strong arctic cold fronts brought very cold temperatures and lake effect snow into the area. Sandwiched between these arctic instrusions was a brief but signficant warm-up which led to a record-setting severe weather and tornado outbreak across Indiana. 28 tornados were confirmed across the state, breaking the record for most tornadoes in a single day in November and was the third most tornadoes for any day of the year.
|
|
An arctic cold front dropped southeast across the local area during the afternoon and evening hours of November 11, 2013. The system brought widespread rainfall to the area which quickly changed to snow as colder air from the northwest wrapped into the system. Most locations received a dusting to 1.5 inches of a wet snow accumulation with the system. Temperatures quickly dropped from the mid 40s into the 20s as the front exited the area. Lake effect snow then developed over southeastern Lake Michigan in northerly flow behind the front.
|
 |
|
A strong low pressure system moved through the region on November 17, 2013. Storms began to fire in central Illinois ahead of a strong cold front during the early afternoon hours and quickly reached severe limits. Initially, the storms fired as distinct supercells. Eventually, the supercells merged into a squall line that raced across Indiana and into Ohio during the late afternoon to early evening hours. The setup was ideal for severe weather, not to mention a widespread outbreak with multiple tornadoes.
|
 |
|
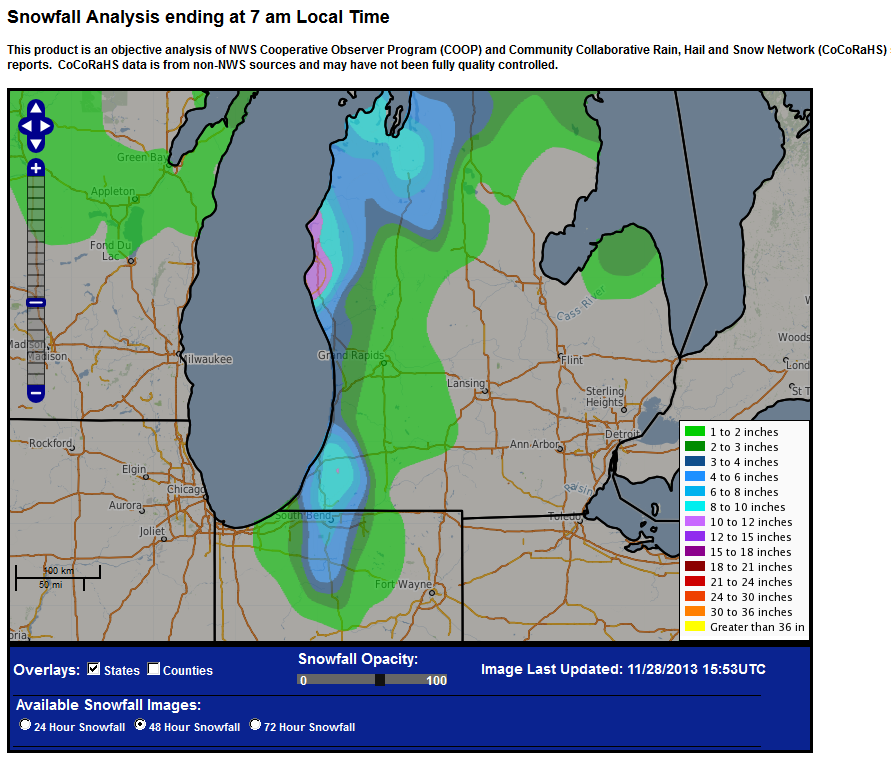
A strong low pressure system moving through the eastern United States late Tuesday evening, November 26th into early Thursday morning, November 28th, helped bring another surge of cold area into the Great Lakes region. As the cold air funneled over the warmer Lake Michigan waters from the north/northwest, heavy lake effect snow showers developed.
|
 |
|
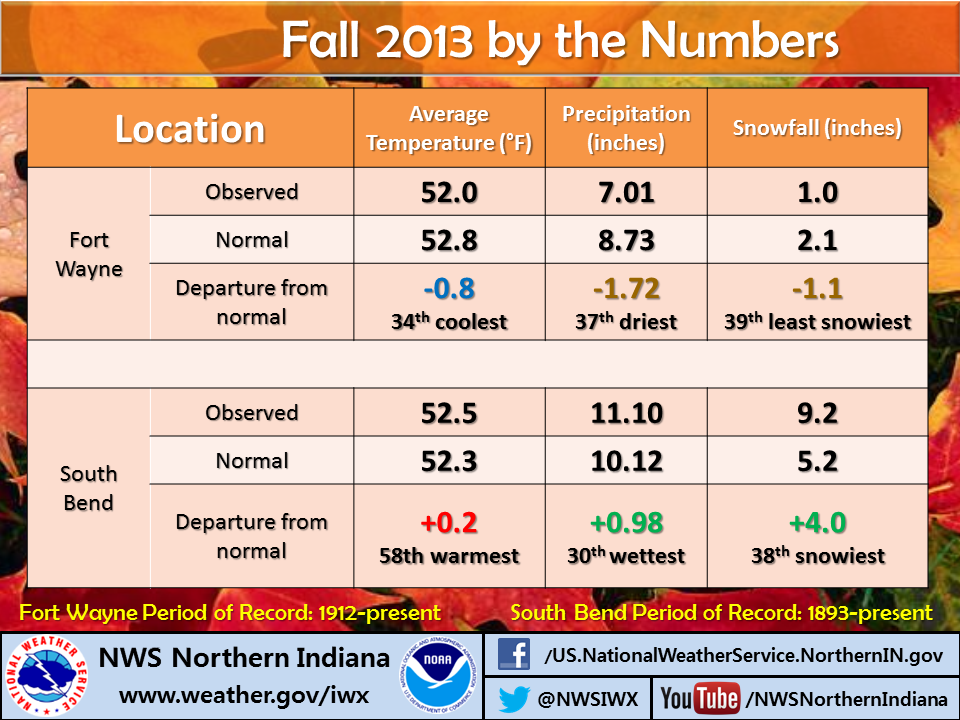
Overall, the fall season of 2013 had slightly below normal temperatures at Fort Wayne and near normal temperatures at South Bend. Precipitation and snowfall was below normal at Fort Wayne and above normal at South Bend.
|
 |
December
|
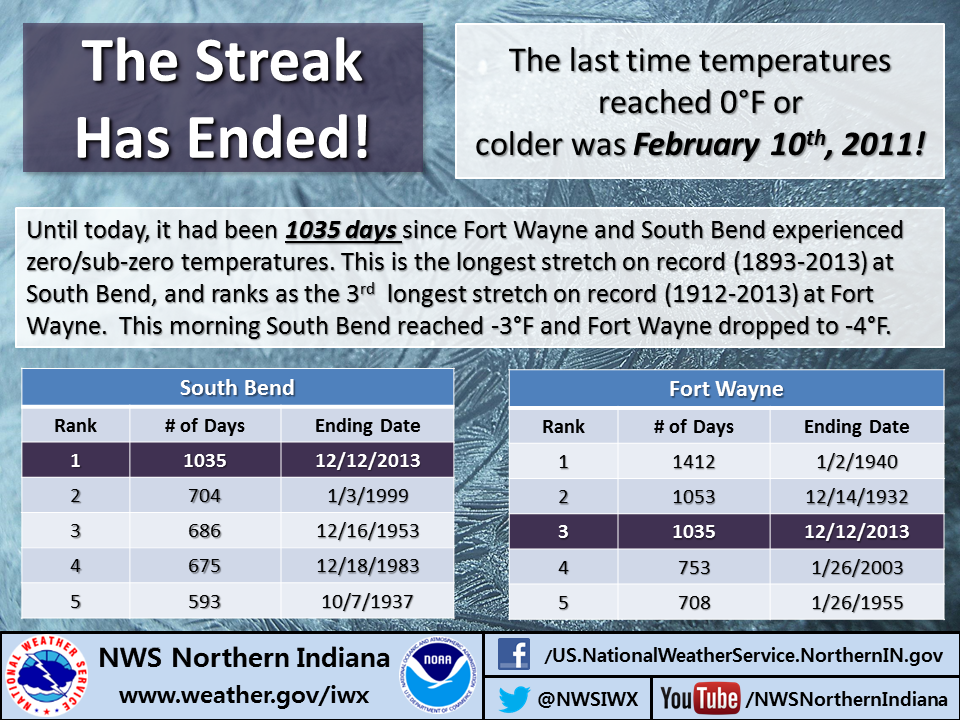
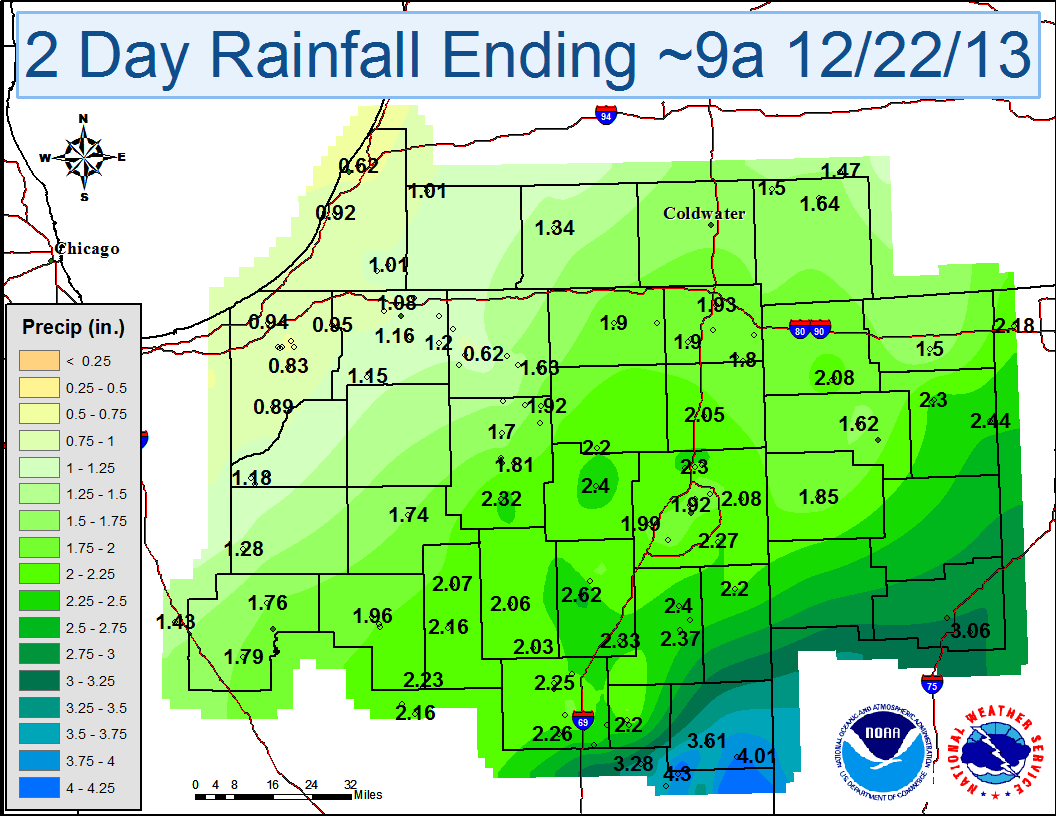
December 2013 was another cold month with near normal precipitation and above normal snowfall. The month acturally began relatively mild with high temperatures in the 40s and 50s for the first 5 days. This occurred ahead of a strtong arctic cold front which helped establish very cold air for the remainder of the month. Heavy rainfall fell from the 19th to the 22nd which melted the existing snowpack and led to moderate flooding across eastern portions of the area.
|
Record Streak for Consecutive Days with Temperatures Above 0 Degrees Ends
|
|
|
A strong low pressure system moved rapidly northeast from Texas into the region. Heavy rainfall fell along the track of the low. This combined with a melting snowpack led to flooding of low lying areas and minor to moderate river flooding.
|
 |
| Records Tied or Broken at Fort Wayne in 2013 |
| DATE |
RECORD TYPE |
NEW RECORD |
OLD RECORD |
OLD DATE |
| 11-Jan-2013 |
DAILY MAX TEMP |
57 |
56 |
1975 |
| 12-Jan-2013 |
DAILY HIGHEST MIN TEMP |
46 |
41 |
2007 |
| 13-Jan-2013 |
DAILY PRECIP |
1.14 |
0.97 |
1937 |
| 29-Jan-2013 |
DAILY HIGHEST MIN TEMP |
44 |
43 |
2006 |
| 30-Jan-2013 |
DAILY MAX TEMP |
64 |
55 |
1988 |
| 5-Mar-2013 |
DAILY MAX SNOWFALL |
9 |
2.2 |
2005 |
| 21-Mar-2013 |
DAILY MIN TEMP |
11 |
12 |
1960 |
| 24-Mar-2013 |
DAILY MAX SNOWFALL |
2.3 |
1.7 |
1912 |
| 9-Apr-2013 |
DAILY MAX TEMP |
81 |
80 |
2001, 1919 |
| 18-Apr-2013 |
DAILY PRECIP |
2.32 |
0.97 |
1978 |
| 27-May-2013 |
DAILY PRECIP |
1.72 |
1.16 |
1985 |
| 28-Jul-2013 |
DAILY LOWEST MAX TEMP |
69 |
71 |
1969, 1925 |
| 31-Jul-2013 |
# of CONSECUTIVE JULY DAYS WITH TEMPS BELOW 80 |
8 |
8 |
Ending 7/30/2004, 7/8/1924 |
| 2-Aug-2013 |
DAILY PRECIP |
3.59 |
1.71 |
1921 |
| 28-Aug-2013 |
DAILY HIGHEST MIN TEMP |
74 |
73 |
1977 |
| 10-Sep-2013 |
DAILY HIGHEST MIN TEMP |
73 |
73 |
1947 |
| 11-Sep-2013 |
DAILY MAX TEMP |
95 |
95 |
1931 |
| 31-Oct-2013 |
DAILY PRECIP |
1.73 |
0.89 |
1932 |
| Records Tied or Broken at South Bend in 2013 |
| DATE |
RECORD TYPE |
NEW RECORD |
OLD RECORD |
OLD DATE |
| 22-Jan-2013 |
DAILY LOWEST MAX TEMP |
9 |
10 |
1961 |
| 29-Jan-2013 |
DAILY PRECIP |
1.94 |
0.65 |
1909 |
| 29-Jan-2013 |
DAILY MAX TEMP |
59 |
58 |
1914 |
| 3-Apr-2013 |
DAILY MIN TEMP |
18 |
18 |
1987 |
| 13-May-2013 |
DAILY MIN TEMP |
30 |
30 |
1996, 1928 |
| 20-May-2013 |
DAILY HIGHEST MIN TEMP |
70 |
70 |
1911 |
| 2-Jul-2013 |
DAILY LOWEST MAX TEMP |
66 |
66 |
1945 |
| 24-Jul-2013 |
DAILY MIN TEMP |
50 |
50 |
1953, 1932, 1904 |
| 28-Jul-2013 |
DAILY LOWEST MAX TEMP |
67 |
68 |
1981, 1928 |
| 31-Jul-2013 |
# of CONSECUTIVE JULY DAYS WITH TEMPS BELOW 80 |
9 |
8 |
Ending 7/27/1992, 7/12/1918 |
| 7-Aug-2013 |
DAILY PRECIP |
1.28 |
1.05 |
1953 |
| 10-Sep-2013 |
DAILY HIGHEST MIN TEMP |
74 |
72 |
1983 |
| 10-Sep-2013 |
DAILY MAX TEMP |
97 |
96 |
1897 |
| 11-Sep-2013 |
DAILY MAX TEMP |
96 |
96 |
1931 |
| 11-Sep-2013 |
DAILY HIGHEST MIN TEMP |
71 |
71 |
1900 |
| 19-Sep-2013 |
DAILY PRECIP |
3.44 |
2.24 |
####### |
| 27-Nov-2013 |
DAILY SNOWFALL |
6.1 |
5.5 |
1980 |
| 12-Dec-2013 |
DAILY MIN TEMP |
-3 |
-3 |
1962, 1958 |
Stay tuned to our website and NOAA Weather Radio for weather information during 2014. Also, interact with NWS Northern Indiana on our Facebook Page, on Twitter @NWSIWX and YouTube.Thanks to our spotters and followers on social media for the reports, photos and information shared with us during 2013. We look forward to your support during 2014!
Page created by: CEO/NG
Last Updated: 4/20/14

