
Dangerous heat expands across the Desert Southwest, Plains, Mississippi Valley and Midwest. Critical fire weather for portions of the Intermountain West. Risk for severe thunderstorms and flash flooding across the Upper Midwest/Great Lakes, Ohio Valley, and portions of the mid-Atlantic. Active monsoonal moisture fuels thunderstorms over the Southwest. Hurricane Fausto in the Pacific, should weaken Read More >
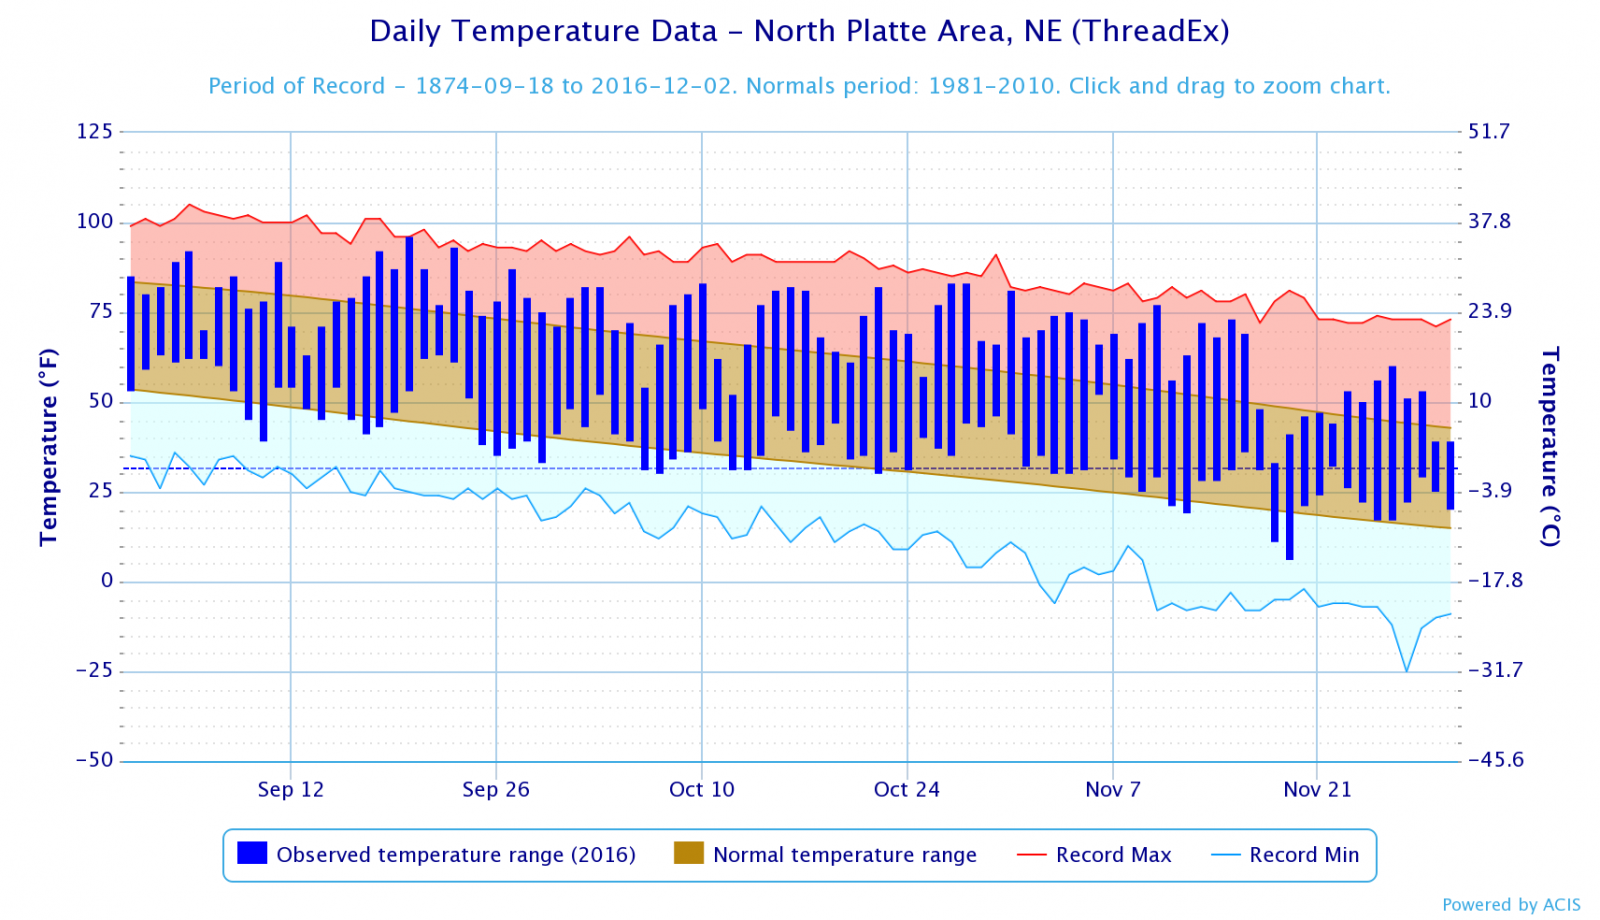
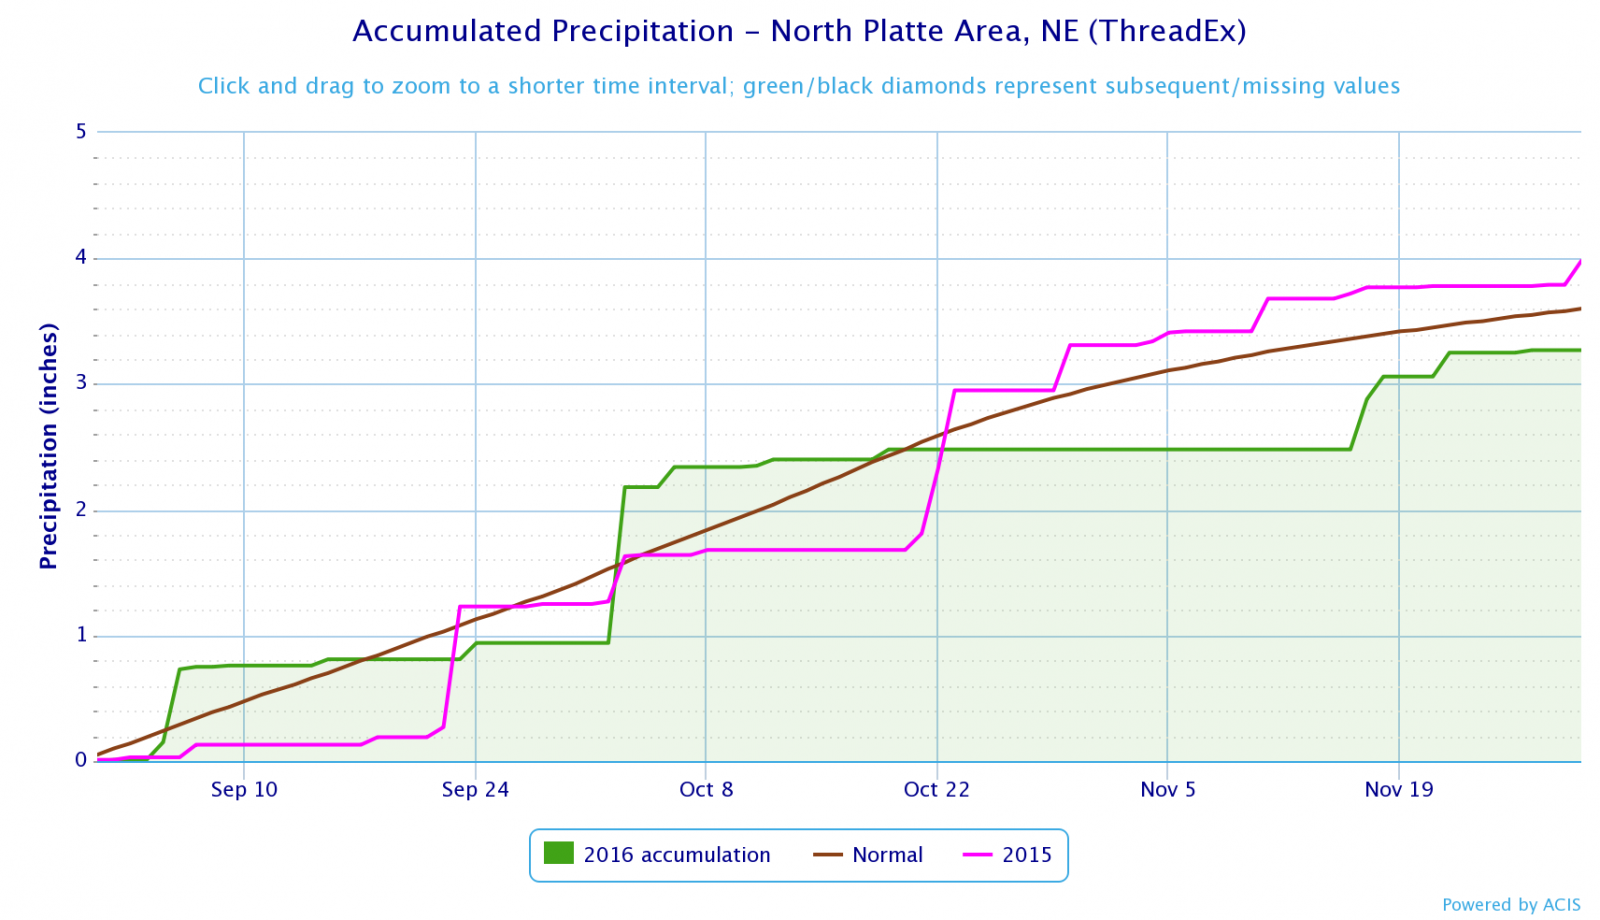
North Platte, NE
Fall Statistics
Facts for the 3 month period of September, October, and November
(including the last 5 years)
| Ave High |
Ave Low |
Ave Temp |
Precip | Snow | Days Lows ≤ 32 |
Days Highs 70+ |
Days Highs 80+ |
|
| Average | 64.7 | 35.7 | 50.2 | 3.22 | 5.1 | 39.1 | 38.6 | 19.0 |
| Max | 70.8 | 40.9 | 55.1 | 9.29 | 30.3 | 55 | 56 | 32 |
| Year | 2016 | 1931 | 1933 | 1946 | 2009 | 1976 | 2016 | 1979 |
| Min | 56.0 | 28.7 | 44.3 | 0.43 | 0 | 23 | 22 | 6 |
| Year | 1985 | 1976 | 1985 | 2012 | 1899 1901 1903 |
1886 | 1883 | 2009 |
| 2012 | 68.0 | 30.9 | 49.4 | 0.43 | 2.7 | 52 | 47 | 22 |
| 2013 | 64.3 | 36.4 | 50.3 | 7.25 | 3.1 | 45 | 30 | 18 |
| 2014 | 65.2 | 33.1 | 49.1 | 2.20 | 0.4 | 41 | 43 | 17 |
| 2015 | 67.8 | 39.6 | 53.7 | 3.98 | 4.6 | 30 | 46 | 25 |
| 2016 | 70.8 | 38.4 | 54.6 | 3.27 | 5.0 | 32 | 56 | 27 |
| Top 10 Finishes for the 2016 Fall (Sep, Oct, Nov) for North Platte | |||||||
| Average High Temp (Warmest) |
Average Temp (Warmest) |
Days Highs 70+ (Most) |
Days Highs 80+ (Most) |
||||
| 1 | 70.8 (2016) | 1 | 55.1 (1933) | 1 | 56 (2016) | 1 | 32 (1979) |
| 2 | 69.9 (1904) | 2 | 54.6 (2016) | 2 | 51 (1953,1938) |
2 | 31 (1897) |
| 3 | 69.5 (1933) | 3 | 54.5 (1931) | 3 | 30 (1953) | ||
| 4 | 69.5 (1939) | 4 | 54.3 (1963) | 4 | 50 (1963) | 4 | 29 (1938,1931) |
| 5 | 69.4 (1914) | 5 | 54.2 (1914) | 5 | 49 (1914) | ||
| 6 | 69.4 (2005) | 6 | 54.2 (1939) | 6 | 48 (2005,1990, 1956,1940, 1931,1921, 1910) |
6 | 28 (2003,1952, 1927,1908) |
| 7 | 69.3 (1963) | 7 | 54.1 (1904) | ||||
| 8 | 69.0 (1990) | 8 | 54.0 (1938) | ||||
| 9 | 68.5 (1922) | 9 | 53.8 (2015) | ||||
| 10 | 68.5 (2007) | 10 | 53.7 (1897) | 10 | 27 (2016,2005, 1956,1947, 1940,1922, 1921,1910) |
||
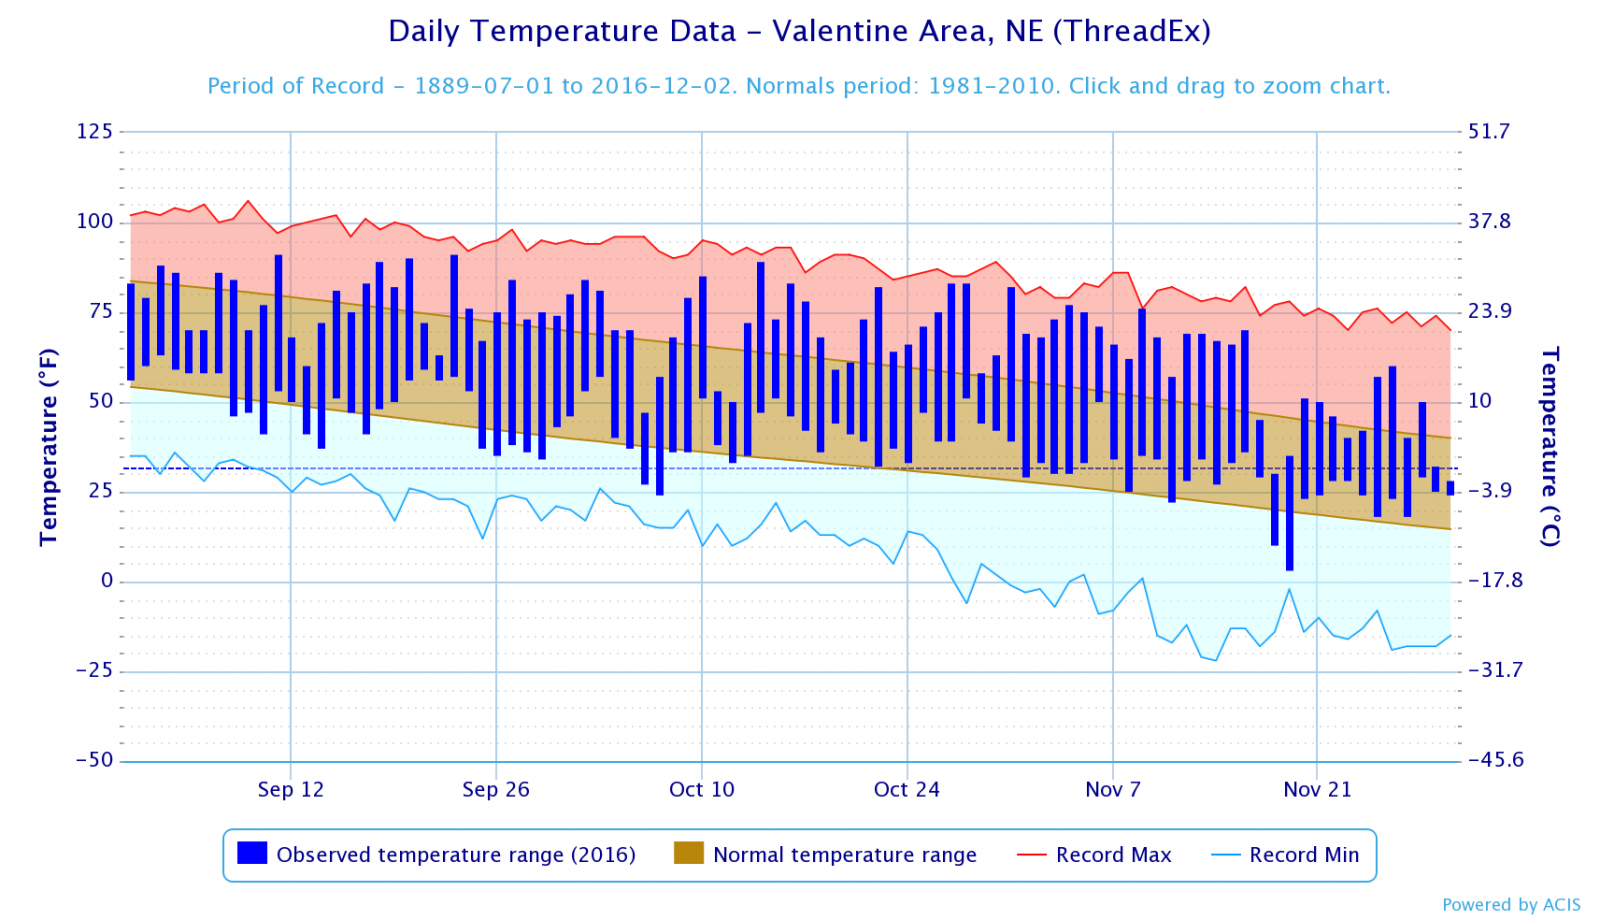
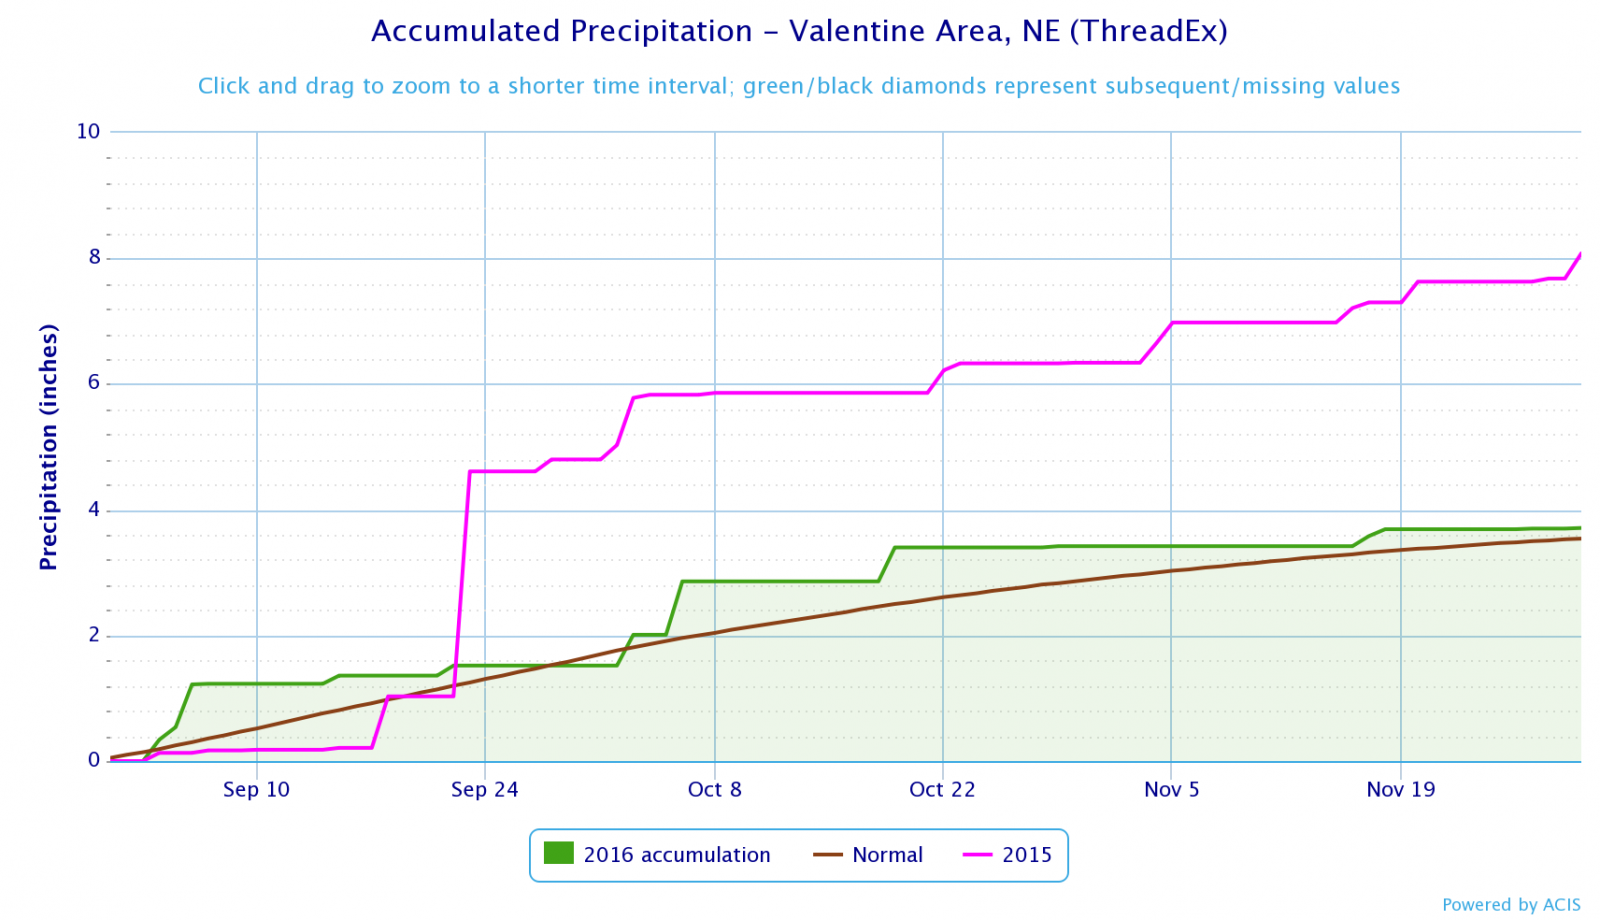
Valentine, NE
Fall Statistics
Facts for the 3 month period of September, October, and November
(including the last 5 years)
| Ave High |
Ave Low |
Ave Temp |
Precip | Snow | Days Lows ≤ 32 |
Days Highs 70+ |
Days Highs 80+ |
|
| Average | 62.6 | 34.9 | 48.8 | 3.12 | 6.4 | 39.8 | 34.5 | 17.4 |
| Max | 68.7 | 39.8 | 54.2 | 8.63 | 52.9 | 54 | 51 | 30 |
| Year | 1963 | 1963 | 1963 | 1973 | 1985 | 1985 | 2016 | 1953 |
| Min | 54.3 | 28.4 | 41.4 | 0.37 | Trace | 24 | 20 | 5 |
| Year | 1985 | 1985 | 1985 | 1958 | 5 times (1912,1913, 1949,1962 2007) |
2016 | 1925 | 1986 |
| 2012 | 65.2 | 33.4 | 49.3 | 1.15 | 10.7 | 44 | 42 | 25 |
| 2013 | 62.8 | 36.2 | 49.5 | 5.26 | 6.8 | 41 | 32 | 20 |
| 2014 | 63.3 | 34.3 | 48.8 | 1.85 | 6.4 | 38 | 39 | 19 |
| 2015 | 65.9 | 37.9 | 51.9 | 8.08 | 10.1 | 31 | 41 | 19 |
| 2016 | 68.2 | 38.8 | 53.5 | 4.11 | 6.3 | 24 | 51 | 23 |
| Top 10 Finishes for the 2016 Fall (Sep, Oct, Nov) for Valentine | |||||||||
| Average High (Warmest) |
Average Low (Warmest) |
Average Temp (Warmest) |
Days ≤32 (Least) |
Days 70+ (Most) |
|||||
| 1 | 68.7 (1963) | 1 | 39.8 (1963) | 1 | 54.2 (1963) | 1 | 24 (2016) | 1 | 51 (2016) |
| 2 | 68.2 (2016) | 2 | 39.5 (1998) | 2 | 53.6 (1953) | 2 | 27 (1953) | 2 | 47 (1963,1953) |
| 3 | 67.8 (1990) | 3 | 39.4 (1953) | 3 | 53.5 (2016) | 3 | 28 (1915,1924, 1963) |
||
| 4 | 67.8 (1953) | 4 | 38.8 (2016) | 4 | 52.6 (1998) | 4 | 46 (1940) | ||
| 5 | 67.2 (2005) | 5 | 38.8 (1940,1931) |
5 | 52.6 (1933) | 5 | 45 (1931) | ||
| 6 | 67.0 (2001) | 6 | 52.1 (1931) | 6 | 29 (1931,1934) |
6 | 44 (2010,1922 1910) |
||
| 7 | 67.0 (1933) | 7 | 38.5 (1954) | 7 | 51.9 (2005) | ||||
| 8 | 66.7 (1999) | 8 | 38.2 (1933) | 8 | 51.9 (2015) | 8 | 30 (1937,1940, 1941,1949, 1950,1954) |
||
| 9 | 66.5 (1904) | 9 | 38.1 (1941) | 9 | 51.9 (1914) | 9 | 43 (1956) | ||
| 10 | 66.4 (1958) | 10 | 38.0 (1924) | 10 | 51.8 (1940) | 10 | 42 (2012,1999 1947,1938) |
||
 |
Page composition by Matthew Masek Update includes 2016 |
 |

