
Severe thunderstorms and showers have the potential for large hail, a few strong tornadoes, damaging winds with gusts over 75 mph, and localized flash flooding across parts of the Mid/Upper Mississippi Valley and Midwest. A widespread heat wave will continue across the Central U.S. and Midwest today. Fire weather concerns persist in the Southwest into the central Rockies and northern California. Read More >
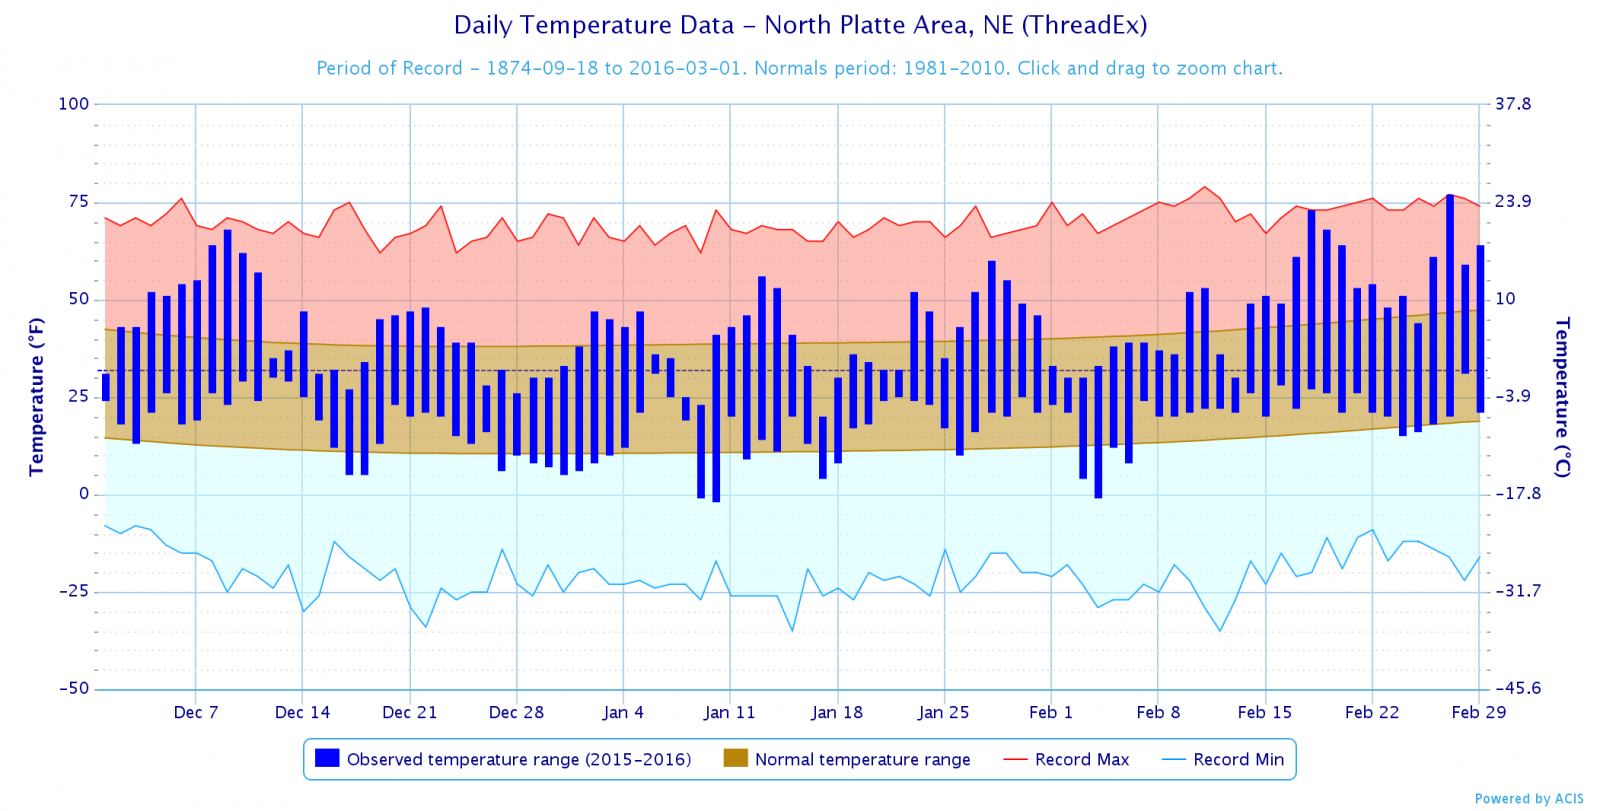
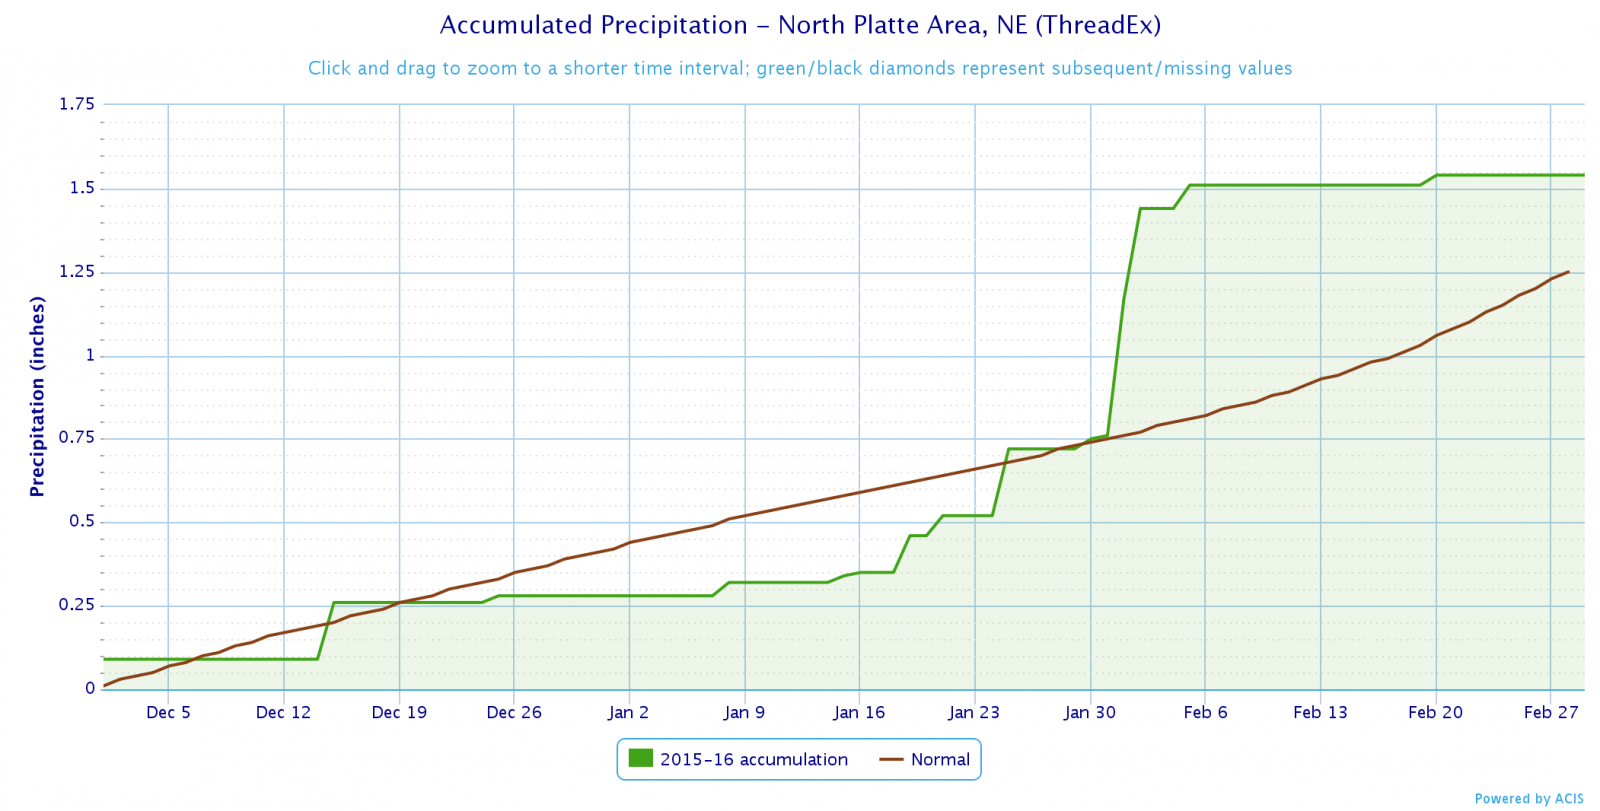
North Platte, NE
Winter Statistics
Facts for the 3 month period of December, January and February
(including the last 5 years)
| Ave High |
Ave Low |
Ave Temp |
Precip | Snowfall | Days Lows < 0 |
Days Highs > 32 |
Days Highs 50+ |
Days Highs 60+ |
|
| Average | 38.8 | 13.4 | 26.1 | 1.37 | 13.8 | 12.5 | 61.6 | 22.8 | 6.4 |
| Max | 47.2 | 22.9 | 34.2 | 4.23 | 34.3 | 42 | 86 | 46 | 23 |
| Year | 1991-92 | 1930-31 | 1991-92 | 1913-14 | 2006-07 | 1978-79 | 1991-92 | 2005-06 | 1980-81 |
| Min | 23.7 | 1.0 | 12.4 | 0.14 | 1.2 | 0 | 25 | 0 | 0 |
| Year | 1978-79 | 1978-79 | 1978-79 | 1980-81 | 1980-81 | 1930-31 1991-92 |
1978-79 | 1978-79 | 10 times latest 2009-10 |
| Last 5 Years | |||||||||
| 2011-12 | 43.9 | 13.1 | 28.5 | 1.67 | 14.1 | 3 | 76 | 28 | 5 |
| 2012-13 | 40.8 | 11.6 | 26.2 | 1.65 | 17.2 | 13 | 68 | 29 | 3 |
| 2013-14 | 38.1 | 8.9 | 23.5 | 1.21 | 19.3 | 17 | 54 | 27 | 5 |
| 2014-15 | 41.3 | 13.4 | 27.3 | 1.78 | 18.5 | 13 | 60 | 27 | 10 |
| 2015-16 | 43.9 | 17.7 | 30.8 | 1.54 | 21.0 | 3 | 73 | 28 | 11 |
| No Top 10 Finishes for the 2015-2016 Winter (Dec, Jan, Feb) |
Temperature and Precipitation Records (1874-1875 to current)
Snowfall Records (1892-1893 to current)
Leap years have 91 days / Non-leap years have 90 days
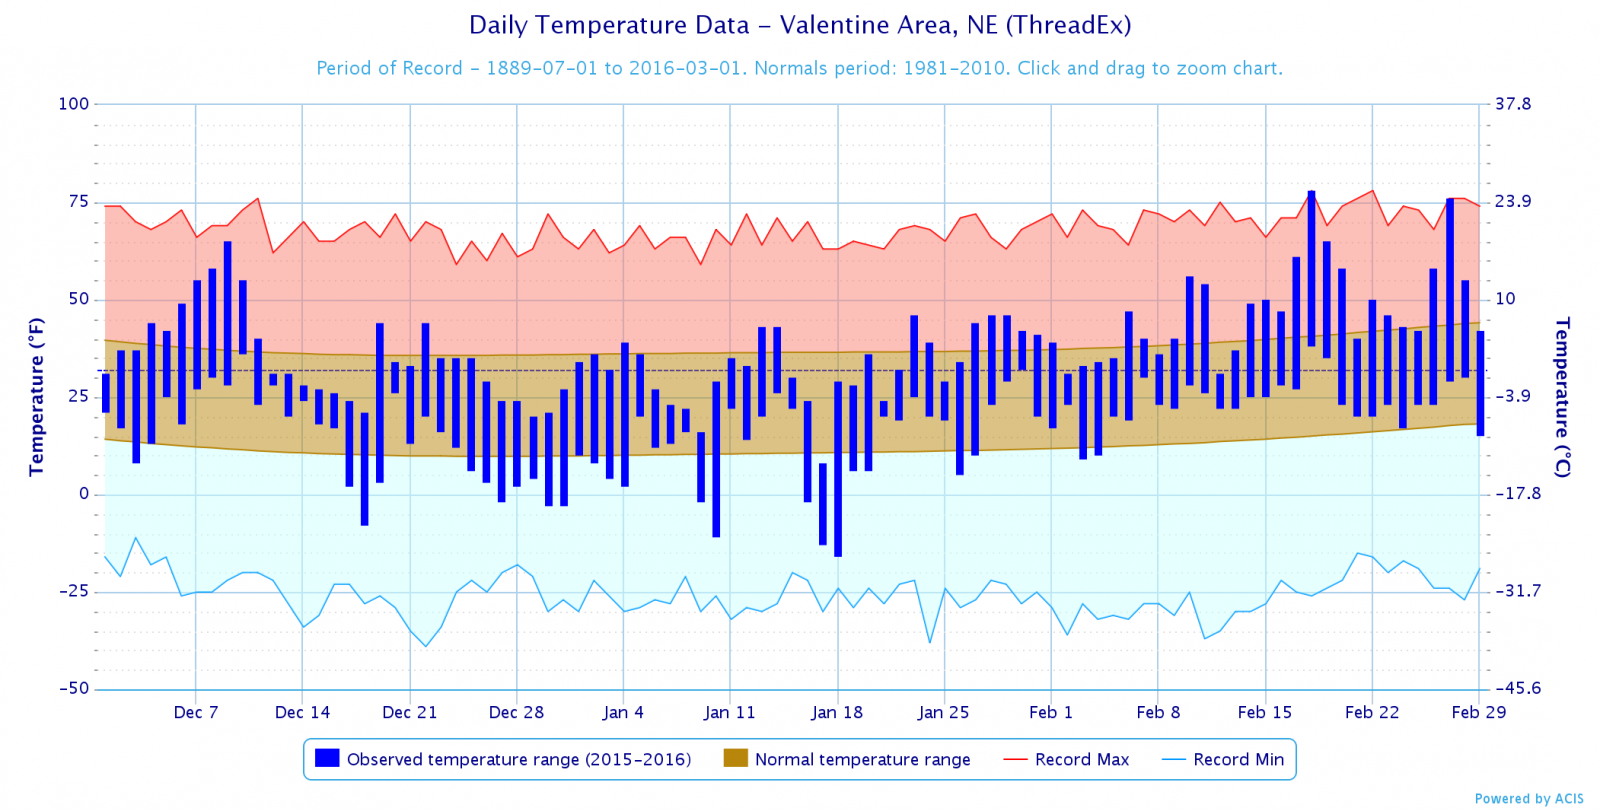
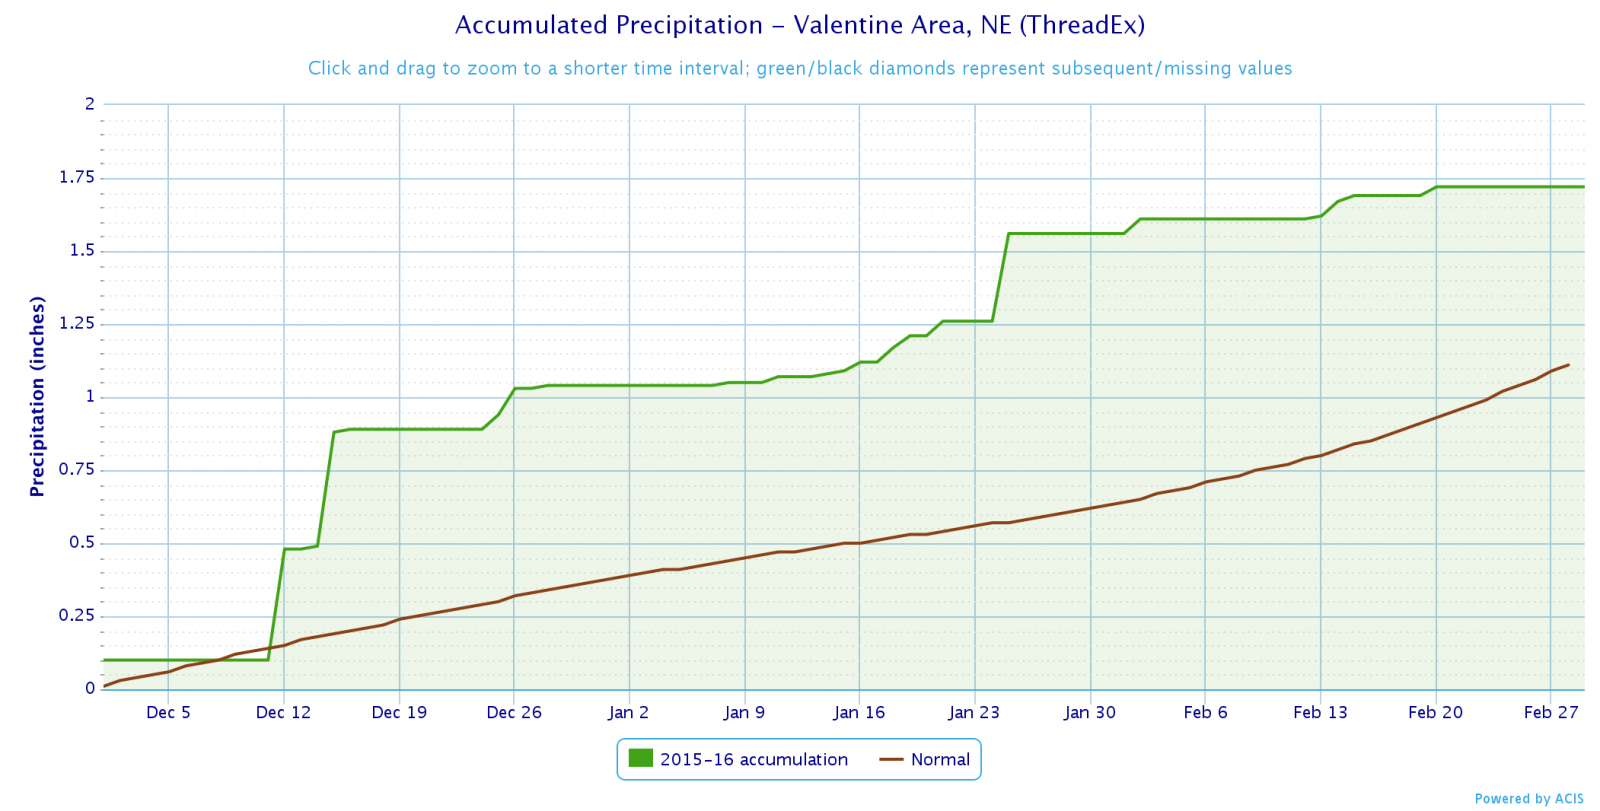
Valentine, NE
Winter Statistics
Facts for the 3 month period of December, January and February
(including the last 5 years)
| Ave High |
Ave Low |
Ave Temp |
Precip | Snowfall | Days Lows < 0 |
Days Highs > 32 |
Days Highs 50+ |
Days Highs 60+ |
|
| Average | 35.8 | 11.3 | 23.5 | 1.38 | 16.5 | 18.1 | 55.4 | 17.6 | 4.5 |
| Max | 44.6 | 20.7 | 31.3 | 3.58 | 42.6 | 48 | 78 | 36 | 12 |
| Year | 1991-92 | 1930-31 | 1930-31 | 1943-44 | 1928-29 | 1978-79 | 1991-92 | 1980-81 | 1961-63 1994-95 1998-99 |
| Min | 22.3 | -2.6 | 9.8 | 0.15 | 4.2 | 2 | 24 | 0 | 0 |
| Year | 1978-79 | 1978-79 | 1978-79 | 1956-57 | 1950-51 | 1930-31 | 1978-79 | 1978-79 | 12 times latest 2009-10 |
| Last 5 Years | |||||||||
| 2011-12 | 42.5 | 14.4 | 28.5 | 2.66 | 13.3 | 7 | 75 | 25 | 8 |
| 2012-13 | 38.6 | 14.2 | 26.4 | 1.52 | 16.9 | 8 | 60 | 24 | 5 |
| 2013-14 | 34.1 | 8.4 | 21.2 | 1.37 | 19.7 | 22 | 51 | 19 | 1 |
| 2014-15 | 38.8 | 12.4 | 25.6 | 1.52 | 15.3 | 19 | 61 | 23 | 11 |
| 2015-16 | 38.5 | 16.4 | 27.5 | 1.72 | 21.1 | 9 | 61 | 15 | 5 |
| Top 10 Finishes for the 2015-2016 Winter (Dec, Jan, Feb) | |
| Rank | Average Low Temperature "Warmest" (Year) |
| 1 | 20.7 (1930-1931) |
| 2 | 17.9 (1953-1954) |
| 3 | 17.8 (1920-1921) |
| 4 | 17.8 (1982-1983) |
| 5 | 17.8 (1997-1998) |
| 6 | 17.5 (1925-1926) |
| 7 | 17.4 (1991-1992) |
| 8 | 16.5 (1933-1934) |
| 9 | 16.4 (2015-2016) |
| 10 | 16.3 (1940-1941) |
Temperature and Precipitation Records (1889-1890 to current - missing 1892-1893)
Snowfall Records (1900-1901 to current)
Leap years have 91 days / Non-leap years have 90 days
 |
Page composition by Matt Masek March 2, 2016 |
 |

