|
|
2006:
WEATHER OF THE
SOUTH PLAINS
|
|
|
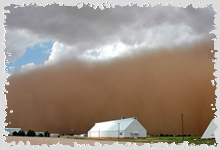
Haboob in Garza County, 12 July. Photo by Susan Cook - Courtesy KCBD
|
Haboob in Brownfield, June 22nd. Photo by Dennis Dean
|
|
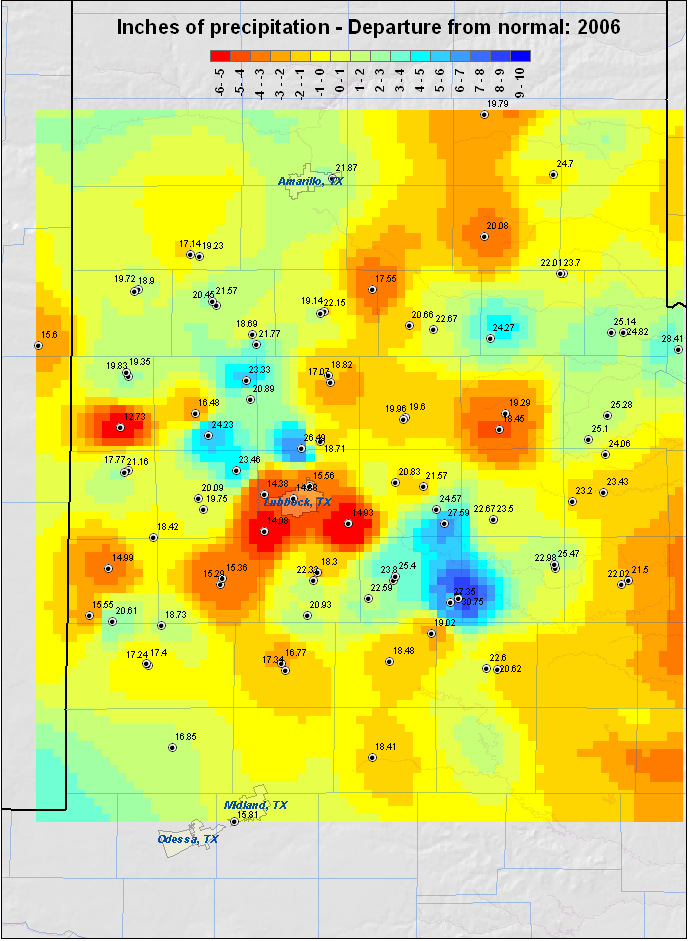
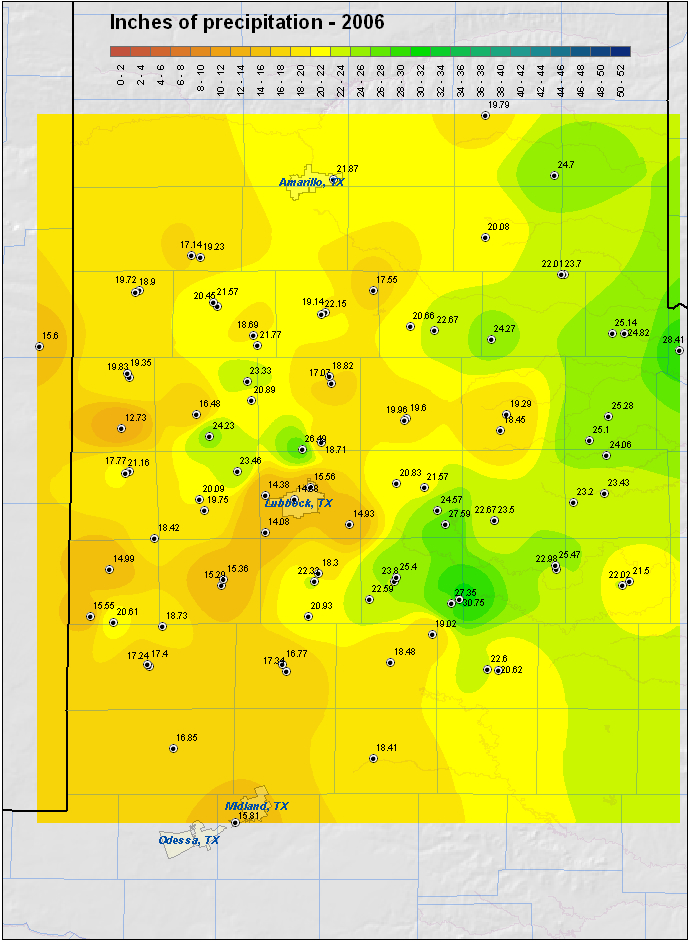
After a very dry start to the year, including Lubbock setting a record for most days in a row without measurable precipitation, 2006 proved to be quite typical, with most stations recording near average rainfall. The following map displays the precipitation recorded across the area for the year of 2006.
|
|
TOTAL PRECIPITATION THAT FELL ACROSS THE REGION IN 2006
|
|
|
| This map was created from yearly precipitation totals gathered from West Texas Mesonet Stations and NWS Cooperative observation stations. Rainfall amounts are in inches. Much of Lubbock County fell 3 to 5 inches short of average for the year while some areas northwest and southeast of Lubbock were above average. For a view of the area rainfall departures please click here. |
Below are some of the statistics from 2006 for Lubbock and around the region:
-
A warm and extremely dry start to the year supported a number of wildfire outbreaks across the region. Although the worst fires were outside the Lubbock NWS area of responsibility, many acres across the South Plains, Rolling Plains, and southern Texas Panhandle burned, with a number of structures destroyed.
-
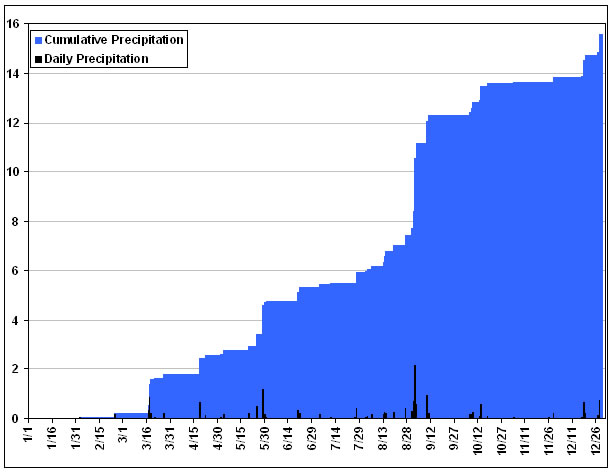
The year of 2006 saw slightly below normal precipitation at the Lubbock airport (15.56 inches versus the normal of 18.69 inches). However, (irrigated) cotton crop farmers were still able to produce a very strong harvest.
 |
| |
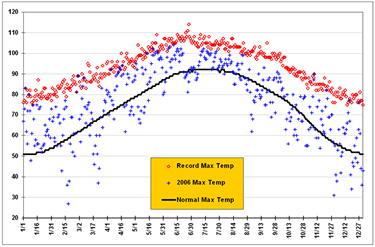
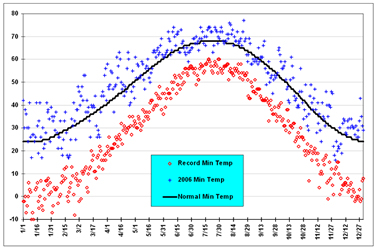
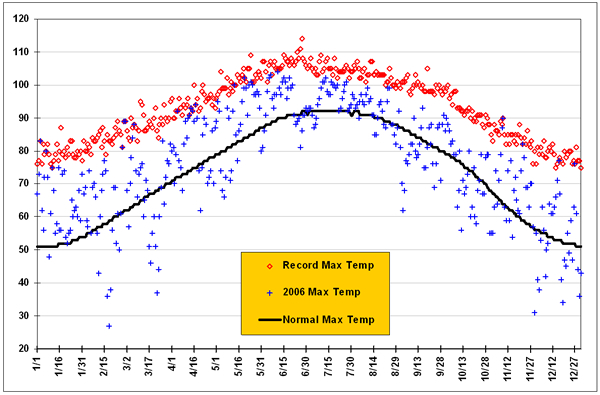
| Plot of the maximum (top) and minimum temperatures (bottom) observed at the Lubbock airport in 2006. Click on the images for a larger view. |
-
The monthly average high temperatures were decidedly above normal, with only October being below normal. January highs were greatest above average, an astounding 12.3 F above normal. Additionally, only two months, February and September saw average low temperatures below normal. The net result was that 2006 was very warm, with a daily average temperature 3.0 degrees above the 30-year average (62.7 versus 59.7).
|
|
| Plot of the cumulative and daily precipitation in inches recorded at the Lubbock airport in 2006. Click on the image for a larger view. |
-
After a very slow start to the year, precipitation was more regular (by West Texas standards) to close out the remainder of the year. The wettest month was September, when nearly five inches of rain fell. Much of this precipitation in September occurred over a soggy Labor Day weekend, when remnants from eastern Pacific Hurricane John combined with a nearby front, a powerful upper-level low and a strong jet to produce widespread 3-5 inches.
-
11 tornadoes were reported across Lubbock's County Warning Area in 2006, down from 26 in 2005 and less than the yearly average of 17. One of the tornadoes (an F0 in Stonewall County) occurred on April 28, the rest touched down in May. All the tornadoes were rated an F0 (doing little or no damage) except for the tornado that hit Childress on May 9th - which received an F2 rating (see the detailed report on this tornado in the May section).
|
LUBBOCK
|
Average High
|
Average Low
|
Precip (inches)
|
|
January
|
64.2
|
30.4
|
T
|
|
February
|
61.6
|
28.6
|
0.18
|
|
March
|
67.4
|
40.4
|
1.62
|
|
April
|
81.6
|
50.7
|
0.77
|
|
May
|
89.1
|
58.2
|
2.15
|
|
June
|
94.8
|
66.1
|
0.77
|
|
July
|
96.0
|
69.7
|
0.62
|
|
August
|
92.1
|
69.1
|
1.51
|
|
September
|
80.0
|
57.1
|
4.87
|
|
October
|
72.9
|
49.0
|
1.30
|
|
November
|
67.2
|
36.6
|
0.26
|
|
December
|
54.2
|
28.7
|
1.71
|
|
Annual
|
76.7 (avg)
|
48.7 (avg)
|
15.56 (total)
|
|
Normal
|
73.2
|
46.2
|
18.69
|
|
Departure
|
3.5
|
2.5
|
-3.13
|
1st: The year started off warm, very windy, and exceptionally dry, all which contributed to extreme fire weather conditions as well as widespread blowing dust. Most locations across the southern panhandle and northern and central South Plains and northern Rolling Plains experienced wind gusts over 60 mph. These conditions contributed to numerous rapidly moving wildfires across Texas and Oklahoma, including near Claytonville (Swisher County), where two homes were destroyed, near the Lubbock airport, where horse stables were destroyed, and near Levelland, where two mobile homes burned. Three fire fighters in the Lubbock County Warning Area (CWA) were hospitalized due to minor burns and/or smoke inhalation. Additionally, a tractor-trailer was blown over on Interstate 27 five mile south of Hale Center. Read more HERE.
12th: Another warm, dry and windy day, coupled with an ongoing short-term drought and frontal passage, resulted in dangerous fire weather conditions. A large wildfire ignited near U.S. Highway 385 just north of Dimmitt during the afternoon, burning three abandoned structures to the northwest of the city before eventually being extinguished. A second large wildfire destroyed at least one structure west of Matador. Overall, at least 6 wildfires resulted in property losses estimated at $200,000.
22nd: Drought conditions intensified over the region, with the Lubbock airport setting its longest streak without rain since records began in 1911. The streak finally ended on February 2, but only after going 98 days without measurable precipitation. For more details read HERE.
NOTE: Along with the dry conditions, January was exceptionally warm, with an average temperature of 47.3 degrees recorded at the Lubbock airport, 9.2 degrees warmer than the thirty year average.
NOTE: The story for this month was the continuing/intensifying drought conditions, with most locations receiving only one or two tenths of an inch of rain for the entire month .
8th: High based showers and a few thunderstorms produced a series of microbursts that moved from southwest to northeast over the South Plains and extreme southern Panhandle. The Lubbock airport recorded a wind gust to 62 mph, with other West Texas Mesonet Stations near Levelland, Abernathy, Olton and Silverton observing wind gusts between 58 and 60 mph.
12th: Another powerful storm system brought strong winds (gusting as high as 62 mph), blowing dust, and more favorable conditions for more wildfires to West Texas. At least a half dozen wildfires were sparked during the day. One fire west of Abernathy destroyed a rural residence, another large fire charred 40,000 acres of open grassland in Cottle and Childress Counties, and another, sparked near U.S. Highway 62/83 just north of Paducah killed several head of livestock. To read more about this event click HERE.
20th: Westerly winds sustained around 30 mph, with gusts approaching 55 mph, occurred over most of the South Plains region. However, winds gusts between 60 and 63 mph were recorded near Anton, Graham, and at Reese Center. Unfortunately, one death and nine injuries occurred at a Little Panda restaurant, where a wind gust blew down a sign mounted to the structure's roof and caused the establishment to fail in a collapse.
23th: A strong upper level storm system in combination with sufficiently cold air brought 1 to 3 inches of snow over the extreme southern panhandle and northern South Plains. The highest snowfall observed was 3 inches at Lazbuddie.
28-29th: Some locations over the western and central South Plains and over the southern Rolling Plains saw a quarter to half inch of rainfall. The West Texas Mesonet site 6 miles south of Anton recorded the most, tipping the gage at 1.14 inches. To view a map of the rainfall click HERE.
31th: A severe thunderstorm brought 1 inch hail to locations 5 miles west of Post, and 14 miles southeast of Crosbyton during the late evening hours.
1st: Severe thunderstorms brought large hail (generally up to golfball size) to portions of the northeast South Plains, southeast Texas Panhandle and northern Rolling Plains. One report of hail up to the size of tennis balls was received just west of Kirkland.
6th: Strong to severe westerly winds associated with a powerful upper-level storm brought blowing dust, created minor damage, and fanned raging wildfires across West Texas. The strongest wind gust recorded was 66 mph at the West Texas Mesonet sites located 5 miles SSW of Graham TX. Also, one wildfire west of Earth destroyed a home. For a more detailed summary of the event click HERE.
15th: Another strong storm system brought unusually hot (mid to upper 90s common), dry and windy (45 to 55 mph common) conditions to the region. These conditions promoted rapid and erratic wildfire spread. One large fire, ignited by downed power lines in Hockley County, destroyed one residence and injured three people. To learn more about this event click HERE.
28th: Scattered thunderstorms over the extreme southern Texas Panhandle and Rolling Plains produced damaging hail up to the size of half dollars along with a brief tornado 1 mile SE of Peacock in Stonewall County. The tornado did no damage.
2-5th: A number of rounds of severe weather occurred across the region, with strong winds, damaging hail and flash flooding common. Additionally, one tornado was observed south and southwest of Matador on the 2nd, with 5 tornados observed across the southwest and south-central South Plains on the 5th. The tornados remained over rural areas, but one did cause $500,000 in property damage to center-pivot irrigation units approximately 9 miles NNW of Brownfield. To read a much more detailed account of these severe weather event click HERE.
9th: Two isolated supercell thunderstorms produced strong winds and hail up to two inches in diameter (reported at Roaring Springs) over portions of Dickens and Motley Counties. Later that evening, a very strong right moving supercell worked in combination with a left moving storm to produce a F2 tornado in Childress. One person was injured when a tree fell and struck him, and $5.7 million damage was estimated. Additionally, baseball size hail was reported at Brice, 8 miles southwest of Memphis, 3 miles south of Estelline, and in Childress, with the storm that eventually become tornadic in Childress. For much more information on this event click HERE.
20th: A cluster of high based thunderstorms produced a series of microbursts, with severe wind reports near Lubbock, Idalou, Silverton, Tahoka and Crosbyton. The strongest recorded wind gust was 81 mph , observed by the West Texas Mesonet station 6 miles NW of White River Lake. Thankfully, this gust appeared rather isolated, with no damage observed in town. However, a strong gustnado did blow down some power lines and poles, fences, and other light weight objects in Idalou.
21th: Severe wind gusts associated with thunderstorm outflow winds were reported in Lubbock and near Abernathy and O'donnell.
late 26th-early the 27th: A thunderstorm wind gust to 77 mph was recorded by the West Texas Mesonet Station 2 miles south of Muleshoe. Additionally, a heat burst produced a wind gust to 61 mph, along with a 13F increase in temperature near Amherst. Another heat burst later that night produced a wind gust to 76 mph along with a 13F temperature increase near Memphis.
27th: Golfball-size hail was observed near McAdoo, with smaller hail near Lakeview and Graham Chapel.
28th: Golfball-size hail was reported near Brice.
29th: Isolated to scattered thunderstorms brought hail to the size of quarters and wind gusts to 64 mph to portions of the central and southern South Plains and southern Rolling Plains. Additionally, three non-supercellular (landspout) tornadoes occurred, two in central Lubbock county (one which was highly-visible), and one east of Tahoka. No damage was reported with any of the tornadic activity.
30th: Severe thunderstorms brought large hail, damaging winds, and flash flooding to much of the region. The most significant damage occurred in northeast Terry County, where a farmstead suffered damage from large hail and winds in excess of 60 mph. Total property damage for the event was near half a million dollars.
12th: Isolated severe thunderstorms produced wind gusts around 60 mph near Quitaque and north of Crosbyton, with hail to one inch in diameter in Lorenzo.
16th: The dryline initiated thunderstorms that produced large hail up to the size of golfballs and damaging wind gusts over the southern Texas Panhandle and northern Rolling Plains. Large hail, up to golfball-size, fell at Vigo Park for 50 minutes, accumulating to a depth of three inches. Also, winds estimated between 60 and 70 mph destroyed two barns immediately west of Vigo Park. Wind gust to 70 mph were also recorded in Childress, with the strong winds destroying another barn in rural northeast Childress County.
17th: Isolated to scattered thunderstorms produced severe winds in Guthrie, with considerable drifting of three-quarter inch diameter hail between HWY 70 and FM 208.
21st: A complex of non-severe thunderstorms propagated over the west Texas South Plains region during the evening of the 21st. A series of wake-lows developed along the back edge of the complex, with severe wind gusts reported across portions of Swisher and Lubbock Counties. The strong winds (measured to 72 mph near Tulia) damaged a mobile home near Vigo Park. Later, strong winds (measured to 68 mph at the Lubbock airport) destroyed a barn, blew a roof off of a mobile home, downed road signs from Shallowater to Lubbock, caused extensive damage to the Lubbock Children's Home facility, and uprooted large trees near Idalou. Additionally, heavy rain fell over portions of the area. To learn more about the rains click HERE.
22th: A complex of storms produced widespread strong to severe winds over the central and southern South Plains during the afternoon. Also, the winds picked up copious amounts of dust creating a haboob (dust storm) that moved over the western and southern South Plains. Unfortunately, one elderly man was killed when his vehicle impacted the rear of a jack-knifed tractor-trailer, and 15 others were injured in a series of chain collisions, all a result of the near zero visibility conditions. The wind/dust storm also destroyed approximately 10,000 acres of cotton. For pictures and a more thorough explanation of the event click HERE.
10th: Scattered thunderstorms produced a 66 mph wind gust near Amherst, with a 59 mph gust east of Silverton. Also, severe wind gusts ripped the roof off of the Union School gymnasium in southeast Terry County, in addition to overturning several irrigation pivot systems and a cotton module builder.
11th: Extreme thunderstorm winds (measured to 91 mph) resulted in extensive damage in Spur during the evening. Two people were injured when the mobile home they were in was destroyed. The Spur Farmer's Co-Op Gin sustained extensive roof damage, a gas pump canopy was blown a considerable distance, the roof of a church was severely damaged, and dozens of other homes and businesses were harmed by the strong winds. To top it off, another round of strong winds associated with a wake low and heatburst impacted Spur later that night, in addition to portions of Parmer and Terry county.
12th: Strong to severe thunderstorm winds produced a classic haboob (wall of dust) that moved across the southern and central South Plains. The West Texas Mesonet site near Wolfforth recorded a gust to 71 mph with the event.
14-17th: A lightning ignited wildfire kept fire departments occupied for nearly three days in rural King county. No property damage or injuries were reported with the fire, but it did burn 3,500 acres.
22nd: Dry air and triple digit heat combined with very dry fuels to support a pair of grass fires that burned about 1,000 acres of rangeland across northeastern Childress County.
NOTE: July ranked as the 8th warmest July on record for Lubbock. For details read HERE.
13-22th: A number of rounds of showers and thunderstorms brought much needed rains to most of West Texas. The West Texas Mesonet site near Goodlett recorded 6.24 inches of rain over the period, with the COOP observer in Plains receiving 6.16 inches (with 3.10 inches falling in a days time). For specifics read HERE.
26th: Severe thunderstorms brought flooding to portions of Lynn county, hail from penny to quarter size to locations in Bailey and Cochran counties, and severe winds to sites in Motley and Cottle counties. The hardest hit area was around Paducah where wind damaged homes, power poles, and businesses. To view a detailed account click HERE.
1-4th: The combination of moisture from once Hurricane John in the eastern Pacific, numerous disturbances passing overhead, and a stationary front to the south all conspired to produce a very wet Labor Day weekend. A mesonet station west of Sundown recorded a total of 4.84 inches for the event, with many areas across the central and southern South and Rolling Plains receiving in excess of 3 inches. For more information read HERE.
14-16th: A strong storm system, in combination with rich Gulf moisture streaming toward the area, brought very heavy rains to the Rolling Plains, with lighter amounts on the Caprock. Locations near Aspermont, Guthrie and Spur all recorded over 5 inches of rain. Additionally, a severe thunderstorm brought flooding and wind gusts up to 65 mph in Plainview. To learn more click HERE.
14-15th: An intensifying storm system brought strong winds to West Texas. Many locations experienced winds at or above 50 mph, with a few gusts over 60 mph. For more detailed information click HERE.
29-30th: The coldest air of the fall season joined forces with a potent upper level storm to produce widespread snowfall for the region, with snowfall amounts ranging from 1 or 2 inches across the southern Rolling Plains to 7 inches at Friona, Tulia and Childress. See more HERE.
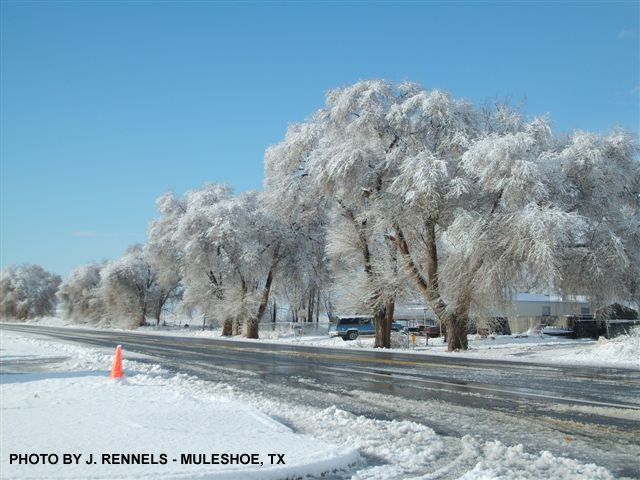
18-20th: Persistent low-level moisture streaming toward West Texas brought widespread precipitation to the region. The precipitation started off as rain, but changed to freezing rain across much of the northwest South Plains and southwest Panhandle, making for very difficult travel there. Finally, toward the end of the event, the freezing rain changed to snow as an upper-level storm system moved across. Most locations on the Caprock saw a trace to an inch of snow, with 3-4 inches over the northwest South Plains and southwest Panhandle.
|
|
|
Picture on the south side of Muleshoe looking south along Rt 214. Click on the image to enlarge.
|
28-29th: A powerful and slow moving storm brought rounds of showers and thunderstorms to the region, with many receiving amounts approaching or exceeding an inch. The rain changed to snow across the southwest Panhandle and northwest South Plains, with Friona receiving 4 inches of snow, and 1-2 inches found farther south and east.





 Follow us on X
 Follow us on Facebook
 Follow us on YouTube
 LUB RSS Feed