|
|
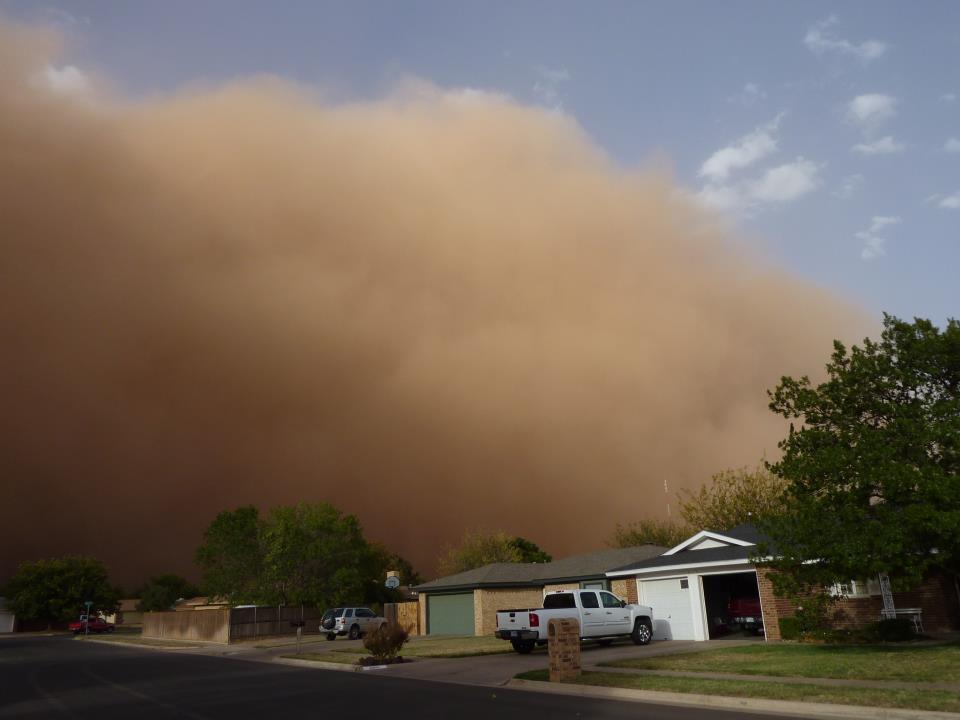
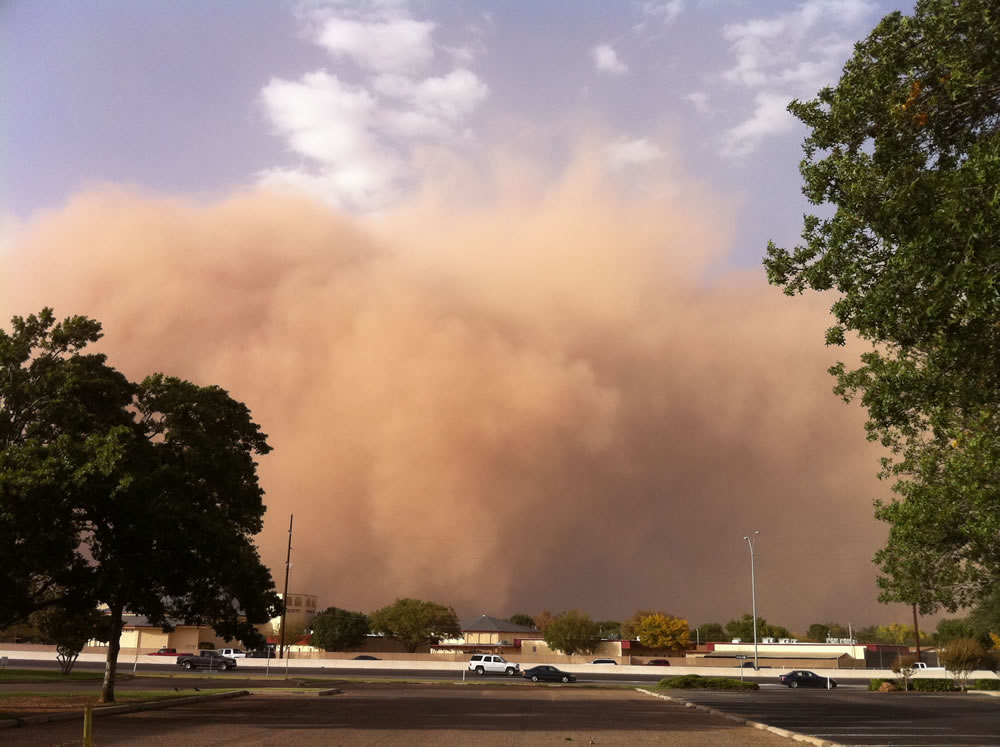
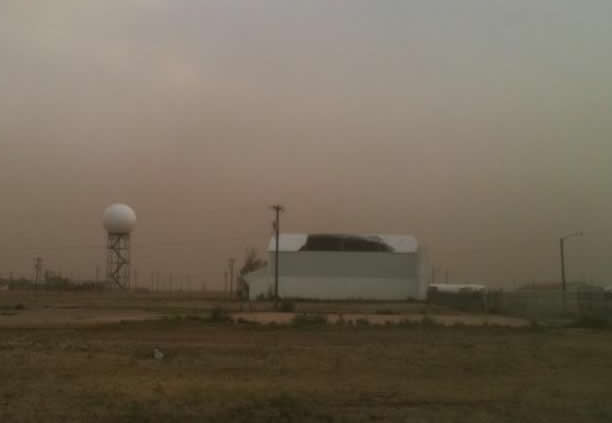
| A wall of dust approaches the Science Spectrum from the north around 5:40 pm on 17 October 2011. Photo is courtesy of John Holsenbeck. Click on the image for a larger view. |
|
Intense cold front produces severe winds and blowing dust - 17 October 2011
|
A storm system passing out of the Rockies into the southern plains sent a cold front racing south through the Texas Panhandle and across the South Plains and Rolling Plains late Monday afternoon and evening. Ahead of the front, temperatures were unusually warm, with highs mainly in the upper 80s to lower 90s, and even 96 degrees out at Aspermont. Temperatures dropped quickly behind the front. The high at Amarillo was only 72 degrees. As the front moved south, more and more dirt was lofted by the front until a well-defined "Haboob" (an Arabic term for intense dust storm) developed along the front.
Wind gusts recorded up to 75 mph with the front and haboob caused quite a bit of havoc across the Caprock. The National Weather Service in Lubbock received numerous reports of tree limb damage and structure damage. A few wildfires were started as the strong winds downed power lines. One of the hangers on the east side of the Lubbock Airport lost part of its roof. The wind also caused some power outages. Visibility dropped to near zero with the haboob as it passed through Lubbock, bringing traffic to a temporary standstill as skies turned a dark orangish-brown. Some long-term residents remarked that the dust storm was one of the worst they had ever experienced.
To view a list of the preliminary local storm reports collected by the National Weather Service CLICK HERE.
The animation below shows the cold front and associated dust storm sweeping south across parts of eastern New Mexico and much of the South Plains area.
 |
|
Visible satellite animation during the late afternoon and early evening hours of the 17 October 2010. The animation shows the approximate position of the cold front (blue) as it races across the South Plains. Also displayed is a large area of dust (light grey) along and behind the front across eastern New Mexico into the South Plains, along with areas of clouds (the lighter white colors). Click on the animation for a larger version |
The follow loop displays what the cold front and attendant haboob looked like from a radar perspective. The cold front moved an amazing 55 mph as it surged southward across the South Plains.
|
|
|
Lubbock WSR-88D radar animation from 3:49 pm to 7:04 pm CDT on 17 December 2011. The relatively wide fine line (blue) moving rapidly southward is all the dust being sensed along and immediately behind the cold front. Click on the animation for a larger version |
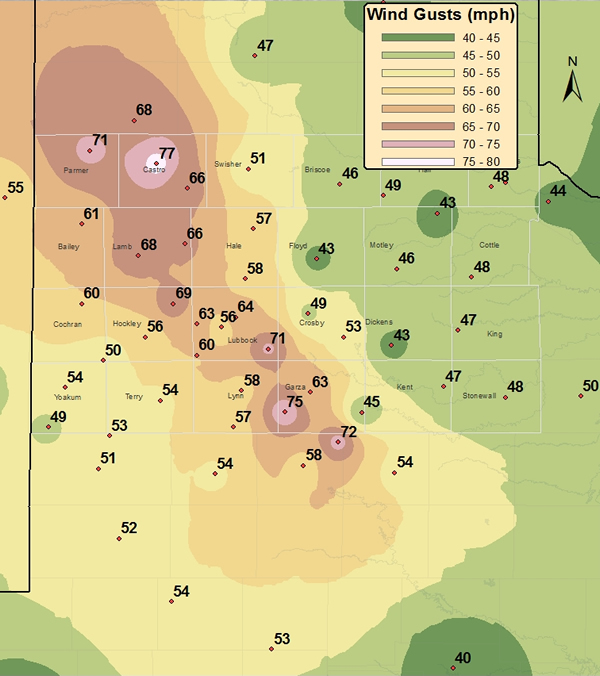
The strongest swath of winds developed across the southwest Texas Panhandle and raced to the southeast across much of the South Plains, as noted in the following graphic:
|
|
|
Plot of the maximum recorded wind gusts during the late afternoon and early evening hours on 17 October 2011. The data are courtesy of the West Texas Mesonet and the National Weather Service. Click on the map for a enlarged view |
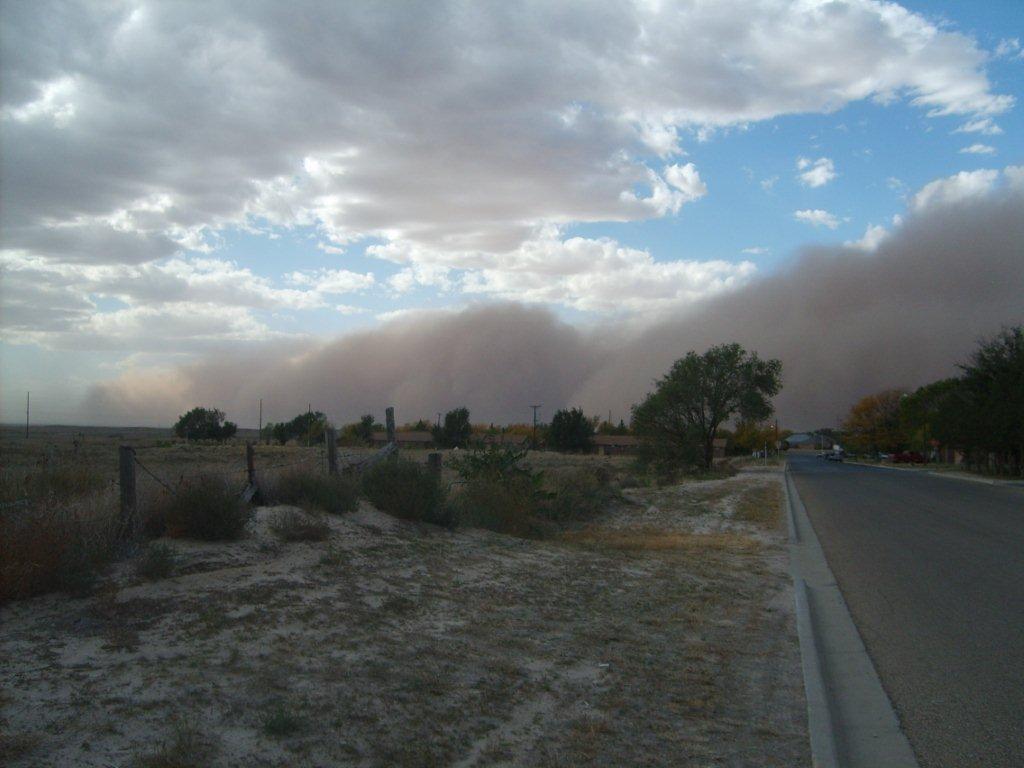
Below are some more pictures taken of the haboob as it moved across the South Plains region:
 |
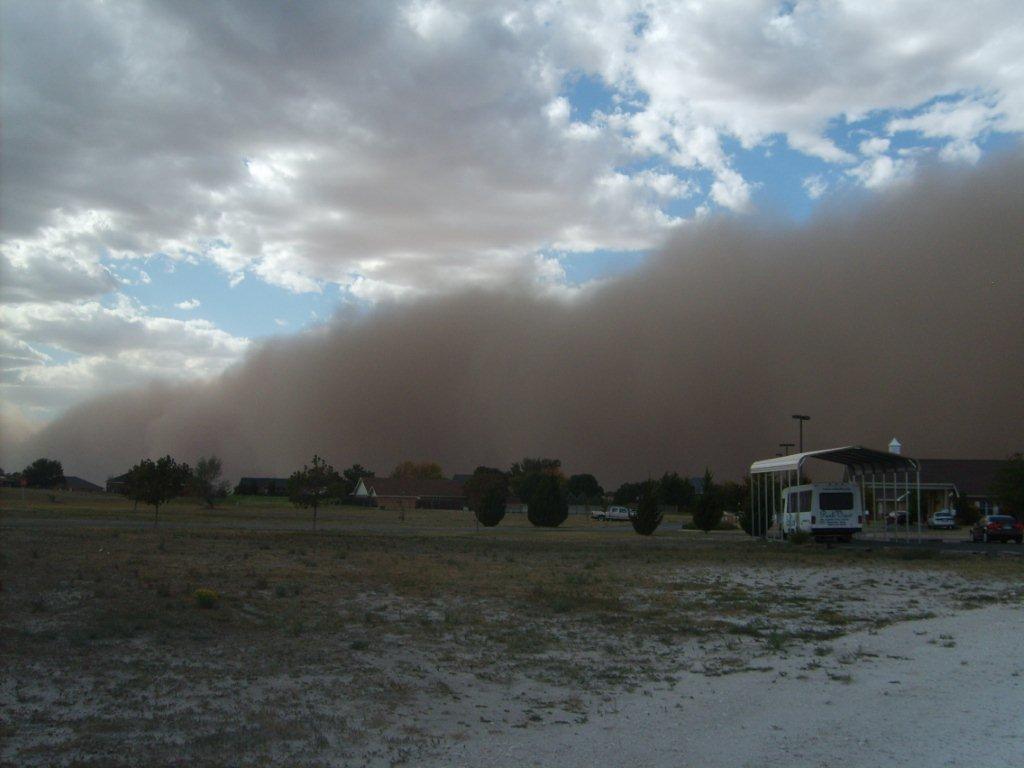 |
| Above are images captured as a wall of dust moved through Muleshoe around 4:30 pm on 17 October 2011. The pictures are courtesy of Jack Rennels. Click on the pictures for a larger view. | |
 |
 |
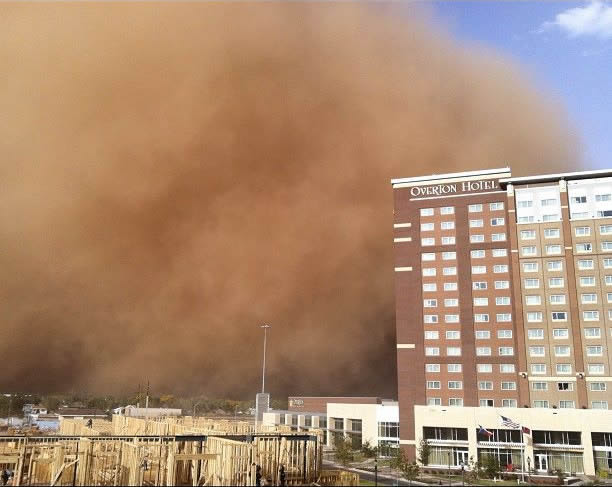
| Above are pictures captured of the haboob as it rolled through Lubbock. The left picture is courtesy of Emily Davenport and the right image is from Erin Shaw. Click on the pictures for a larger view. | |
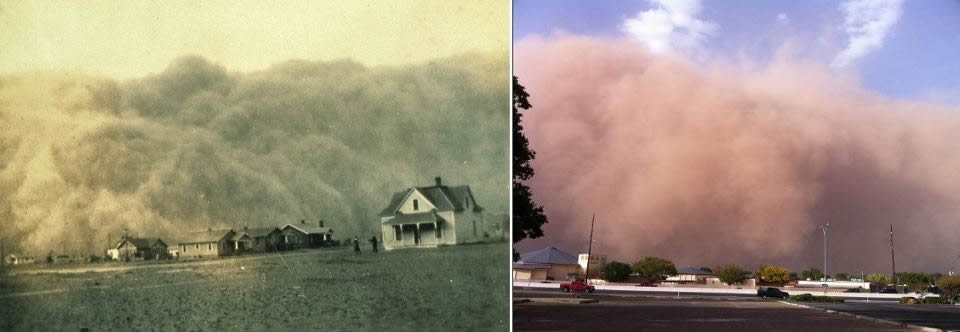
The intense dust storm drew some comparisons to the Dust Bowl years of the 1930s. The likeness may not be so farfetched as the region is mired in an exceptional drought, as was the case back in the Dirty Thirties. In fact, 2011 is on pace to shatter the record for the driest year in recorded history for both Lubbock and Childress. In addition, like many of the iconic pictures of rolling dust storms in the 30s, the haboob on the 17th was also caused by a strong cold front. Below is a comparison of a dust storm in the 1930s to the one that just visited West Texas.
 |
|
| Left: Image of a large haboob approaching Stratford, TX, during the height of the Dust Bowl on "Black Sunday" on 14 April 1935. Right: Image of the haboob as it approached the Science Spectrum in south Lubbock on 17 October 2011. The similarities are striking. Click on the image for a larger view. |
The severe winds caused scattered damage to trees, power lines, signs, fences and structures. Below is one example of roof damage that occurred at the Lubbock airport:
|
|
|
| Roof of a hanger ripped open at the Lubbock Airport. Photo courtesy Joe Merchant. |
Below are a few links containing additional information related to the severe winds and haboob event:
CIMSS page with satellite loops of the event
West Texas Mesonet event summary
Many have asked why the dust storm was so bad. Well, there is no one simple answer. As people who have lived in West Texas for any time know, whenever the wind blows the dust will follow. That is part of living in this semi-arid land on the southern high plains, where agriculture is a large business. In fact, the below links have information on two other haboobs that struck the region in the last several years:
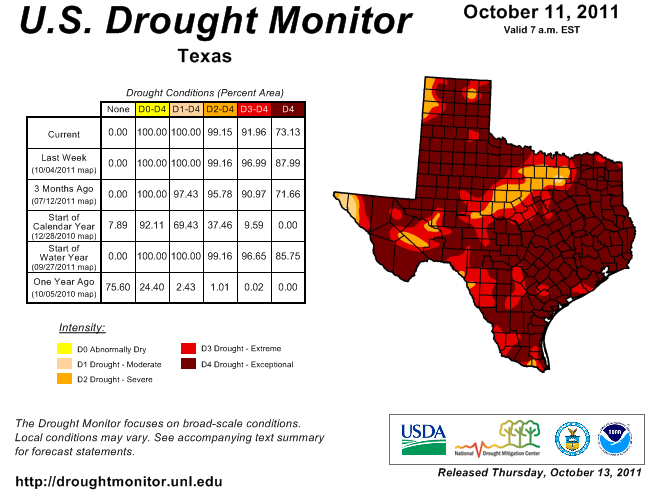
Unlike the above recent haboobs, which occurred on thunderstorm outflows, the haboob on the 17th was associated with a cold front (and no shower or thunderstorm activity). This is more comparable o the dust storms that formed during the Dust Bowl days of the 1930s. Still, why was this wall of dust more intense than many more recent ones? One large part of this was likely the background climate conditions. Similar to in the 30s, we are now in the midst of an exceptional drought, as is displayed in the below graphic:
|
|
| Drought monitor valid 11 October 2011. Click on the image for a larger view. |
The ongoing drought has led directly to less vegetation (ground cover), including many more open fields than normal and thus a much larger potential source of dust than in typical years. Once you have the large dust source, all you need is the wind to loft the dust. In this case, the wind came in the form of a particularly intense cold front that plowed southward across the area during the hottest part of the day, when the air was deeply mixed. The combination of the severe winds and the abundant dust, and the timing of the front (moving through during peak heating) resulted in the production of an impressive haboob.
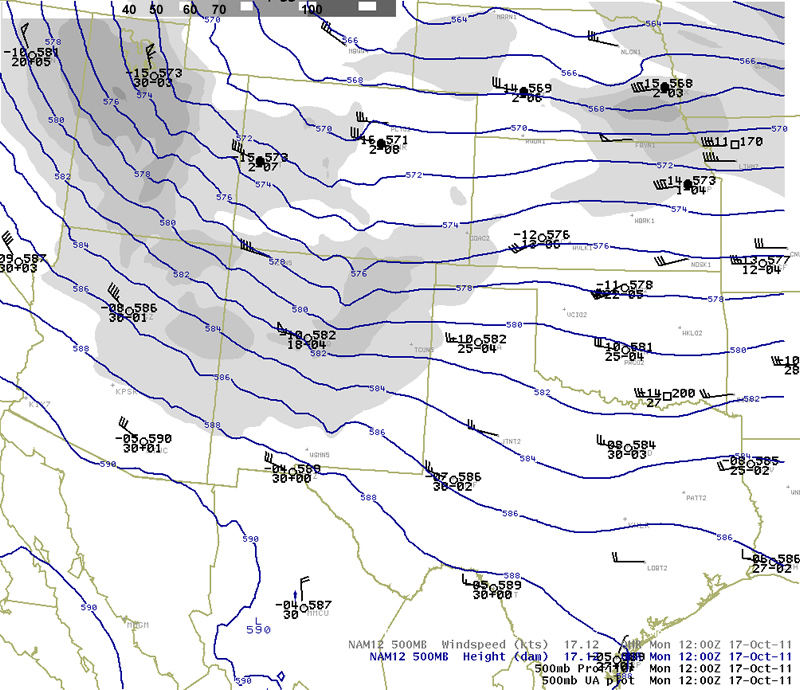
For a further look at some of the meteorological factors responsible for the haboob, we'll start with the upper-level storm system that moved across the region.
|
|
|
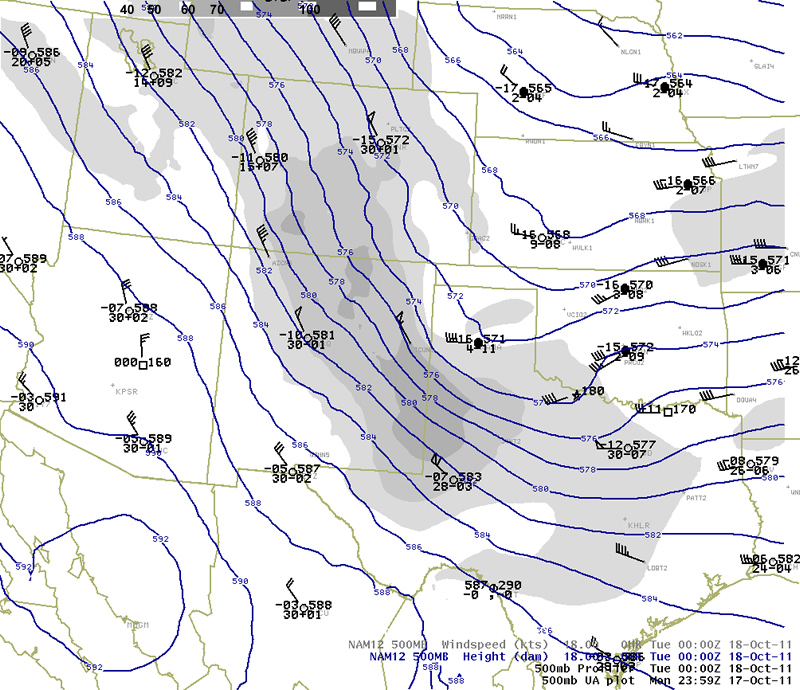
The 500 mb chart at 7 am, October 17th. In addition to the obeservations, the height field and wind speeds are also shown. Click the image for a larger view |
|
|
|
Same as above, except at 7 pm on October 17th. Click the image for a larger view. |
The images above show the strongest mid-level winds on the southwest flank of the trough from Utah into northern New Mexico at 7 am. 12 hours later, the trough has moved southest into the Texas Panhandle. The strongest winds now extend from northern Mexico almost to Midland. The strongest winds are about 65 knots or about 75 mph.
The 500 mb charts show only a thin slice of the atmosphere. The upper-air soundings taken at Amarillo and Midland show the vertical profile of the air mass to the north and south of the strong front which moved through the area.
|
|
|
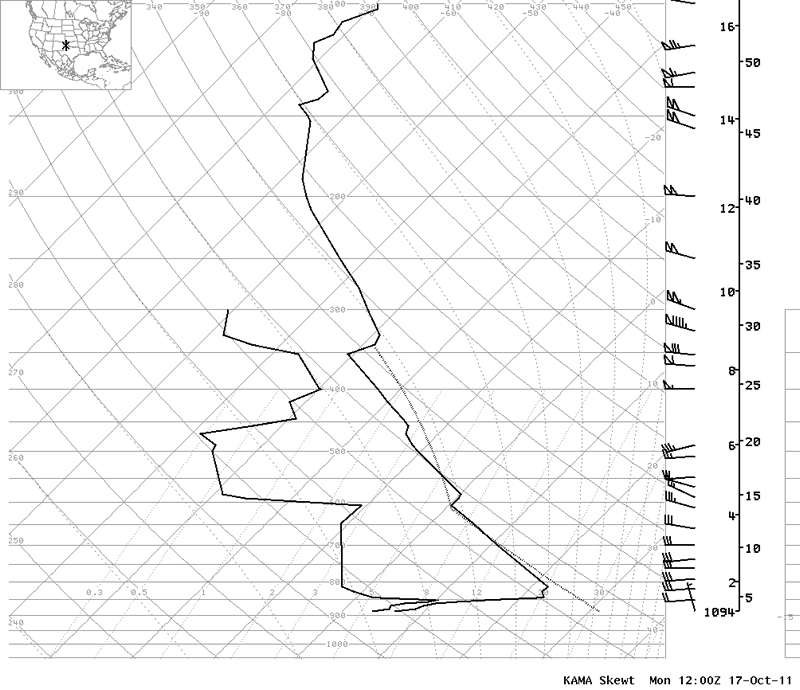
The upper air sounding taken from Amarillo at 7 am on October 17th. Click the image for a larger view |
|
|
|
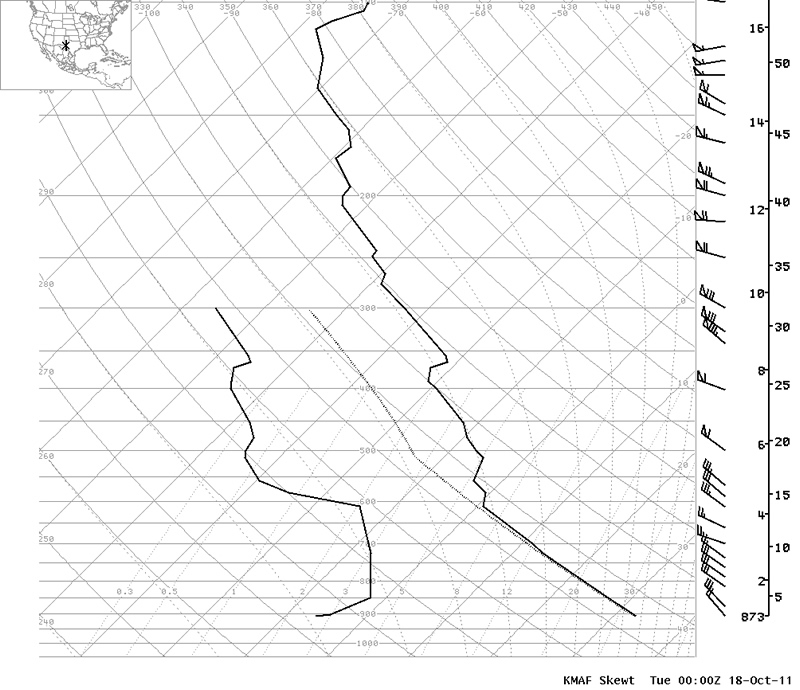
The upper air sounding taken from Midland at 7 pm on October 17th. Click the image for a larger view. |
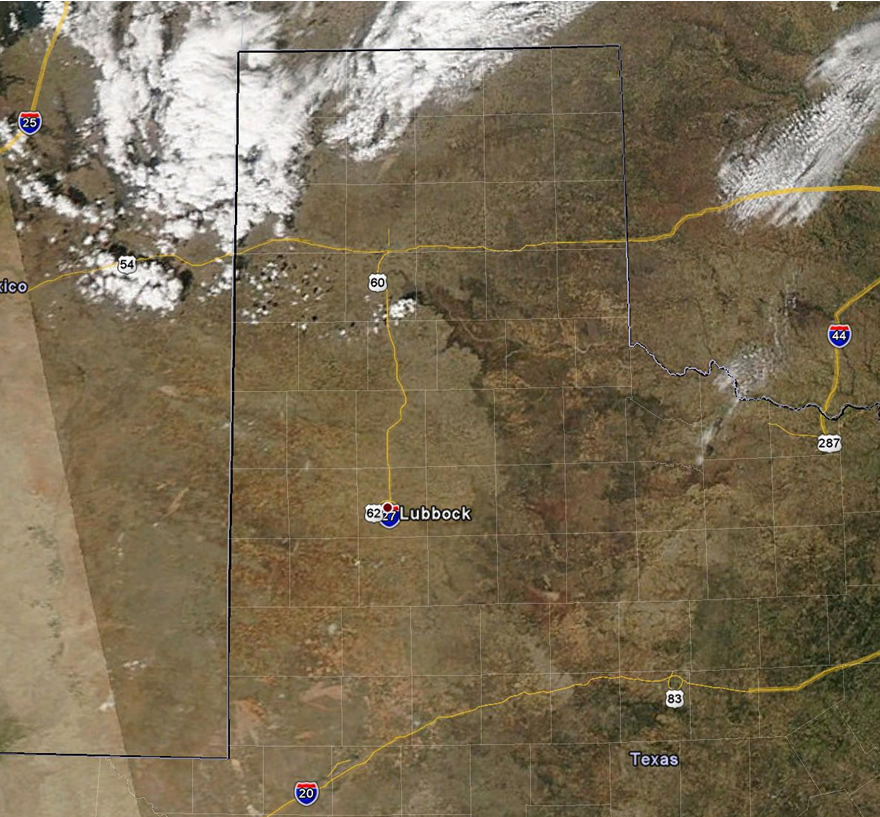
The images above show show the 12 UTC (7 am CDT) sounding from Amarillo (top) and the 00 UTC (7 pm CDT) sounding from Midland (bottom). The sounding from Amarillo shows a strong inversion in the lowest 50 mbs In the middle-levels, from about 600 mb to 350 mb, there is some relatively moist air present. This mid-level moisture increased during the day as the upper level trough approached. And in fact, some high-based shower activity did develop across northeast New Mexico and the northwestern Texas Panhandle. The following satellite image taken around 4 pm CDT and shows this area of showers along and north of I-40. The sounding from Midland shows a deep mixed layer from the surface to around 600 mb. Not only did this profile support the mixing of higher momentum air down to the surface, it also likely helped the growth of the dust cloud in the vertical as air forced upward along the front encountered no inhibition.
|
|
| NASA MODIS Satellite image taken about 3 pm CDT, October 2011. Click on the image for a larger view. |
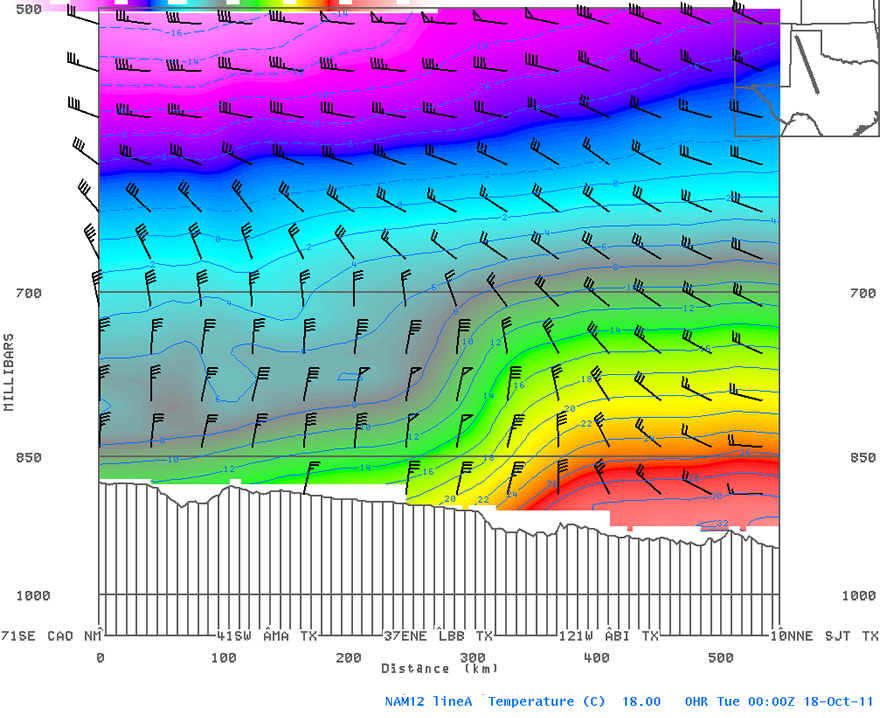
The next image shows a cross-section, or vertical slice of the atmosphere that runs from near Dalhart on the left to near near San Angelo on the right, with Lubbock right in the middle. As 7 pm, you can see a large temperature gradient from north to south, with the isotherms closer together near Lubbock, corresponding to the position of the front (although the analysis cannot represent the full temperature gradient along the front, which in reality is much sharper). In addition, we have plotted the wind. You can see a core of wind speeds of 50 kts (the black triangles, about 58 mph) along the frontal zone in the middle of the image. Note that the analysis wind speeds are not quite to the surface, where friction and turbulence can reduce the wind speed. However, some West Texas Mesonet stations did record sustained wind speeds of around 50 mph for a half hour or so.
|
|
| The NAM forecast model analysis of temperatures (shaded, in degrees C) and the ageostrophic wind (barbs in knots) for 7 pm Oct 17th, 2011. Click on the image for a larger view. |
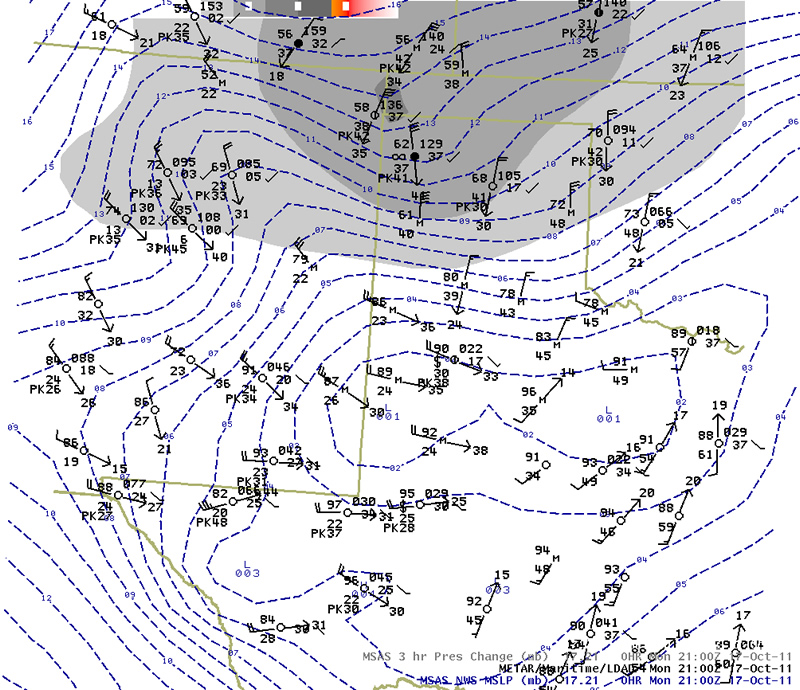
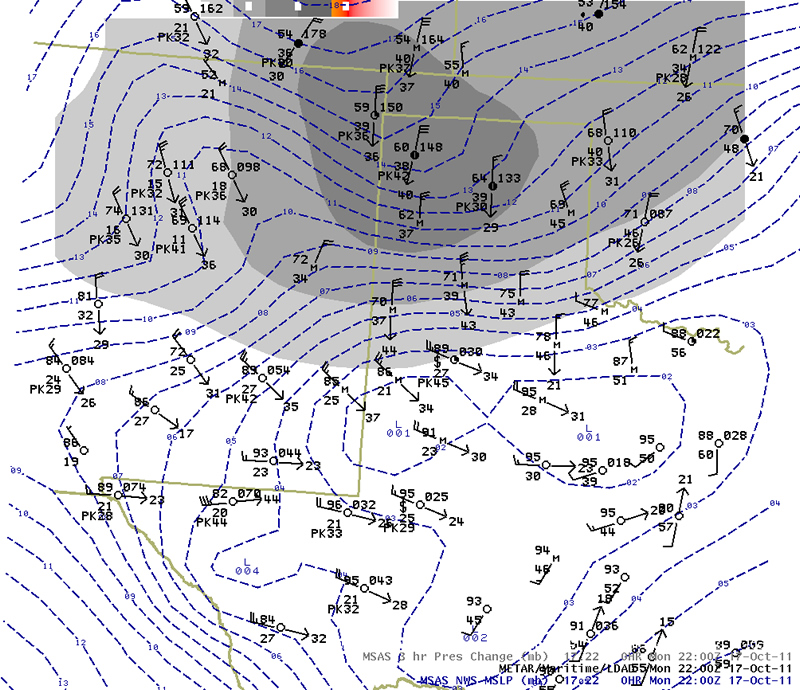
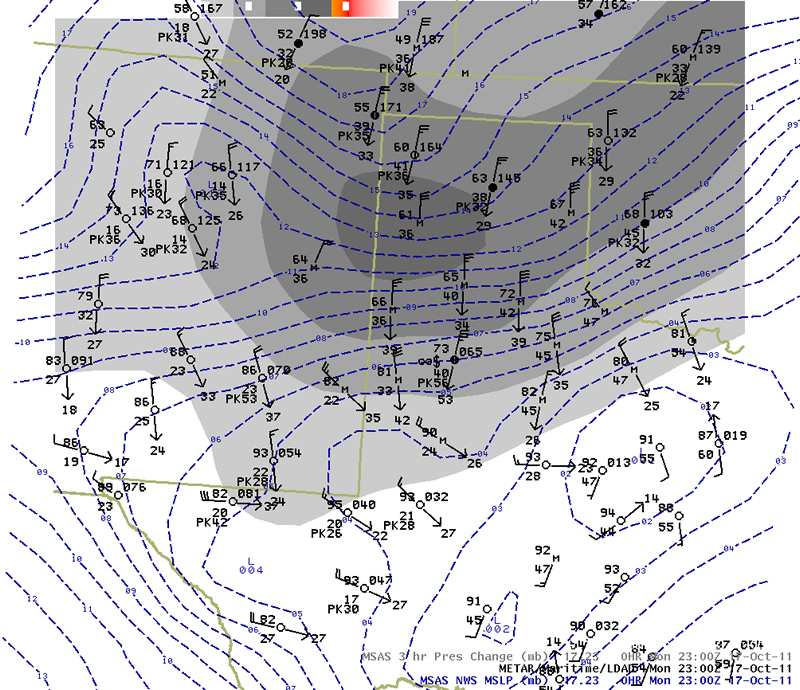
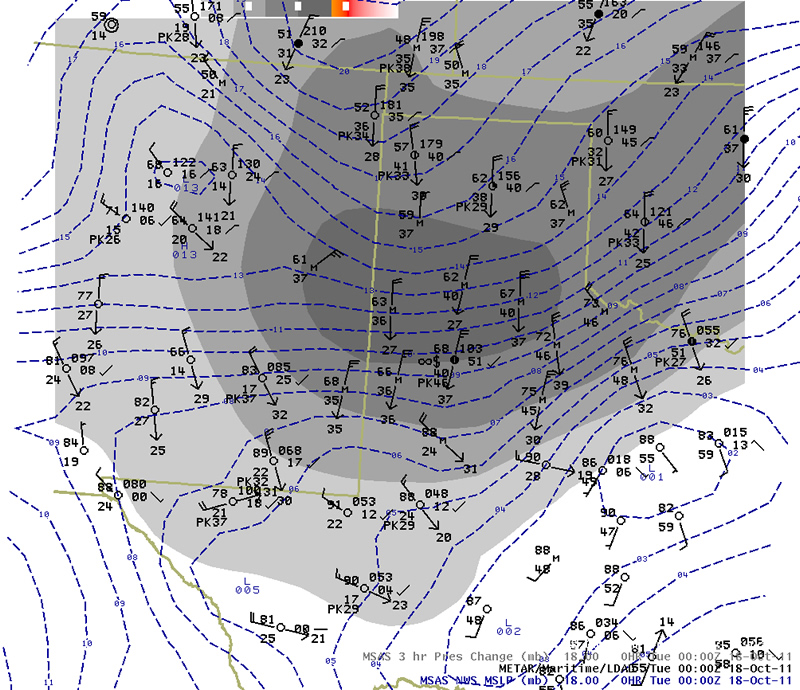
Lastly, below is a sequence of maps of surface observations and analyses during the event. The images cover 4 hours, starting from 4 pm in the upper left, to 7 pm in the lower right. In the images we can we see the strong pressure gradient (dashed blue lines) associated with the front, and the zone of strong wind speeds (shaded area) which increased as the front moved south.
 |
 |
||
| Surface map at 4 pm, October 17th, 2011. | Surface map at 5 pm, October 17th, 2011. | ||
 |
 |
||
| Surface map at 6 pm, October 17th, 2011. | Surface map at 7 pm, October 17th, 2011. | ||
| click on the images above for larger views | |||

