The National Weather Service (NWS) Baltimore/Washington office, in collaboration with the U.S. Army Corps of Engineers, United States Geological Survey, City of Alexandria, and District Department of Environment and Energy, has now added three new flood inundation map libraries to the Advanced Hydrologic Prediction Service (AHPS) web portal for portions of the Potomac River. These inundation map libraries show extent and depth of a freshwater flood on the Potomac River from near Fletcher's Cove in Northwest DC to just above the mouth of Broad Creek in Prince George's County, Maryland, a distance of approximately 14 miles. Potential backwater flooding of tributaries by the Potomac is also represented within this reach, including on Cameron Run, Oxon Run, Four Mile Run, and the Anacostia River.
You can view a recorded version of an online training session at this link from the DC Department of Energy & Environment. We hope to post a more concise version of the website demonstration before the end of the year.
Locations Available
Each inundation library is associated with a NWS river forecast point, and extends for a reasonable distance north and south of each location, providing a seamless connection between all three. They are available for the following forecast locations and reaches:
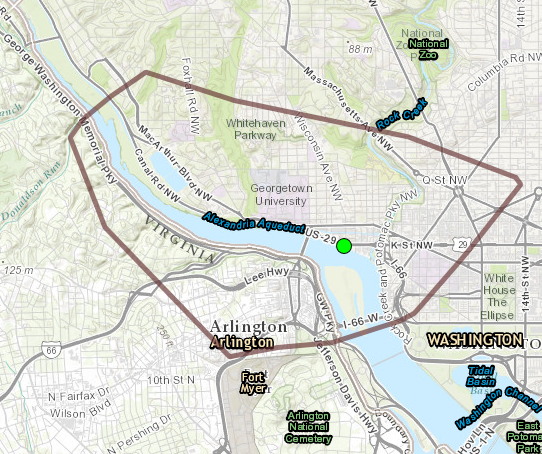
Potomac River at Georgetown/Wisconsin Avenue (GTND2)
Link to Forecast: https://water.weather.gov/ahps2/hydrograph.php?wfo=lwx&gage=gtnd2
Link to Mapping: https://water.weather.gov/ahps2/inundation/index.php?gage=gtnd2
This map area extends from near Fletcher's Cove in Northwest DC to just south of the I-66 Roosevelt Bridge, and includes potential backwater flooding on Rock Creek. This map covers portions of the District of Columbia and Arlington County, as shown below. This includes the following notable areas/landmarks: Fletcher's Cove, portions of the George Washington Memorial Parkway, the Georgetown waterfront area, Roosevelt Island, the Kennedy Center, and the Watergate Complex.
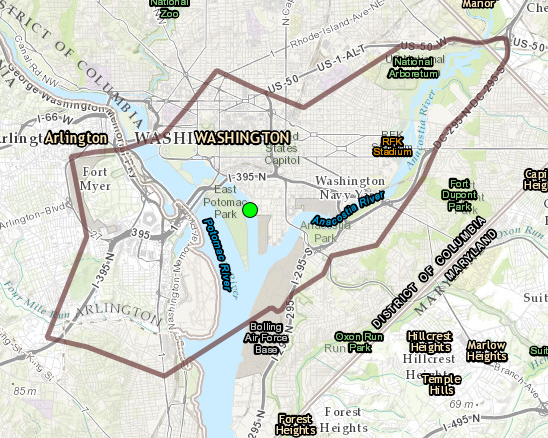
Washington Channel at DC Southwest Waterfront (WASD2)
Link to Forecast: https://water.weather.gov/ahps2/hydrograph.php?wfo=lwx&gage=wasd2
Link to Mapping: https://water.weather.gov/ahps2/inundation/index.php?gage=wasd2
Although this forecast location is on Washington Channel, modeling indicates it is also representative of the Potomac River from just south of the I-66 Roosevelt Bridge to near the mouth of Four Mile Run, just south of Reagan National Airport. This includes potential backwater flooding of Four Mile Run, both Washington Channel and Boundary Channel, the Tidal Basin, and the entire portion of the Anacostia River within Washington DC. Freshwater flooding of tributaries, including the Anacostia, is not considered in these maps. This map covers much of the District of Columbia, a portion of Arlington County, and a small portion of the City of Alexandria, as shown below. This includes the following notable areas/landmarks: The Reflecting Pool, Vietnam Memorial, Korean War Memorial, Dr. Martin Luther King Jr. Memorial, FDR Memorial, Jefferson Memorial, WWII Memorial, Constitution Gardens, The Ellipse, Federal Triangle area, Smithsonian Museums, National Gallery of Art, the eastern half of the National Mall, U.S. Botanic Garden, 3rd Street Tunnel, much of SW DC, Maine Avenue, Fort McNair, Buzzard Point, Navy Yard, Anacostia Park, National Arboretum, Anacostia Water Gardens, northern portions of Joint Base Anacostia-Bolling, East Potomac Park, Haines Point, Columbia Island, portions of the George Washington Memorial Parkway, Reagan National Airport, and portions of the City of Alexandria near Four Mile Run.
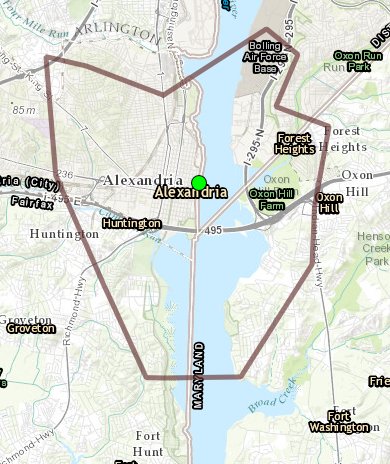
Potomac River at Alexandria (AXTV2)
Link to Forecast: https://water.weather.gov/ahps2/hydrograph.php?wfo=lwx&gage=axtv2
Link to Mapping: https://water.weather.gov/ahps2/inundation/index.php?gage=axtv2
This map area extends from near the mouth of Four Mile Run to just north of the mouth of Broad Creek near Fort Foote, Maryland, including potential backwater flooding of Cameron Run and Oxon Run. This map covers a portion of the District of Columbia, most of the City of Alexandria, and portions of Fairfax County and Prince George's County, as shown below. This includes the following notable areas/landmarks: lower portions of Joint Base Anacostia-Bolling, portions of the George Washington Memorial Parkway, most of the City of Alexandria including Cameron Run, National Harbor, Belle View/Belle Haven, and Huntington.
About Inundation Mapping
Inundation maps provide information on the spatial extent and depth of flood waters in the vicinity of these forecast points. Users will be able to display flood inundation maps for various levels ranging from minor flooding to well above the largest observed flood. An option is also available to display the map most closely related to the current NWS forecast.
Flood inundation maps, combined with river observations and NWS forecasts, enhance the communication of flood risk, provide users with additional information to better mitigate the impacts of flooding, and build more resilient communities.
These flood inundation maps and associated geospatial data (shapefiles) are available through the AHPS portal at https://water.weather.gov/ahps
A complete list of flood inundation map locations Nationwide is online at https://water.weather.gov/ahps/inundation.php
A users guide for the flood inundation map web interface is available at: https://water.weather.gov/ahps2/inundation/inundation_mapping_user_guide.pdf
A video explaining use of the local maps will be made available in September 2016. Check back here for the link when available.
About This Project
These inundation maps were developed as an interagency effort of the District of Columbia Silver Jackets team, made up of the Philadelphia and Baltimore Districts of the U.S. Army Corps of Engineers (USACE); the United States Geological Survey (USGS) Water Science Center for Maryland, Delaware, and DC; the National Weather Service (NWS), the National Park Service (NPS), the D.C. Department of Energy and the Environment (DC DOEE), the National Capital Planning Commission (NCPC), and representatives from D.C., Arlington, Fairfax, and Prince George's Counties and the City of Alexandria. The maps are available on the AHPS portal thanks to funding from DC DOEE and the City of Alexandria.
What About Tidal Mapping?
Although freshwater flooding typically causes more widespread and severe flooding on the Potomac, tidal flooding occurs with a greater frequency. The same project referenced above also produced tidal inundation map libraries in addition to the freshwater libraries. A subset of these tidal maps are available on the AHPS portal. The full suite of tidal maps (extent only, not depth) are available for viewing on a separate site. In many cases, especially south of Georgetown, the differences between the freshwater maps and tidal maps for equivalent heights are insignificant, so the freshwater maps can be used no matter the cause of the flooding.
What About Tributaries?
These maps depict inundation extent and depth caused by Potomac River freshwater only. Streams that flow into the Potomac, such as Rock Creek, the Anacostia River, and Cameron Run, called tributaries, often flood from freshwater as well, but the modeling does not take that into account. Similarly, the tidal mapping is valid within the tidal reach of the tributary streams, but if freshwater flows are simultaneously occurring -- which does happen on these small streams -- the inundation extent may be more significant than what is shown on the tributary streams.
Do You Have Questions?
Send us an email.


 Coastal Flood
 FAQ
FAQ