|
...Winter Snow and Cold...
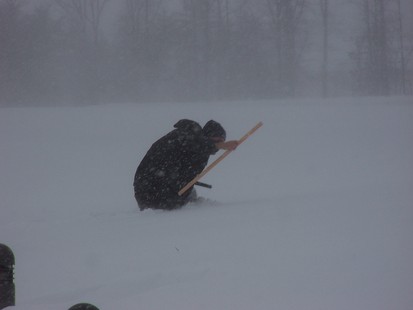
Picture taken outside the Sterling, VA National Weather Service Forecast Office on the morning of the 10 February 2010 blizzard.
The most powerful storms to impact the Mid-Atlantic Region in winter are "Nor'easters." Tracking along the coast, these storms cause strong northeast winds which create wind and water damage sometimes similar to category one hurricanes. The strong winds drive large waves onshore, eroding beaches and flooding shorelines. Cold high pressure is usually centered over Quebec or northern New England, providing a rich source of cold, dry air into the Mid Atlantic states. Heavy snowfall, sleet, and wind seriously hamper travel, and cause power outages.
Forecasting these storms and what weather the region will receive can be difficult. The heaviest snow generally occurs in a band around 50 miles wide. To the east of that heavy snow, it changes to a mixture of ice and then rain. To the west of the band, snowfall amounts are significantly less. That means that by just moving the center of the storm 50 miles to the east or west will completely change the type and severity of the weather received.
| Top 1-, 2- and 3-Day Snowfalls |
*NOTES*
A 'day' is defined as a calendar day (midnight to midnight LST), which is consistent with first-order climate records. Measurable snowfall (at least 0.1 inches) had to fall on 2 (3) consecutive days in order for it to count as a 2 (3)-day snowfall total. Therefore, it may be possible for a 2-day extreme to be greater than a 3-day extreme (e.g., the 7th highest snowfall at DC was 16.0 inches for a 2-day snowfall total and only 9.9 inches for a 3-day snowfall total) as it was less common to observe measurable snowfall for three consecutive days than for two consecutive days.
Data are unofficial. Please contact the National Climatic Data Center for official data. Official snowfall records date back to: 1884 for DC, 1892 for Baltimore and 1962 for Dulles.
The following table and chart ranks the top 1-3 day snowfalls on record for all three climate sites. The listings below only includes an overlapping date once. For example at Washington DC: Since the top 2-Day total of 26.0 inches on Jan 27-28, 1922 contain overlapping dates with the top 3-Day total of 28.0 inches on Jan 27-29, 1922, only the higher 3-day total was included in this list.
Top Snowfall Within 3-Day Period
|
| |
Washington D.C.
(1884-2023)
|
Baltimore, MD
(1892-2023)
|
|
|
|
1-3 Day Total
|
Date
|
1-3 Day Total
|
Date
|
1-3 Day Total
|
Date
|
|
1)
|
28.0
|
Jan 27-29, 1922
|
29.2
|
Jan 22-23, 2016
|
32.4
|
Feb 5-6, 2010
|
|
2)
|
20.0
|
Feb 12-14, 1899
|
26.8
|
Feb 16-18, 2003
|
29.3
|
Jan 22-23, 2016
|
|
3)
|
18.7
|
Feb 18-19, 1979
|
26.6
|
Jan 7-9, 1996
|
24.6
|
Jan 6-8, 1996
|
|
4)
|
17.8
|
Jan 22-23, 2016
|
26.5
|
Jan 27-29, 1922
|
22.8
|
Feb 10-11, 1983
|
|
5)
|
17.8
|
Feb 5-6, 2010
|
25.0
|
Feb 5-6, 2010
|
21.7
|
Feb 15-17, 2003
|
|
6)
|
17.3
|
Jan 7-9, 1996
|
22.8
|
Feb 11, 1983
|
18.0
|
Dec 18-19, 2009
|
|
7)
|
16.6
|
Feb 10-11, 1983
|
22.0
|
Mar 28-29, 1942
|
16.3
|
Feb 18-19, 1979
|
|
8)
|
16.4
|
Dec 18-19, 2009
|
21.3
|
Feb 12-14, 1899
|
15.4
|
Dec 30, 1970-Jan 1, 1971
|
|
9)
|
16.4
|
Feb 16-18, 2003
|
20.0
|
Feb 18-19, 1979
|
14.1
|
Mar 13-14, 1993
|
|
10)
|
14.4
|
Feb 7, 1936
and Feb 15-16, 1958
|
19.5
|
Feb 9-10, 2010
|
13.3
|
Feb 12-13, 2014
|
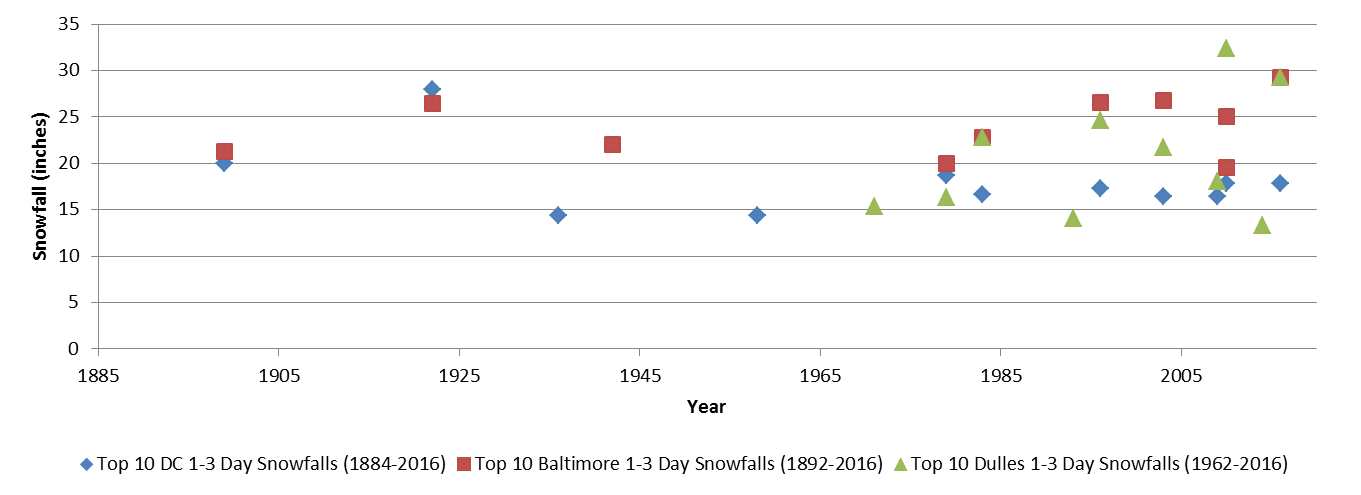
The following tables and figures in this section show the biggest 1-, 2- and 3-day snowfall totals on record for each site- Washington D.C., Baltimore, MD, and Dulles VA.
Top Ten 1-, 2- and 3-Day Snowfall Totals (inches) at Washington DC
(Snowfall record dates back to 1884)
[For 2 (3) day records, it must have snowed all 2 (3) days]
|
|
|
3-Day
|
Date
|
2-Day
|
Date
|
1-Day
|
Date
|
|
1)
|
28.0
|
Jan 27-29, 1922
|
26.0
|
Jan 27-28, 1922
|
21.0
|
Jan 28, 1922
|
|
2)
|
20.0
|
Feb 12-14, 1899
|
19.0
|
Feb 12-13, 1899
|
16.4
|
Feb 11, 1983
|
|
3)
|
17.3
|
Jan 7-9, 1996
|
18.7
|
Feb 18-19, 1979
|
15.0
|
Dec 19, 2009
|
|
4)
|
16.4
|
Feb 16-18, 2003
|
17.8
|
Jan 22-23, 2016
|
14.4
|
Feb 7, 1936
|
|
5)
|
14.3
|
Feb 16-18, 1900
|
17.8
|
Feb 5-6, 2010
|
14.0
|
Feb 19, 1979
|
|
6)
|
12.7
|
Feb 5-7, 1899
|
16.6
|
Feb 10-11, 1983
|
13.3
|
Feb 16, 2003
|
|
7)
|
9.9
|
Dec 5-7, 1910
|
16.4
|
Dec 18-19, 2009
|
13.0
|
Jan 7, 1996
|
|
8)
|
9.0
|
Jan 28-30, 1904
|
16.0
|
Feb 16-17, 2003
|
12.9
|
Feb 15, 1958
|
|
9)
|
8.3
|
Feb 19-21, 1947
|
15.4
|
Jan 6-7, 1996
|
12.0
|
Jan 29, 1966
|
|
10)
|
8.0
|
Mar 14-16, 1937
Dec 31, 1924-Jan 2, 1925
Mar 6-8, 1911
|
14.4
|
Feb 15-16, 1958
|
12.0
|
Feb 13, 1899
|
.png)
Top Ten 1-, 2- and 3-Day Snowfall Totals (inches) at Baltimore, MD
(Snowfall record dates back to 1892)
[For 2 (3) day records, it must have snowed all 2 (3) days] |
|
|
3-Day
|
Date
|
2-Day
|
Date
|
1-Day
|
Date
|
|
1)
|
26.8
|
Feb 16-18, 2003
|
29.2
|
Jan 22-23, 2016
|
25.5
|
Jan 23, 2016
|
|
2)
|
26.6
|
Jan 7-9, 1996
|
26.3
|
Jan 27-28, 1922
|
23.3
|
Jan 28, 1922
|
|
3)
|
26.5
|
Jan 27-29, 1922
|
25.0
|
Feb 5-6, 2010
|
22.8
|
Feb 11, 1983
|
|
4)
|
21.3
|
Feb 12-14, 1899
|
24.4
|
Feb 16-17, 2003
|
21.9
|
Mar 29, 1942
|
|
5)
|
12.0
|
Feb 16-18, 1900
|
22.5
|
Jan 7-8, 1996
|
21.8
|
Feb 16, 2003
|
|
6)
|
10.8
|
Feb 14-16, 1996
|
22.0
|
Mar 28-29, 1942
|
17.0
|
Dec 19, 2009
|
|
7)
|
10.5
|
Mar 2-4, 1960
|
20.3
|
Feb 12-13, 1899
|
16.4
|
Feb 19, 1979
|
|
8)
|
10.5
|
Feb 5-7, 1899
|
20.0
|
Feb 18-19, 1979
|
16.0
|
Feb 6, 2010
|
|
9)
|
10.3
|
Feb 8-10, 1926
|
19.5
|
Feb 9-10, 2010
|
15.8
|
Jan 7, 1996
|
|
10)
|
10.1
|
Dec 25-27, 1909
|
18.0
|
Dec 18-19, 2009
|
15.5
|
Feb 10, 2010
and Feb 13, 1899
|
.png)
Top Ten 1-, 2- and 3-Day Snowfall Totals (inches) at Dulles, VA
(Snowfall record dates back to 1962)
[For 2 (3) day records, it must have snowed all 2 (3) days]
|
|
|
3-Day
|
Date
|
2-Day
|
Date
|
1-Day
|
Date
|
|
1)
|
24.6
|
Jan 6-8, 1996
|
32.4
|
Feb 5-6, 2010
|
22.5
|
Feb 11, 1983
|
|
2)
|
21.7
|
Feb 15-17, 2003
|
29.3
|
Jan 22-23, 2016
|
22.1
|
Jan 23, 2016
|
|
3)
|
7.8
|
Dec 4-6, 2003
|
23.2
|
Jan 7-8, 1996
|
19.8
|
Jan 7, 1996
|
|
4)
|
7.6
|
Mar 30-Apr 1, 1964
|
22.8
|
Feb 10-11, 1983
|
17.5
|
Feb 6, 2010
|
|
5)
|
6.4
|
Feb 26-28, 2003
|
20.1
|
Feb 15-16, 2003
|
16.0
|
Dec 19, 2009
|
|
6)
|
6.4
|
Mar 1-3, 1994
|
18.0
|
Dec 18-19, 2009
|
15.9
|
Feb 16, 2003
|
|
7)
|
6.2
|
Jan 21-23, 1982
|
16.3
|
Feb 18-19, 1979
|
14.9
|
Feb 5, 2010
|
|
8)
|
5.6
|
Jan 25-27, 2004
|
15.4
|
Dec 30, 1970-Jan 1, 1971
|
13.9
|
Mar 13, 1993
|
|
9)
|
5.5
|
Jan 9-11, 1997
|
14.1
|
Mar 13-14, 1993
|
13.8
|
Feb 19, 1979
|
|
10)
|
4.8
|
Jan 5-7, 1977
|
13.3
|
Feb 12-13, 2014
|
11.7
|
Feb 13, 2014
|
.png)
|
Snowiest Month Ever
|
|
DC
|
Baltimore
|
Dulles
|
|
35.2"
|
Feb 1899
|
50.9"
|
Feb 2010
|
46.1"
|
Feb 2010
|
|
Most Snow by Month
|
|
November
|
|
DC
|
Baltimore
|
Dulles
|
|
11.5"
|
1987
|
9.7"
|
1898
|
11.4"
|
1967
|
|
7.3"
|
1938
|
8.5"
|
1938
|
5.8"
|
1968
|
|
6.9"
|
1967
|
8.4"
|
1967
|
5.5"
|
1987
|
|
6.7"
|
1953
|
6.0"
|
1987
|
4.0"
|
1978
|
|
4.8"
|
1898
|
5.9"
|
1953
|
3.6"
|
1995
|
|
|
December
|
|
DC
|
Baltimore
|
Dulles
|
|
16.6"
|
2009
|
20.4"
|
1966
|
24.2"
|
1966
|
|
16.2"
|
1962
|
20.1"
|
2009
|
21.4"
|
2009
|
|
16.1"
|
1966
|
17.1"
|
1904
|
15.9"
|
1969
|
|
14.5"
|
1932
|
15.6"
|
1960
|
14.3"
|
1962
|
|
13.2"
|
1904,1945
|
14.7"
|
1932
|
11.9"
|
1982
|
|
|
January
|
|
DC
|
Baltimore
|
Dulles
|
|
31.5"
|
1922
|
32.6"
|
1996
|
30.9"
|
1996
|
|
25.1"
|
1918
|
31.3"
|
1922
|
29.9"
|
2016
|
|
24.4"
|
1935
|
30.0"
|
2016
|
28.8"
|
1987
|
|
23.8"
|
1996
|
25.1"
|
1987
|
21.4"
|
2000
|
|
21.3"
|
1966
|
23.1"
|
2000
|
19.0"
|
1966
|
|
|
February
|
|
DC
|
Baltimore
|
Dulles
|
|
35.2"
|
1899
|
50.0"
|
2010
|
46.1"
|
2010
|
|
32.1"
|
2010
|
40.5"
|
2003
|
34.9"
|
2003
|
|
30.6"
|
1979
|
33.9"
|
1899
|
27.6"
|
1979
|
|
28.7"
|
2003
|
33.1"
|
1979
|
27.2"
|
1983
|
|
21.0"
|
1983
|
27.2"
|
1983
|
18.0"
|
1967
|
|
|
March
|
|
DC
|
Baltimore
|
Dulles
|
|
19.3"
|
1914
|
25.6"
|
1892
|
19.8"
|
2014
|
|
17.1"
|
1960
|
22.2"
|
1942
|
15.5"
|
1993
|
|
17.0"
|
1891
|
21.6"
|
1960
|
14.6"
|
1999
|
|
15.5"
|
1900
|
14.7"
|
1943
|
10.8"
|
1984
|
|
12.7"
|
2014
|
14.3"
|
1937
|
10.5"
|
2015 |
|
|
April
|
|
DC
|
Baltimore
|
Dulles
|
|
5.5"
|
1924
|
9.4"
|
1924
|
4.0"
|
1990
|
|
4.0"
|
1889
|
5.0"
|
1894
|
2.6"
|
1982
|
|
3.5"
|
1915
|
5.0"
|
1916
|
2.5"
|
1996
|
|
3.0"
|
1918
|
4.5"
|
1915
|
1.0"
|
1973
|
|
2.0"
|
1894
|
3.0"
|
1917
|
0.6"
|
1964
|
|
|
Highest Seasonal (July 1 - June 30) Snowfall
|
|
DC
|
Baltimore
|
Dulles
|
|
56.1"
|
|
77.0"
|
2009-10
|
73.2"
|
2009-10
|
|
54.4"
|
|
62.5"
|
1995-96
|
61.9"
|
1995-96
|
|
46.0"
|
|
58.1"
|
2002-03
|
52.8"
|
2013-14
|
|
44.5"
|
|
51.8"
|
1963-64
|
50.1"
|
2002-03
|
|
41.7"
|
|
51.1"
|
|
44.6"
|
1963-64
|
|
Lowest Seasonal (July 1 - June 30) Snowfall
|
|
DC
|
Baltimore
|
Dulles
|
|
0.1"
|
|
0.2"
|
2022-23
|
0.4"
|
2022-23
|
|
0.1"
|
|
0.7"
|
1949-50
|
2.2"
|
1972-73
|
|
0.4"
|
|
1.2"
|
1972-73
|
2.6"
|
2001-02
|
|
0.6"
|
|
1.8"
|
2019-20
|
2.9"
|
2019-20
|
|
2.0"
|
|
1.8"
|
|
3.7"
|
2011-12
|
|
1991-2020 Normal Seasonal (July 1 - June 30) Snowfall
|
|
DC
|
Baltimore
|
Dulles
|
|
13.8"
|
19.4"
|
21.1"
|
|
Earliest Measurable Snowfall
|
|
DC
|
Baltimore
|
Dulles
|
|
0.3"
|
Oct 10, 1979
|
0.3"
|
Oct 10, 1979
|
1.3"
|
Oct 10, 1979
|
|
Latest Measurable Snowfall
|
|
DC
|
Baltimore
|
Dulles
|
|
0.5"
|
Apr 28, 1898
|
0.1"
|
Apr 28, 1898
|
1.0"
|
Apr 12, 1973
|
|
Daily Frequency of Snowfall (in Days Per Year)
|
| |
DC
|
Baltimore
|
Dulles
|
|
≥ 1"
|
5.2
|
5.7
|
5.4
|
|
≥ 2"
|
3.2
|
3.6
|
3.4
|
|
≥ 4"
|
1.3
|
1.6
|
1.8
|
|
≥ 6"
|
0.6 (3 in 5 years)
|
0.8 (4 in 5 years)
|
0.8 (4 in 5 years)
|
|
≥ 8"
|
0.3 (3 in 10 years)
|
0.4 (2 in 5 years)
|
0.4 (2 in 5 years)
|
|
≥ 10"
|
0.2 (1 in 5 years)
|
0.2 (1 in 5 years)
|
0.3 (3 in 10 years)
|
|
≥ 12" Snowfalls within a 3-Day Period
|
| |
DC (since 1884)
|
Baltimore (since 1892)
|
Dulles (since 1962)
|
|
Number of events
|
17
|
20
|
12
|
|
Frequency
|
0.13 (~1 in 8 years)
|
0.16 (~1 in 7 years)
|
0.22 (~1 in 5 years)
|
Because of the warm waters of the Gulf Stream just off our eastern shore, it is typical for the rain-snow line to right across Baltimore and Washington. When a storm strikes, southeast of the city often sees rain or a mixture of snow and ice turning to rain and areas to the northwest of the city typically gets more snow, sometimes mixing with ice (sleet and freezing rain). A total ice storm, however, is much less common. February 1994 proved that this region can get big ice storms. Ice storms are more likely to happen in January or February than in December or March. An essential component of an ice storm is for sub freezing air to be trapped at the surface, and this is more common during mid winter.
The winter of 1993-1994 was one of the iciest winters on record. Repeated storms from January into early March produced between 19 and 23 days of icy precipitation over greater metropolitan area. The worst storm struck on February 10-11, 1994 just from Fredericksburg into Southern Maryland. Freezing rain caused a thick glaze of ice across trees, power and phone lines and roads. Travel was extremely hazardous. Trees and utility lines fell under the weight of the ice. Some people were left without power and heat for up to two weeks due to the extent of the damage. This storm warranted a Presidential Disaster declaration for a swath of devastation from ice that stretched from Tennessee to Delaware. Damage to Maryland was estimated at over $20 million.
In February 1998, an ice storm hit Skyline Drive. Up to five inches of ice accumulated. So many trees came down that Shenandoah National Park had to be closed for up to two months to clear the debris!
Another significant ice storm was Jan 13, 2008 when there was a quarter inch of freezing rain glaze in the Baltimore/Washington metro area, and almost a half-inch on the Blue Ridge.
|
Most Recent Sub-Zero Days
|
|
DC
|
Baltimore
|
Dulles
|
|
-4 1/19/1994
|
-1 2/5/1996
|
-2 1/31/2019
|
|
Number of Sub-Zero Days from 1962-2024 (# 2000-2024)
|
|
DC
|
Baltimore
|
Dulles
|
|
4 (0)
|
17 (0)
|
62 (5)
|
|


 Coastal Flood
 FAQ
FAQ