 |
| Yearly Reports |
| Interested in what kind of weather occurred in a recent year? Check out the most memorable events below. |
|
|
 |
Arkansas Yearly Climate Summary (2017)/Pg2 |
 |
| |
| Other Events: March 11 (Snow) |
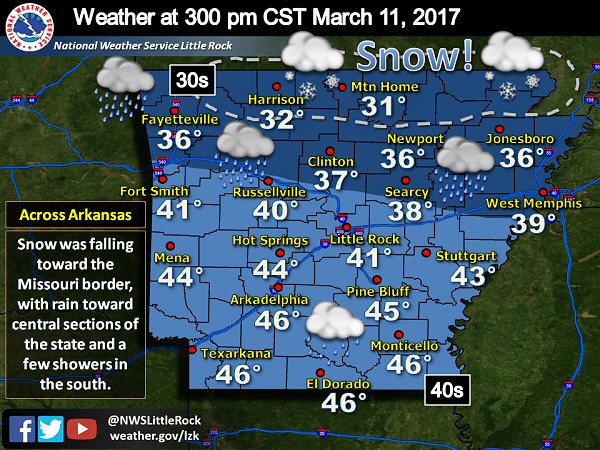 |
| In the picture: Temperatures were in the 30s across northern Arkansas with snow toward the Missouri border at 300 pm CST on 03/11/2017. It was raining toward central sections of the state, with a few showers farther south. |
|
| |
|
There is a winter episode to mention. On March 10th, a front pushed to the south and it started turning cooler and dried out. Data showed storm systems forming along the front, and pulling moisture back into the region on the 11th.
As moisture returned, showers popped up during the morning of the 11th. Temperatures were only in the 30s and 40s. In the northern two to three rows of counties, the atmosphere cooled aloft in the afternoon. Subfreezing air overhead and a lack of melting yielded snow, and it was heavy at times.
|
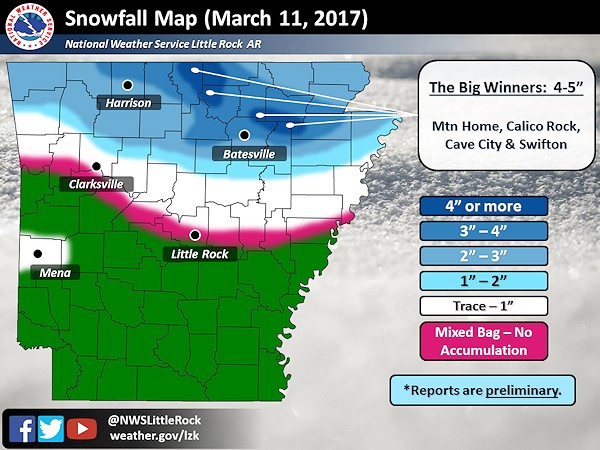 |
| In the picture: Preliminary snowfall totals on 03/11/2017. |
|
| |
|
More than four inches of snow piled up at a few locations in the north. At Cave City (Sharp County), 5.0 inches was measured, with 4.8 inches at Calico Rock (Izard County), 4.0 inches at Mountain Home (Baxter County) and Swifton (Jackson County), 3.8 inches near Jonesboro (Craighead County) and Snow (Marion County), and 3.5 inches at Batesville (Independence County), Bergman (Boone County), Onia (Stone County), and Salem (Fulton County).
|
| More Snow Than Expected |
|
The forecast called for one to two inches of snow at most. Maximum reported amounts were more than double expected totals. There are several reasons why this happened:
(1) Underestimated Moisture: It was thought that a quarter to a half inch liquid would be available for snowmaking. In reality, there was a half to three quarters of an inch.
(2) Faster Changover: The switch from rain to snow was supposed to occur in the late afternoon. The transition happened several hours sooner.
(3) Higher Rates: Instead of a nice steady snow, there were bursts of snow that piled up faster than anticipated.
(4) Overestimated Warm Ground: There was way too much emphasis on melting of snow given soil temperatures in the 50s. Snow fell more quickly than it could melt.
|
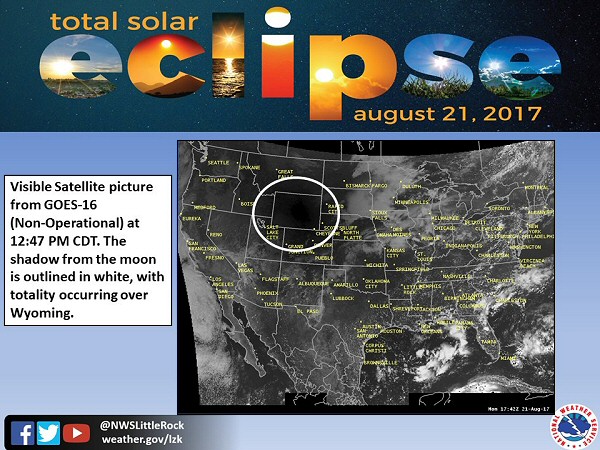
| Other Events: August 21 (Eclipse) |
|
|
| |
|
There was a partial eclipse on August 21st (and a total eclipse just to the north). The sun obscured the moon by as much as 82 percent in the southwest to 97 percent in the northeast. This happened during the heat of the early afternoon. Temperatures dropped more than five degrees in some cases, especially in the north/east (where obscurations were highest).
|
| Other Events: October 28-29 (Early Freezes) |
|
|
| In the picture: Freeze Warnings were posted for all of Arkansas at 630 pm CDT on 10/28/2017 (for the next morning). |
|
| |
|
Finally, on the morning of October 28th, the low temperature at Little Rock (Pulaski) was 31 degrees. This freeze was more than two weeks premature (a typical first freeze is November 14th). Locally, it was the first freeze in October since 1993, and the earliest freeze since October 20th, 1989. It froze again the next morning, with a reading of 28 degrees. This was the second coldest October temperature on record (which was 27 degrees on the 30th of 1917), and the first time with multiple October freezes since 1957.
|
| Events of the Year Nationwide: Tornadoes, The Tropics, Wildfires, and Snow |
|
|
| In the picture: There were numerous severe weather reports, including tornadoes, on January 20-22, 2017. The image is courtesy of the Storm Prediction Center. |
|
| |
|
On the 18th anniversary of the largest tornado outbreak on record in Arkansas, severe weather was expected to be widespread across the southeast states on January 21st/22nd. An intense storm system barreled toward the region from the southern Plains, with mild/unstable air increasing from the Gulf Coast.
During the predawn hours of the 21st, a destructive tornado (rated EF3) ripped through the south side of Hattiesburg, MS. Four people were killed. Before dawn the next morning, a similar tornado hit areas around Adel, GA. This resulted in eleven fatalities. Later in the day, the Storm Prediction Center issued a rare High Risk (the first since 2014) for severe weather in southern Georgia and northern Florida. A long track (71 miles) large wedge tornado slammed into Albany, GA, with four people losing their lives.
In all, at least twenty people were killed during this event, making it the second deadliest January outbreak since 1950. In all of 2016, there were seventeen tornado related deaths. In Georgia alone, there were 42 tornadoes during this two day episode, breaking a state record.
|
| Tornadoes in the Midwest |
|
Tornadoes were violent in parts of Missouri, Illinois, and Indiana on February 28th. A long track (50 miles) tornado tore through areas from Perryville, MO to Christopher, IL. It was the highest rated tornado (EF4) of the year (along with another tornado that tracked through Canton, TX on April 29th). There were three EF3 tornadoes that affected Crossville, IL, Ottawa, IL, and Washburn, IL. The latter two tornadoes were the farther north in February in Illinois recorded history.
|
|
|
| In the picture: Very large hail was reported on the west side of Denver, CO on 05/08/2017. |
|
| |
|
Golf ball to baseball size hailstones pounded the west side of Denver, CO on May 8th. The storm responsible for the very large stones arrived just in time for the evening rush hour, and numerous vehicles were pummeled. Home and vehicle insurance claims were expected to reach $1.4 billion, making this the most expensive natural disaster in Colorado state history.
|
 |
| In the picture: Major Hurricane Harvey made landfall along the Texas Gulf Coast during the evening of 08/25/2017. |
|
| |
|
It was a bad situation to the southwest of Arkansas on August 25th. Harvey had become a major hurricane (Category 4), with 130 mph sustained winds. The system came ashore near Rockport, TX during the late evening, and hit with wind and waves. Numerous homes and businesses were heavily damaged or destroyed, and a 10 to 12 foot wall of water flooded the region. That was phase one of this event.
|
| Flooding in Kansas City |
|
Surrounding Harvey, it was a record wet August in parts of Kansas City, MO. Rainfall totals from 10 to 15 inches were common. It all started late on the 5th. A system aloft interacted with a stalled front, and triggered scattered to numerous thunderstorms. Two to more than five inches of rain shut down a portion of Interstate 35 (flooding), and numerous rescues were performed (stranded motorists). Less than three weeks later, and following a solar eclipse on the 21st, rain came in buckets again. Amounts exceeded six inches on the south side of town. Dozens of people were rescued in flooded areas. Rising water forced a family of seven to go to the roof of a home. A woman found safety in a tree to escape record flooding along Indian Creek. Several schools were closed on the 22nd.
|
|
Phase two of Harvey was the rain, and a lot of it. Clouds unleashed two to more than four feet of precipitation just northeast of where the system went inland. Most of this occurred from the 26th through the 29th.
Why so much rain? Harvey was stuck in eastern Texas because there was nothing to push the system away. There was an impenetrable ridge of high pressure to the west, and a northwest wind flow aloft (forcing Harvey to the south) over the eastern United States.
|
|
|
| In the picture: Ninety six hour (four day) rainfall through 1200 am CDT on 08/30/2017. |
|
| |
|
Through the 29th, one site on the east side of Houston, TX (Cedar Bayou) reported 51.88 inches of rain. This is the most rain from a single tropical system in the continental United States, topping the previous record of 48 inches at Medina, TX with Tropical Storm Amelia in 1978. Almost 40 inches of liquid was measured for the month at Houston's Intercontinental Airport, making August, 2017 the wettest month on record locally.
Colossal amounts of rain led to epic and catastrophic flooding, with water flowing into thousands of structures and many calls for help from residents. One local meteorologist estimated 100,000 homes flooded. Both airports (Intercontinental and Hobby) were closed. Just northeast of town, multiple explosions happened at a chemical plant in Crosby, TX early on the 31st. The chemicals needed to stay cool, but generators used to power refrigerators (when electricity failed) became waterlogged.
|
| A Year of Rain in Four Days |
|
In an average year at Little Rock (Pulaski County), 49.75 inches of rain falls (based on data from 1981 to 2010). Parts of Houston, TX got this much or more liquid in four days!
|
|
Roughly 80 miles away (to the northeast), a staggering 26.03 inches of rain swamped Beaumont-Port Arthur, TX on the 29th. This more than doubled the local one day precipitation record of 12.76 inches on May 19, 1923. It was also more than any month on record, topping the 22.74 inches received in November of 1902. Another 14.50 inches dumped the previous two days.
Much of the two city area was transformed into a lake. A shelter was evacuated as it began filling with water. The largest oil refinery in the country was forced to shut down. The Neches River was expected to crest (in early September) above the previous high mark (in October, 1994) by six feet. A pumping station along the river became overwhelmed early on the 31st, and left residents with no clean water supply.
To add to the chaos, more than a dozen brief tornadoes were counted in eastern Texas. This dire situation led to at least 80 fatalities. One drowning victim was a police officer trying to get to work through a flooded underpass in the darkness.
|
|
|
| |
|
The journey of Irma started 300 miles west of the Cape Verde Islands on August 30th. After traveling more than 3,000 miles and ripping across several Caribbean Islands and northern Cuba, Hurricane Irma slammed into the Florida Keys early on September 10th as a Category 4 storm (130 mph winds). Gusts at Key West, FL neared 100 mph before wind observations stopped around 700 am CDT.
At one time, Irma was the strongest tropical system (185 mph winds) with the lowest pressure (913 mb) in the Atlantic Ocean (excluding the Gulf of America and Carribbean Sea). This was the second Atlantic Basin storm with at least Category 4 status to make landfall in the United States in the same season (Harvey was the first). This had not happened since records began in the 1850s.
|
|
|
| In the picture: The National Weather Service in Key West, FL (via Twitter) advised residents to exit the Keys on 09/09/2017 (before the arrival of Hurricane Irma). |
|
| |
|
Before the arrival of Irma, the National Weather Service in Key West, FL urged residents to evacuate (warning "nowhere in the Florida Keys will be safe").
After Irma exited the Keys (to the north), counter-clockwise rotation around the system forced water away from the Gulf Coast of Florida (at cities such as Tampa, FL). According to reports, water levels were eerily low, luring people to check out the spectacle. The National Hurricane Center put out an urgent statement at 115 pm CDT that the tide would change dramatically after the passage of the eye of Irma. Water would rush back toward the coast, with a life threatening storm surge of 10 to 15 feet.
At 235 pm CDT, Irma went inland at Marco Island, FL as a Category 3 storm (115 mph sustained winds), and caused considerable damage. Nearby, there was a gust to 142 mph at Naples, FL.
|
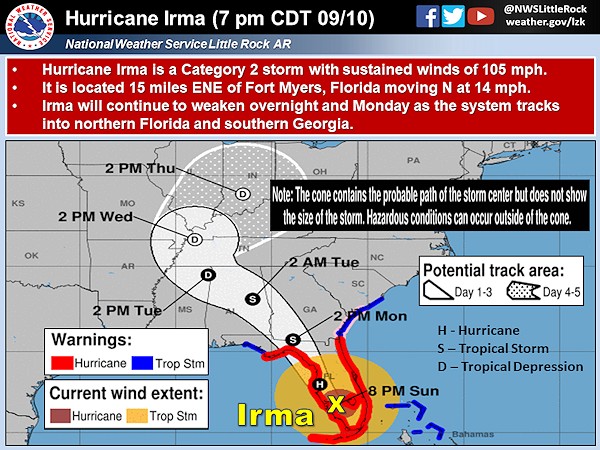 |
| In the picture: Hurricane Irma was near Fort Myers, FL at 700 pm CDT on 09/10/2017, with a projected track northward along the Florida Gulf Coast into southern Georgia. |
|
| |
|
During the night of the 10th/early on the 11th, Irma proceeded north (at around 15 mph) through Florida, and was downgraded from hurricane to tropical storm. Even so, the system knocked out power to more than six million customers across the state. Because Irma was on the move, it was not a colossal rainmaker (mostly 5 to 15 inch amounts) like Harvey, which unleashed more than 50 inches of precipitation in eastern Texas in late August. Harvey was nearly stationary for a few days before departing to begin September.
While Irma was on the decline and not dumping feet of liquid, there were still significant headlines on the 11th. Flash Flood Emergencies were posted for Jacksonville, FL and Charleston, SC due to heavy downpours and a four to six foot storm surge (onshore flow bringing sea water toward land). Parts of these cities were converted into lakes. At the former location, creeks and streams in and near town were at record levels. The tide at the latter location was the third highest in recorded history (the highest was Hurricane Hugo in 1989). There were also several Tornado Warnings issued. At Atlanta, GA, there were several inches of rain and wind gusts to around 60 mph. Across a three state area (Florida, Georgia, and South Carolina), more than 70 people were killed.
|
|
|
| In the picture: Hurricane Maria dismantled the WSR-88D (Doppler Weather Radar) at San Juan, PR on 09/20/2017. |
|
| |
|
On the 20th, Hurricane Maria pummeled Puerto Rico. Maria hit the island as a Category 4 storm (155 mph sustained winds), which was the strongest such storm to hit the area since 1932. Electricity was cut off to nearly everyone, and communication was nearly impossible. There were dwindling supplies of food, water, and medicine, making this a humanitarian crisis. The storm was blamed for over 60 deaths. The National Weather Service in San Juan was impacted, with its WSR-88D (Doppler Weather Radar) ripped apart.
|
| Death Toll Higher? |
|
Months after Maria, a Harvard University study estimated 4000 to 5000 casualties in Puerto Rico. Several other studies suggested fatalities in the hundreds. The official death toll was eventually revised to 2975 people.
|
 |
| In the picture: A severe to exceptional drought (D2 to D4) was crippling farming/ranching operations in Montana and the Dakotas on 09/12/2017. |
|
| |
|
The worst drought of 2017 was in Montana and the Dakotas, and was at its peak during the summer and early fall. By early September, more than 70 percent of Montana had severe to exceptional drought conditions (D2 to D4). Due to the dryness, the state had a Top 5 most active fire season, with more than a million acres burned (including a 270,000 acre fire in the northeast near Jordan, MT). High temperatures reached 90 degrees twenty six times in July at Missoula, MT, and eighteen times at Bismarck, ND (normal highs at both sites are in the lower to mid 80s). The wheat crop was decimated, with well below average yields. Tanja Fransen, the Meteorologist in Charge of the National Weather Service office in Glasgow, MT, was quoted by one source as saying "this is as dry as it's been in recorded history and some of our recording stations have 100 years of data. A lot of people try to compare this to previous years, but really, you just can't."
|
| Really Dry in Albuquerque and Amarillo |
|
It was very dry to end the year in the Texas panhandle and parts of New Mexico. There was no measurable precipitation from October 14th through December 31st (79 days) at Amarillo, TX, the longest dry streak on record (dating back to 1892). At Albuquerque, NM, the streak was 87 consecutive days, which was the longest since 1956 (107 days).
|
|
|
| |
|
In early October, the situation was dire in California. Following a five year drought (which mostly ended earlier in the year), vegetation came back after buckets of winter rain. The vegetation became crispy in the summer given prolonged warm/dry weather. Late on October 8th and into the 9th, strong high pressure over the Pacific Northwest pumped strong (50 mph plus) easterly winds into northern sections of the state. One theory (which is under investigation) suggests these Diablo winds (much like the more famous Santa Ana winds over southern California) pushed drought weakened trees into power lines, and triggered numerous wildfires. The flames were fanned by high gusts and spread in a hurry.
|
|
|
| In the picture: The satellite showed several wildfires in northern California on 10/10/2017. |
|
| |
|
As of mid-October, roughly 250,000 acres (almost 400 square miles) had burned, including over 5,000 structures. At least 2,800 residences were destroyed in Santa Rosa, CA. Miles away from the wildfires, smoke got so bad in San Francisco, CA that people were sent to hospitals, schools were closed, and flights were delayed. The wildfires were blamed for more than 40 deaths.
In early December, winds kicked up in southern California, and at least two dozen wildfires started. The fires forced more than 200,000 residents to evacuate, One of the largest of these fires ravaged areas just northwest of Los Angeles, CA, and reduced over 1,000 structures to ashes. This monster fire started on the 4th, and was still burning two weeks later. The fire torched at least 270,000 acres, making it the largest December blaze in state history.
|
|
|
| In the picture: Heavy snow blanketed areas from south Texas to the Carolinas on December 7-9, 2017. |
|
| |
|
From December 7th through the 9th, it snowed across the deep south. Parts of eastern Alabama, northern Georgia, and western North Carolina got over 8 inches of powder. Several inches of snow was also measured in portions of south Texas, including close to half a foot at Falfurrias, TX. Thunder accompanied snow on the south side of Corpus Christi, TX. Snowfall rates kicked up, and 7 inches of flakes fell. At Brownsville, TX, only 0.3 inch of snow accumulated on the 8th, but this surpassed the seasonal total (0.1 inch) at Chicago, IL. It was only the second known measurable snow since 1895.
|
| A Lot of Snow in Erie |
|
It was a white Christmas in Erie, PA. Boy, was it! The city received 34 inches of snow, which not only shattered a record for December 25th (8.1 inches), it also broke the record for snow in a single day (20 inches on November 22, 1956). The next day, another 26.5 inches accumulated, bringing the two-day total to 60.5 inches. This surpassed all other two-day snowfalls in Pennsylvania since records were kept.
|
|
|