
Dangerous heat will expand from the Gulf Coast into the Southern Plains and Desert Southwest through week's end. Additional extreme heat impacting the Pacific Northwest will shift to the northern Plains by the weekend. Tropical Storm Bertha is expected to continue to impact portions of the northern Gulf Coast from the western Florida Panhandle to southeastern Louisiana through tonight. Read More >
Rich Naden and Eric Platt
Introduction
After the demise of the record breaking 1997-1998 El Niño and the present development of La Niña, it is appropriate at this time to investigate the occurrence and effect of La Niña on west Texas climate. El Niño/Southern Oscillation (ENSO) is an episode of anomalously high and low sea surface temperatures in the equatorial and tropical Pacific associated with large-scale swings in surface air pressure between the western and eastern tropical Pacific. Many researchers believe that ENSO plays a large role in determining mid-latitude weather and short term climate fluctuations. In fact, ENSO accounts for a greater proportion of variance of climatic and oceanic fields on time scales from a season to ten years than any other single phenomenon, with the exception of the annual cycle (Wright, 1985; Nicholls, 1988).
La Niña conditions feature sub-normal sea surface temperatures through much of the central and eastern equatorial Pacific Ocean, thus suppressing tropical thundershower activity in the region and inducing a weaker, more diffuse Pacific mid-latitude jet stream, and a different set of global weather changes. La Niña episodes are identified with strong up welling, cool waters, and descending air in the central to eastern Pacific and warmer waters with rising air in the western Pacific. The purpose of this paper is to show that there has been a direct negative effect (decrease) on precipitation at Midland, Texas during past La Niña events.
El Niño/La Niña Background
The terms El Niño and La Niña refer to opposite phases of sea surface temperature anomalies along the equatorial Pacific Ocean and the effects they induce on global weather patterns. The El Niño phase is associated with weak trade winds and lower pressure over the eastern Pacific while the La Niña phase is analogous with strong trades and lower pressure over the western Pacific. These two phases are considered the two extremes of the Southern Oscillation and are both identified with worldwide weather events. During an El Niño, above normal sea surface temperatures extend across the central and eastern equatorial Pacific Ocean, resulting in an increase in tropical thundershower activity from the International Dateline eastward, sometimes all the way to the South American coastline. This increase in convection, which results above the warm, moisture-laden sea surface, acts as a "block" in the atmosphere, resulting in a reconfiguration of the jet streams and in subsequent weather changes in various parts of the globe.
Conversely, La Niña conditions feature below normal sea surface temperatures through a large portion of the central and eastern equatorial Pacific Ocean. These cooler ocean waters tend to suppress tropical thundershower activity in these regions and induce less powerful upper atmospheric winds. The main effects of ENSO on the contiguous 48 states are seen from the late fall through early spring. This is because strong teleconnections between the tropics and mid latitudes are possible only when westerlies extend from the mid latitudes into the region of unusually warm or cold sea surface temperatures (Horel and Wallace, 1981; Webster, 1981; Schoner and Nicholson, 1989). This pattern is observed normally in winter, the time of year that most of the proposed teleconnections to the North American continent take place. La Niña winters are often characterized by strong intra seasonal fluctuations due to blocking episodes alternating with enhanced zonal flow as described on the NOAA/NWS Climate Prediction Center Web page. For many areas, especially the northern United States, La Niña winter's are more volatile and are subject to bouts of storminess and wide temperature swings, including more frequent, but progressive, arctic cold air outbreaks. Past research has indicated that the first three months of the year during a La Niña typically feature subnormal precipitation in the Southwest, the central and southern sections of the Rockies, Plains, and Florida.
Data and Methodology
This study is quite similar to work done at NWSO El Paso, Texas earlier this year (Reynolds, 1998). As with any ENSO study, a determination first had to be made as to what represents a La Niña, or cold event, year. The specific classifications for a La Niña are defined as an ENSO year during which the 5-month running means of the Niño 3 index SST anomalies are - 0.5C or less for at least six consecutive months; October, November, and December must be three of the months in this series. The series must originate before the beginning of the ENSO year (October). The definition of La Niña was specifically defined by the Japan Meteorological Agency (JMA) while a symmetric definition could be used for El Niño. The specific prerequisite of three months of the series being October, November, and December coincides with the normally observed maximums in SST anomalies during an ENSO year. If the explicit guidelines are modified the ENSO years will vary. So the generated results are affected by the criteria used to categorize the ENSO years.
In this study a weak La Niña year was defined as an ENSO year during which the index values were between - 0.5C and - 1.0C for six consecutive months, including October, November, and December. A moderate to strong La Niña was defined when the JMA index values were equal to or exceeded - 1.0C for the six consecutive months and including the months of October, November, and December. If any of these conditions were met, then the anomaly year from October through the following September is considered a La Niña year. Table 1 indicates the La Niña years used.
| Onset Years | Classification |
|---|---|
| 1938 | weak |
| 1942 | moderate - strong |
| 1944 | weak |
| 1949 | moderate - strong |
| 1954 | weak |
| 1955 | moderate - strong |
| 1964 | weak |
| 1970 | weak |
| 1973 | moderate - strong |
| 1975 | moderate - strong |
| 1988 | moderate - strong |
La Niña episodes defined using the JMA index date back to 1869 and the last moderate to strong, well documented event was in 1988. Midland precipitation records date back to 1930. The first La Niña event using the JMA index after 1930 is 1938-1939. Thus, the years of this study range from 1938 to 1988, and it is from those 51 years that normals of precipitation were calculated for Midland (Tables 2 & 3). Of the 51 years in this study, 11 were La Niña years. Midland monthly and seasonal precipitation totals were calculated for all of the La Niña years of this study and then were compared to monthly and seasonal precipitation totals for all of the years between 1938 - 1988 to determine the departure from normal precipitation during La Niña years. Besides departure from normals, average seasonal precipitation totals for La Niña years were compared to average seasonal precipitation totals for the non-La Niña years of this study. In this work, as with many other ENSO related articles, the autumn season is considered as September through November (SON), winter as December through February (DJF), and spring as March through May (MAM). The data calculations of this study were executed to demonstrate that a La Niña event has a negative effect on the Midland, Texas precipitation record.
|
Onset year |
Autumn (SON) Precip. |
Percent of Normal |
Winter (DJF) Precip. |
Percent of Normal |
Spring (MAM) Precip. |
Percent of Normal |
|---|---|---|---|---|---|---|
| 1942 | 3.27 | 72% | 2.45 | 141% | 3.54 | 100% |
| 1949 | 4.18 | 92% | 1.02 | 59% | 3.43 | 97% |
| 1955 | 1.53 | 34% | 0.32 | 18% | 2.56 | 73% |
| 1973 | 1.61 | 35% | 0.79 | 46% | 1.61 | 46% |
| 1975 | 6.23 | 137% | 0.51 | 29% | 3.35 | 95% |
| 1988 | 5.08 | 112% | 2.05 | 118% | 1.33 | 38% |
| Average | 3.65 | 80% | 1.36 | 69% | 2.64 | 75% |
| Onset year | Autumn
(SON) Precip. |
Percent of Normal | Winter
(DJF) Precip. |
Percent of Normal
|
Spring
(MAM) Precip. |
Percent of Normal |
|---|---|---|---|---|---|---|
| 1938 | 1.54 | 33% | 5.47 | 315% | 1.36 | 39% |
| 1944 | 7.69 | 169% | 2.00 | 115% | 0.87 | 25% |
| 1954 | 2.64 | 58% | 0.91 | 53% | 2.05 | 58% |
| 1964 | 2.53 | 56% | 2.12 | 122% | 3.38 | 96% |
| 1970 | 2.72 | 60% | 0.08 | 5% | 3.55 | 101% |
| Average | 3.42 | 75% | 2.12 | 122% | 2.24 | 64% |
Results
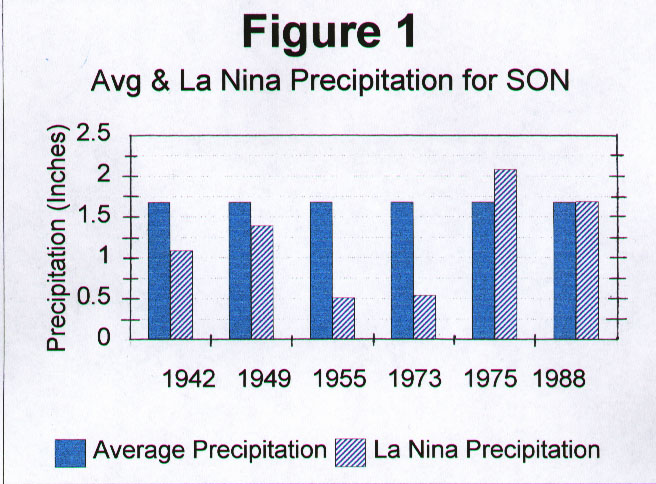
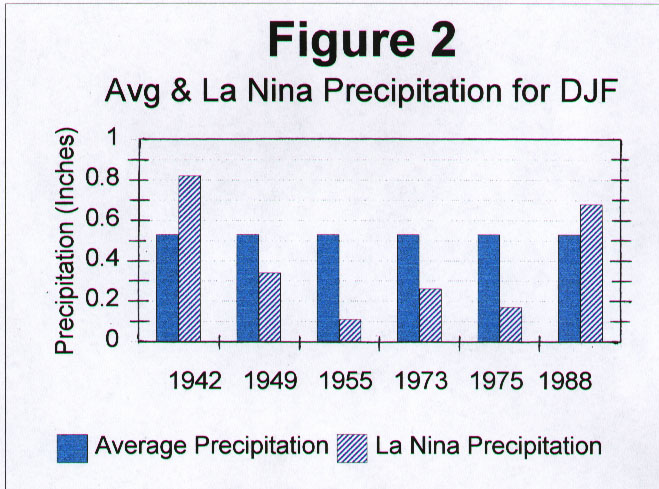
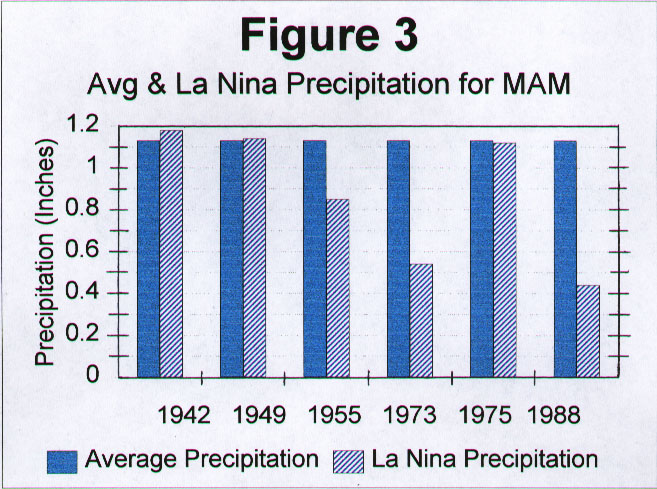
Evaluation of the data sets used in this study does indeed show an overall decrease in precipitation for La Niña years. Figures 1,2 & 3 display a comparison of the seasonal averages with the seasonal precipitation totals for each of the moderate to strong La niña events. Table 2 displays the precipitation totals and percentages of normal for moderate to strong La Niña events while Table 3 shows identical information for weak La Niña events. When combining both the weak (Table 3) and moderate to strong (Table 2) La Niña events it was found that 23 out of the 33 seasons (70%) had below normal precipitation. On average, precipitation received during any one of the three seasons was 69-80% of normal when normals computed with all the years inclusive of this study were used. Interestingly enough, during the spring season (MAM) of both weak and moderate to strong La Niña events, 9 out of the 11 spring seasons (82%) had below normal precipitation. With an average of just below 70% of normal precipitation, the spring season showed the greatest decrease in precipitation out of all three seasons studied.
 |
 |
 |
A comparison of the seasons used in this study shows that winter (DJF) holds the greatest variability in rainfall received. This would not be totally unexpected since the average precipitation was the least for the winter and the distribution of the observations would be further from a normal distribution that the other two seasons involved in this study. Winter percent of normals ranged from a high of 315% in 1938 to a low of 5% in 1970. Besides the high of 315% in 1938, precipitation received in any one of the seasons during all the La Niña years was greater than 141% of normal only one other time.
The results of this study demonstrate that La Niña has distinct effects on Midland, Texas precipitation. Overall, the moderate to strong La Niña events (Table 2) showed a greater likelihood to be below normal (75% of normal) for all three seasons when compared to the weak La Niña events (87% of normal).
Conclusions
Analyses of past La Niña studies and past precipitation records for Texas and the southern plains show there has been a negative effect (decrease) on precipitation totals during most La Niña years. From this study, the most decisive finding is that the precipitation totals in any given season for a La Niña year are likely to be below normal. The autumn and spring seasons are more likely than the winter season to have below normal precipitation with the spring season being the most likely. However, in rare cases, precipitation totals may exceed 315% of normal during a La Niña episode.
References
Horel, J.D., and J.M. Wallace, 1981: 'Planetary scale atmospheric phenomena associated with the Southern Oscillation', Monthly Weather Review., 109, 813-829.
Naden, Richard J, 1996: 'The ENSO Cycle Associated with United States Midwest Precipitation', Master's Thesis - University of Kansas.
Nicholls, Neville, 1988: 'El Niño-Southern Oscillation Impact Prediction', Bulletin of the American Meteorological Society, 69, 173-176.
NOAA/NWS, 1998: Climate Prediction Center Web page. [Available on-line from
NOAA/NWS Climate Prediction Center Web page]
Reynolds, J., 1998: 'The influence of La Niña on El Paso, Texas precipitation', Technical Attachment SR/SSD 98-24, NWS Southern Region, Fort Worth, TX, 4pp.
Schoner, T. and Nicholson, S.E. 1989: 'Relationship Between California Rainfall and ENSO Events', Journal of Climate, 2, 1258-1269.
Webster, P.J., 1981: 'Mechanisms determining the atmospheric response to sea surface temperature anomalies', Journal of Atmospheric Science., 38, 554-571.
Wright, P.B., 1985: 'The Southern Oscillation: An ocean-atmosphere feedback system?', Bull. Amer. Meteor. Soc., 66, 398-412.

