Moisture and nearby frontal boundary will focus more showers and thunderstorms for portions of the Mid-Atlantic and Northeast today. Rainfall could be locally heavy resulting instances of flash flooding. Meanwhile, the heat lingers for areas of the Southeast and expands across the Western U.S. the next several days. Between these areas, severe thunderstorms possible for the Plains and Midwest. Read More >
These images are updated once an hour. View neighboring state forecast data from Kansas and Iowa,
view local data for eastern NE and western IA, or view other forecast data at our National Digital Forecast Viewer.
Severe Weather Graphics
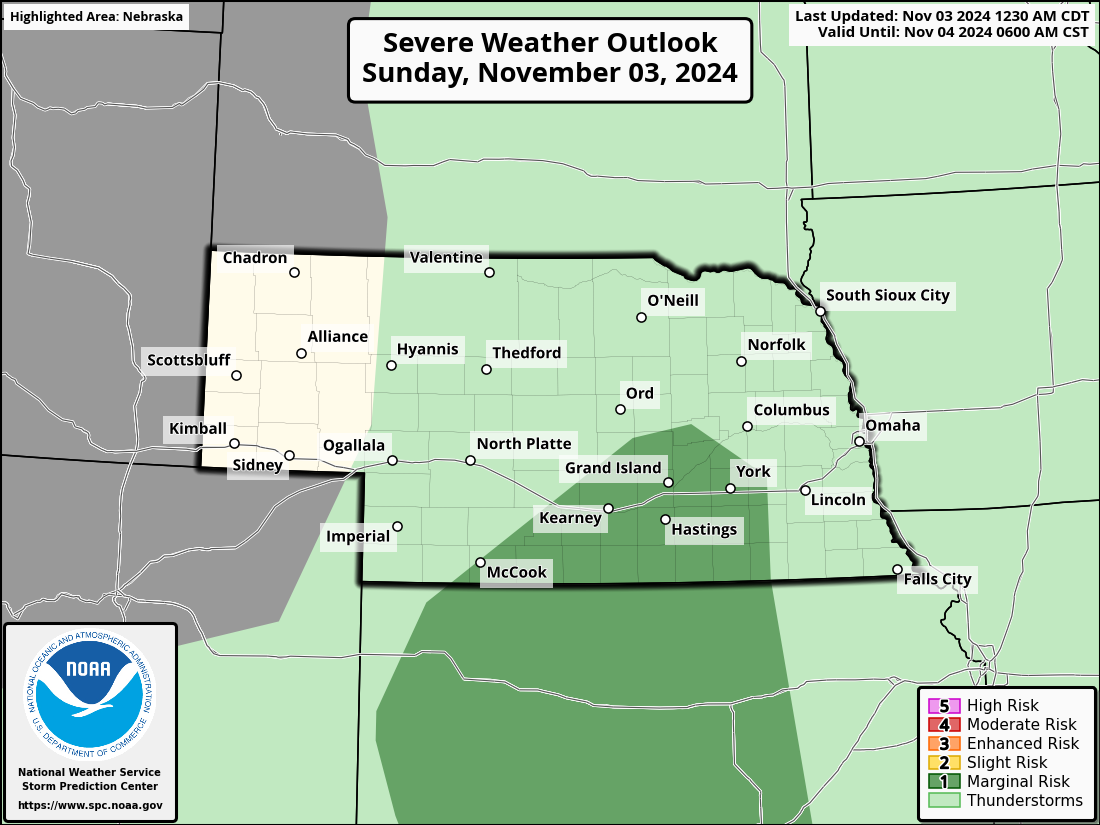
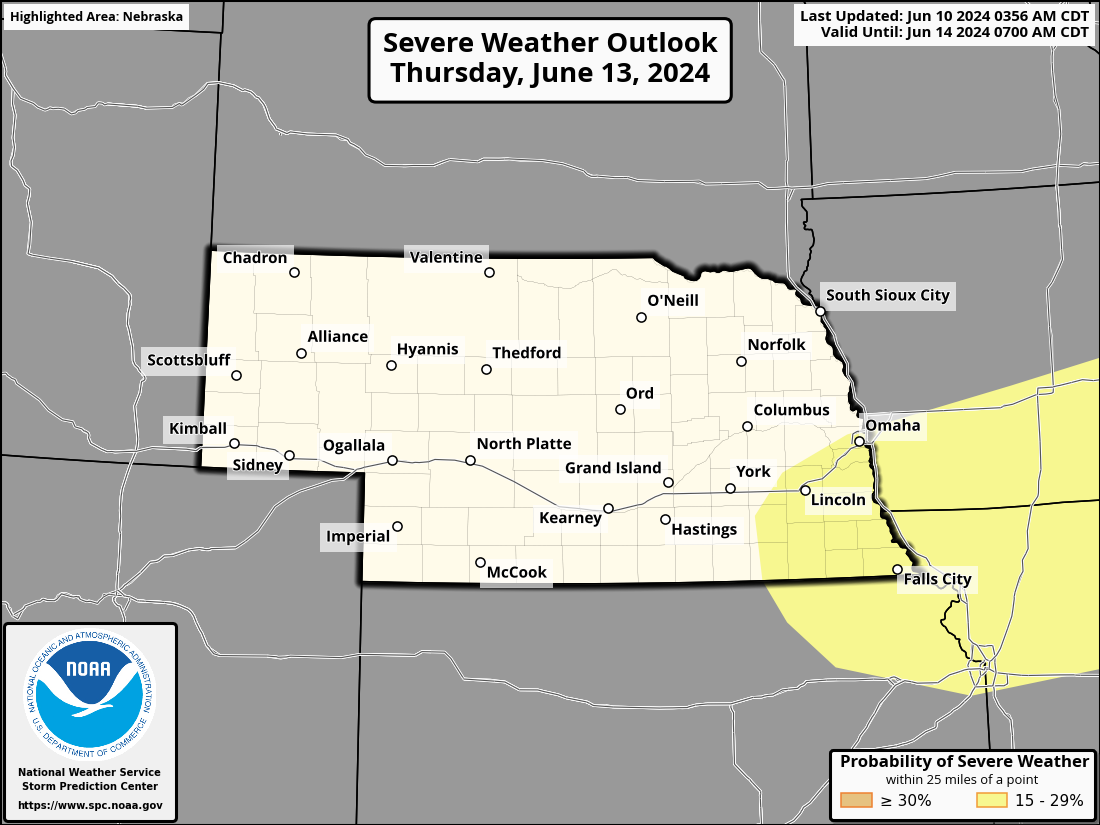
SPC Day 1 Outlook
|
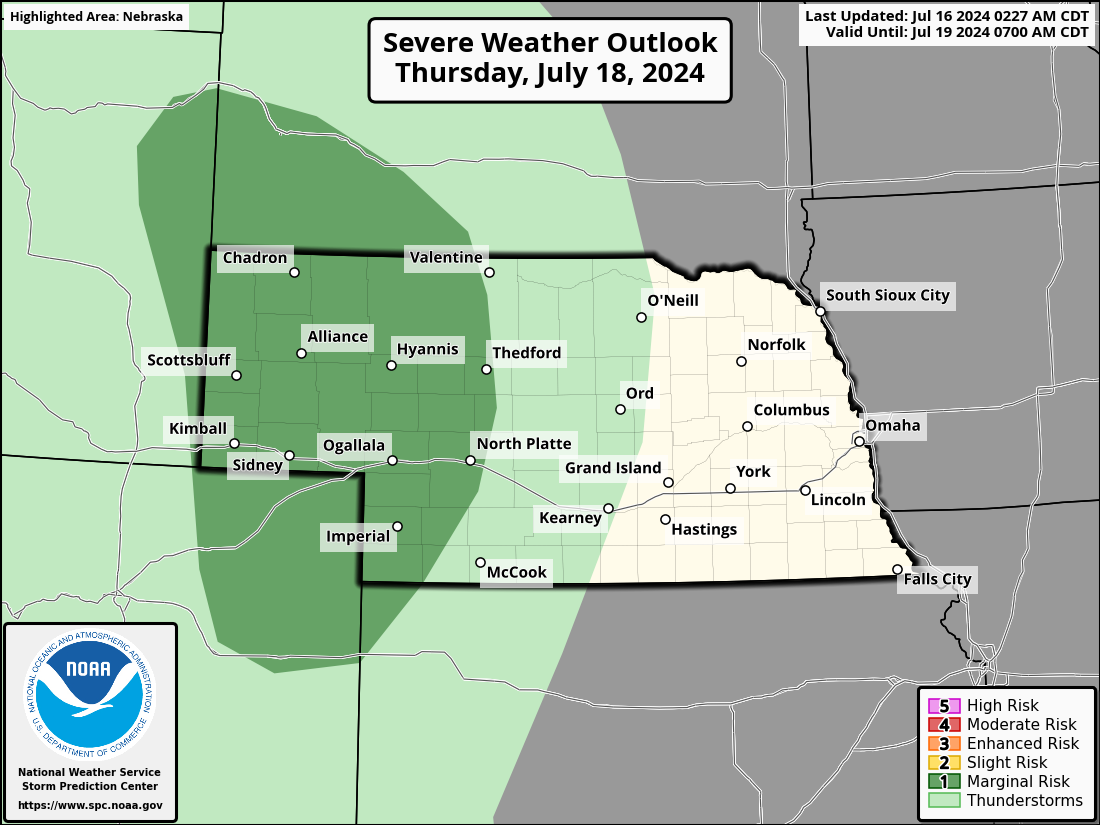
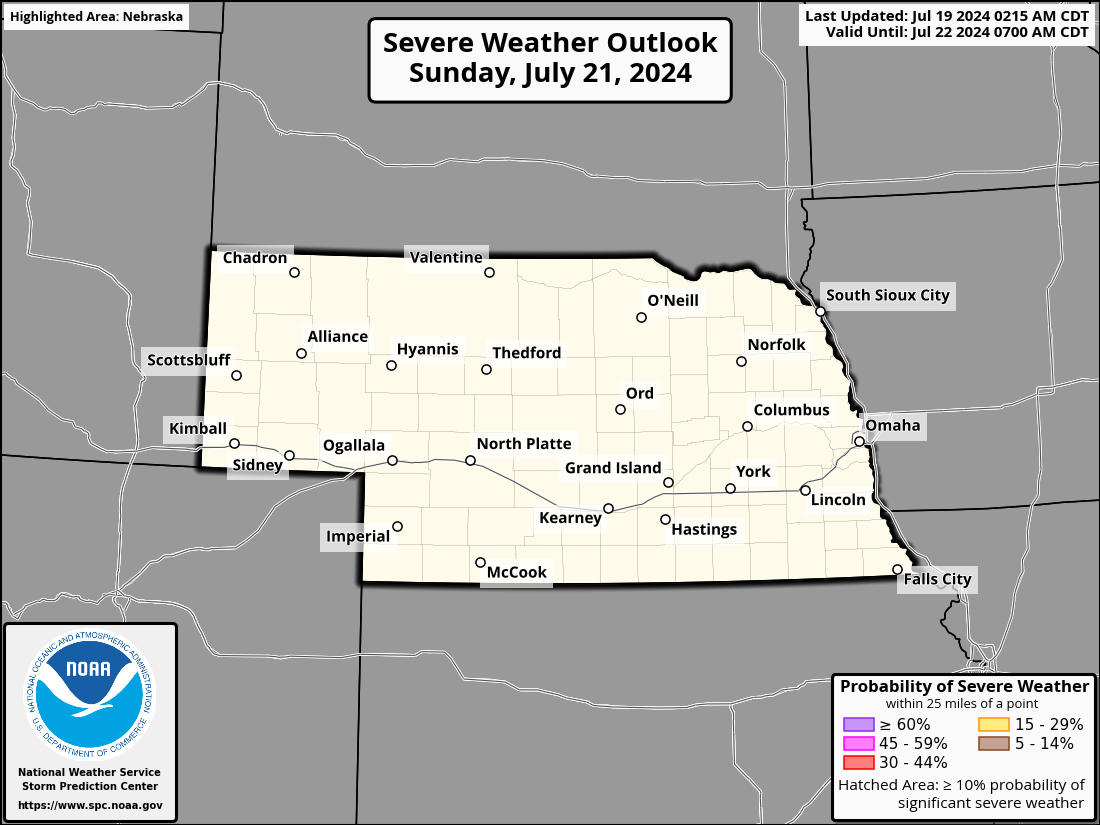
SPC Day 1 Severe Weather Outlook |
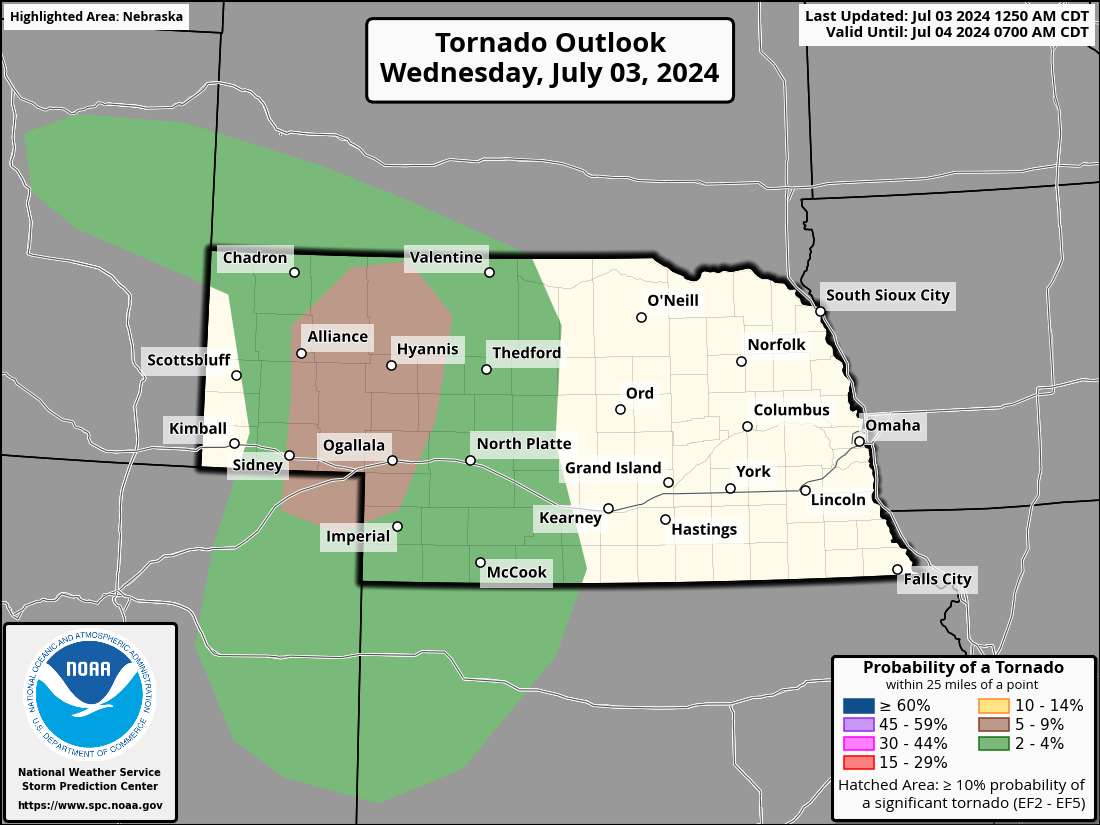
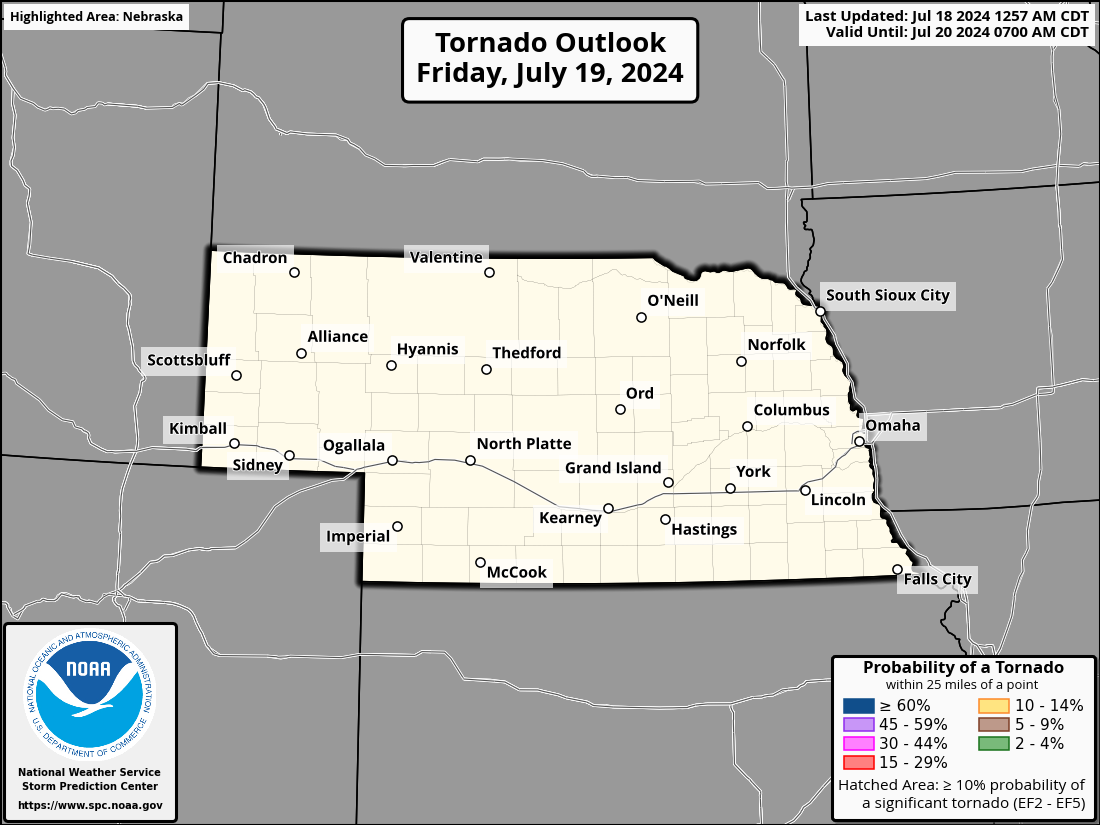
SPC Day 1 Tornado Outlook |
|
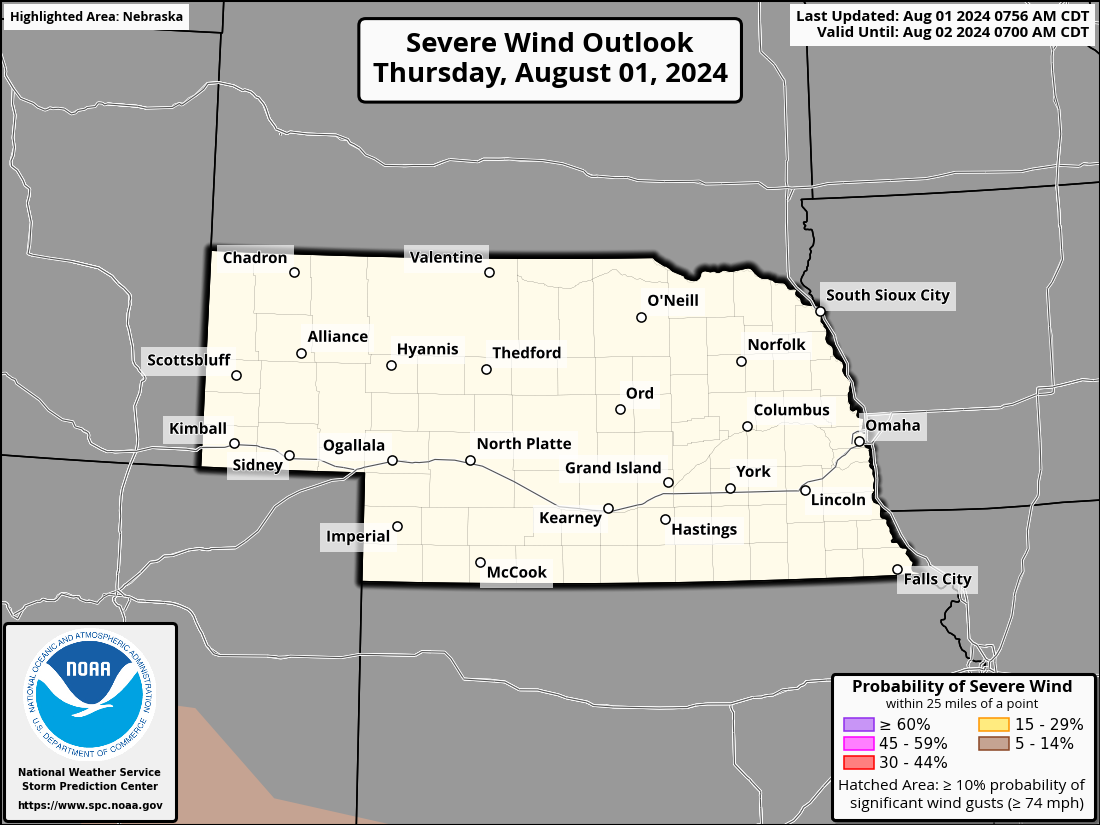
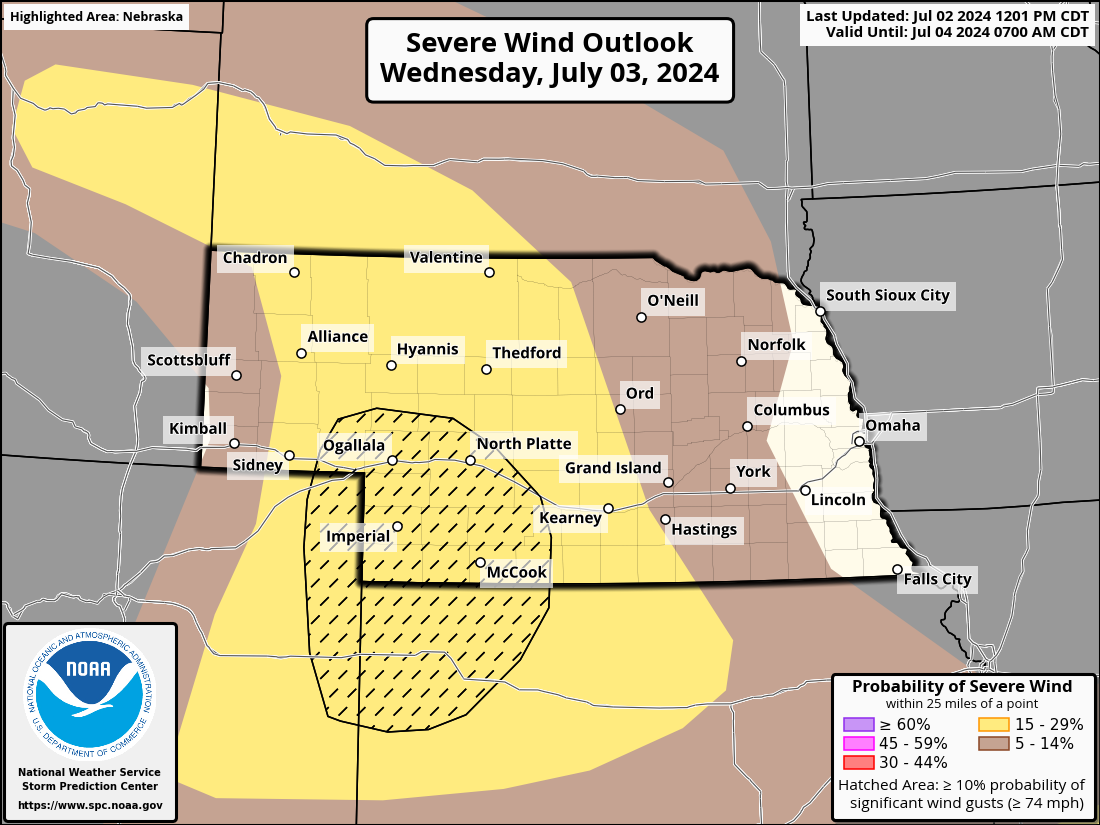
SPC Day 1 Wind Outlook |
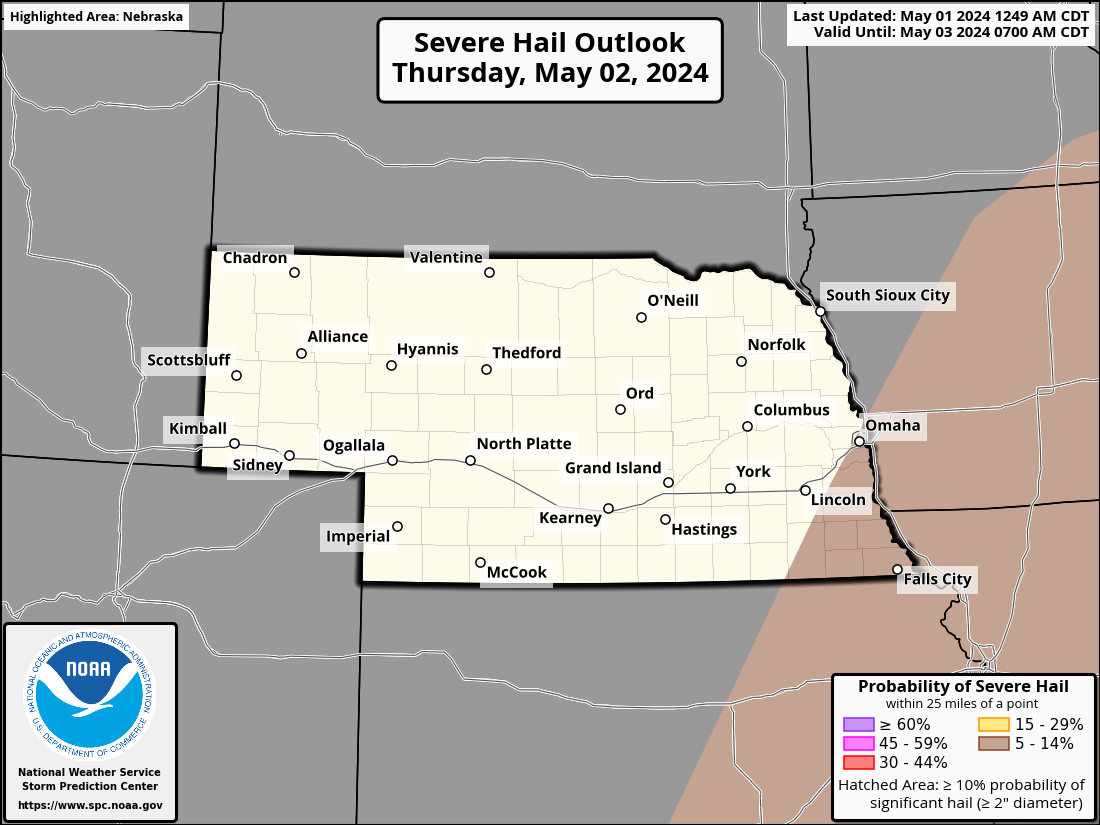
SPC Day 1 Hail Outlook |
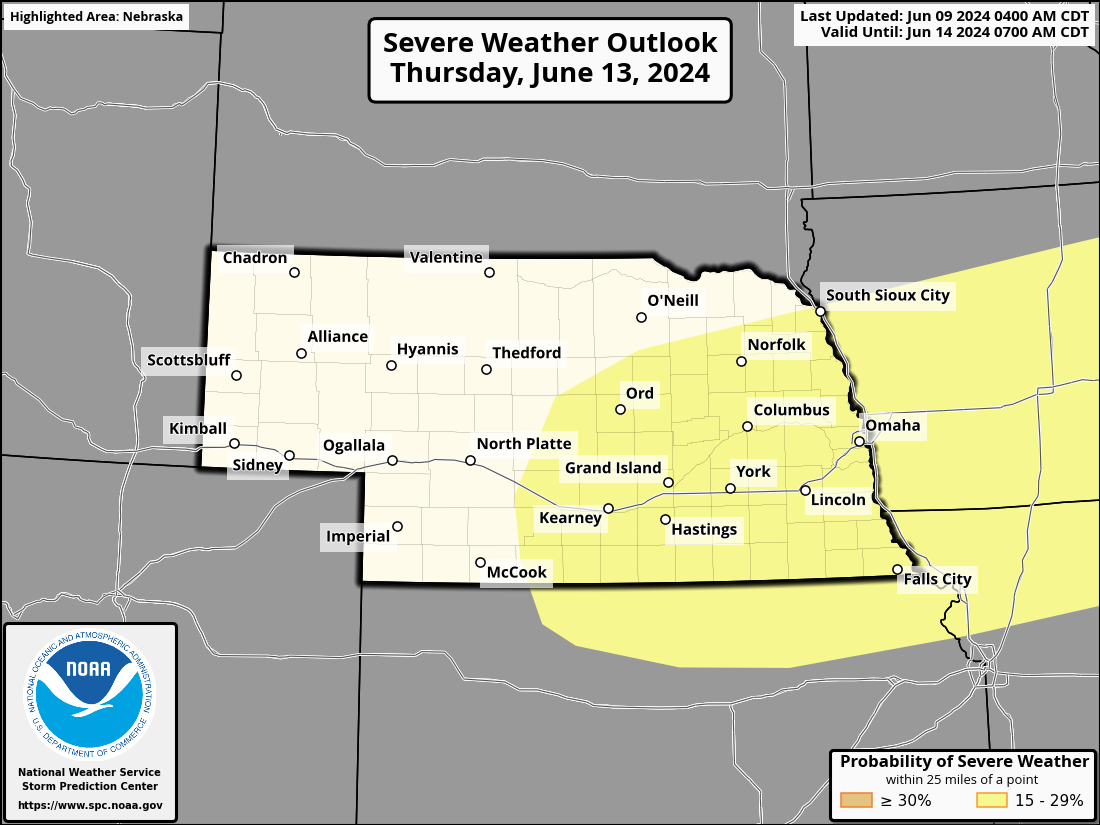
SPC Day 2 Outlook
|
SPC Day 2 Severe Weather Outlook |
SPC Day 2 Tornado Outlook |
|
SPC Day 2 Wind Outlook |
SPC Day 2 Hail Outlook |
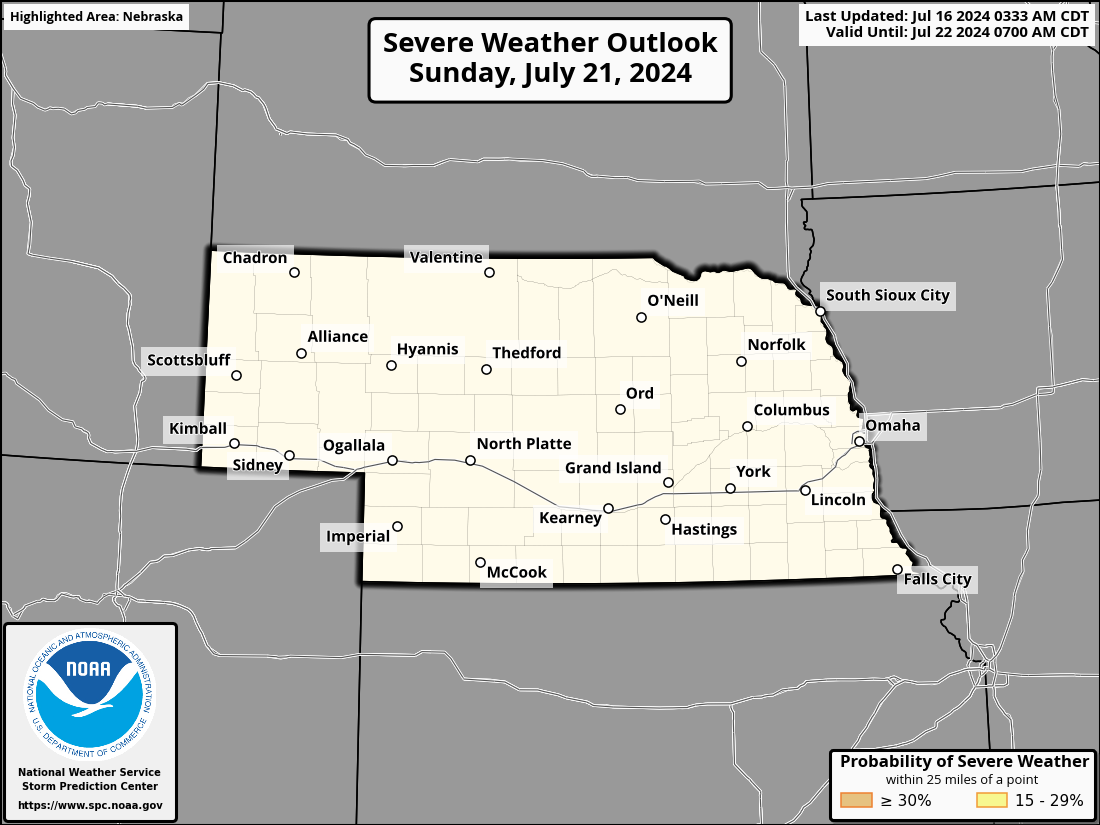
SPC Day 3 Outlook
|
SPC Day 3 Severe Weather Outlook |
SPC Day 3 Probabilistic Outlook |
SPC Days 4-8 Outlooks
|
SPC Day 4 Severe Weather Outlook |
SPC Day 5 Severe Weather Outlook |
|
SPC Day 6 Severe Weather Outlook |
SPC Day 7 Severe Weather Outlook |
|
SPC Day 8 Severe Weather Outlook |
|
Precipitation Graphics
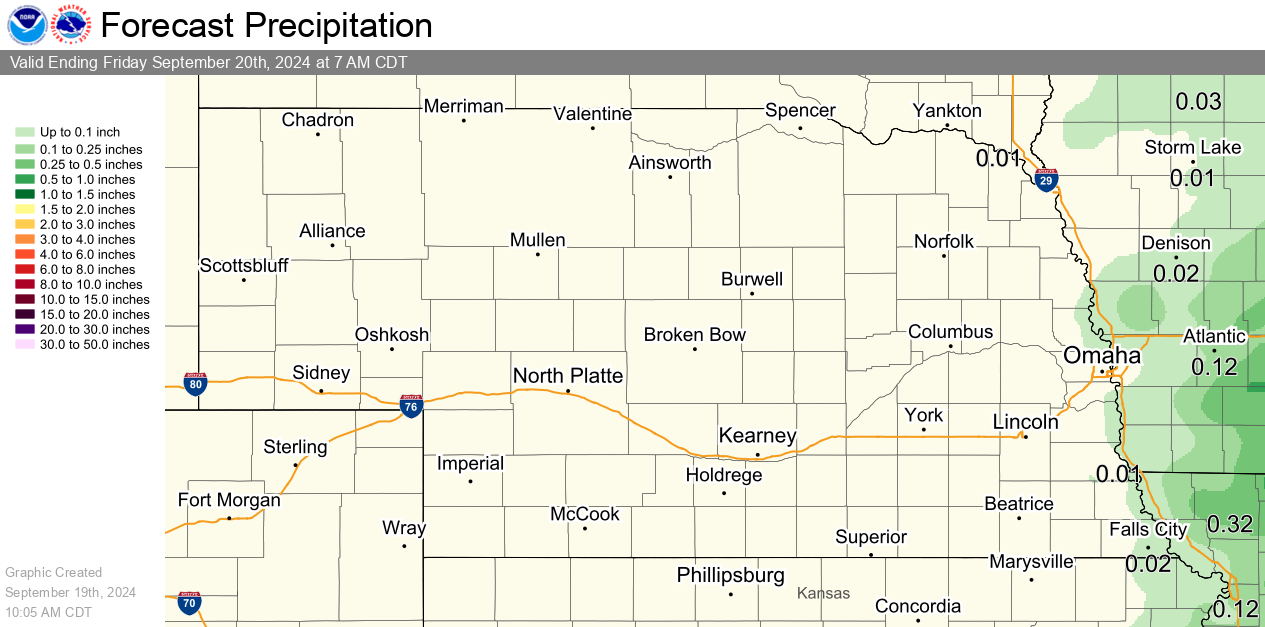
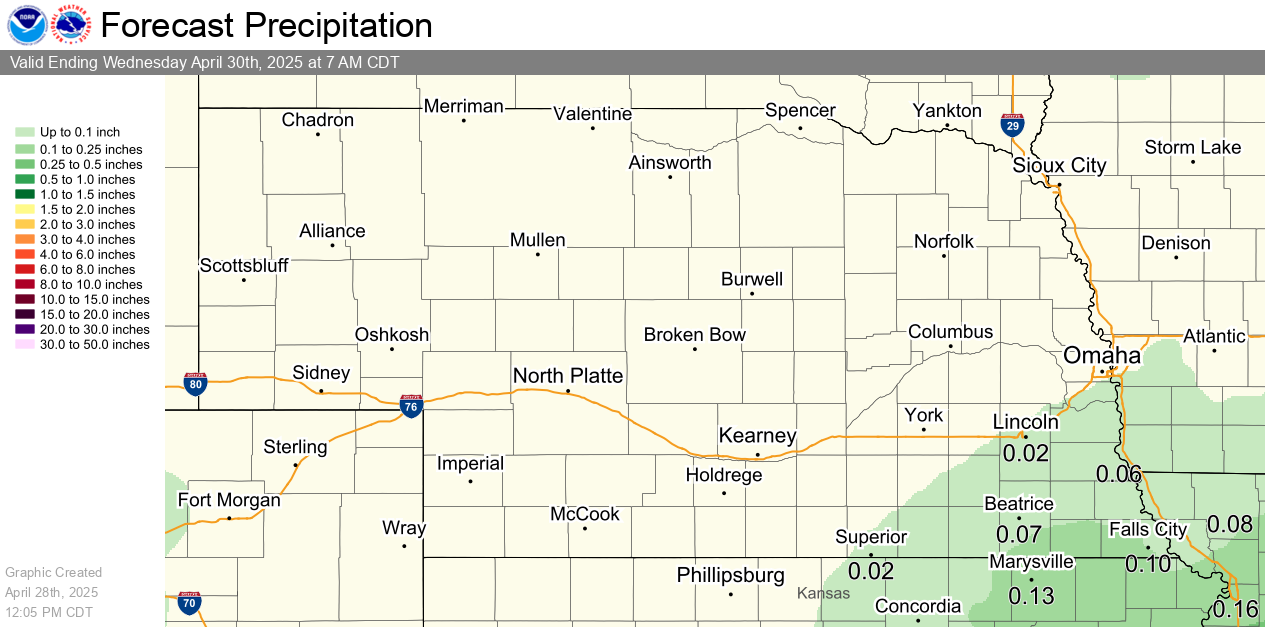
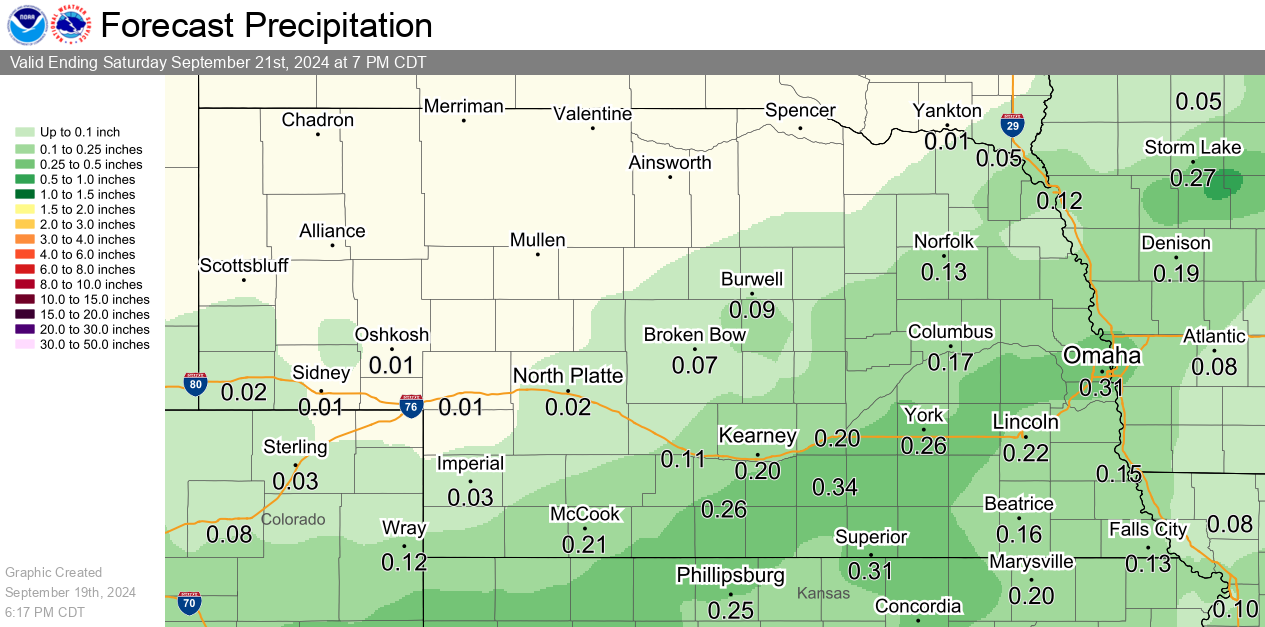
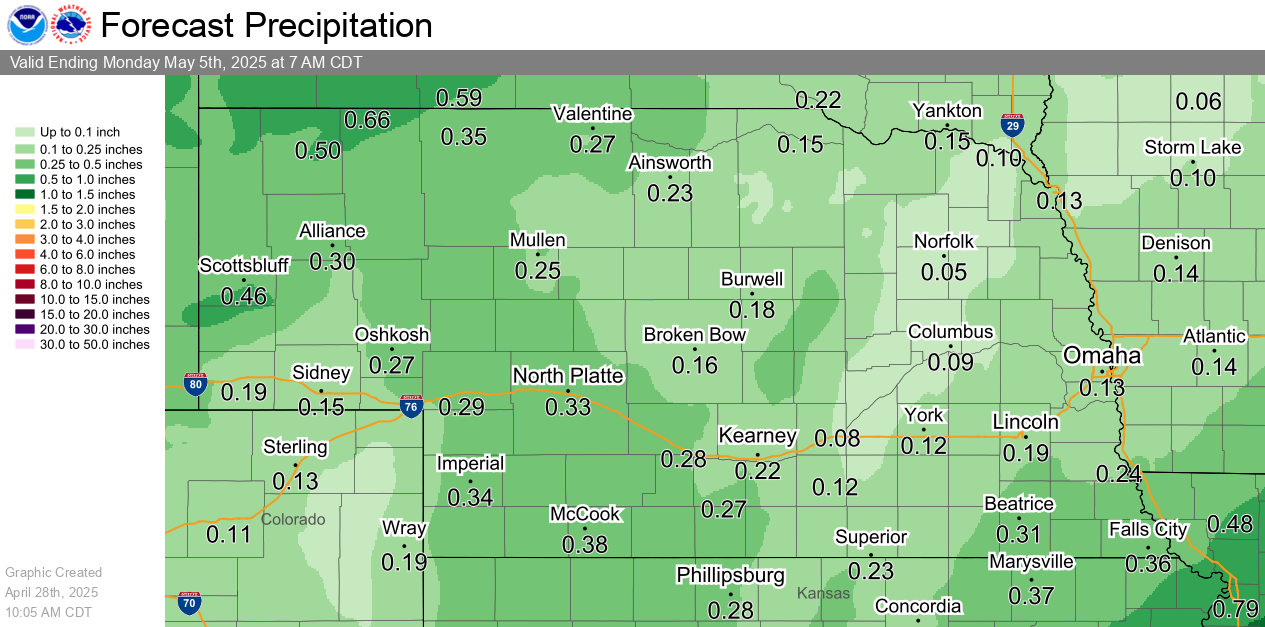
Rainfall Forecasts
Precipitation accumulation measured in six hourly periods, starting at 12am, 6am, 12pm, and 6pm CST (+1 CDT).
|
Day 1 24-hour Rainfall Forecast |
Day 2 24-hour Rainfall Forecast |
|
Day 3 24-hour Rainfall Forecast |
7 Day Rainfall Forecast |
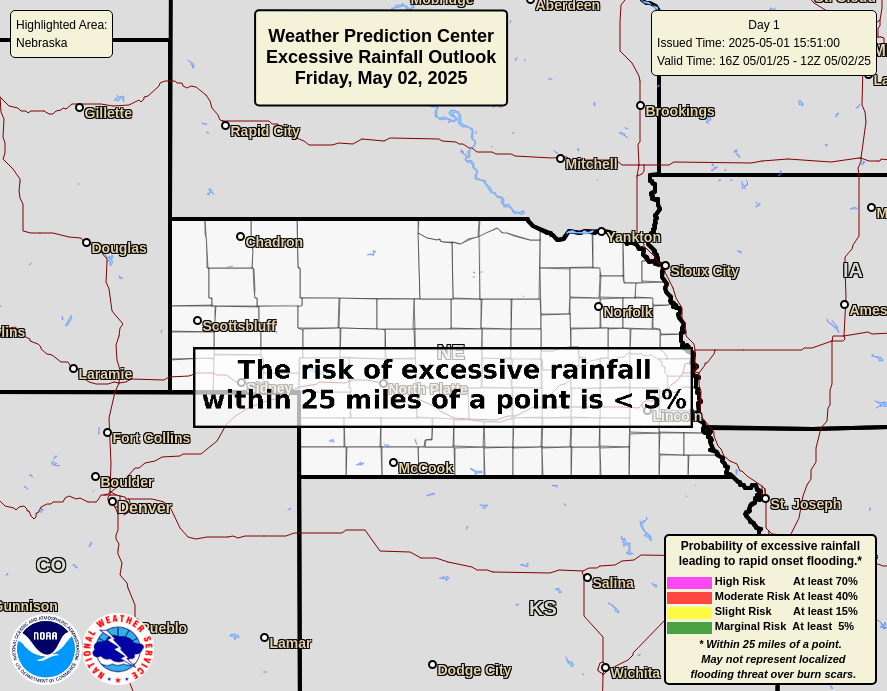
Excessive Rainfall Outlooks
|
Day 1 Outlook |
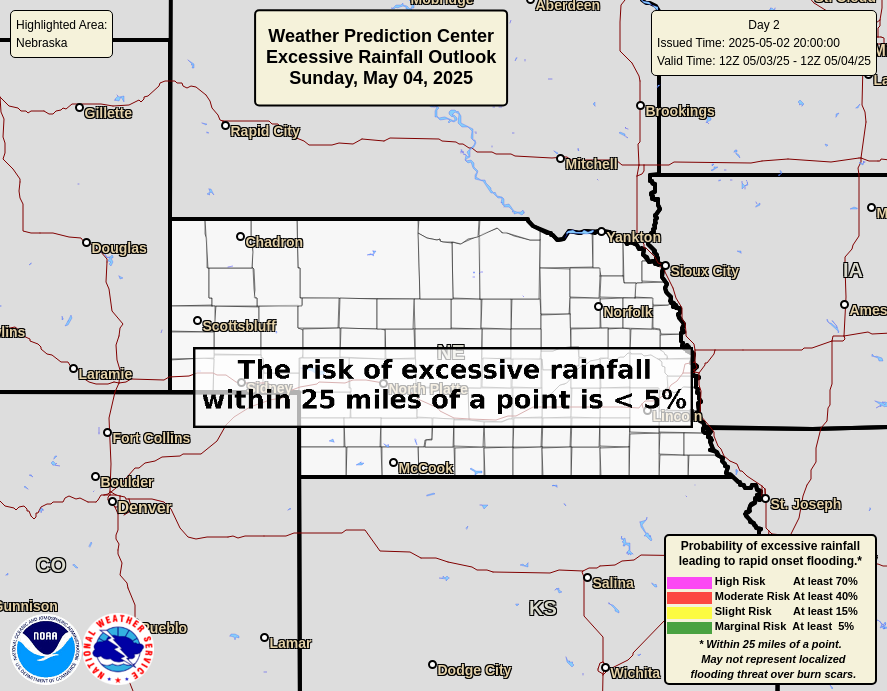
Day 2 Outlook |
|
Day 3 Outlook |
|
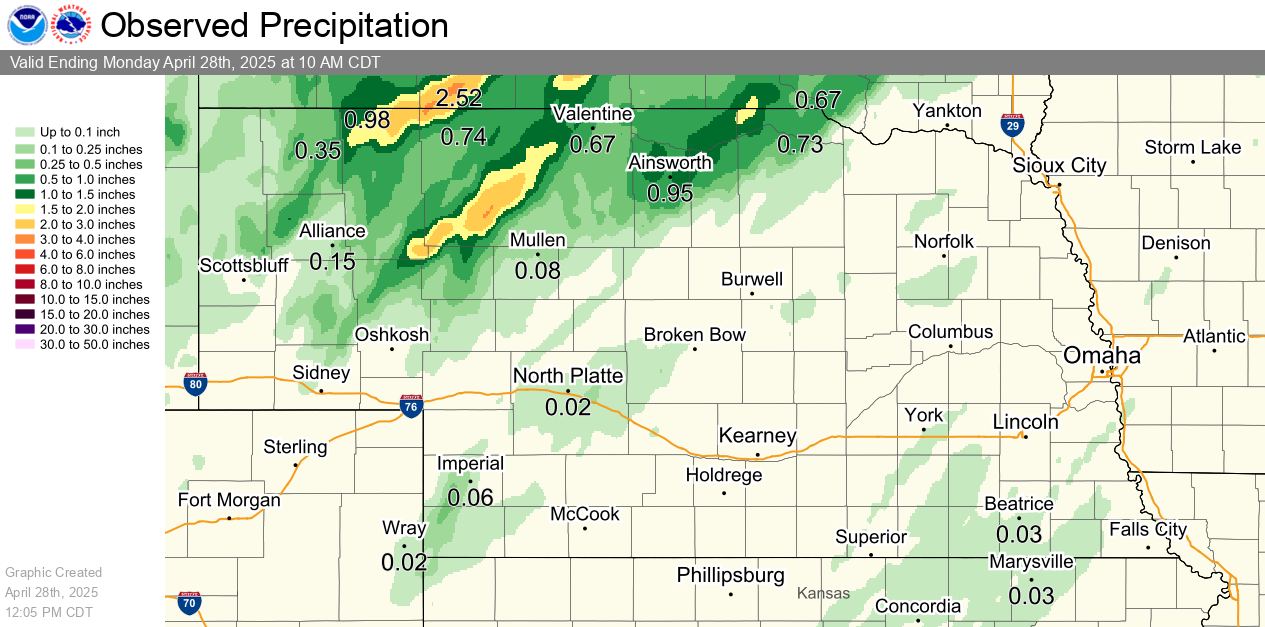
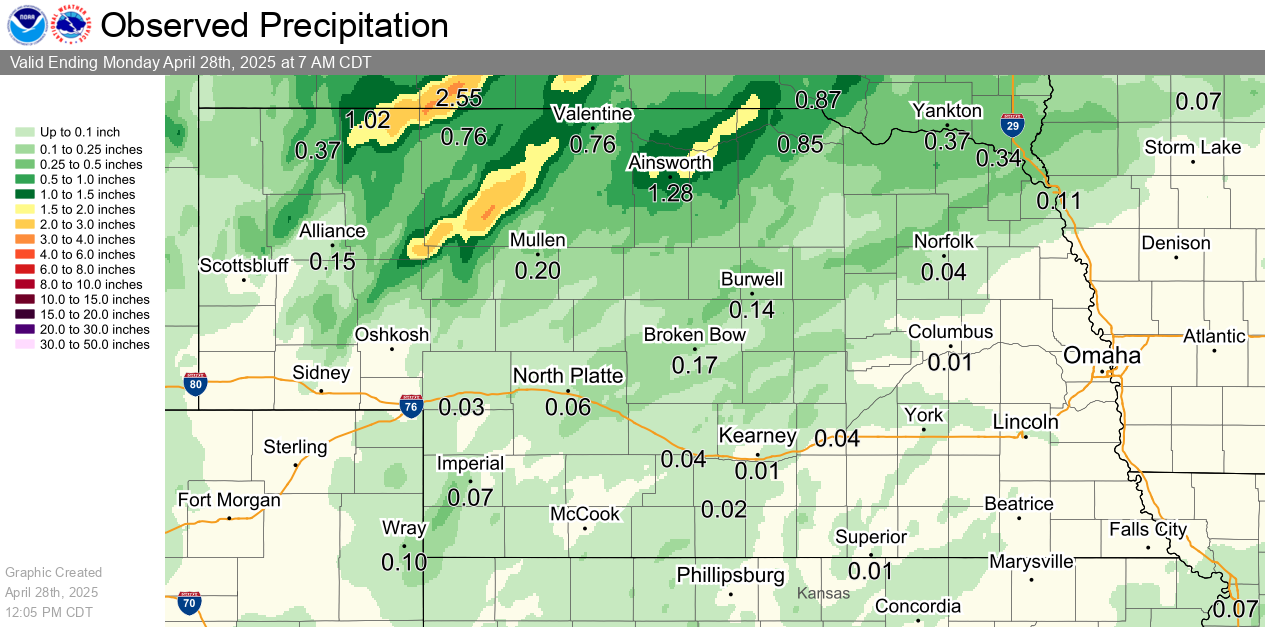
Observed Precipitation (source: MRMS)
|
Previous 24 Hours of Precipitation |
Previous 72 Hours of Precipitation |
Humidity and Wind Graphics
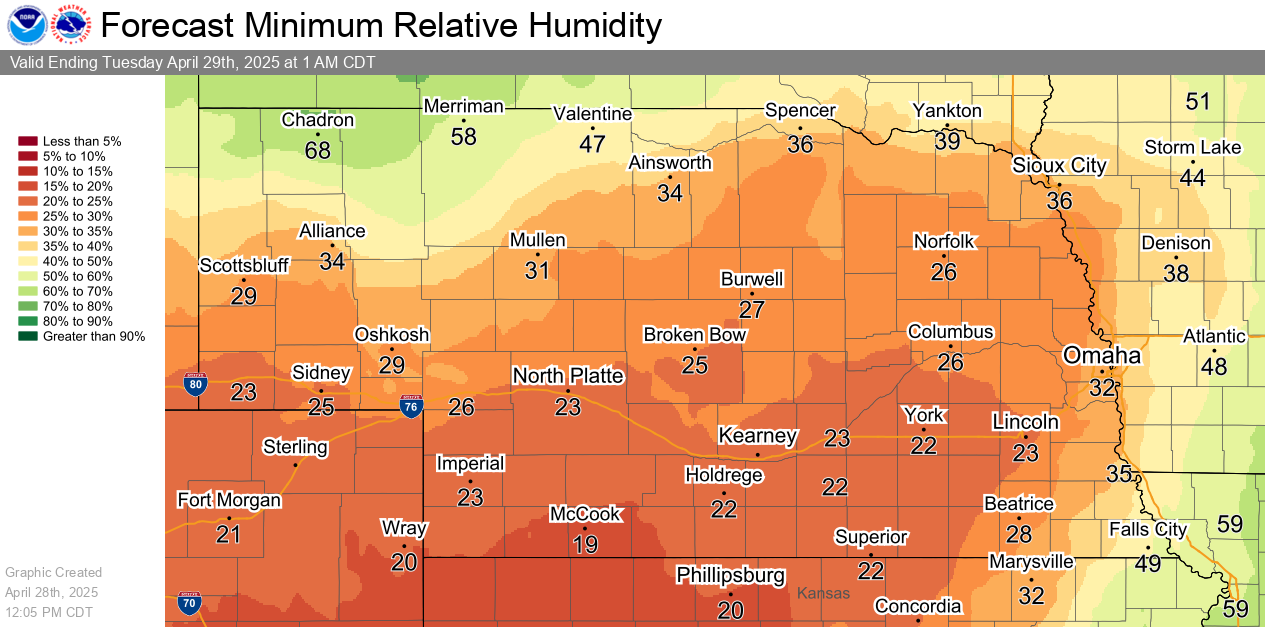
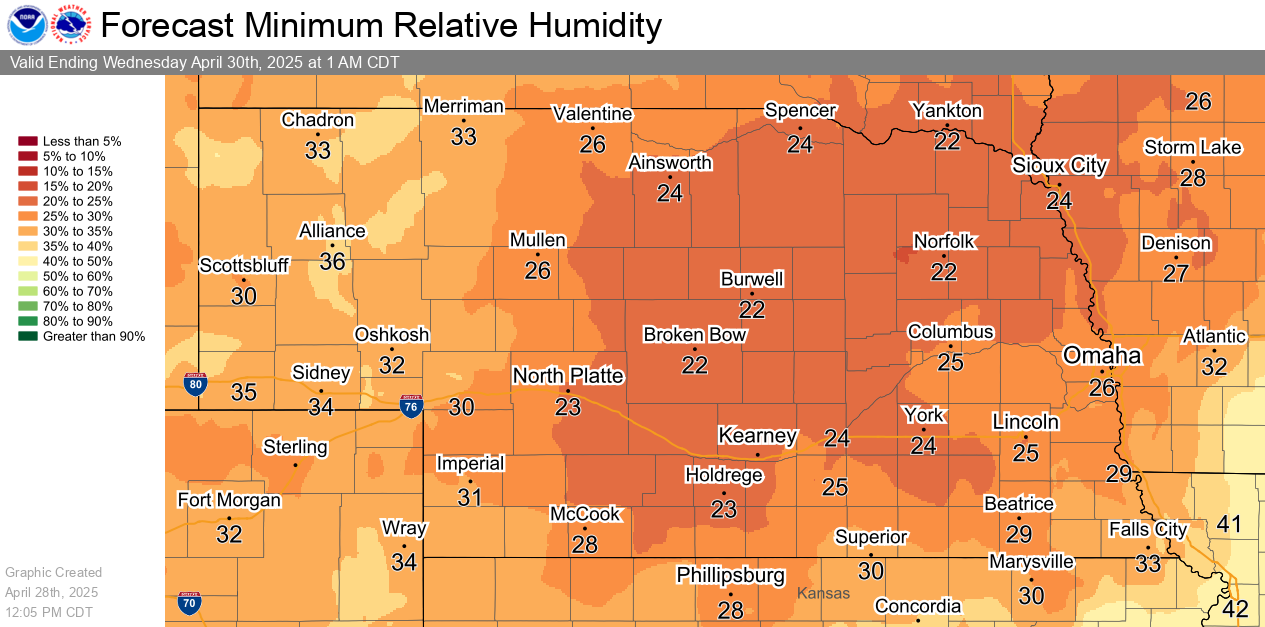
Minimum Relative Humidity Forecasts
|
Today's Minimum Relative Humidity Forecast |
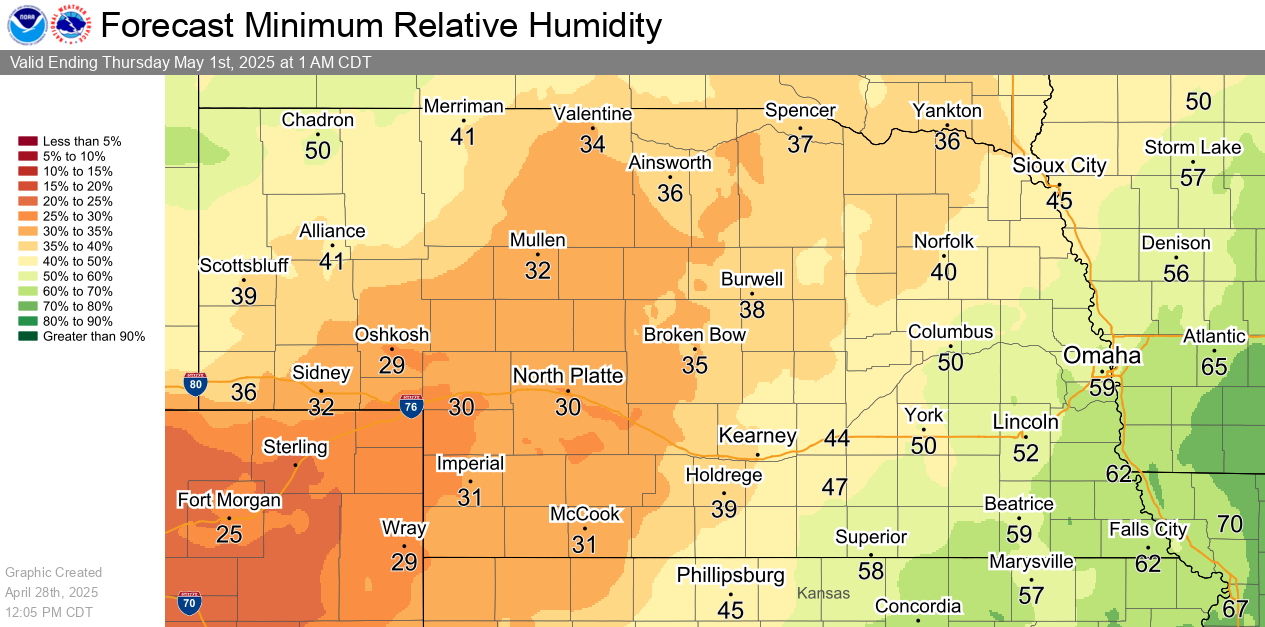
Tomorrow's Minimum Relative Humidity Forecast |
|
Day 3 Minimum Relative Humidity Forecast |
|
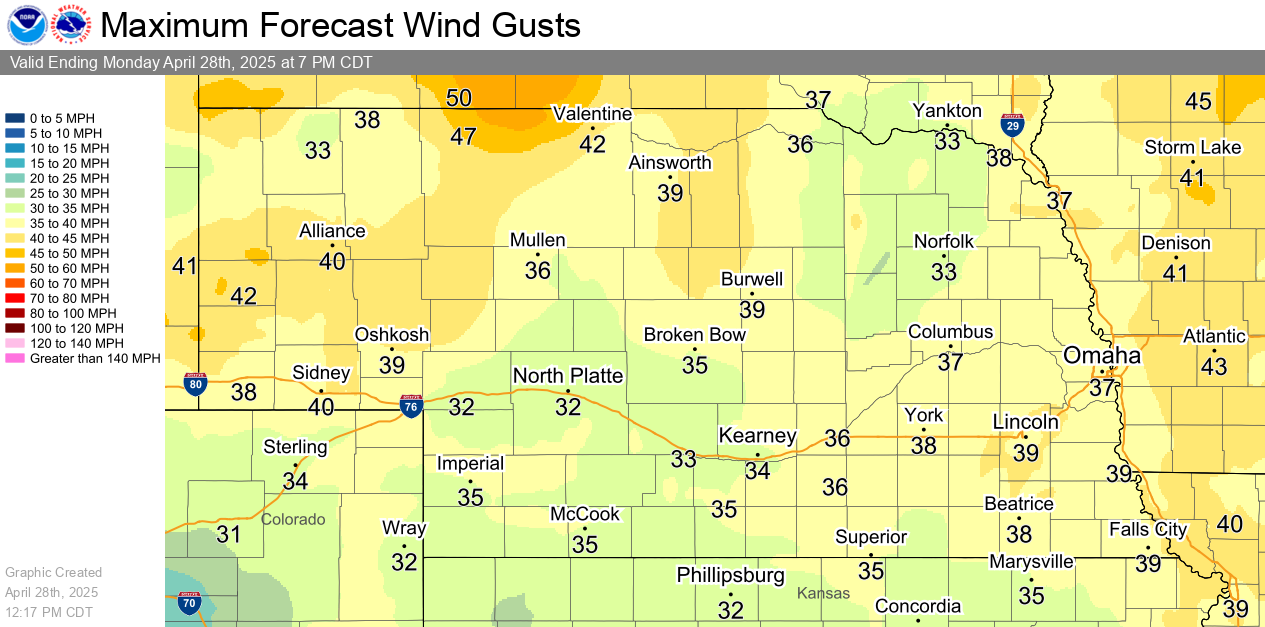
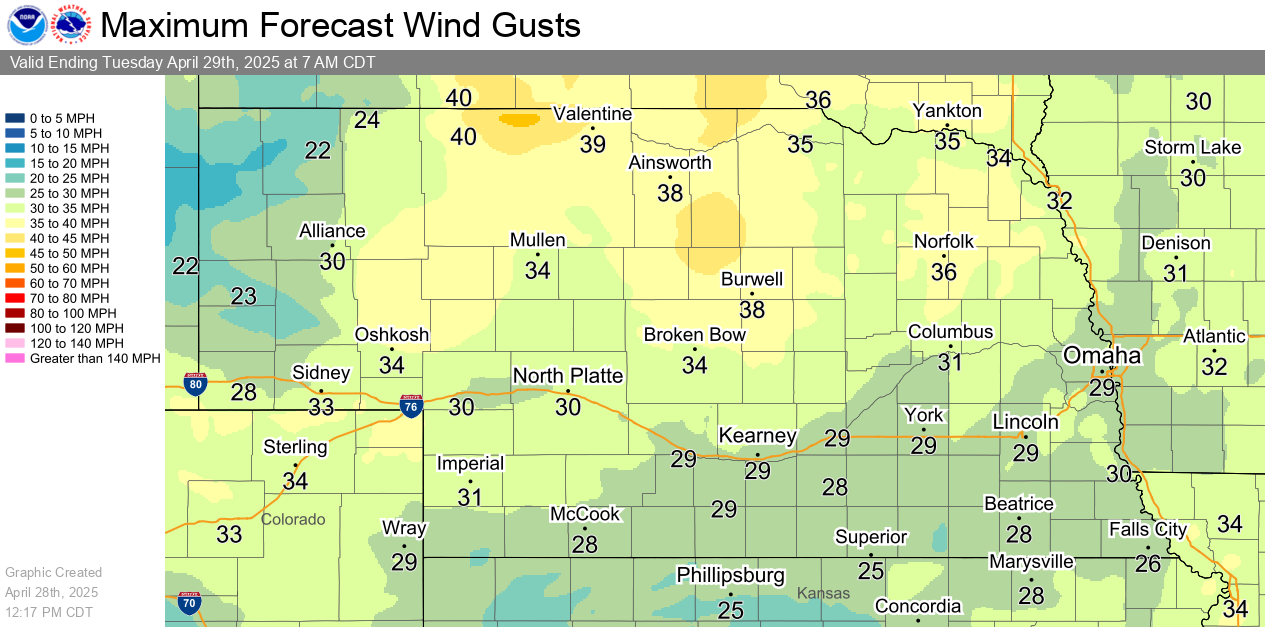
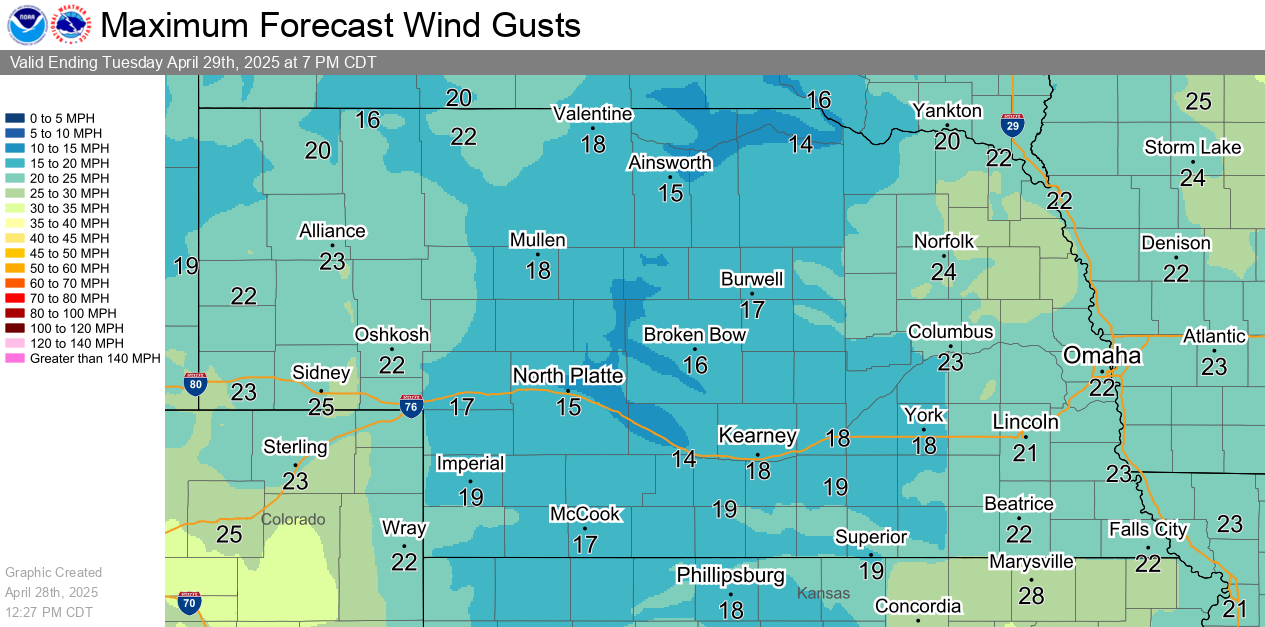
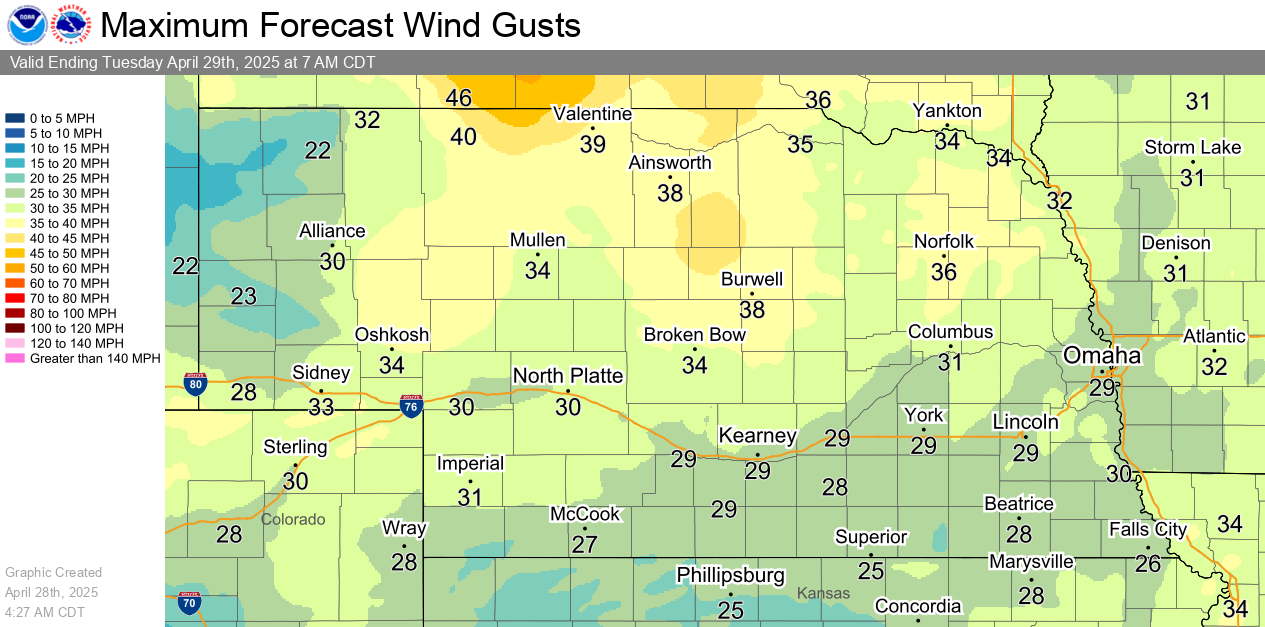
Maximum Wind Gust Forecasts
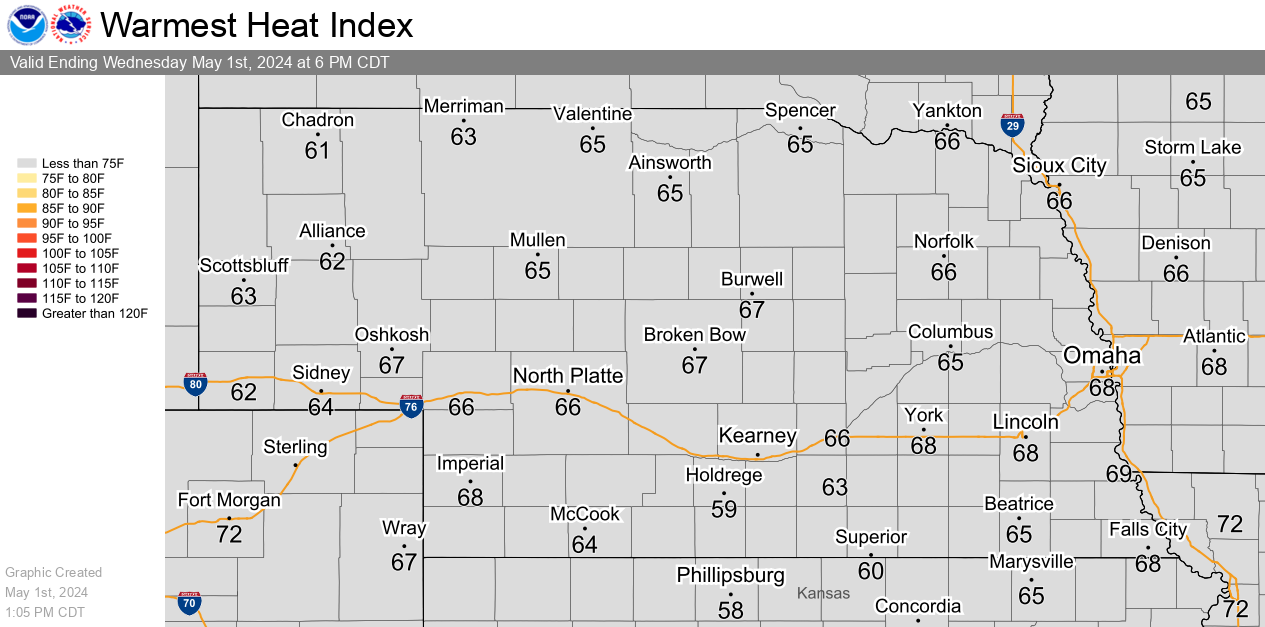
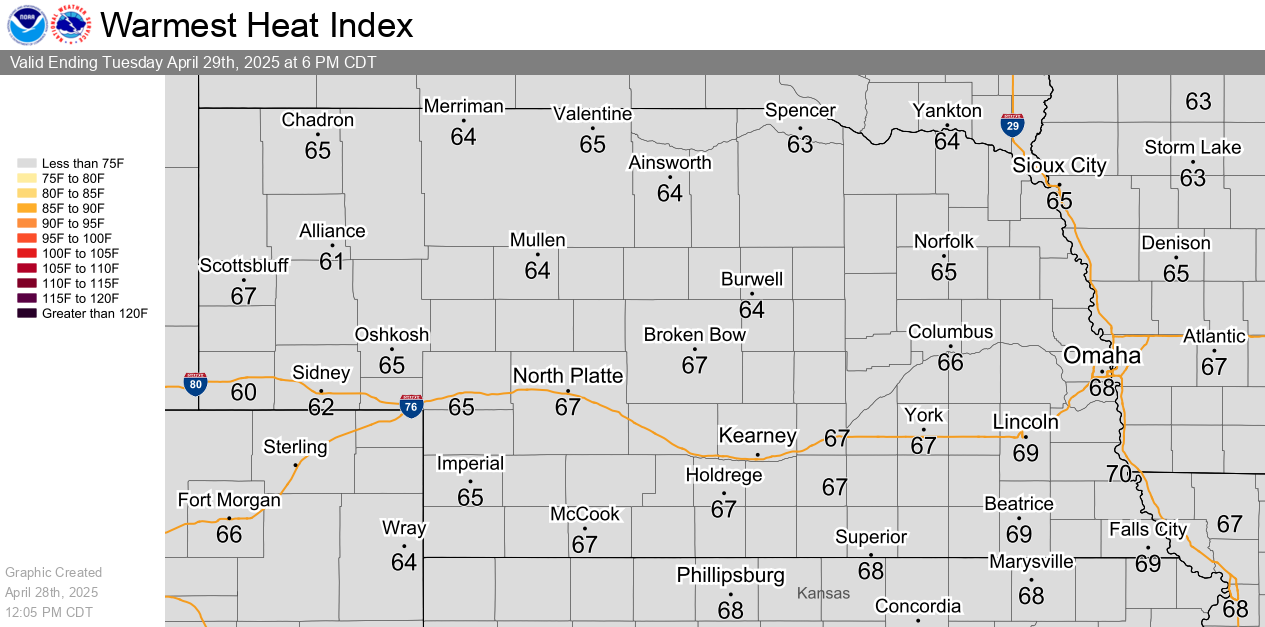
Heat Index Graphics
Snow, Ice and Wind Chill Graphics
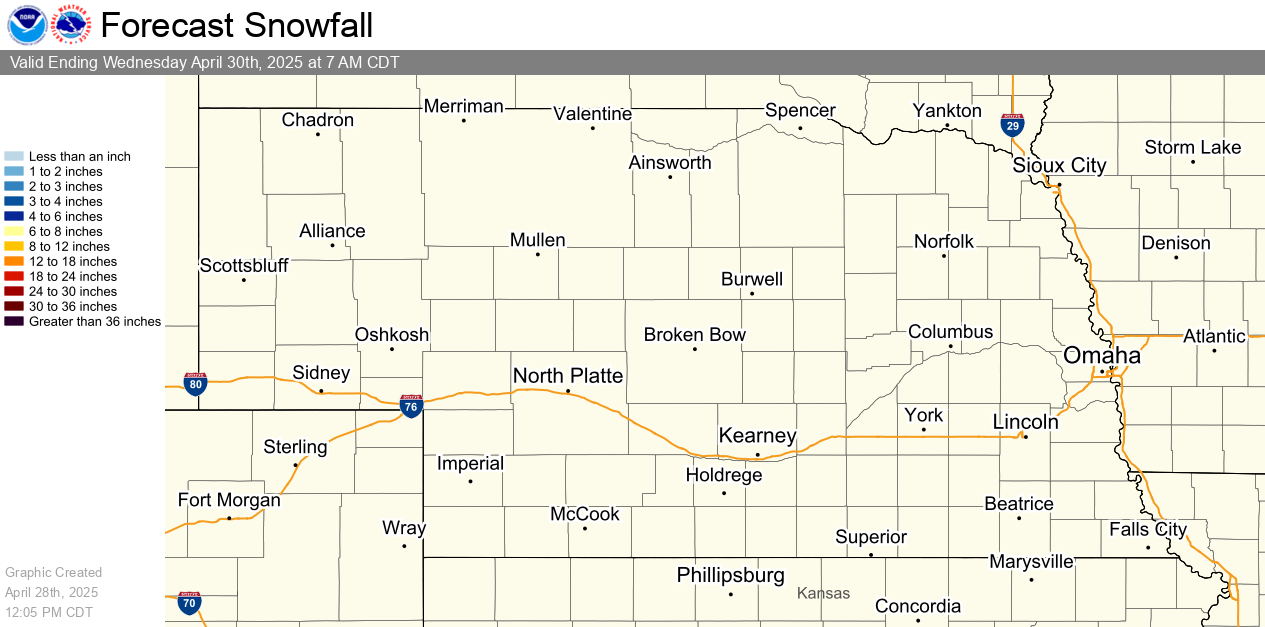
Snowfall
Snowfall accumulation measured in six hourly periods, starting at 12am, 6am, 12pm, and 6pm CST (+1 CDT).
|
12 Hour Snow Accumulation Forecast |
24 Hour Snowfall Accumulation Forecast |
|
48 Hour Snow Accumulation Forecast |
72 Hour Snow Accumulation Forecast |
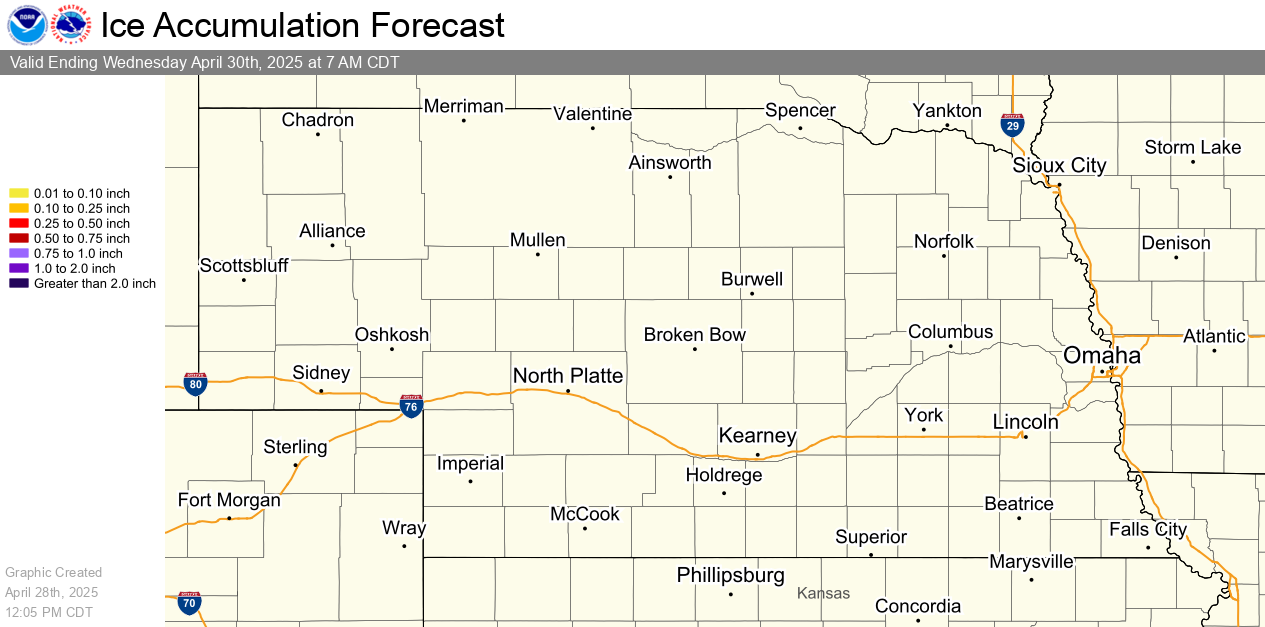
Ice
Ice accumulation measured in six hourly periods, starting at 12am, 6am, 12pm, and 6pm CST (+1 CDT).
|
12 Hour Ice Accumulation Forecast |
24 Hour Ice Accumulation Forecast |
|
48 Hour Ice Accumulation Forecast |
72 Hour Ice Accumulation Forecast |
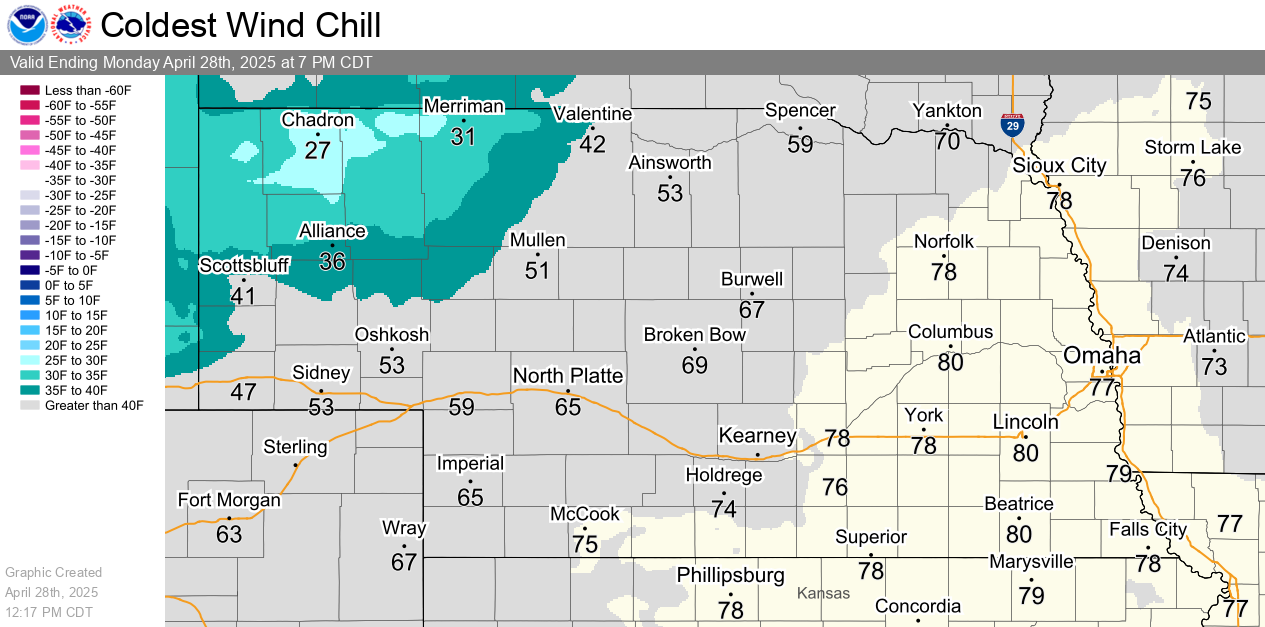
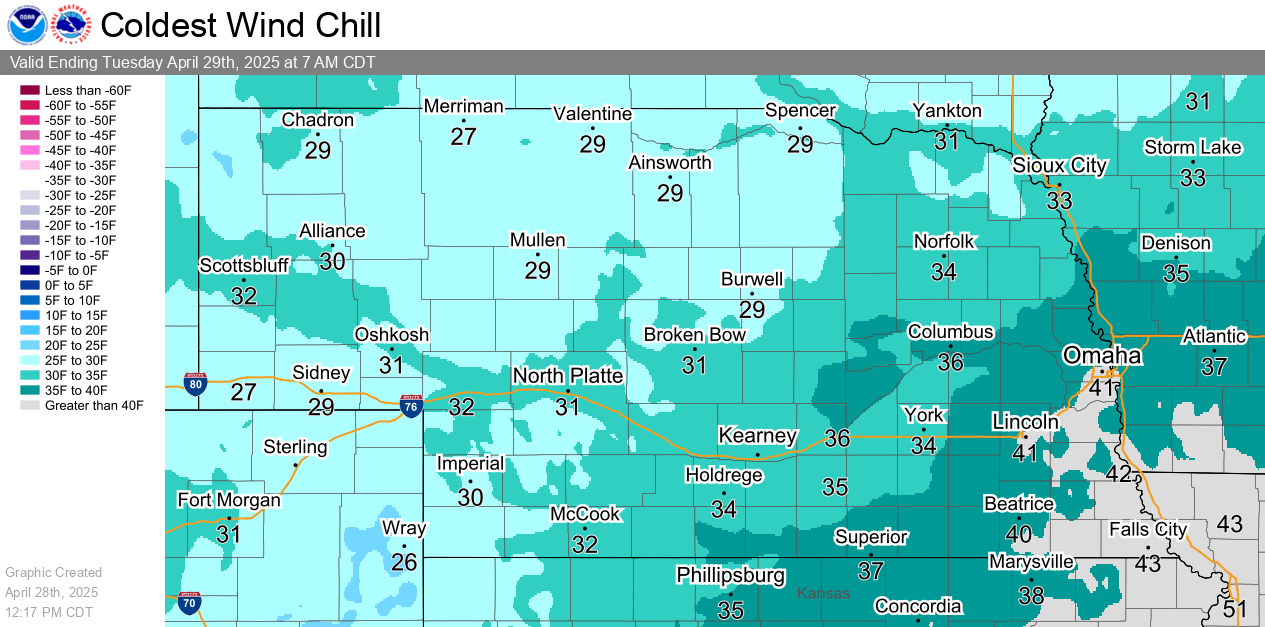
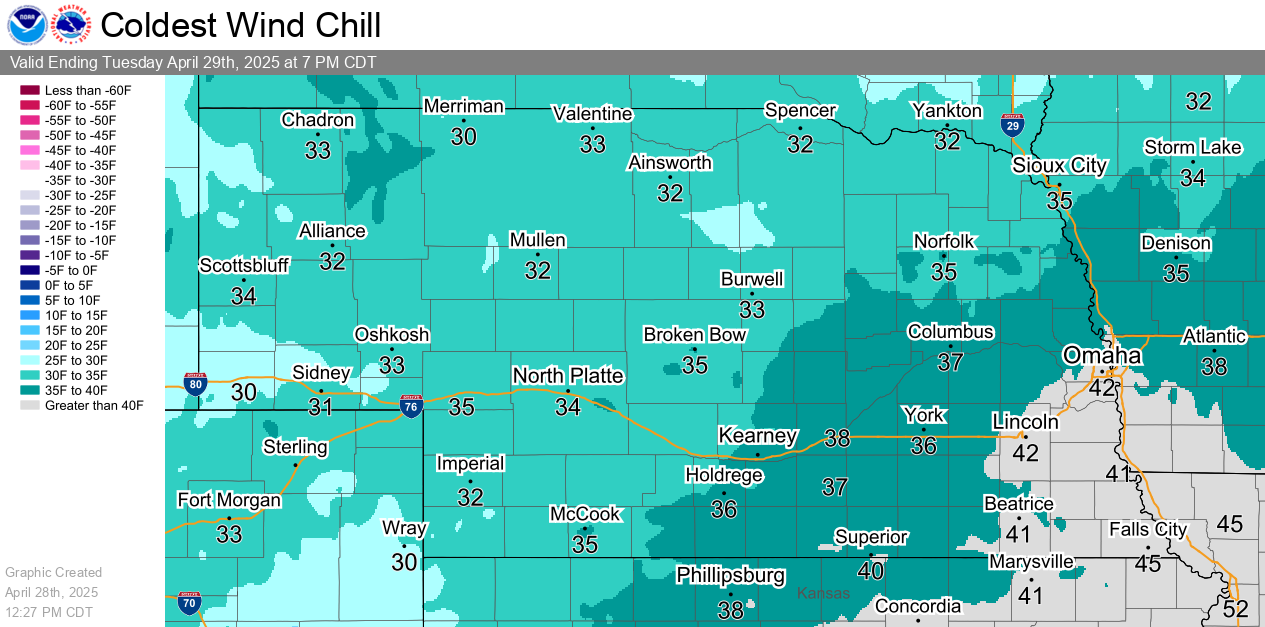
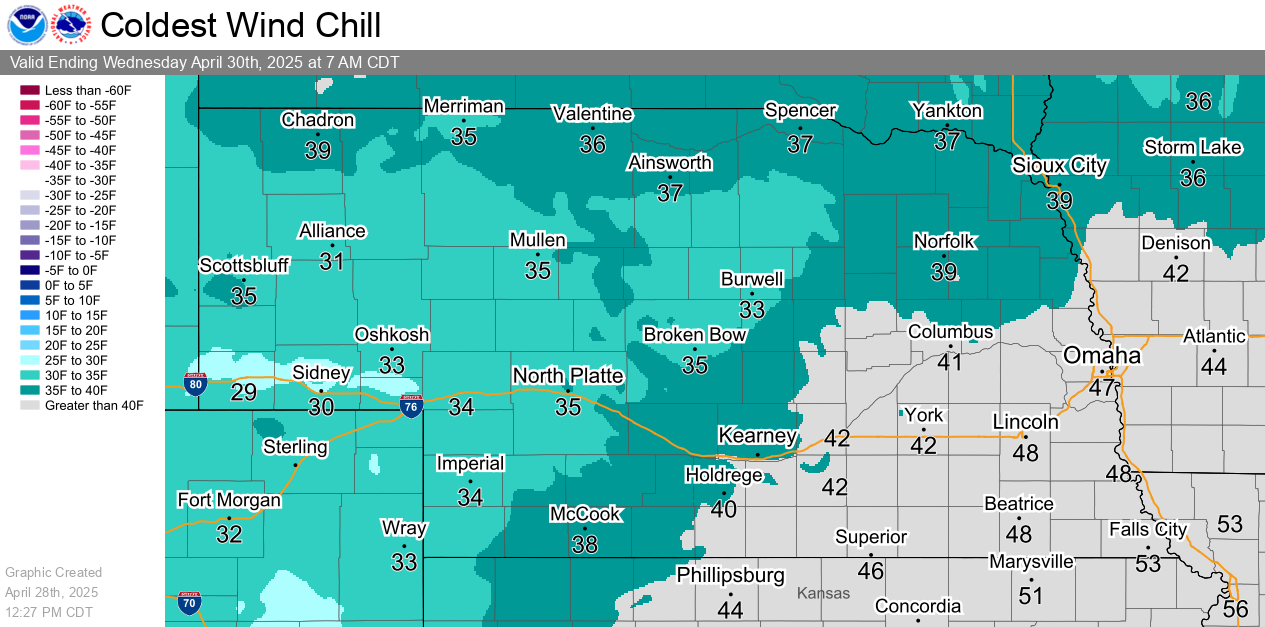
Wind Chill
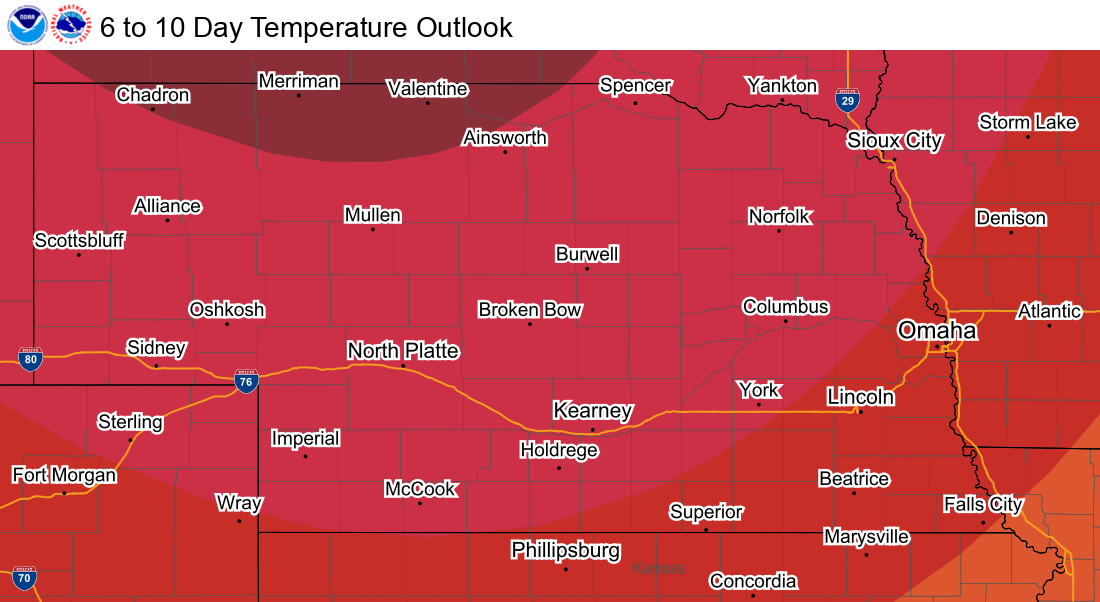
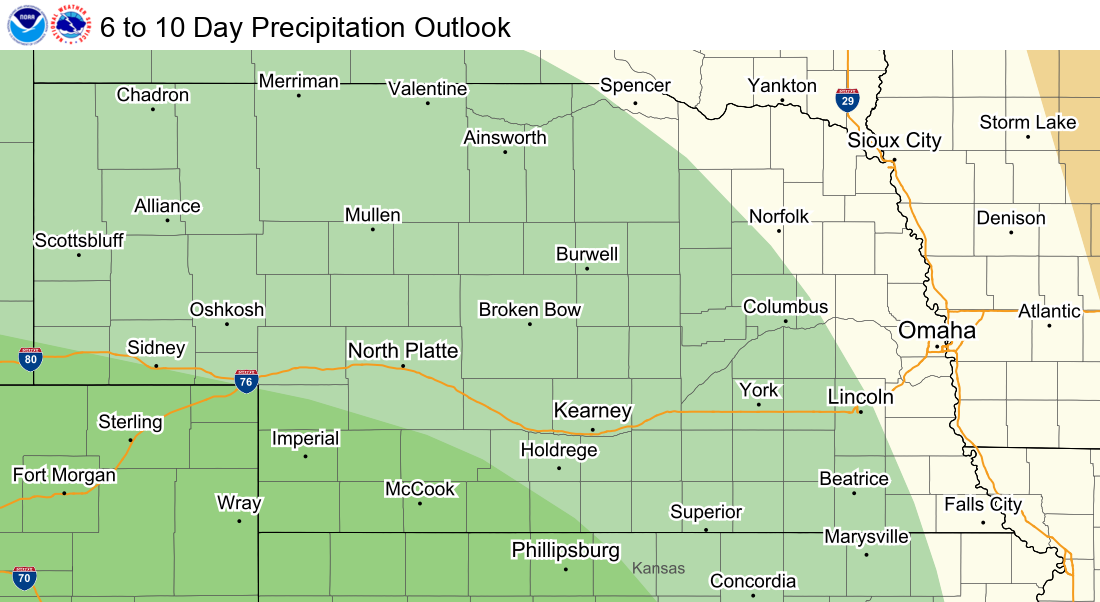
Climate Graphics