82nd Anniversary - September 21, 1938
Home | History | Meteorology | Damage Photos | Video | News Clippings | References
Meteorological Maps and Data
(Click link for specific maps or data)
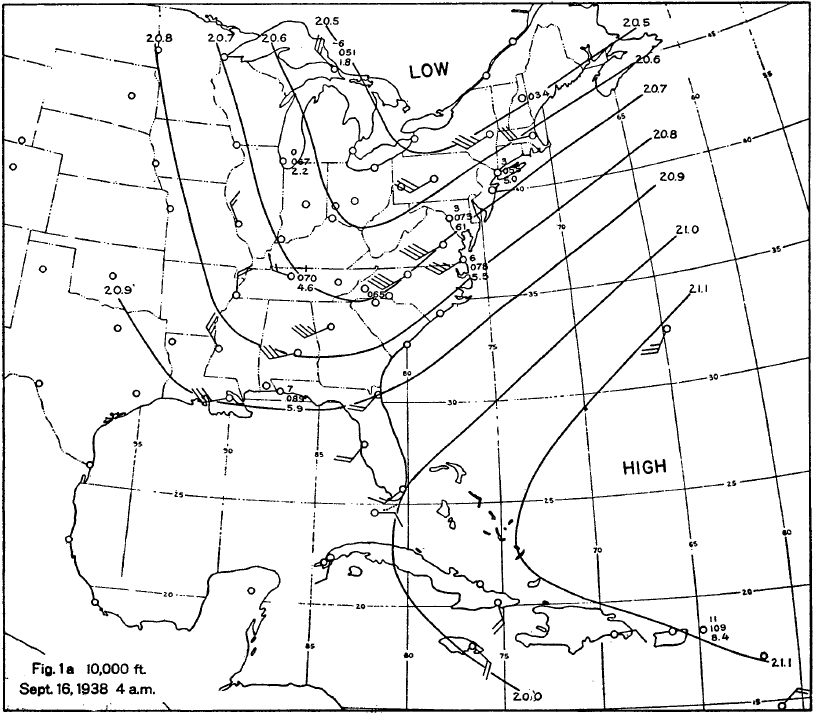
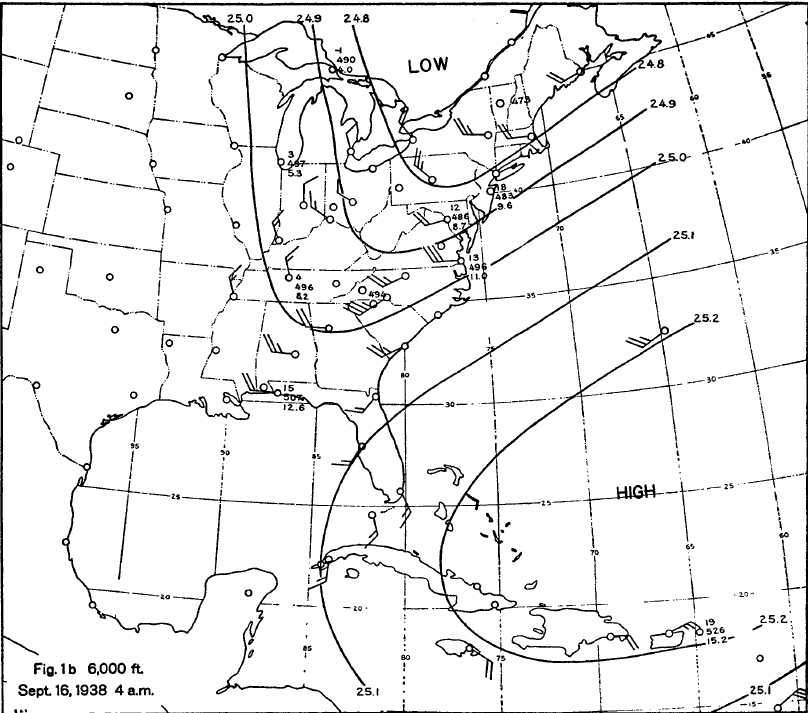
On September 9, 1938, a Tropical Depression formed near the Cape Verde Islands. At this time, the pattern across the Eastern Atlantic was characterized by large upper-level ridging. This ridge intensified over the next several days as the cyclone slowly organized and became a Tropical Storm. The cyclone remained on the southern periphery of the upper-level ridge helping to steer it westward. The upper-level ridge remained to the north of the storm throughout its journey across the Atlantic. By September 16, a hurricane was born with the ridge continuing to amplify to its north. Over the Eastern United States, a deep upper-level trough was in place with a surface cold front along the Eastern Seaboard. This front would not make it much further east as the upper level ridging over the Atlantic continued to retrograde westward and prevent the front from moving off the coast. The hurricane passed just north of the Carribean Islands on the 18th and 19th. By 00Z on September 20, a new amplyfing upper-level trough was located over the Eastern United States as the Atlantic ridge continued further north than what we would typically expect over the Atlantic in September. With the trough to the west and the core of the ridge to the north of the hurricane, a path developed for the storm to begin moving towards the north-northwest. As the storm began to move in this direction, it slowly increased its forwards speed. Initially, a slight jog to the northeast was observed as it passed east of the Carolinas. However, the upper level ridge position would prevent the storm from escaping out to sea. The storm then interacted with the upper trough over the Eastern United States allowing for a bend back towards the north-northwest. The forward speed was 47 MPH at the time the hurricane raced north through Eastern Long Island and southern Connecticut.
There is a great deal of uncertainty with the exact structure of the Hurricane as it raced north along the Eastern Seaboard. Pierce (1939) showed the system attaining frontal characteristics as it moved along the Eastern Seaboard. However, the National Hurricane Center's Hurricane Research Division retains hurricane status as it made landfall due to limited observations of the exact structure of the storm. It is likely that the storm was becoming extratropical at landfall.
00 12 24 36 48 60 72 84 96 108 120 132 144 156 168 180 192 204 216 228 240 252 264 276 288 300 312 324 Animation 
00 12 24 36 48 60 72 84 96 108 120 132 144 156 168 180 192 204 216 228 240 252 264 276 288 300 312 324 Animation 
1:30a 7:30a 11:00a 12:00p 1:00p 2:00p 3:00p 4:00p 5:00p 6:00p 7:00p 8:00p 9:00p 10:00p 11:00p Animation 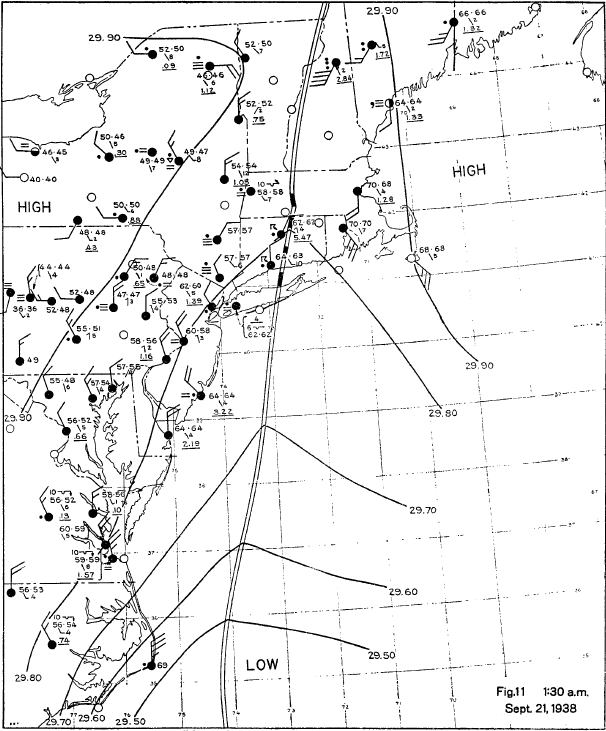
|
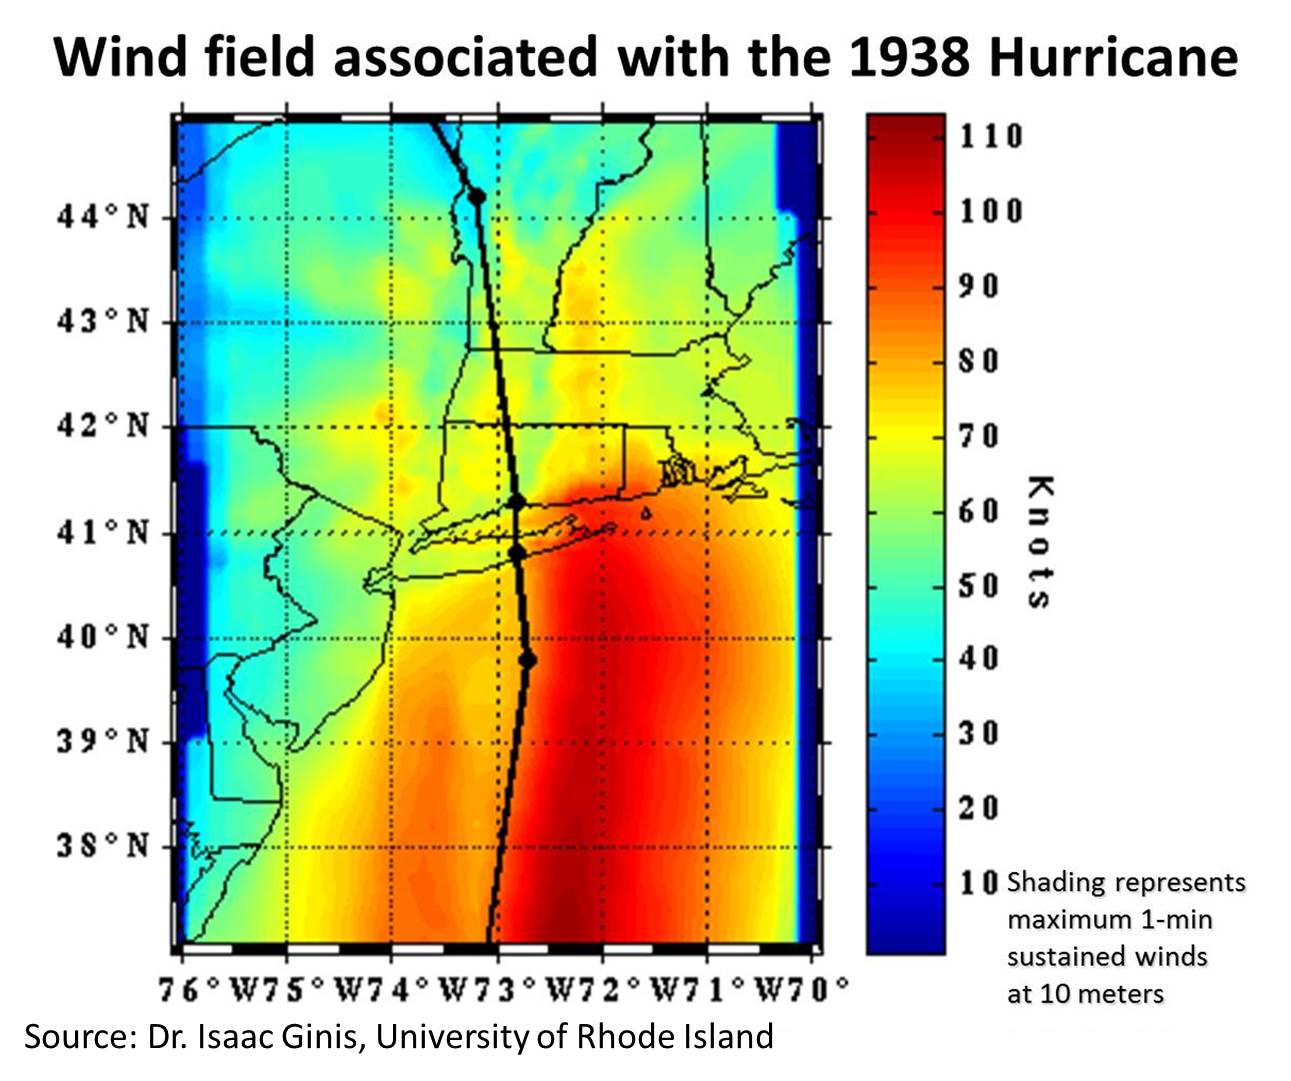
Top: Wind field associated with the 1938 Hurricane. The data is from a GFDL/URI hurricane model simulation which has been used operatioally by the NWS since 2001. Source: Dr. Isaac Ginis, University of Rhode Island. Middle and Bottom: Landsea et al. (2013) Original (middle) and new (bottom) analysis of wind swaths (in kt) from the Accurate Environmental Forecasting (AEF) model. The new analysis in Landsea et al. (2013) makes the 1938 hurricane a category 3 (previously a strong Category 2) when it made landfall on Long Island and Connecticut. |
 |
 |
 |
 |
|
For an excellent presentation by Dr. Robert Hart of Florida State University on the 1938 hurricane structure and its preditability, click the link below. The presentation was given at The 4th Tri-State Weather Conference. |
 |
|
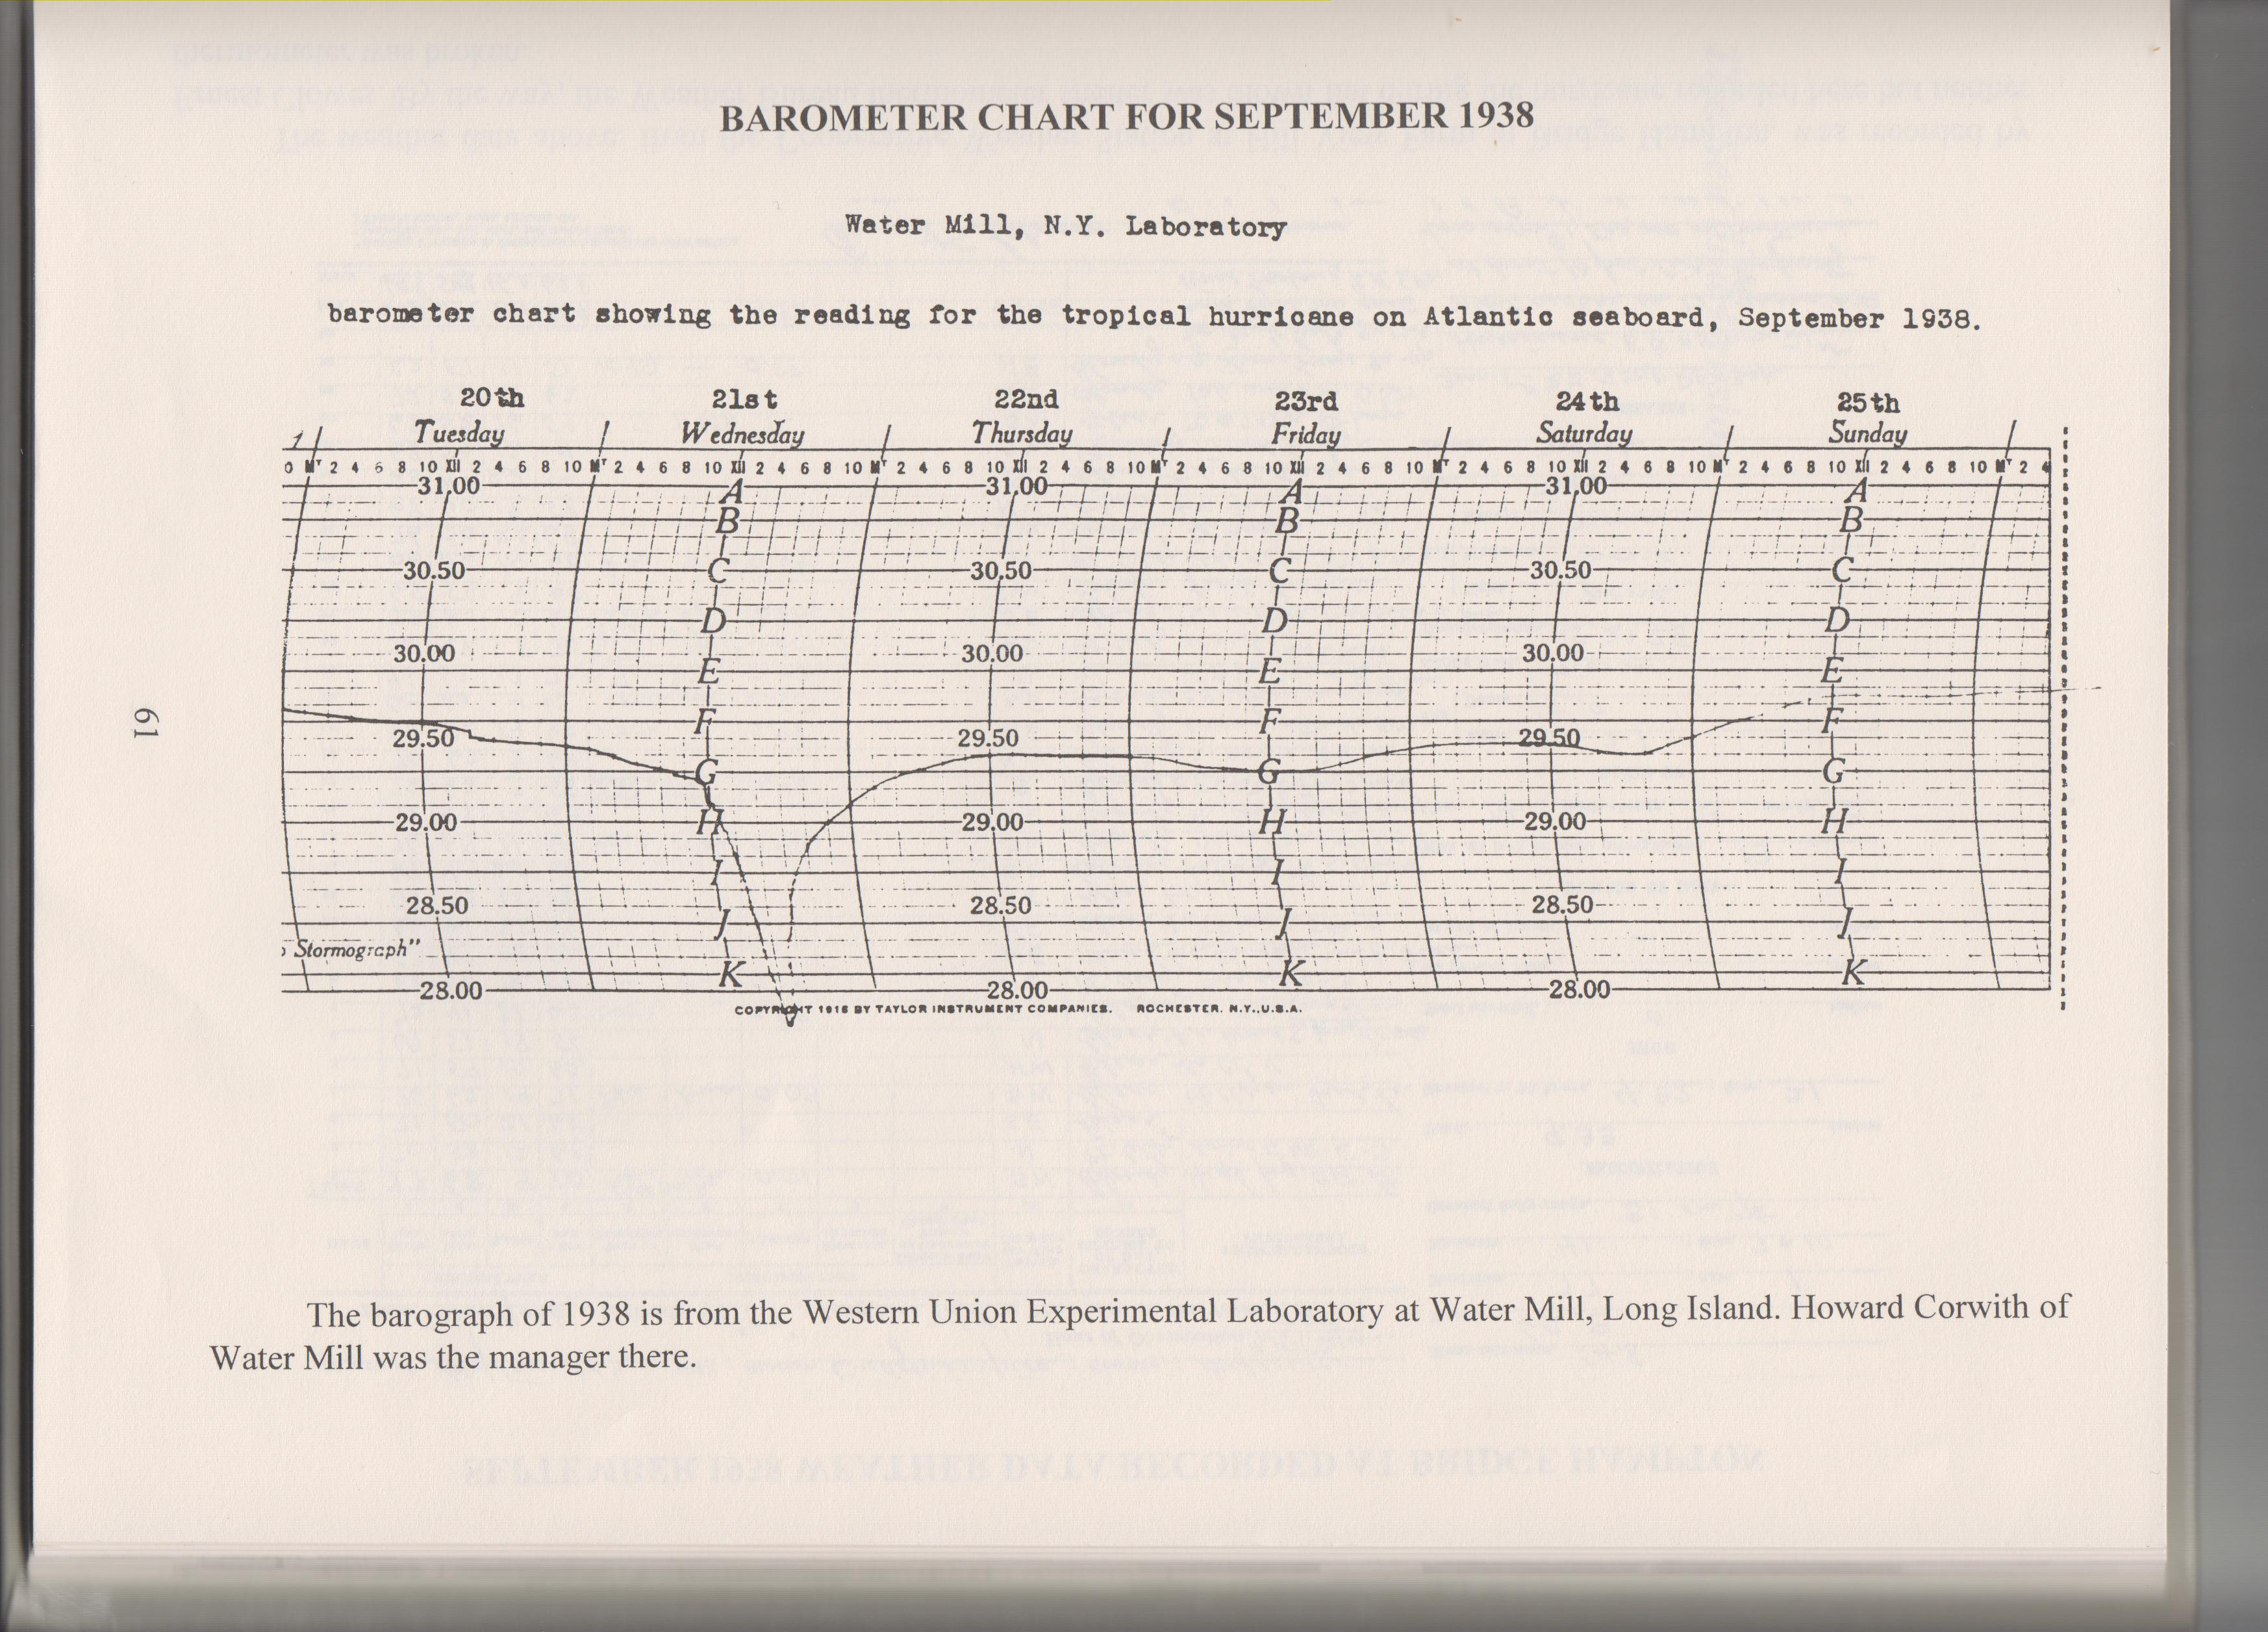
Source: Hendrickson (1996)The barograph at Water Mill Laboratory from September 20-25, 1938.
|
 |
|
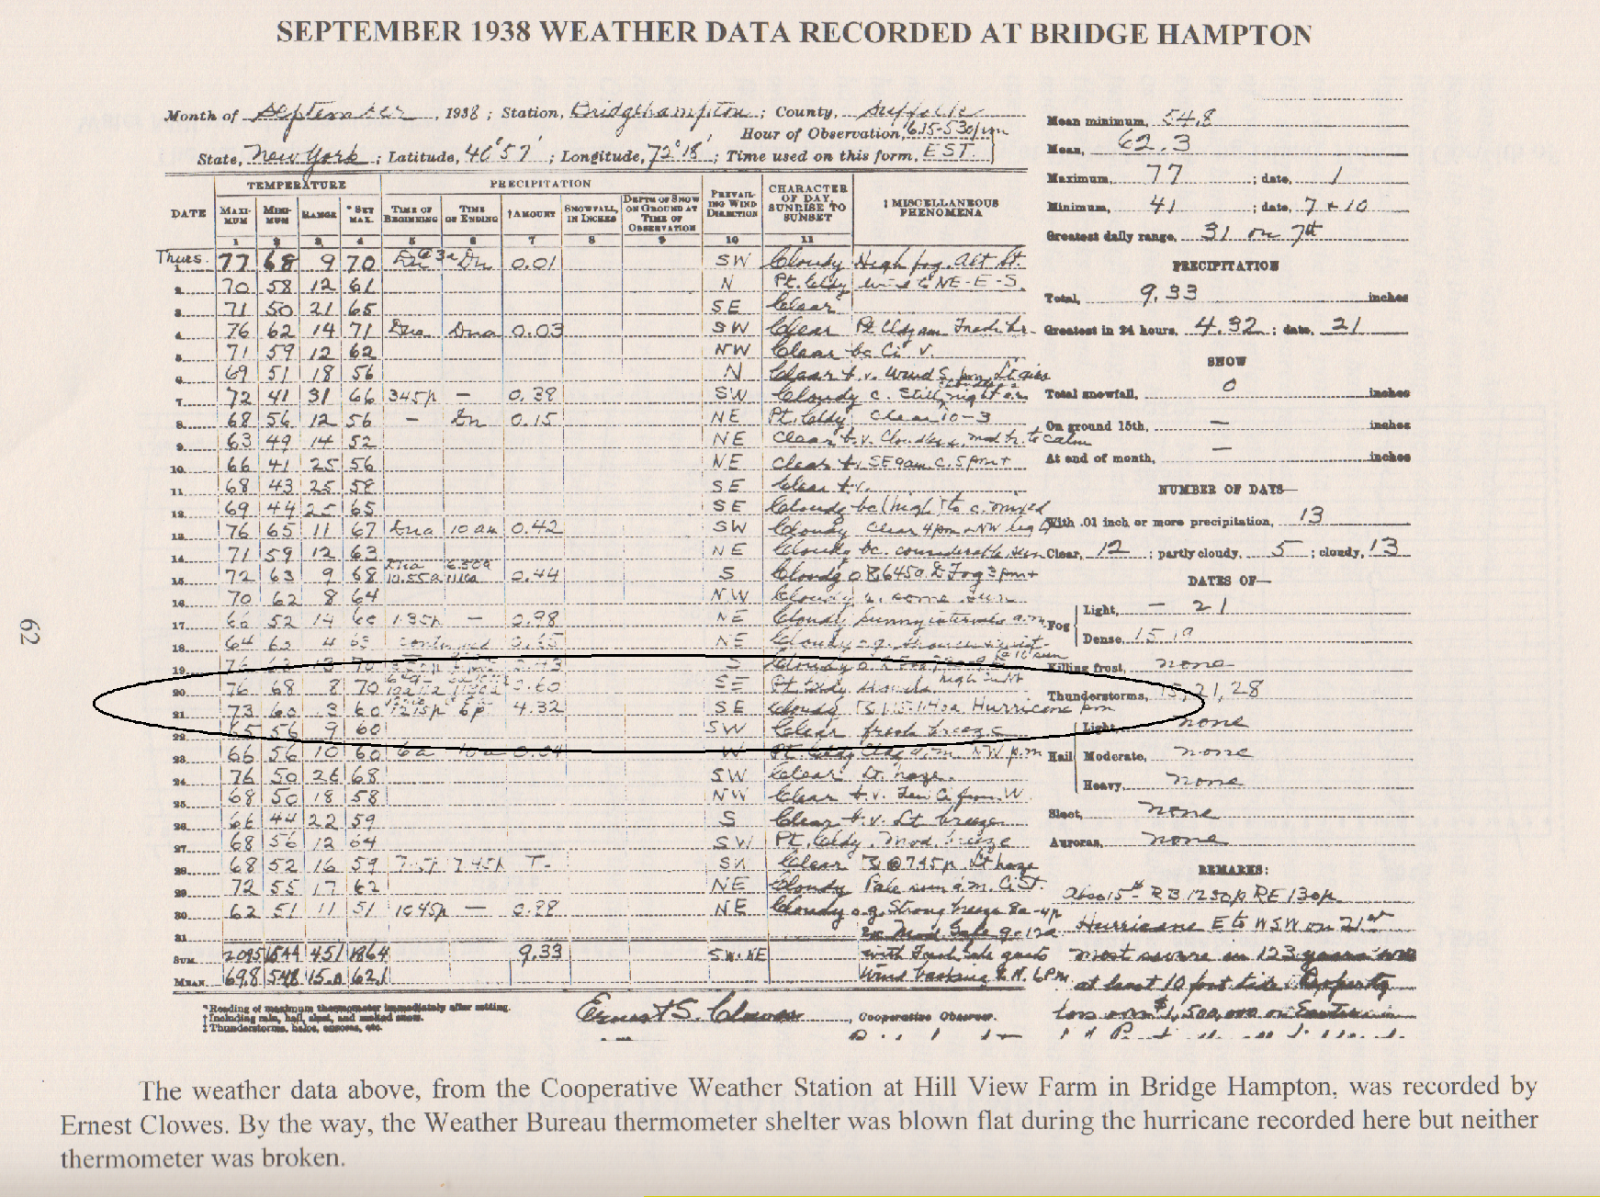
Source: Hendrickson (1996) Data from the Hill Mill Farm in Bridgehampton, NY for the month of September 1938. The time period of the hurricane is highlighted.
|
 |
|
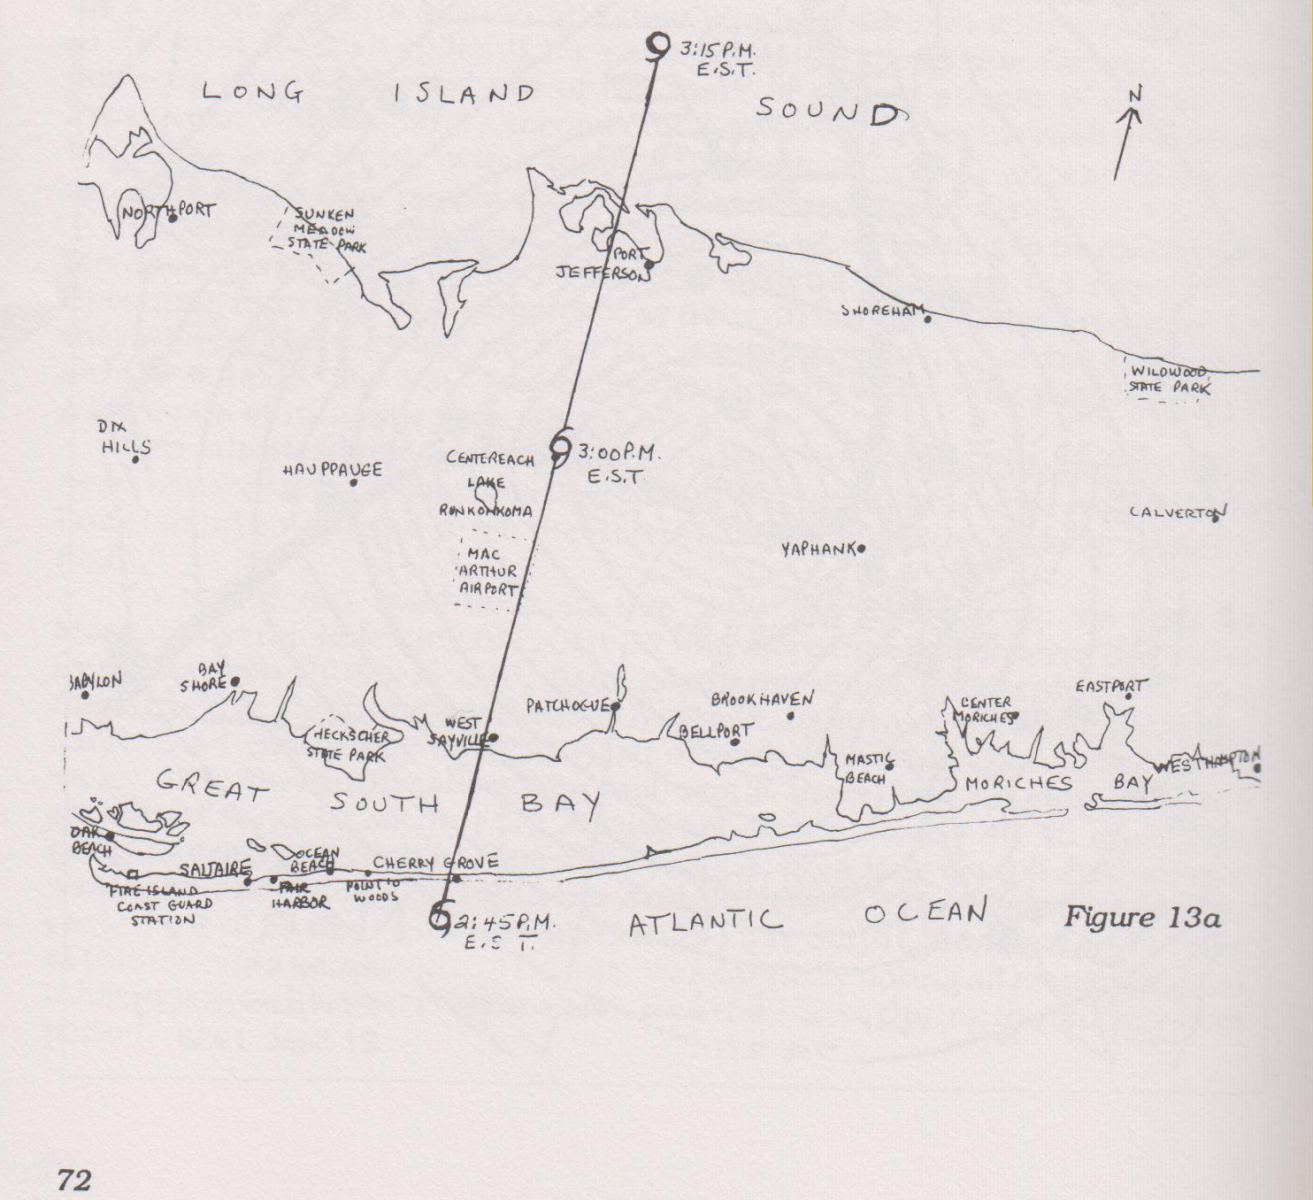
Source: Brickner (1988) Estimated track of the hurricane center through Long Island. This image gives a great perspective of the speed of the storm as it moved north. However, new research from Landsea et al. (2013) has slightly adjusted the track from what is shown in this graphic.
|


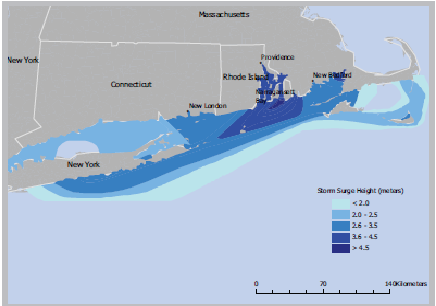
 Coastal Flooding