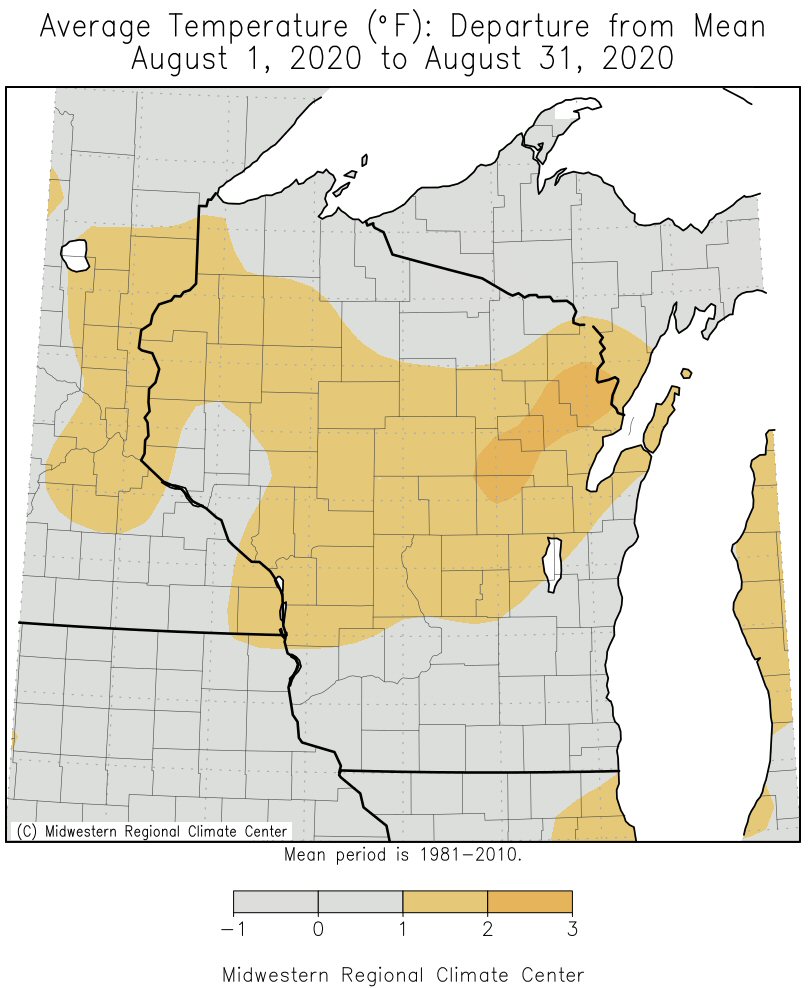
During August 2020, average temperatures were up to 2°F warmer-than-normal across the Upper Mississippi River Valley. Average temperatures ranged from 63.7°F at Medford Taylor County Airport (Taylor County, WI) to 74.2°F at La Crosse Regional Airport.
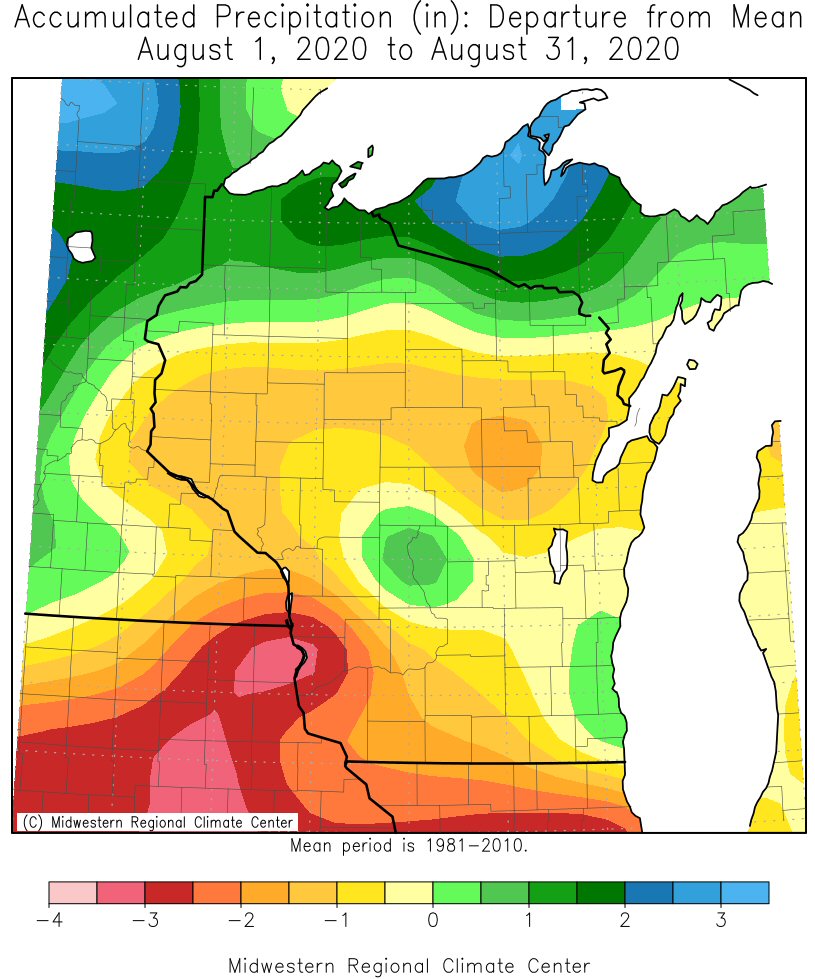
Rainfall was quite variable across region. Rainfall totals ranged from 0.31" in Gays Mills, WI to 8.62" near Mauston, WI.
La Crosse, WI tied for 12th warmest August with 1959, 2016, and 2018. There were 10 days with high temperatures of 90°F or higher. This was tied for 8th most in an August with 1900 and 1930. Most ever in an August was 15 in 1955.
Rochester, MN had 3 days with high temperatures of 90°F or higher. Most in an August since 2013 (3 days). Most ever in an August was 16 in 1947.
The images below are from the Midwestern Regional Climate Center, they show the August 2020 temperature and precipitation anomalies.
 |
 |
| August 2020 Temperature Anomalies | August 2020 Temperature Anomalies |
Below are the August 2020 climate summaries for La Crosse, WI and Rochester, MN.
...Above Normal Temperatures And Slightly Below Normal
Precipitation For August In La Crosse...

...August Highlights...

There were 18 days when the daily average temperature was above
normal. While this isn`t particularly out of the ordinary, 6 of
those days were 10 degrees or more above normal, including August
26th when the daily average temperature was 86 degrees (16 degrees
above normal). In addition, 10 days saw a high temperature of 90
degrees or greater, including a streak of 6 days from August 23rd
through August 28th. Typically, August sees 4 days with high
temperatures above 90 degrees. The monthly average temperature of
74.2 degrees ranked as the 11th warmest August on record, and was
2.8 degrees above normal.

Precipitation was slightly below normal, with the monthly total
of 3.90 inches being 0.39 inches below normal. That said, a vast
majority of the month was quite dry as La Crosse fell into
Moderate Drought (D1). However, the very end of the month brought
some relief, as over half the month`s precipitation (1.98 inches)
fell on the 31st.

...Records...

A record daily high temperature of 97 degrees was tied on August
26th. This record was previously set in 2013.

...Looking ahead to September...

The average temperature in La Crosse for September is 62.8
degrees. The average high temperature falls from 79 degrees to 67
degrees through the month, while the average low temperature falls
from 58 degrees to 46 degrees. The warmest September temperature
on record is 101 degrees on September 6th, 1922, and the coldest
is 24 degrees from September 30th, 1899.

The average precipitation in September is 3.56 inches. The
wettest September was in 1881 with 10.87 inches of rain, while the
driest September occurred in 1940, with only 0.29 inches of
precipitation.
...Slightly Above Normal Temperatures And Slightly Below Normal
Precipitation For August In Rochester...

...August Highlights...

Overall it was a fairly "average" month temperature-wise just
looking at numbers of days above and below normal. Daily average
temperatures were above normal on 15 days and below normal on 16
days. However, there were some notable stretches of cool and warm
weather. The month began with cool stretch, with temperatures
ranging from 7 to 11 degrees below normal from the 2nd through
5th. A warm stretch was then seen toward the end of the month with
temperatures ranging from 5 to 13 degrees above normal from the
21st through the 28th. This includes a 3 day stretch of high
temperatures in the 90s from the 24th through the 26th. The
monthly average temperature of 69.7 degrees was 0.5 degrees above
normal.

Precipitation was slightly below normal, with the total of 4.24
inches just 0.28 inches short of what`s typically seen in August.
That said, a vast majority of the month was quite dry as some
areas near Rochester fell into Moderate Drought (D1). Through
August 30th, precipitation for Rochester was running 2.15 inches
below normal (month to date). 2.01 inches of rain then fell on the
31st (which ended up being a daily record for the date).

...Records...

2.01 inches of rain fell on August 31st, which broke the previous
record for the date of 1.87 inches set in 1981.

...Looking Ahead to September...

The average temperature in Rochester for September is 60.9
degrees. The average high temperature falls from 76 degrees to 66
degrees through the month, while the average low temperature falls
from 56 degrees to 44 degrees. The warmest September temperature
on record is 100 degrees on September 6th, 1913, and the coldest
is 22 degrees from September 28th, 1942.

The average precipitation in September is 3.45 inches. The
wettest September was in 1986 with 10.50 inches of rain, while the
driest September occurred in 1953, with only 0.33 inches of
precipitation.

