| Temperatures | Precipitation | ||||||
| Month | High | Low | Average | Departure | Total | Departure | Snow |
| January | 31.0 | 17.1 | 24.1 | +6.6 | 1.01 | -0.11 | 11.9 |
| February | 33.1 | 11.3 | 22.2 | -0.3 | 1.05 | 0.00 | 11.9 |
| March | 47.9 | 32.1 | 40.0 | +5.5 | 2.93 | +0.89 | 1.4 |
| April | 57.8 | 36.2 | 47.0 | -1.6 | 1.63 | -1.71 | 2.5 |
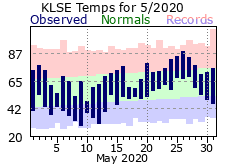
| May | 70.1 | 48.8 | 59.5 | -0.2 | 3.28 | -0.24 | 0.0 |
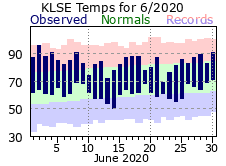
| June | 83.8 | 61.8 | 72.8 | +3.6 | 7.31 | +2.97 | ... |
| July | 88.0 | 66.3 | 77.2 | +3.4 | 1.72 | -2.54 | ... |
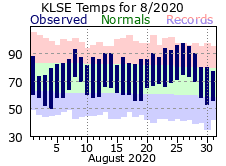
| August | 85.9 | 62.5 | 74.2 | +2.8 | 3.90 | -0.39 | ... |
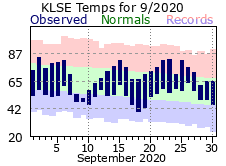
| September | 71.7 | 53.1 | 62.4 | -0.4 | 3.62 | +0.06 | ... |
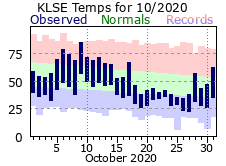
| October | 55.4 | 36.6 | 46.0 | -4.2 | 1.61 | -0.56 | 2.3 |
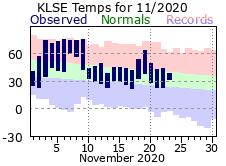
| November | 51.4 | 32.1 | 41.8 | +5.9 | 2.40 | +0.39 | 1.0 |
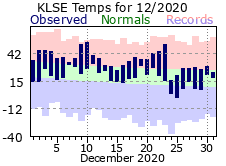
| December | 36.0 | 19.1 | 27.6 | +6.0 | 0.36 | -1.00 | 4.6 |
| TOTALS: | 59.3 | 39.7 | 49.6 | +2.3 | 30.82 | -2.24 | *** |
Records
Temperature...
Highs:
Lows:
Highest Lows:
Lowest Highs:
Monthly:
Seasonal:
Yearly:
Precipitation...
One-day pcpn:
One-day snowfall:
Monthly pcpn:
Monthly snowfall:
Seasonal precipitation:
Yearly precipitation:
|
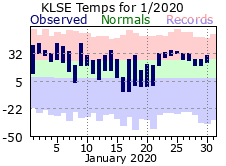
2020 in La Crosse got off to a warm start as high temperatures topped 40 degrees on 4 of the first 7 days. The average temperature over that first week was the 7th warmest on record for La Crosse. Temperatures would fall back to more normal values for the middle of the month before returning to milder conditions for the end. Low temperatures fell below zero only twice (-5 on the 16th and 17th), fairly rare having occurred in only 16 other Januarys on record, and well above the average of 10 such below zero days. Overall, January temperatures finished 6.6 degrees above normal. Snowfall was just a bit above normal, but what fell was fairly light on a day-to-day basis. There were 11 days with measurable snow (above the mean of 8 days), but less than 1” was recorded on 6 of those, and none accounted for more than 3 inches. |
 |
|
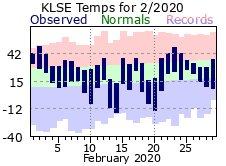
February also kicked off on a warm note with above normal temperatures through the first 8 days. Temperatures fell off after that, fluctuating between above and below normal. The coldest temperature of 2020 occurred on the morning of the 14th at -16 F. The average temperature for February finished around it’s normal. Snowfall for the month was a few inches above it’s normal, but the bulk of it came from one storm. 8.5” of snow fell on the 9th, accounting for nearly 75% of the month’s total. Measurable snow fell on only 4 more days, none amounting to more than 2”. And while precipitation was right at the February normal, measurable precipitation fell on only 4 days (average is 8) – or 14% of the time. |
 |
|
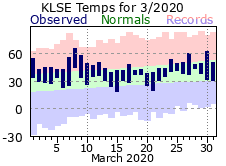
March was mild by its standards, rounding out 5 ½ degrees above normal. Temperatures were only below normal on 5 days. The first 60 degree day of 2020 fell on the 8th (65 F), a couple weeks earlier than average. Precipitation for the month was almost an inch above normal with measurable precipitation falling on 13 days (average is 10). Minor amounts were recorded on most of those days with only 2 registering more than ¼ inch. Snowfall was sparce for a March with only 1.4” inches falling (normal is over 7”). It was the least amount of snow in March since 2012 and 18th least snowy on record. |
 |
|
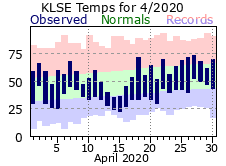
Unlike the previous months, April was relatively cool, especially at mid-month. Average temperatures were below normal from the 9th through the 21st on all but 2 days, with highs only in the 30s on 14th and 15th (right on the normal low temperatures for mid-April). Temperatures did fluctuate quite a bit, as spring months tend to do. Highs ranged from a low of 35 on the 14th to a high of 73 on the 27th. Overall, the month was over 1 ½ degrees below its normal. It was a dry April by its standards with only 1.63” falling (nearly 1 ¾ inch below normal). Much of what did fall came on two days, with the 3rd and 12th accounting for nearly 75% of the monthly total. The cool conditions helped support some snowfall with measurable snows falling on 3 days. While not a lot at only 2.5”, it was about an inch above normal and actually more than what fell in March – rare, having occurred only 14 other times on record for La Crosse. The last measurable snowfall for the 2019-20 winter season came on the 13th with 0.2”.
|
 |
|
Aside from a few mild days to start the month, the first 2 weeks of May were cool. Average temperatures were below normal from the 4th through the 13th, with lows in the 30s on 7 of those (only 29 on the 9th). The last freezing temperature of the 2019-2020 winter season fell on the morning of the 12th (31), a couple weeks past what happens in an average season. Temperatures would warm back to, or generally above the May normals after that, helping it finishing right around what’s. Precipitation was below normal in May, thanks to a dry first half. There were 5 days with measurable rainfall through the 16th, but they only amounted to 0.28”. Measurable rains would fall on 8 more days after that for an additional 3”, moving the month closer to its normal.
|
 |
|
June was a warm month in La Crosse, more so for its start. Temperatures were above the seasonable normal through the 9th, topping 90 for highs on 3 of those days. After that, seasonable readings were the norm, with actually one rather cool day on the 22nd when the high was only 69 degrees. The wet later half to May would continue throughout June. Measurable rain fell on 12 days (right at the average), but 6 of those recorded over ½ inch (double what occurs on average, and tied for 6th most in a June). |
 |
|
The summer warmth continued in July with only a handful of days (6) averaging below normal). Highs reached or exceeded 90 degrees on 14 days – far outpacing the average of 6 and tying it for 11th most in a July. The warmest period was the start with 90 or more degree highs through the 8th – tied for the 3rd warmest start to a July on record for La Crosse. The wet end to June would not follow into July, however. Measurable rain fell on 9 days, but amounted to less than 1/10” on 5 of those. In fact, the 9th accounted for over half of July’s total with 0.95” on that day. July would finish over 2 ½ inches below its normal, one of the top 20 driest July’s in La Crosse. The last half would be particularly dry with only 0.08” falling from the 20th through the 31st (tying for 6th least rainfall for this period in La Crosse). |
 |
|
August continued the warm trend for the summer rounding out nearly 3 degrees above its normal. Highs made it to 90 degrees or warmer on 10 days, tied for 8th most for an August and well above the average of 4 days. The hottest period was a 6 day stretch from the 23rd through the 28th when temperatures averaged over 82 degrees. Precipitation was close to the August normal, mostly thanks to a couple days with heavy rain at month’s end. Almost 3 inches of rain fell over the last 4 days of August – accounting for over 70% of the month’s total - with nearly 2 inches on the 31st alone. Prior to that, there were only 7 days with measurable rainfall with 5 of those recording less than 1/10 of an inch.
The summer of 2020 would be one of the warmest on record for La Crosse with an average of 74.7 degrees marking it as the 3rd warmest. 90 degrees or greater were reached on 28 days, tied for 8th most in a summer. |
 |
|
September brought an end to the warm summer weather, and while it would finish at its normal, there was a lot of variety throughout the month. Highs made it to 80 or greater on 7 days, but failed to warm out of the 60s on 10 days (staying in the 50s for three of those!). Precipitation was also right on what is normally expected for September, although this too showed quite a bit of diversity. It was a rainy for the early part of the month as measurable rains fell on 6 out of 7 days from the 6th through the 12th (over 2”). It would dry out from there until the 24th (only one day with 0.01”) when thunderstorms dropped 1.33”. |
 |
|
October would bring the chill of autumn to the area averaging over 4 degrees below normal. The cold really settled in for the last half of the month as highs failed to warm out of the 40s on 12 days (tied for 8th most in an October), with 5 of those only struggling into the 30s (tied for 5 most). In fact, from the 16th to month’s end temperatures only averaged 37.6 degrees, marking it as the 5th coldest second half to an October in La Crosse. That said, October did let summer in for a brief appearance, recording the last 80 degree day of the year on the 9th (85). Precipitation was over ½ inch below normal, thanks in part to a dry start to the month (around 1/10” from the 1st through 11th). Rain would come a bit more often after that, but still the bulk of the monthly total would come on only 2 days (1.12” on the 12th and 22nd). The first snowflakes of the new snowfall season would fly on the 20th, quickly followed by the first measurable snow on the 25th when 2” fell (the first measurable snowfall usually waits until the second week of November).
|
 |
|
November got off to a very mild start with highs well into the 70s for the 3rd through 9th. Reality set in after that as temperatures fell back in line with seasonable normals. However, that warm start helped November finish almost 6 degrees above normal and made it the 8th warmest November on record for La Crosse. Precipitation was a bit below normal and only measured on 6 days. However, over ½” fell on 3 of those which also accounted for 96% of the monthly total. There were a few days with flurries, otherwise just one day of measurable snow on the 24th (1”). |
 |
|
December wrapped up 2020 on a mild and somewhat dry note. Temperatures were above normal on all but 5 days for the month, while highs topped 50 on 3 days. Meanwhile, low temperatures fell below zero only once (-1 on the 25th), well under the average of 5 such days. December got off to a very dry start, not recording any measurable precipitation until the 23rd. In fact, that was the driest start to a December in La Crosse on record. The last week would try and make up for that with measurable precipitation falling on 5 days with 4.6 inches of snow. Still, both monthly precipitation and snowfall were less than half of what typically occurs. |
 |
|
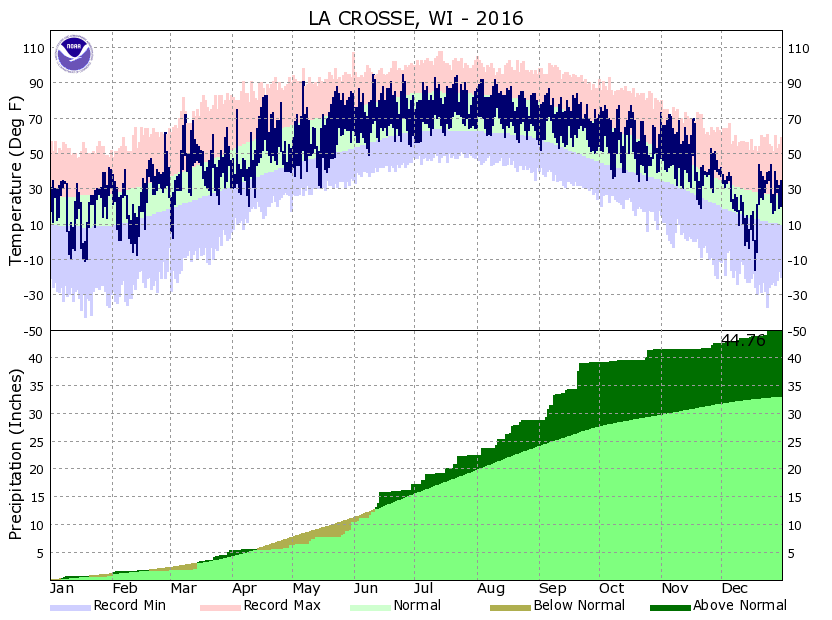
2020 will be remembered as a warm one for La Crosse with its 51.0 degree average making it the 3rd warmest year on record. Quite a few daily high temperature records were set, mostly during the early start of November. And while there was only one month that broke into its top 10 for warmest (again, November), 5 others placed in their top 20. October was the odd month out for 2020 with chilly temperatures that resulted in some very early, accumulating snow. For a change, the yearly precipitation was below normal – first time since 2012. |
 |
| Highest temperature for 2020 | 97 on August 26th |
| Lowest temperature for 2020 | -16 on February 14th |
| Highest one-day precipitation | 1.98" on August 31st |
| Highest one-day snowfall | 8.5" on February 9th |
| Number of days with highs at or above 90 degrees | 28 |
| Number of days with highs at or below 32 degrees | 40 (tied for 8th least) |
| Number of days with zero or below temperatures | 10 (tied for 11th least) |
| Peak wind gust | 58 mph on June 2nd, July18th, August 14th |
| Number of days with measurable precipitation | 113 |
| Percentage of days with measurable precipitation | 31% |
| Number of days with above normal temperatures | 229 |
| Percentage of days with above normal temperatures | 63% |


 Weather Story
 Weather Map
 Local Radar