| Temperatures | Precipitation | ||||||
| Month | High | Low | Average | Departure | Total | Departure | Snow |
| January | 27.9 | 9.2 | 18.5 | -0.4 | 0.03 | -1.22 | 0.6 |
| February | 28.8 | 10.5 | 19.6 | -3.7 | 0.69 | -0.50 | 7.0 |
| March | 53.3 | 29.4 | 41.3 | +5.5 | 3.27 | +1.23 | 5.1 |
| April | 59.3 | 37.5 | 48.4 | -0.6 | 5.20 | +1.45 | 1.7 |
| May | 70.8 | 48.2 | 59.5 | -1.5 | 3.08 | -1.25 | 0.0 |
| June | 81.2 | 62.0 | 71.6 | +0.6 | 6.27 | +1.19 | ... |
| July | 85.0 | 66.5 | 75.7 | +0.7 | 4.64 | +0.41 | ... |
| August | 80.7 | 61.4 | 71.0 | -1.8 | 2.83 | -1.07 | ... |
| September | 77.3 | 56.2 | 66.8 | +1.9 | 3.72 | +0.09 | ... |
| October | 64.8 | 45.0 | 54.9 | +3.2 | 1.60 | -0.89 | 0.0 |
| November | 46.7 | 29.9 | 38.3 | +0.7 | 1.12 | -0.73 | 8.2 |
| December | 28.4 | 11.8 | 20.1 | -5.0 | 0.92 | -0.57 | 10.1 |
| TOTALS: | 58.7 | 39.0 | 48.8 | -0.1 | 33.43 | -1.80 | *** |
Records
Temperature...
Highs:
Lows:
Highest Lows:
Lowest Highs:
Monthly:
Seasonal:
Yearly:
Precipitation...
One-day pcpn:
One-day snowfall:
Monthly pcpn:
Monthly snowfall:
Seasonal precipitation:
Yearly precipitation:
|
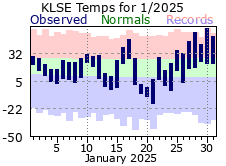
January kicked off 2025 on a record setting note – but not in the fashion that many would assume of the typically cold, snowy month. Instead, La Crosse experienced its driest start on record with only 2 days of measurable precipitation amounting to only 0.03”. That was the least amount in any January for La Crosse while the number of days with measurable tied 1948 for the lowest in a January (average is 9 days). Further, snowfall for the month was only 0.6”, least in a January and the first time less than an inch had fallen for the entire month. With the exception January 11-17 and January 22-23 when there was a trace of snow on the ground, the remainder of the month was snow free. This was the first time that there has been no measurable snow on the ground in the month of January. The average temperature for the month was right around its normal - but doesn’t paint the full picture of the variability in the day-to-day temps. For instance, highs never warmed above 20 degrees on 8 days while warming to 40 degrees or greater on 6 days. On 3 days highs reached or exceeded 50 degrees – tied for 2nd most in a January. The 58-degree high on the 30th was not only the earliest occurrence in a year of temperatures that high, but also was the warmest January day on record for La Crosse. |
 |
|
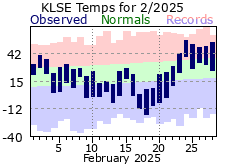
February would continue the dry trend of January, finishing 1/2” under its normal. Despite that, measurable precipitation was recorded on 10 days (average is 8), albeit with never more than ¼” on any given day. Measurable snows fell on 7 days with daily amounts mostly at or below 2”. It was a cold February, averaging over 3 ½ degrees below normal. The bulk of the cold came at mid-month with a 2-week stretch of well below normal temps. The coldest was a 3-day stretch (17th through 19th) where highs only warmed into the single digits above zero with lows well below zero. |
 |
|
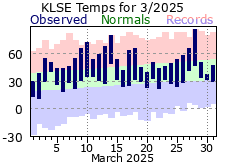
March reversed the dry start to the year with its 3.27” total marking it as the 15th wettest March. The precipitation came in “chunks” with 5 days dropping more than ¼” with 3 of those recording ½” or more. Much of what fell during the month was in the form of rain as measurable snows only occurred on 4 days. And of those days, the 4.1” of snow on the 19th accounted for the bulk of the 5.1” monthly snow total. Average temperatures for March were 5 ½ degrees above normal - tying it for the 8th warmest March on record. Highs reached 80 degrees on the 14th, 2nd fastest in a year for La Crosse for temperatures that warm. Additionally, highs reached 86 on the 28th – an all-time record for any day in March. There were 8 days with high temps of 60 degrees or warmer (normal is 3). But it wasn’t all “warm” in March. The month kicked off with sub-freezing temps (29 for a high on the 1st) while the record heat of the 28th was quickly followed by a high of only 37 on the 30th. In fact, there was even measurable snow on the 30th (0.3”). A lot of variability throughout the month. |
 |
|
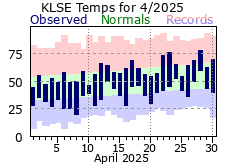
April was another wet month, helping to make up for the very dry start to 2025. Over 5” fell through the month, about 1 ½” above normal and 13th most in an April. Of the 11 days with measurable precipitation, 3 of those recorded ¾” or more. The last measurable snows of the 2024-25 winter season would fly on the 2nd (average is April 4th). Temperatures for the month were close to normal (about ½ degree below) but didn’t have the dramatic day to day swings that some of the previous months of 2025 had. The last freezing day of the spring came on the 20th with 30 degrees.
Looking back at the 2024-25 snowfall season, only 22.5” fell – making it the 8th least snowy season on record for La Crosse.
|
 |
|
May was a relatively cool and dry month. The average temperature was 1 ½ degrees below normal, mostly driven by a cool second half to the month (below normal temps were recorded from the 17th through month’s end). There was one warm stretch with 80+ degree days from the 11th through 15th, but there were nearly as many days with 80-degree highs (6) as there were with less than 60 (5 days). May was a dry month, taking away some the gains made from the previous two. Further, the bulk of the monthly total came on 2 days - 70% of 3.08” total fell on the 20th and 21st.
|
 |
|
June was fairly seasonable with temperatures most days within a few degrees of the normal. There was a brief hot spell with 90+ degree days on the 20th-23rd, but those were the only days highs reached or exceeded 90 all month. The first half of June averaged 66.3°F. This was 2.8°F colder than the 1991-2020 normal of 66.3°F. This was the coldest start to June since 2013 (63.8°F). The coldest first half occurred in 1945 when the average was 58.2°F. The second half of June averaged 76.8°F. This was 3.8°F warmer than the 1991-2020 normal of 73°F. This was the 9th warmest second half of June and the warmest since 1995 (78.8°F). The warmest second half occurred in 1933 when the average was 80.1°F. The warmest low temperature was 80°F on June 22. Tied with June 29, 1931, for the warmest June low temperature. It was a wet month with measurable rain falling on 17 days – tied for 4th most in a June and well above the average of 12. Additionally, 3 of days recorded over an inch, all occurring over a 4-day span (23rd through 26th). |
 |
|
July was also in line with most temperature and precipitation expectations for this mid-summer month, rounding out just a hair above normal for temps and rainfall. The 10 days of measurable precipitation were spread out across the month with no more than 4 days between rain falls. One day did account for nearly ½ of July’s monthly total though with 2.21” falling on the 16th. |
 |
|
August rounded out the traditional summer months on a bit of a cool note. Temperatures were at or below normal nearly 2/3rds of the days. There were 3 days when highs reached or exceeded 90 degrees – but 13 days where temps never warmed out of the 70s. On the whole, August finished almost 2 degrees below its normal. Rainfall was also below normal – right around 1 inch. Much of what fell came in a 5 days span (14th – 18th) where 2.12” or 75% of the month’s total fell. There were only 3 other says with measurable rainfall. |
 |
|
September got off to a very cold start, recoding below normal temps over the first 8 days. The average temp over that period was only 58.3, tying it for the 5th coldest start to a September on record. 5 of those days had highs only in the mid 60s with lows in the 40s. However, temperatures would swing warmer for the rest of the month with just 1 day (the 10th) not reaching or exceeded normal. Highs of 80 degrees or greater were found on 12 of the remaining days, well above the monthly average of 8. On the whole, despite the very cold start, September averaged around 2 degrees above normal. Rainfall for the month was fairly steady across the first 3 weeks with measurable rains falling every few days. The 22nd was notable with 1.70” falling – around 45% of the September total. The month would end with a dry streak of 8 days (23rd through 30th). Overall, rainfall was almost right on the normal. |
 |
|
A very warm start to October with 80+ degree high temperatures through the first 5 days of the month. The 74-degree average over that span made it the warmest start for an October on record. Highs even reached 90 on 3rd, the last 90-degree day for 2025 and tied for the 2nd latest occurrence of a 90-degree day in a year for La Crosse. Temperatures were more variable after that with above and below normal days. Overall, the month finished a bit over 3 degrees above normal. There were 12 days with measurable precipitation in October, a few days above the average of 9. However, 8 of those days recorded less than 1/10”. The total of 1.60” was almost an inch below normal. No measurable snow, or flurries for that matter, flew during the month. |
 |
|
November was mild overall, highlighted by a mid-month stretch (11th through 25th) with above normal temperatures – even reaching 69 on the 14th (a record for the day). That said, there were 6 days when temperatures never warmed to freezing, with a notable cold stretch of days to round out the month (27th-30th). On the whole November was about 2 ½ degrees above normal. It was fairly dry for nearly the entire month with only 7 days of measurable precipitation through the 27th, amounting to 0.96”. However, an early season winter storm would bring the most memorable, and impactful, weather of the month for the very last weekend. The storm tack on another ½+ to the monthly precipitation total, and in the process, dumped 8.5” of snow over the 28th through 30th. The 7.6” on the 29th set a record for the day. The fall months of September through November averaged 53.3 degrees, making it the 12th mildest fall on record. The 17 days with high temps of 80 degrees or warmer tied for 10th most in a fall in La Crosse with 2017. |
 |
|
December was much colder than normal averaging 5 degrees colder than normal. This was the coldest December since 2013 (15.6°F - Tied for the 19th coldest December with 1972). The average temperature during the first half (first 16 days) of December was 15.1°F. This was 12.4°F colder than the 1991-2020 normal of 27.5°F. This was the 16th coldest first half of a December and the coldest start since 2008 (14.9°F - 15th coldest first half of a December). The coldest first half of a December occurred in 1919 when the average temperature was 4.2°F. A total of 0.92" of precipitation fell. This was 0.57" below the 1991-2020 normal of 1.49". A total of 7.1" of snow was measured by the official NWS snowfall observer near La Crosse Regional Airport. This was 3.8" below the 1991-2020 normal of 10.9". |
 |
|
La Crosse had an average temperature 48.8°F. While this was 0.1°F below normal, 2025 still tied 1938 for the 20th warmest year. It also saw the warmest temperature in January (58°F – 30th) and March (86°F – March 28th) and tied the warmest low temperature in June (80°F – June 20th).
A total of 33.43” of precipitation fell. This was 1.80” below the 1991-2020 normal of 35.23 inches. Measurable precipitation fell on 124 days which just 1 day above the 1991-2020 normal of 123 days. A total of 29.7” of snow fell during the calendar year. This was 16.6” below normal the 1991-2020 normal of 46.3”. This was nearly the identical snow total as 2023 when 29.8” of snow fell. |
 |
| Highest temperature for 2025 | 97 on June 21st |
| Lowest temperature for 2025 | -18 on February 18th |
| Highest one-day precipitation | 2.21" on July 16th |
| Highest one-day snowfall | 5.2" on November 29th |
| Number of days with highs at or above 90 degrees | 14 |
| Number of days with highs at or below 32 degrees | 66 |
| Number of days with zero or below temperatures | 20 |
| Peak wind gust | 65 mph from the NW on July 28th |
| Number of days with measurable precipitation | 124 |
| Percentage of days with measurable precipitation | 34% |
| Number of days with above normal temperatures | 179 |
| Percentage of days with above normal temperatures | 49% |


 Weather Story
 Weather Map
 Local Radar