| Temperatures | Precipitation | ||||||
| Month | High | Low | Average | Departure | Total | Departure | Snow |
| January | 24.5 | 5.6 | 15.0 | +0.3 | 0.02 | -0.97 | 0.4 |
| February | 24.8 | 7.2 | 16.0 | -2.7 | 0.48 | -0.54 | 5.3 |
| March | 49.5 | 28.0 | 38.7 | +7.0 | 2.79 | +0.77 | 9.5 |
| April | 56.6 | 36.2 | 46.4 | +1.2 | 4.85 | +1.33 | 1.4 |
| May | 69.4 | 48.5 | 58.9 | +1.3 | 1.92 | -2.43 | 0.0 |
| June | 79.0 | 60.3 | 69.7 | +2.2 | 6.38 | +1.03 | ... |
| July | 81.1 | 63.0 | 72.0 | +1.5 | 3.33 | -0.86 | ... |
| August | 77.5 | 59.0 | 68.3 | +0.1 | 6.81 | +2.69 | ... |
| September | 75.0 | 53.8 | 64.4 | +3.3 | 4.15 | +0.55 | ... |
| October | 62.0 | 43.6 | 52.8 | +4.9 | 1.15 | -1.28 | 0.0 |
| November | 44.2 | 28.3 | 36.2 | +2.6 | 1.52 | -0.28 | 9.7 |
| December | 26.8 | 9.2 | 18.0 | -2.8 | 0.94 | -0.34 | 9.6 |
| TOTALS: | 55.9 | 36.9 | 46.4 | +1.6 | 34.34 | -0.33 | *** |
Records
Temperature...
Highs:
Lows:
Highest Lows:
Lowest Highs:
Monthly:
Seasonal:
Yearly:
Precipitation...
One-day pcpn:
One-day snowfall:
Monthly pcpn:
Monthly snowfall:
Seasonal precipitation:
Yearly precipitation:
|
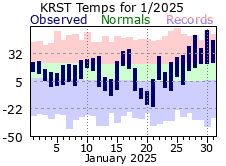
January kicked off 2025 on a record setting note – but not in the fashion that many would assume of the typically cold, snowy month. Instead, Rochester experienced its driest start on record with only 2 days of measurable precipitation amounting to only 0.02”. That was the least amount in any January for Rochester while the number of days with measurable precipitation tied previous lowest in a January (average is 8 days). Further, snowfall for the month was only 0.3”, least in a January and only the second time that less than an inch had fallen for the entire month (0.8” in 2006). The lack of snow resulted in no more than a trace of snow on the ground throughout the month – this first time this has occurred in a January in Rochester (on average there are 26 such days). The average temperature for the month was right around its normal - but doesn’t paint the full picture of the variability in the day-to-day temps. For instance, highs never warmed above 20 degrees on 10 days while warming to 40 degrees or greater on 4 days. Two of those days even had highs reached or exceeded 50 degrees – which has only occurred on 14 other days in a January in Rochester.
|
 |
|
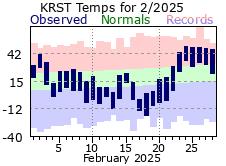
February would continue the dry trend of January, finishing 1/2” under its normal. There were 7 days with measurable precipitation (right on its average), but generally only amounting to around 1/10” or less each day. There were 4 days with measurable snow, all coming before the 15th and holding around 2” or less. It was a cold February, averaging over 2 ½ degrees below normal. The bulk of the cold came at mid-month with 2 weeks of well below normal temps. The coldest was a 3-day stretch (17th through 19th) where temperatures never warmed above 0 on the 17th and only managed single digits highs on the 18th and 19th. |
 |
|
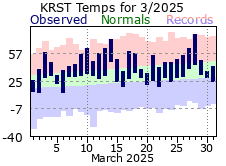
March reversed the dry start to the year with its 2.79” total over ¾” above its monthly normal. There was measurable precipitation on 9 days with 5 of those recording ¼” or more (tied for 3rd most such days in a March). However, much of what fell came in the form of rain as there were only 4 days of measurable snowfall – albeit one of those days did drop 5.4” (the 19th). The average temperature for March was a whopping 7 degrees above normal - tying it for the 7th warmest March on record. Highs reached 80 degrees on the 28th – second earliest 80 degree or warmer day on record for Rochester. There were 6 days with high temperatures of 60 degrees or warmer (normal is 2). But it wasn’t all “warm” in March. The month kicked off with sub-freezing temps (26 for a high on the 1st) while the record heat of the 28th was quickly followed by a high of only 36 on the 30th. In fact, there was even measurable snow on the 30th (0.8”). A lot of variability throughout the month. |
 |
|
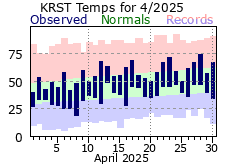
April was another wet month, helping to make up for the very dry start to 2025. Nearly 5” fell through the month, 1 1/3” above normal and 11th most in an April. Of the 12 days with measurable precipitation, 11 of those recorded 1/10” or more – tied for 2nd most in an April – while 3 registered ¾” or more. The last measurable snows of the 2024-25 winter season would fly on the 1st – a little over a week earlier than average. Temperatures for the month were a bit over 1 degree above normal but didn’t have the dramatic day to day swings that some of the previous months of 2025 had. The last freezing day of the spring came on the 16th with 28 degrees. Looking back at the 2024-25 snowfall season, only 23.6” fell – making it the 4th least snowy season on record for Rochester. |
 |
|
May was a tale of 2 halves when it came to temperatures – a mild start and a cool end. Highs topped 80 degrees 7 times over the first 2 weeks while failing to warm out of the 50s on 4 days over the last 2 weeks. On the whole, the warm period was enough to have May finish a little over 1 degree above normal. Rain was a rare quantity for May with measurable precipitation falling on only 8 days, most of which dropped during the second half of the month. Additionally, 1 day accounted for nearly 75% of the 1.92” monthly total (1.42” on the 20th), Prior to that day, less than 2/10ths of an inch fell from the 1st through the 19th. It was the 16th driest May on record for Rochester.
Looking back at the spring months of March-April-May, the average temperature was 48.0 degrees, tying it for the 8th warmest spring on record in Rochester. |
 |
|
The faucet turned back on in June with measurable rains falling on almost 60% of the days (18 – tied for 3rd most in a June). On 8 of those days ¼” or more fell, 5 of which accumulated more than ½”. The average temperature for the month was around 2 degrees above normal, but for the most part, day to day temps hovered within a few degrees of a typical June. |
 |
|
July was a comparatively drier month to June and its own normal, but measurable rains still fell half the time (15 days – tied for 4th most in a June and well above the average of 10). Additionally, no more than 5 days separated days with measurable rain. Temperatures were above normal for the 5th consecutive month, but like June, most days were within a few degrees of normal. |
|
|
August was right on its normal for temperatures. Dailies stayed within 5 degrees of normal on 2/3rds of the days with no significant cold or warm days. Highs didn’t even reach 90, which happens 3 times on average. Rainfall for the month was over 2 ½ inches above normal, but only accumulated on 8 days. 4 of those received ½: or greater with 3.06” falling on the 9th – setting a new record. The 6.81” monthly total also set a record for the 7th wettest August. |
 |
|
September got off to a very cold start, recording below normal temps over the first 8 days. The average temp over that period was only 55.6, marking it as the 3rd coldest start to a September on record. Highs couldn’t warm above 64 from the 3rd through the 7th while on the 5th temperatures only peaked at 58 degrees. Brr. However, temperatures would swing warmer for the rest of the month with all days averaging above the September normal. Highs of 80 degrees or greater were found on 8 of those. On the whole, despite the very cold start, September averaged over 3 degrees above normal and the 64.4 degree average tied it for the 10th warmest September on record. Rainfall for the month was fairly steady for the first 3 weeks, with mostly light rain every few days. No day amounted to more than ¼”. However, the 22nd was notable exception with 3.28” falling – almost 80% of the September total. The month would end with a dry streak of 8 days (23rd through 30th). Overall, rainfall was around ½” above normal – all thanks to that soggy 22nd. |
 |
|
It was a very warm start to October with 80+ degree high temperatures through the first 5 days of the month. The 71.8 degree average over that span made it the warmest start for an October on record. Temperatures were more variable after that but generally trended above normal. Overall, the month finished nearly 5 degrees above normal and just missed finishing in the top 10 for warmest Octobers (14th). There were 9 days with measurable precipitation in October. However, 7 of those days recorded around 1/10” or less. The total of 1.15” was almost 1 ¼” below normal. No measurable snow, or flurries for that matter, flew during the month.
|
 |
|
November was a mixed bag when it came to temperatures with 60 or above on 2 days, but not even reaching freezing on 7 others. Still, there were more mild days than not and the month finished around 2 ½ degrees above normal. It was a dry first half of November with measurable rain falling on only 3 days through the 17th, amounting to only 0.15”. Precipitation was more common during the 2nd half of the month with measurable precipitation falling on half of the days. Much of what fell in November came in the form of snow, especially over the last week of the month. Measurable snow as recorded on 6 days – starting on the 8th. The highlight was a dumping of 7.6” on the 29th – a record for the day and the 7th most to fall on any November day in Rochester. The fall months of September through November averaged 51.1 degrees, making it the 5th warmest fall on record for Rochester. |
 |
|
December started off very cold. The average temperature during the first half (first 16 days) of December was 13.4°F. This was 9.9°F colder than the 1991-2020 normal of 23.3°F. This was tied with 2008 for the 21st coldest first half of a December. The coldest first half of a December occurred in 1919 when the average temperature was -0.7°F. High temperatures then moderated into the 30s from December 21 through December 28. This resulted in snow depths dropping from 3” on December 21 to just a trace on December 27. We just barely ended up with a White Christmas with just 1” of snow on the ground that morning. The monthly temperature average was 18 degrees or 2.8 degrees colder than the 1991-2020 normal of 20.8 degrees. A total of 0.94” of precipitation fell. Near half of that fell on December 28-29 when 0.45” of precipitation fell. A total of 9” of snow fell. 5.7” of that snow fell on December 28-29. |
 |
|
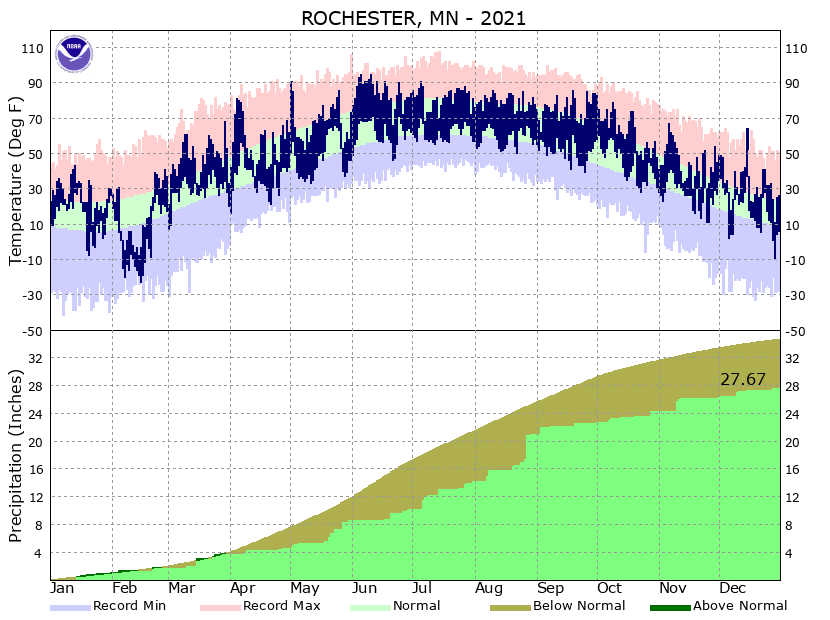
For 2025, Rochester had an average temperature 46.4°F. This was 1.6 degrees warmer than the 1991-2020 normal 44.8 degrees. This made it the 11th warmest year. A total of 34.34” of precipitation fell. This was 0.33” drier than the 1991-2020 normal of 34.67”. Measurable precipitation fell on 121 days which just 3 days below the 1991-2020 normal of 124 days. A total of 35.3” of snow fell during the calendar year. This was 17.8” below normal the 1991-2020 normal of 53.1”.
|
 |
| Highest temperature for 2025 |
90 on June 2nd |
| Lowest temperature for 2025 | -21 on January 21st |
| Highest one-day precipitation | 3.28” on September 22nd |
| Highest one-day snowfall | 7.6” on November 29th |
| Number of days with highs at or above 90 degrees | 3 |
| Number of days with highs at or below 32 degrees | 71 |
| Number of days with zero or below temperatures | 31 |
| Peak wind gust | 76 mph from the NNW on July 28th |
| Number of days with measurable precipitation | 121 |
| Percentage of days with measurable precipitation | 33.2% |
| Number of days with above normal temperatures | 222 |
| Percentage of days with above normal temperatures | 60.8% |


 Weather Story
 Weather Map
 Local Radar