Upper Mississippi River Climate Summary for October 2026:
Temperatures - Above to Well-Above Normal
- During October 2026, average temperatures ranged from 52.5°F near Owen, WI (COOP) to 59.5°F at Charles City, IA (COOP) and Guttenberg Lock & Dam 10 (COOP).
- Temperature anomalies ranged from 6°F to 10°F warmer than normal.
- The warmest temperature was 91°F at the Austin Waste Water Treatment Facility, MN (COOP) on October 11. That was tied for the second warmest October day with October 5, 1963 and October 1, 2023. The warmest October day occurred on October 2, 1997 when the high temperature was 92°F.
- The coldest temperature was 23°F at Sparta Fort McCoy, WI (ASOS) and near Owen, WI (COOP) on October 17.
- In many places, it was warmest October since 1963. Rochester, MN had their 3rd warmest October. La Crosse, WI had their 5th warmest October.
|
 |
Rainfall - Highly Variable
- Rainfall ranged from 1.09" at Winona Dam 5A, MN (COOP) to 4.90" at Guttenberg Lock & Dam 10, IA (COOP).
- Rainfall anomalies ranged from 2" drier than normal to 2" wetter than normal.
- The wettest day was near Steuben, WI (COOP) when 2.87" of rain fell from October 3 to October 4.
|
 |
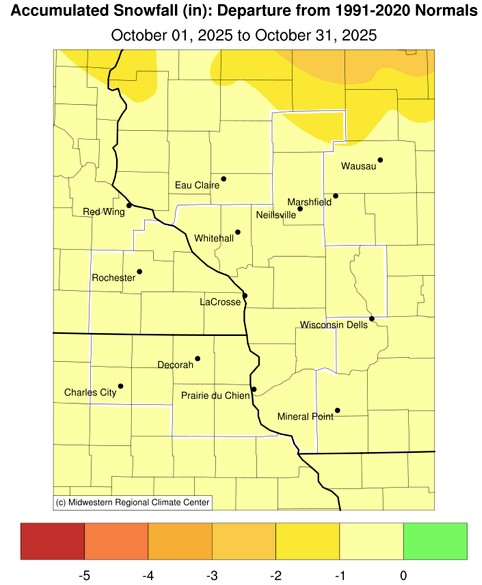
| Snowfall - Below Normal |
|
- No snow fell during the month.
- Typically a trace to 2" of snow falls during the month.
- The highest totals are typically north of Wisconsin Highway 29.
|
 |
| Severe Weather - Above Average |
|
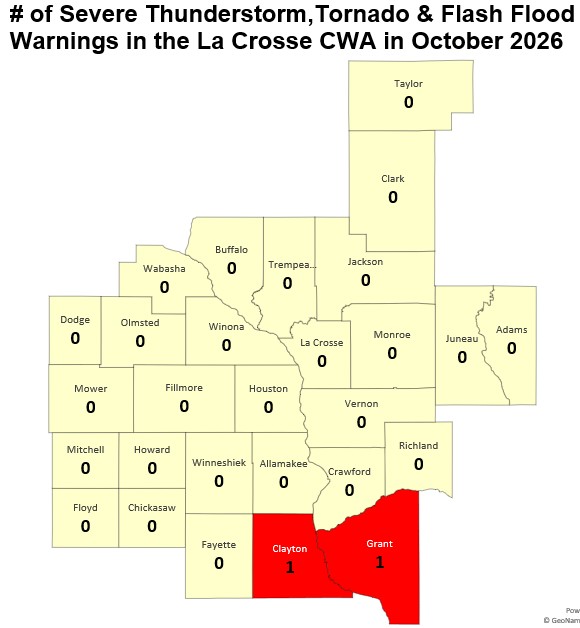
- During October, there were 2 Severe Thunderstorm Warnings. They were issued on October 13.
- These were first Severe Thunderstorm Warnings in an October since 2023 (October 24).
- This October was tied with 2023 for the 6th most Severe Thunderstorm Warnings in an October. The most in an October was 17 warnings in 2006.
- Since 1986, there have only been 14 Octobers with convective warnings (Severe Thunderstorm Warnings, Tornado Warnings, & Flash Flood Warnings. The most was 17 convective warnings in 2006 (October 4 - 11 warnings, October 2 - 4 warnings, and October 3 - 2 warnings).
|
 |
|
Autumn Colors - Duller and Slower at Turning Color
Meanwhile, Some Spring Plants Start to Bloom
|
|
- Fall Foliage
- October nights were anywhere from 1 to 10°F warmer than normal. This impacted the colors of our fall foliage.
- Warm fall temperatures delay the breakdown of chlorophyll, meaning leaves stay green longer and peak foliage occurs later in the year than usual.
- When autumn nights remain anomalously warm, trees fail to produce these red pigments efficiently. Instead of brilliant crimson, landscapes are dominated by yellow and orange carotenoids (which are always present in the leaf) or turn directly to a dull, washed-out brown.
- Lilacs Blooming
- There were many reports of lilacs blooming in the southern half of Wisconsin during October.
- The August drought followed by a very September caused lilac bushes in southern half of Wisconsin to enter a premature stress-induced dormancy.
- The anomalous warmth (4°F to 10°F warmer than normal) in October. The lilac bushes interpretted the combination of moisture and temperature changes as a signal that winter has passed, forcing next spring's flower and vegetative buds to open prematurely.
- This has happened in other autumns. This includes 2021 when some lilacs were blooming in mid-December.
- Some of these blooms could be a result of the Bloomerang Lilac. These lilacs have been genetically programmed to produce lilacs in both spring and autumn.
|
 |
Below are the October 2026 climate summaries for La Crosse, WI, and Rochester, MN.
La Crosse, WI
October 2026 was Drier and Much Warmer than Normal for La Crosse, WI
...October 2026 Highlights...
Temperatures - Tied for the 5th Warmest
- The average temperature was 58.4°F at La Crosse Regional Airport.
- This was 6.7°F warmer than the 1991-2020 normal of 51.7°F.
- This was the 5th warmest October and the warmest October since 1963 (warmest October with an average temperature of 61.2°F).
- 5 out of the 17 warmest Octobers have occurred since 2007. This includes the 5th warmest (58.4°F - 2026), 6th warmest (57.6°F - 2021), 12th warmest (56.5°F - 2007), 14th warmest (56.4°F - 2024), and 17th warmest (56°F - 2016).
- Here are the ten warmest Octobers in La Crosse, WI.
Warmest Octobers
in La Crosse WI
1873-2026
Average
Rank Temperature Year
---- ----------- ----
1 61.2°F 1963
2 60.5°F 1947
3 59.1°F 1900
4 59.0°F 1879
5 58.4°F 2026
6 57.6°F 2021
7 57.4°F 1956
8 57.1°F 1973
9 57.0°F 1950
10 56.9°F 1920
- The average high temperature was 69.1°F. This was 7.5°F warmer than the 1991-2020 normal of 61.6°F. This was the 3rd warmest. Only 1963 (71.3°F) and 1947 (69.5°F) were warmer.
- The average low temperature was 47.7°F. This was 5.8°F warmer than the 1991-2020 normal of 41.9°F. This was tied with 2007 for the 7th warmest. The warmest occurred in 1947 when the average low temperature was 48.9°F.
- The warmest high temperature was 87°F on October 10 and October 12.
- The coldest high temperature was 54°F on October 16.
- The warmest low temperature was 68°F on October 12.
- The coldest low temperature was 34°F on October 17.
- The low temperature fell below freezing on 0 days. The long-term average is 5.5 days.
Rainfall - Below Normal
- During October, 1.15" of rain fell at La Crosse Regional Airport.
- This was 1.34" below the 1991-2020 normal of 2.49 inches.
- The wettest day was October 15 when 0.81" of rain fell.
- Measurable rain fell on 6 days (19.4%) and 5 other days (16.1%) had a trace of rain.
Snowfall - Tied for Least
- During October, 0" of snow was measured by the official NWS snow observer near La Crosse Regional Airport.
- This was 0.3" below the 1991-2020 normal of 0.3".
- This was tied for the least with 54 other Octobers.
- The last time measurable snow fell in an October was 2023 when 1.1" of snow fell.
Mississippi River - Below Average
- Average 7 AM stage was 4.93 feet.
- This was the lowest October average since 2012 (4.90 feet).
- This was 0.63 feet below the long-term average (1937-2026) of 5.56 feet.
- The highest 7 AM stage was 5.13 feet on October 3. The highest 7 AM October stage was 13.06 feet on October 1, 1986.
- The lowest 7 AM stage was 4.79 feet on October 26. The lowest 7 AM October stage was 3 feet on October 4 & 5, 1947.
...October 2026 Records...
Daily...
- October 10 - New Record High - 87°F - Previous Record 86°F in 1928
- October 12 - Record High Tied - 87°F - Last occurred in 1995
- October 12 - New Record Warm Low - 68°F - Previous Record 65°F in 1886
...Looking Ahead to November...
-
The normal high temperature in La Crosse starts off at 53°F on November 1st and falls to 38°F by the end of the month. The normal low temperature starts off at 35°F on the 1st and falls to 23°F by the end of the month. The warmest November temperature on record is 80°F on November 1, 1933, and the coldest is -21°F on November 29, 1875.
-
The normal mean temperature for November is 37.6°F. La Crosse’s warmest November occurred in 2001 with an average temperature of 47.5°F, and their coldest November occurred in 1880 with an average temperature of 25°F.
-
The normal November precipitation is 1.85". The wettest November occurred in 1934 with 7.01" of precipitation and the driest November occurred in 1976 with just a trace of precipitation (driest month ever in La Crosse). The wettest November day occurred on November 1, 1990, when 2.80" of precipitation fell. Normally, there is 1 day with thunderstorms.
-
The normal November snowfall is 3.4". The snowiest November occurred in 1991 with 30.3" of snow and the least snow was none in 1949 and 1999. The snowiest November day occurred on November 23, 1991, when 13" of snow fell.
Rochester, MN
October 2026 was Drier and Much Warmer than Normal at Rochester MN
...October 2026 Highlights...
Temperatures - 3rd Warmest
- The average temperature was 56.1°F at Rochester International Airport.
- This was 8.2°F warmer than the 1991-2020 normal of 47.9°F.
- This was the 3rd warmest October and the warmest since 1963 (warmest October with an average temperature of 58.1°F). The only other October that was warmer occurred in 1947 when the average temperature was 57.8°F (2nd warmest October).
- 7 out of the 14 warmest Octobers have occurred since 2007. This includes 3rd warmest (56.3°F - 2026), 6th warmest (54.5°F - 2024), 7th warmest (54.4°F - 2007), 13th warmest (53.4°F - 2021), 14th warmest (53°F - 2011), 15th warmest (52.8°F - 2025) and 16th warmest (52.6°F - 2010).
- The table below lists the 10 warmest Octobers in Rochester.
Warmest Octobers
for Rochester, MN
1886-2026
Average
Rank Temperature Year
---- ----------- ----
1 58.1°F 1963
2 57.8°F 1947
3 56.1°F 2026
4 55.5°F 1956
5 54.6°F 1914
6 54.5°F 2024
7 54.4°F 2007
8 54.3°F 1953
9 53.9°F 1973
53.9°F 1950
- The average high temperature was 66.4°F. This was 8.4°F warmer than the 1991-2020 normal of 57.9°F. This was the 8th warmest. The warmest occurred in 1963 when the average high temperature was 69.2°F.
- The average low temperature was 45.9°F. This was 7.9°F warmer than the 1991-2020 normal of 38°F. This was tied with 2007 for the 3rd warmest. Only 1947 and 1963 were warmer with an average temperature of 47°F.
- The warmest high temperature was 87°F on October 11.
- The coldest high temperature was 50°F on October 16.
- The warmest low temperature was 60°F on October 11.
- The coldest low temperature was 31°F on October 17.
- The low temperature fell below freezing on 1 day. The long-term average is 9.7 days.
Rainfall - Below Normal
- During October, 1.63" of rain fell at Rochester International Airport.
- This was 0.80" below the 1991-2020 normal of 2.43".
- The wettest day was October 15 when 1.11" of rain fell.
- Measurable rain fell on 5 days (16.1 percent) and 3 other day (9.7 percent) had a trace of rain.
Snowfall - Tied for Least
- During October, 0" of snow was measured by the official NWS snow observer near Rochester International Airport.
- This was 0.3" below the 1991-2020 normal of 0.9".
- This was tied for the least with 29 other Octobers.
- The last time measurable snow fell in an October was 2023 when 1.6" of snow fell.
...October 2026 Records...
Daily...
- October 10 - New Record High - 86°F - Previous Record 85°F in 1930
- October 11 - New Record High - 87°F - Previous Record 84°F in 2015
- October 12 - New Record High - 86°F - Previous Record 85°F in 1956
- October 24 - Record High Tied - 76°F - Previously set in 1963 and 1973
...Looking Ahead to November...
- The normal high temperature in Rochester starts off at 49°F on November 1st and falls to 34°F by the end of the month. The normal low temperature starts off at 32°F on the 1st and falls to 19°F by the end of the month. The warmest November temperature on record is 77°F on November 1, 1893, and the coldest is -24°F on November 28, 1887.
- The normal mean temperature for November is 33.6°F. Rochester’s warmest November occurred in 2001 with an average temperature of 45.4°F, and its coldest November occurred in 1985 with an average temperature of 22.9°F.
- The normal November precipitation is 1.80". The wettest November occurred in 1909 with 5.91" of precipitation and the driest November occurred in 1917 with only 0.01". The wettest November day occurred on November 1, 1991, when 2.30" of precipitation fell. Normally, there is 1 day with thunderstorms.
- The normal November snowfall is 4.5". The snowiest November occurred in 1985 with 22.5" of snow and the least snow was none in 1913 and 1939. The snowiest November day occurred on November 30, 1934, when 12" of snow fell.



 Weather Story
 Weather Map
 Local Radar
 Follow us on X
 Follow us on Facebook
 Follow us on YouTube
 ARX RSS Feed