The maps are based on data from NASA's Gravity Recovery and Climate Experiment (GRACE) satellites, which detect small changes in the Earth's gravity field caused by the redistribution of water on and beneath the land surface. The paired satellites travel about 137 miles (220 km) apart and record small changes in the distance separating them as they encounter variations in the Earth's gravitational field.
Short Term Drought Blend
Short Term Components
Long Term Drought Blend
Long Term Components
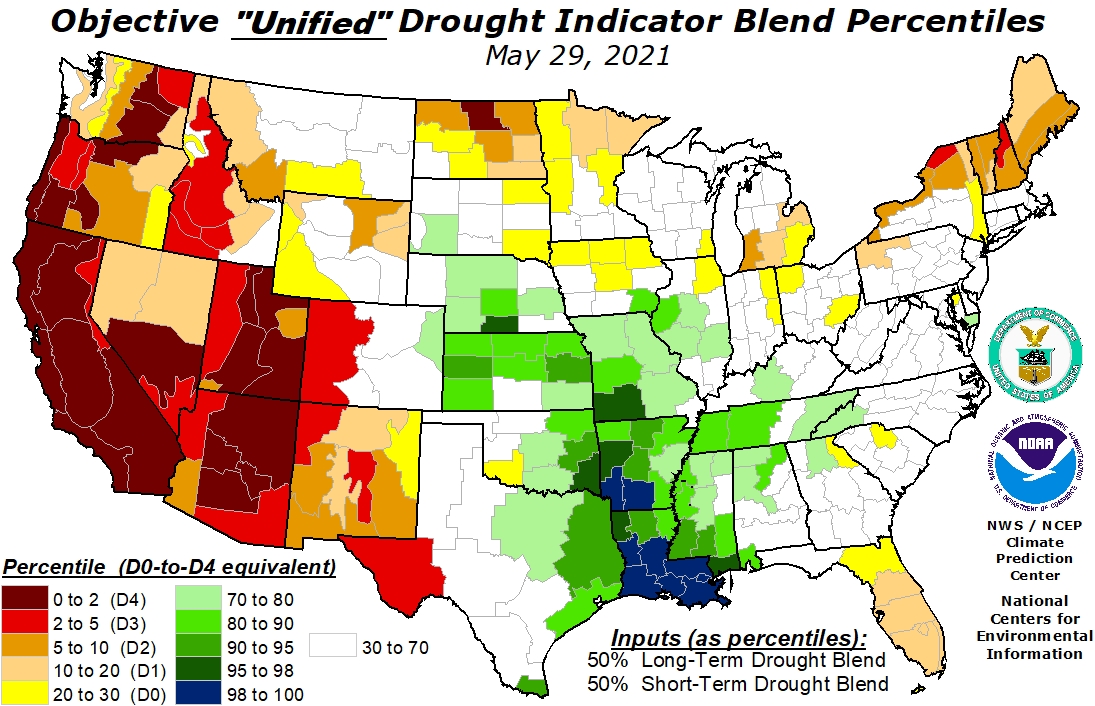
Unified Blend (50%Short 50% Long)
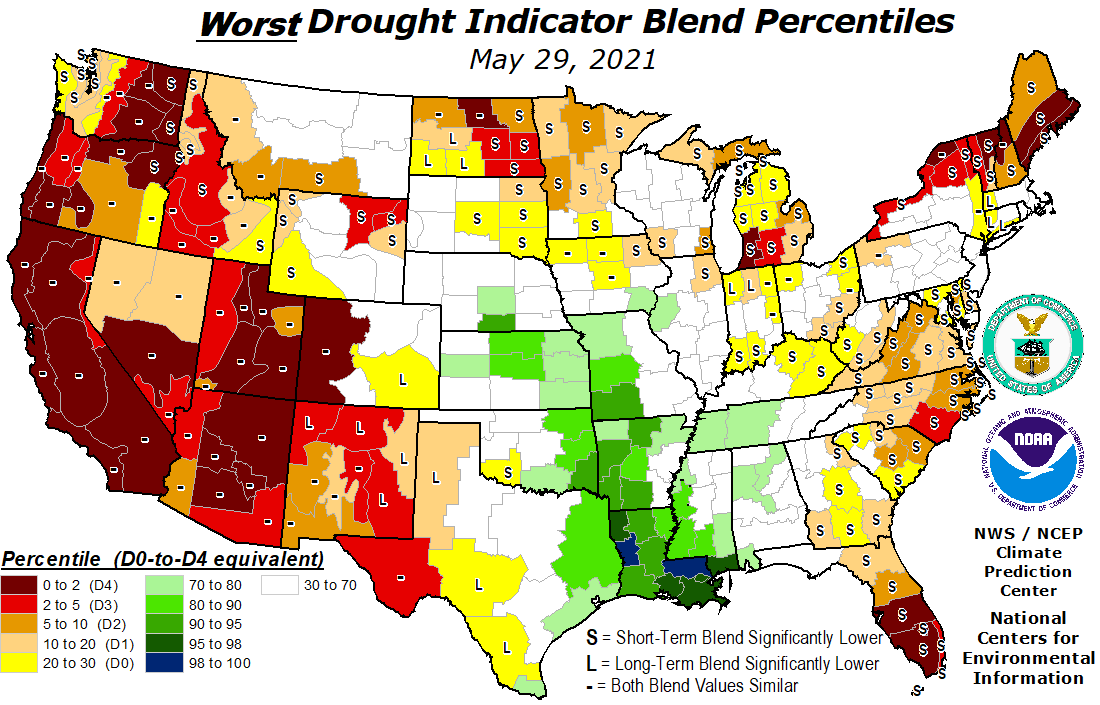
Worst Indicator
VegDri
VegDri: Two variables related to general vegetation conditions – the Percent Average Seasonal Greenness (PASG) and Start of Season Anomaly (SOSA) – are calculated from satellite-based observations and incorporated into the VegDRI. Both variables are calculated from normalized difference vegetation index (NDVI) data acquired by NOAA’s Advanced Very High Resolution Radiometer (AVHRR). Climate-related variables incorporated into VegDRI include the Palmer Drought Severity Index (PDSI) and the Standardized Precipitation Index (SPI). Information about soils, land cover, land use, and the ecological setting are the types of biophysical data incorporated into VegDRI. This information is critical because the climate-vegetation response can vary depending on these different environmental characteristics.


.png)
.png)