Current Watches, Warnings, and
Advisories

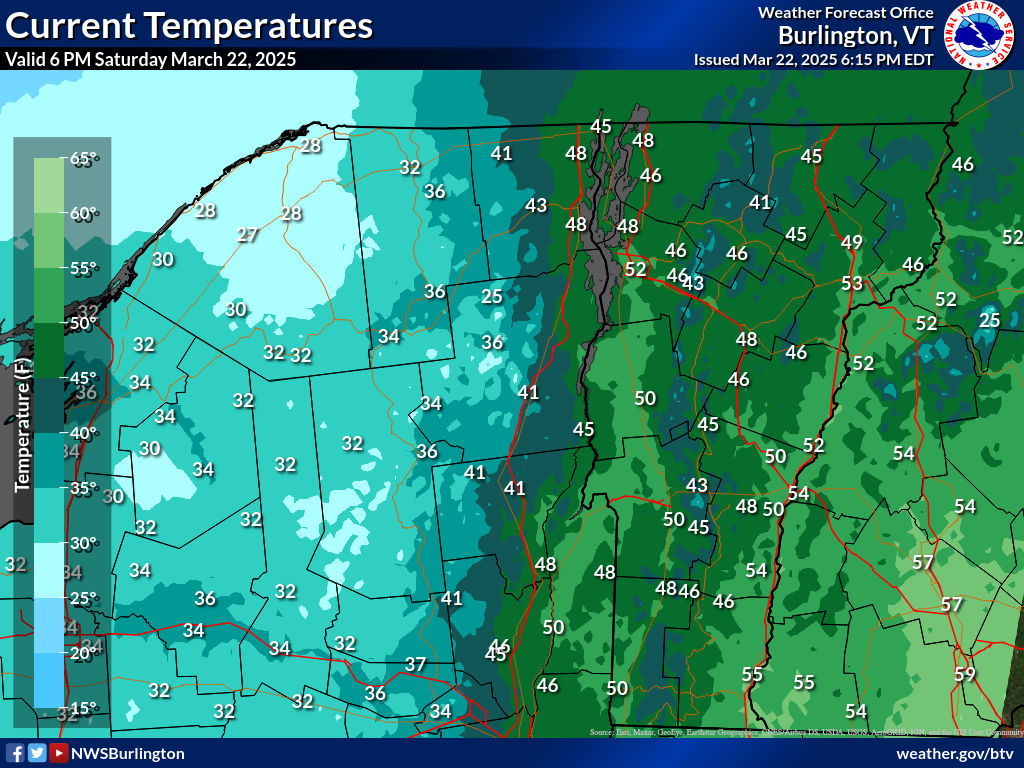
Current Temperatures
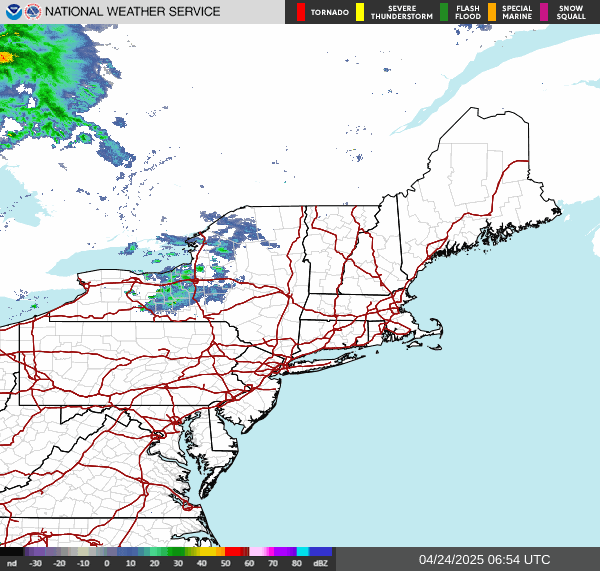
Current Radar
Current Visible Satellite Loop

Current Temperatures
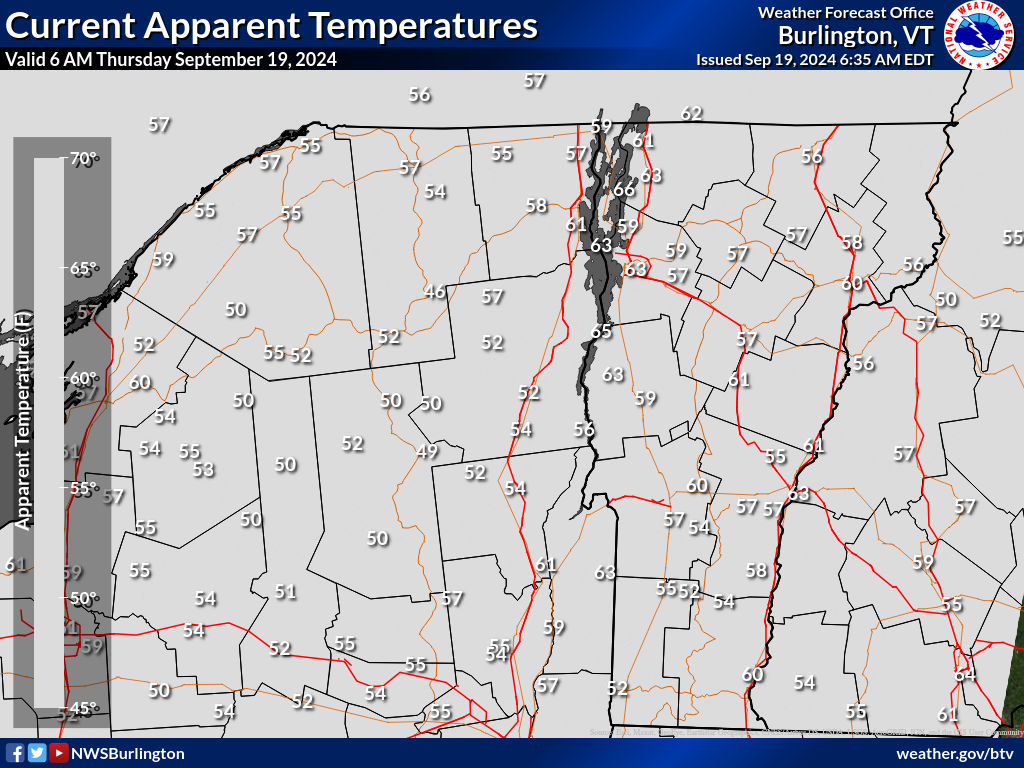
Current Heat Index
Temperatures
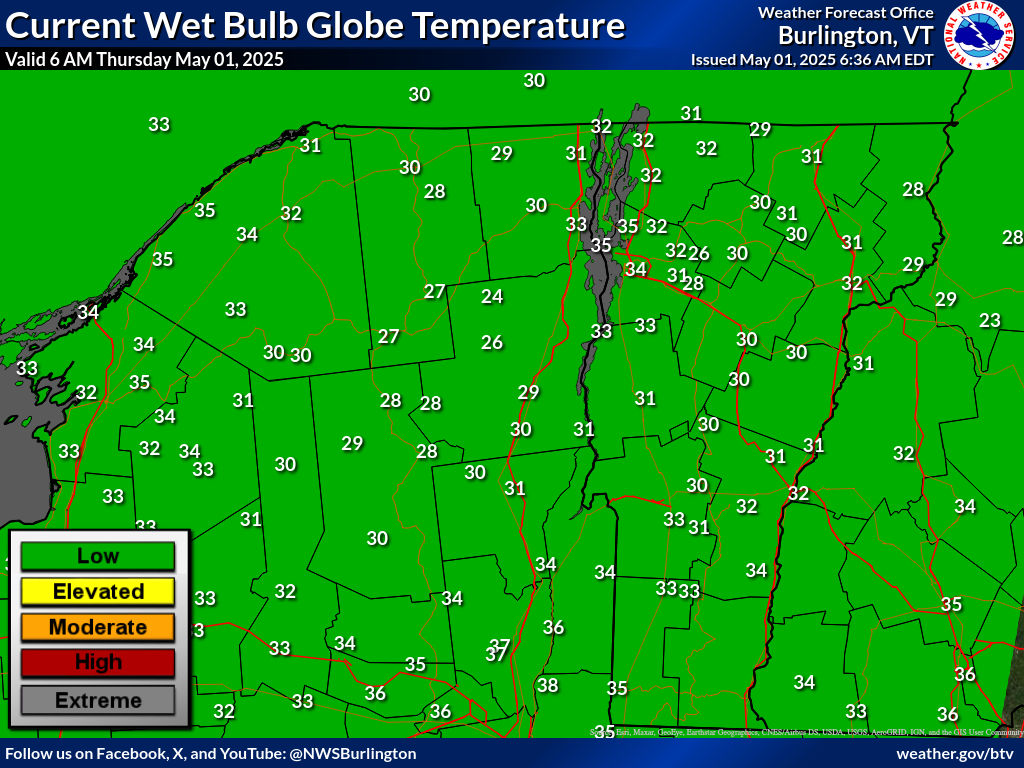
Current Wet Bulb Globe
Temperatures
Today's Hourly Heat Index Forecasts
Tomorrow's Hourly Heat Index Forecasts
Daily Heat Index Forecasts
Max Temperature vs Heat Index
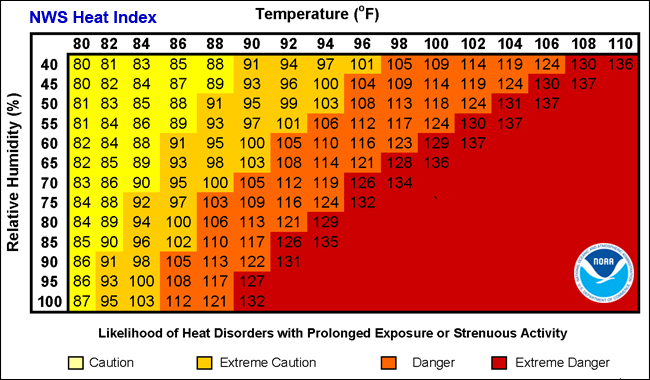
The Heat Index is a measure of how hot it really feels when relative humidity is
factored in with the actual air temperature. To find the Heat Index temperature, look at
the Heat Index Chart above or check our
Heat Index Calculator.
As an example, if the air temperature is 96°F and the relative humidity is
65%, the heat index--how hot it feels--is 121°F. The red area without numbers
indicates extreme danger. The National Weather Service will initiate alert procedures
when the Heat Index is expected to exceed 105°-110°F (depending on local
climate)
for at least 2 consecutive days.
Compare the Max Temperature and Heat Index
Click the thumbnails below to view larger image.
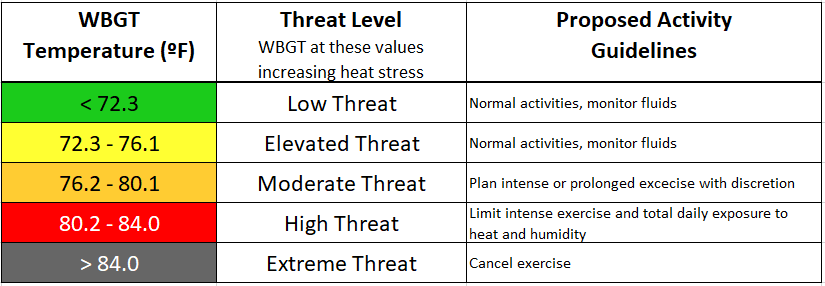
Wet Bulb Globe Temperature (WBGT)
(Experimental) National WBGT Display
The Wet Bulb Globe Temperature (WBGT) is a measure of heat stress in direct sunlight,
which is based on
temperature, humidity, wind speed, sun angle, and cloud cover (solar radiation). This
differs from the
heat index, which is based only on temperature and humidity and is calculated for shady
areas.
Scroll down for latest forecasts.
Hourly WBGT Forecast
Daily WBGT Forecast
Resources
- General WBGT Information (Wiki page)
- American College of Sports Medicine (ACSM), [position stand]
- Korey Stringer Institute
- University of Georgia Research [AMS conference presentation]
- WBGT Research
- OSHA Heat Hazard Assessment and WBGT
- Department of the Army: Prevention of Heat and Cold Casualties
- Department of the Army: WBGT, Guidelines, Prevention
WBGT vs Heat Index
What's the Difference?
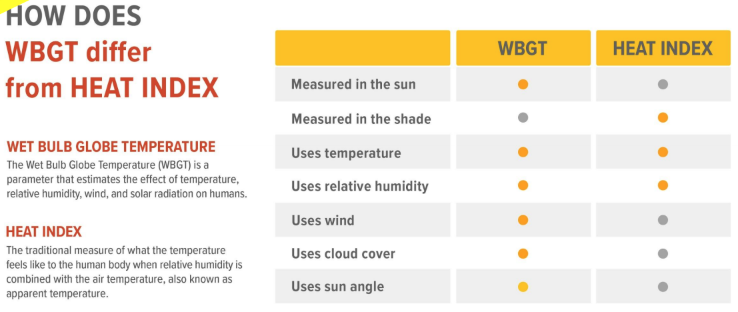
Compare the WBGT and Heat Index
Click the thumbnails below to view larger image.
NWS HeatRisk
(Experimental) National HeatRisk Display
The NWS HeatRisk is an experimental color-numeric-based index that provides a forecast
risk of heat-related impacts to
occur over a 24-hour period. HeatRisk takes into consideration:
- How unusual the heat is for the time of the year
- The duration of the heat including both daytime and nighttime temperatures
- If those temperatures pose an elevated risk of heat-related impacts based on data from the CDC
| Category | Risk of Heat-Related Impacts |
|---|---|
| Green 0 |
Little to no risk from expected heat. |
| Yellow 1 |
Minor - This level of heat affects primarily those individuals extremely sensitive to heat, especially when outdoors without effective cooling and/or adequate hydration. |
| Orange 2 |
Moderate - This level of heat affects most individuals sensitive to heat, especially those without effective cooling and/or adequate hydration. Impacts possible in some health systems and in heat-sensitive industries. |
| Red 3 |
Major - This level of heat affects anyone without effective cooling and/or adequate hydration. Impacts likely in some health systems, heat-sensitive industries and infrastructure. |
| Magenta 4 |
Extreme - This level of rare and/or long-duration extreme heat with little to no overnight relief affects anyone without effective cooling and/or adequate hydration. Impacts likely in most health systems, heat-sensitive industries and infrastructure. |
Daily HeatRisk
Heat Safety
|
|
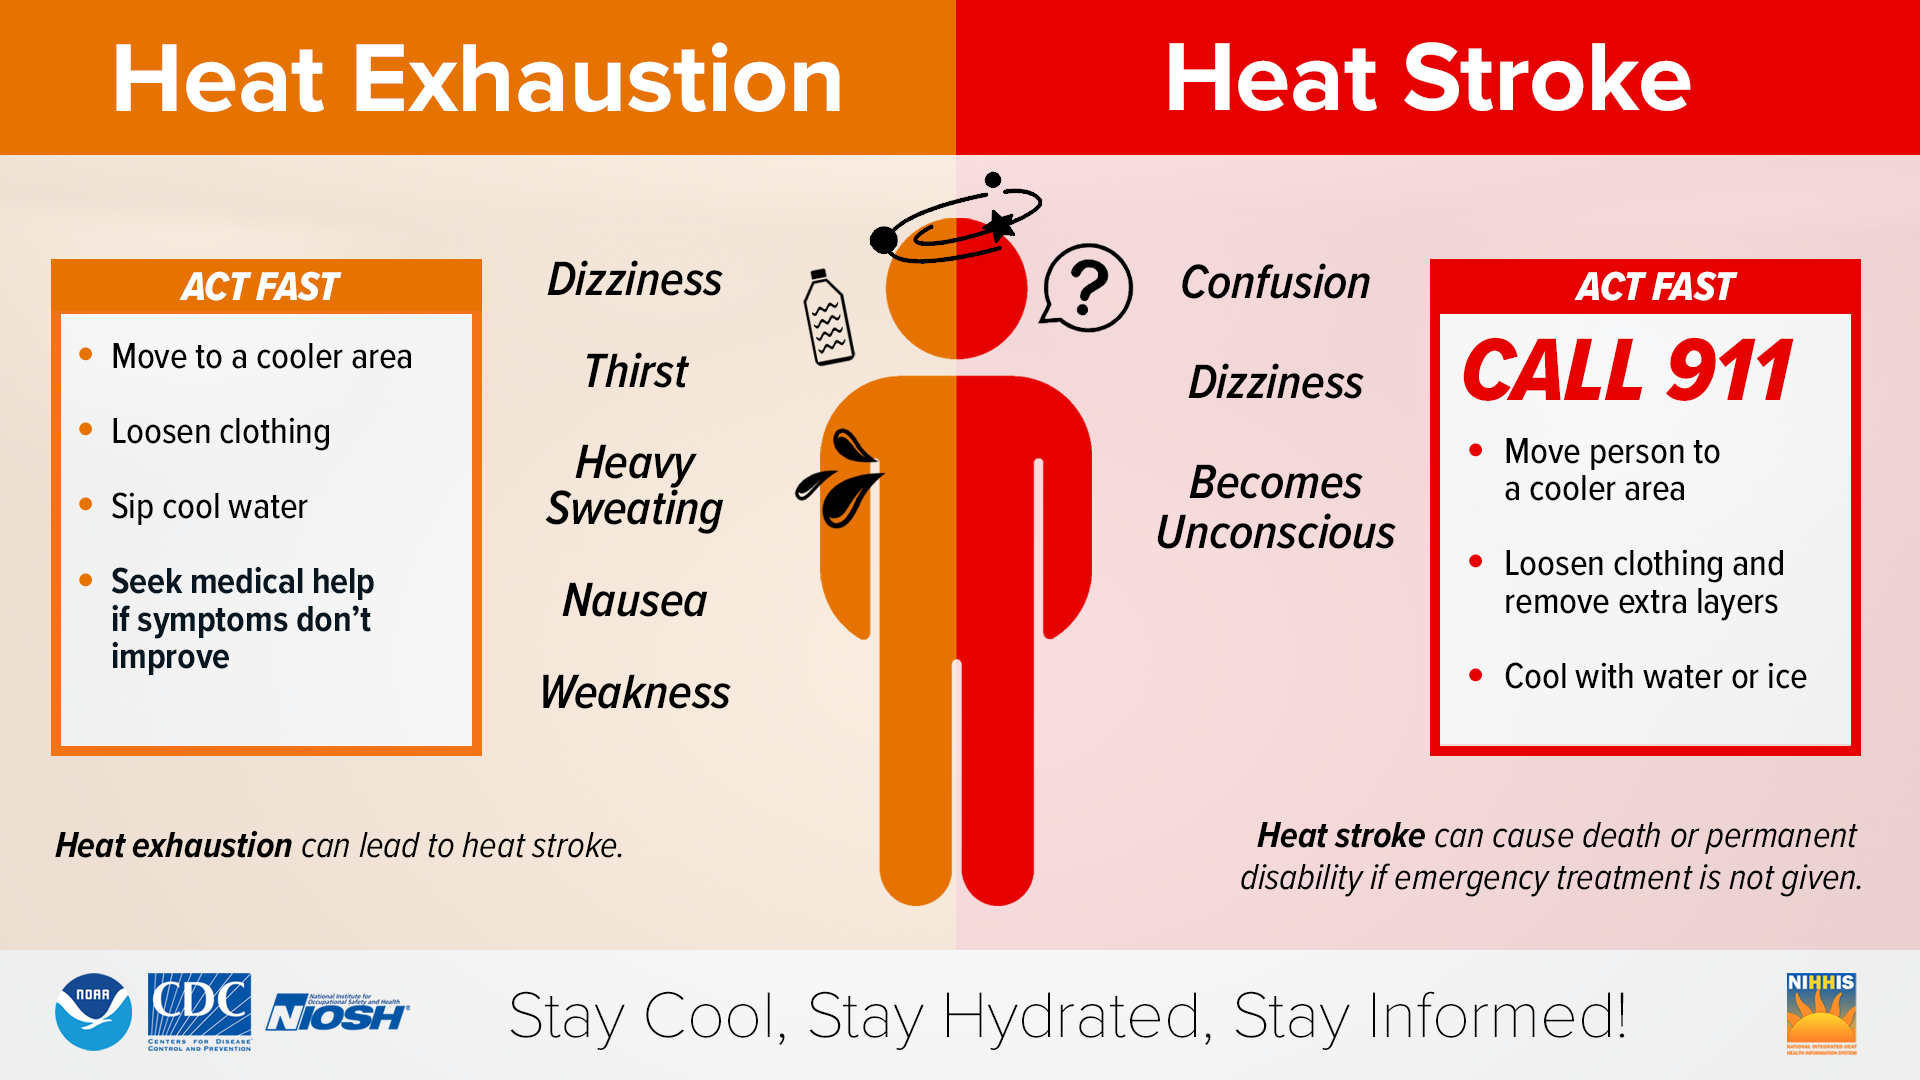
During extremely hot and humid weather, your body's ability to cool itself is challenged. When the body heats too rapidly to cool itself properly, or when too much fluid or salt is lost through dehydration or sweating, body temperature rises and you or someone you care about may experience a heat-related illness. It is important to know the symptoms of excessive heat exposure and the appropriate responses. The Centers for Disease Control and Prevention (CDC) provides a list of warning signs and symptoms of heat illness, and recommended first aid steps. Some of these symptoms and steps are listed below.
Heat Cramps
Heat cramps may be the first sign of heat-related illness, and may lead to heat
exhaustion or stroke.
- Symptoms: Painful muscle cramps and spasms usually in legs and abdomen and Heavy sweating.
- First Aid: Apply firm pressure on cramping muscles or gently
massage to relieve spasm. Give
sips of water unless the person complains of nausea, then stop giving
water.
Seek immediate medical attention if cramps last longer than 1 hour.
Heat Exhaustion
- Symptoms: Heavy sweating, Weakness or tiredness, cool, pale, clammy skin; fast, weak pulse, muscle cramps, dizziness, nausea or vomiting, headache, fainting,
- First Aid: Move person to a cooler environment, preferably a
well air conditioned room. Loosen clothing. Apply cool, wet cloths or have
person sit in a cool bath. Offer sips of water. If person vomits more than
once,
Seek immediate medical attention if the person vomits, symptoms worsen or last longer than 1 hour
Heat Stroke
- Symptoms: Throbbing headache, confusion, nausea, dizziness, body temperature above 103°F, hot, red, dry or damp skin, rapid and strong pulse, fainting, loss of consciousness.
- First Aid: Call 911 or get the victim to a hospital immediately. Heat stroke is a severe medical emergency. Delay can be fatal. Move the victim to a cooler, preferably air-conditioned, environment. Reduce body temperature with cool cloths or bath. Use fan if heat index temperatures are below the high 90s. A fan can make you hotter at higher temperatures. Do NOT give fluids.
Resources
- NWS Heat Safety Tips and Resources
- NWS Heat Safety Brochure
- NWS Heat Safety (One Pager)
- Vermont Department of Health Hot Weather and Health Impacts
- New York Department of Health - Extreme Heat Advice
- FEMA's Extreme Heat
- CDC Guide to Extreme Heat
- American Red Cross Heat Wave Safety
- Occupational Safety and Health Administration
- National Highway Traffic Safety Administration
Today's Hourly Wind Chill Forecasts
Tomorrow's Hourly Wind Chill Forecasts
Daily Wind Chill Forecasts
Event Total Snowfall - Official NWS Forecast
The map below represents the expected average accumulation. Some
locations will receive less snow, while others will receive more. In addition, the
"Event Total" time range may differ from the time range of the "Expected
Snowfall" on the Probabilistic Snowfall Forecast tab (right), which covers a
72-hour period. Reference the subtitle on the "Event Total" graphic for the
time period covered.
WWUS41 KBTV 220627
WSWBTV

URGENT - WINTER WEATHER MESSAGE
National Weather Service Burlington VT
127 AM EST Sun Feb 22 2026

VTZ011-019>021-222100-
/O.NEW.KBTV.WW.Y.0010.260223T0600Z-260224T0000Z/
Western Rutland-Eastern Rutland-Western Windsor-Eastern Windsor-
Including the cities of Rutland, Fair Haven, Springfield, White
River Junction, Bethel, Ludlow, East Wallingford, and Killington
127 AM EST Sun Feb 22 2026

...WINTER WEATHER ADVISORY IN EFFECT FROM 1 AM TO 7 PM EST MONDAY...

* WHAT...Snow expected. Total snow accumulations between 3 and 5
  inches. Winds gusting as high as 35 mph.

* WHERE...Rutland and Windsor Counties.

* WHEN...From 1 AM to 7 PM EST Monday.

* IMPACTS...Travel could be very difficult. Areas of blowing snow
  could significantly reduce visibility. The hazardous conditions
  could impact the Monday morning and evening commutes.

PRECAUTIONARY/PREPAREDNESS ACTIONS...

Slow down and use caution while traveling. For the latest on road
conditions in Vermont, visit https://newengland511.org and for New
York, visit https://511ny.org.

&&

$$

Kremer
Snow Amount Potential
Experimental - Leave Feedback
The purpose of these experimental probabilistic snowfall products is to provide customers and
partners a range of snowfall possibilities, in complement to existing NWS deterministic snowfall
graphics, to better communicate forecast uncertainties during winter weather events. For more
information visit this project's Product/Service Description Document, and please provide us
your feedback here.
Percent Chance That Snow Amounts Will Be Greater Than...
Hover over thumbnails below to view larger image.
What's
this?
>=0.1"
>=1"
>=2"
>=4"
>=6"
>=8"
>=12"
>=18"
Snowfall Totals by Location
These tables show the snow amount forecast for individual locations.
The tables provide the same information as the maps on this web page, just shown in a
different
way. The "Exceedance" option shows the chance that snowfall will exceed a
certain
threshold. The "Range" option shows the likelihood of snowfall being
within a certain range. All of these values are valid for the same time period as
depicted on
the graphics.
What's
this?
| Location |
Low-End Amount |
Expected Amount |
High-End Amount |
Chance of Seeing More Than | |||||||||
|---|---|---|---|---|---|---|---|---|---|---|---|---|---|
Ice Accumulation Potential
Experimental - Leave Feedback
The purpose of these experimental probabilistic ice accumulation products is to provide
customers and
partners a range of ice accumulation possibilities, in complement to existing NWS deterministic
ice accumulation
graphics, to better communicate forecast uncertainties during winter weather events. For more
information visit this project's Product/Service Description Document, and please provide us
your feedback here.
Percent Chance That Snow Amounts Will Be Greater Than...
Hover over thumbnails below to view larger image.
What's
this?
>=0.01"
>=0.1"
>=0.25"
>=0.5"
>=0.75"
>=1"
>=1.25"
>=1.5"
Ice Accumulation Totals by Location
These tables show the snow amount forecast for individual locations.
The tables provide the same information as the maps on this web page, just shown in a
different
way. The "Exceedance" option shows the chance that ice accumulation will
exceed a
certain
threshold. The "Range" option shows the likelihood of ice accumulation being
within a certain range. All of these values are valid for the same time period as
depicted on
the graphics.
What's
this?
| Location |
Low-End Amount |
Expected Amount |
High-End Amount |
Chance of Seeing More Than | |||||||||
|---|---|---|---|---|---|---|---|---|---|---|---|---|---|
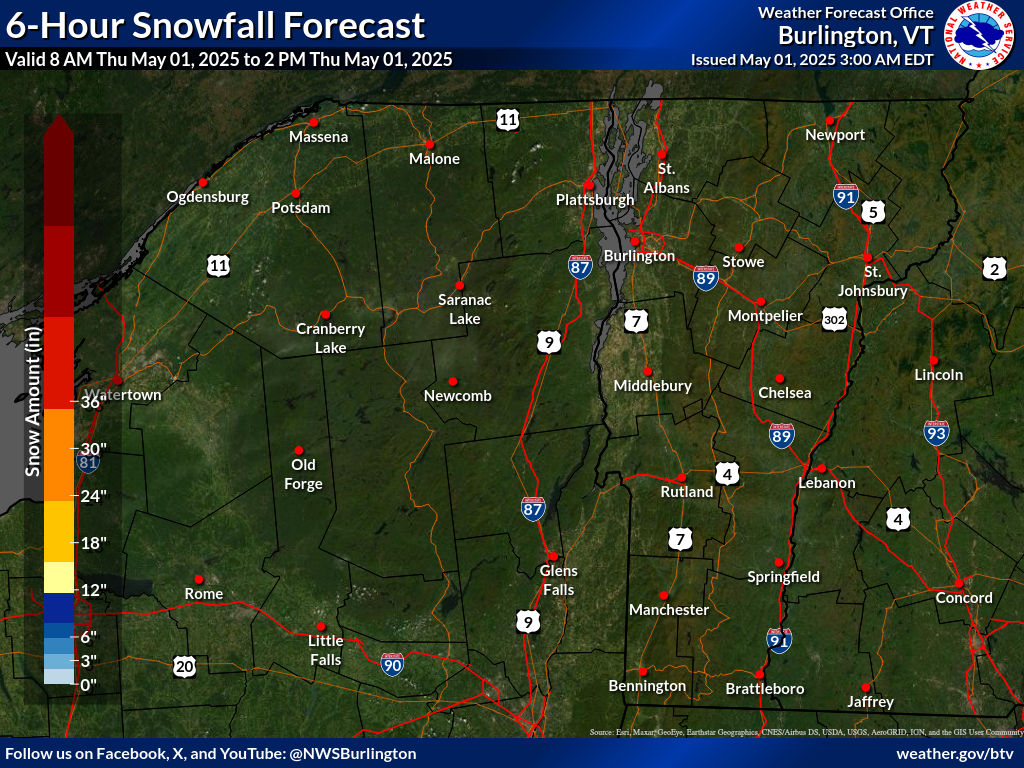
6-Hour Snowfall Forecasts
These maps are official NWS snowfall forecasts in inches for 6-hour times periods as
shown on the graphics. This snowfall amount is determined by NWS forecasters to be the
most likely outcome based on evaluation of data from computer models, satellite, radar,
and other observations.
Hover over thumbnails below to view larger image.


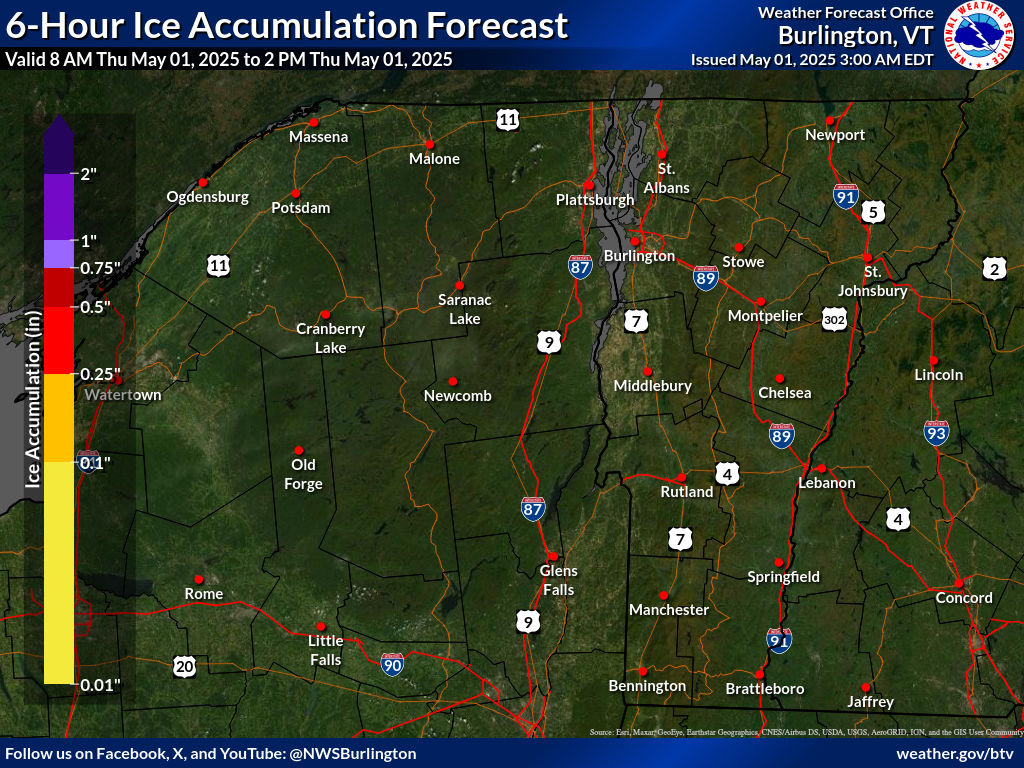
6-Hour Ice Accumulation Forecasts
These maps are official NWS ice accumulation forecasts in inches for 6-hour times
periods as shown on the graphics. This ice accumulation is determined by NWS forecasters
to be the most likely outcome based on evaluation of data from computer models,
satellite, radar, and other observations.
Hover over thumbnails below to view larger image.


Precipitation Onset/End Timing
These maps represent the most likely time of winter precipitation onset and ending
(snow, sleet, freezing rain). Rain is not included here. This information is provided
when we issue a Warning or Advisory for expected snow or ice accumulation; typically six
to 24 hours in advance. Times are only given for places that are under a Warning or
Advisory. They will be blank in areas outside Warnings or Advisories.
Onset of Wintry
Precipitation
End Timing of Wintry
Precipitation
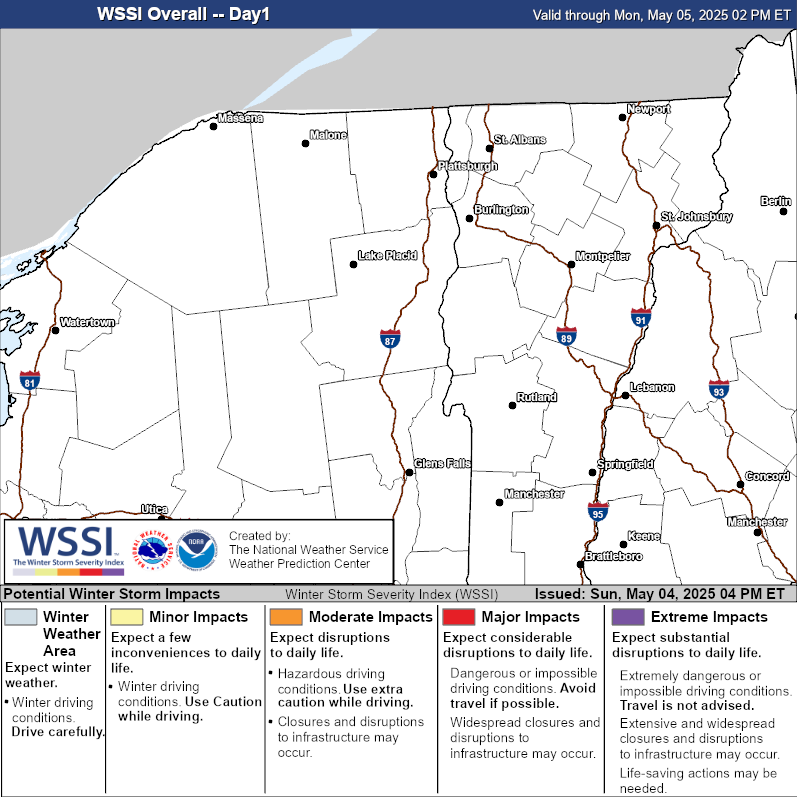
Winter Storm Severity Index
The WSSI is created through the use of Geographic Information Systems (GIS) by screening
the official National Weather Service (NWS) gridded forecasts from the National Digital
Forecast Database (NDFD) for winter weather elements and combining those data with
non-meteorological or static information datasets (e.g., climatology, land-use, urban
areas). This process creates a graphical depiction of anticipated overall impacts to
society due to winter weather. The underlying structure of the WSSI allows it to
potentially use other meteorological datasets as inputs (e.g., deterministic or ensemble
model output) to create additional guidance products that cover periods beyond those
covered by the NDFD. The WSSI provides a classification of the overall expected severity
of winter weather using the following terminology: “Minor,” “Moderate,” “Major,” and
“Extreme.” The “Winter Weather Area” pertains to areas where winter weather conditions
are expected, but are not anticipated to impact daily life.
Days 1-3
Day 1
Day 2
Day 3


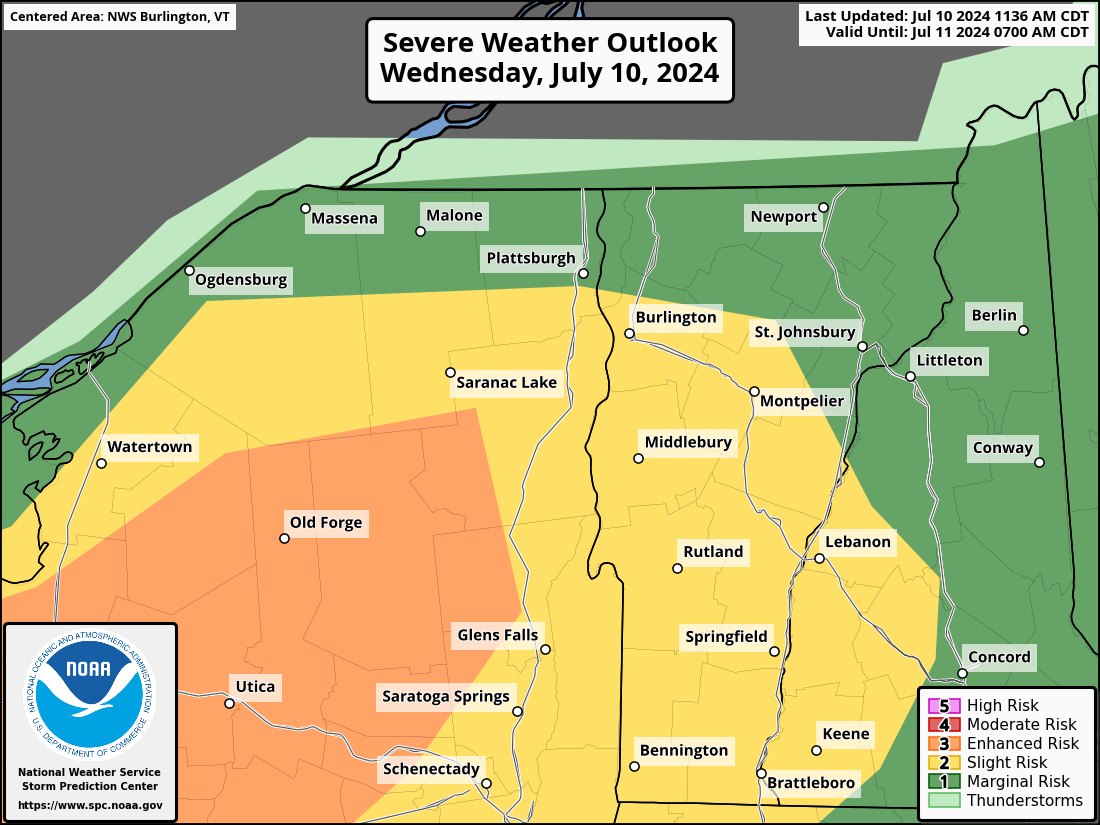
Storm Prediction Center Convective Outlooks
The Storm Prediction Center (SPC) issues Day 1, Day 2, and Day 3 Convective Outlooks
that depict non-severe thunderstorm areas and severe thunderstorm threats across the
contiguous United States, along with a text narrative. The categorical forecast
specifies the level of the overall severe weather threat via numbers (e.g., 5),
descriptive labeling (e.g., HIGH), and colors (e.g., magenta). The probabilistic
forecast directly expresses the best estimate of a severe weather event occurring within
25 miles of a point.
Day 1
Day 2
Day 3


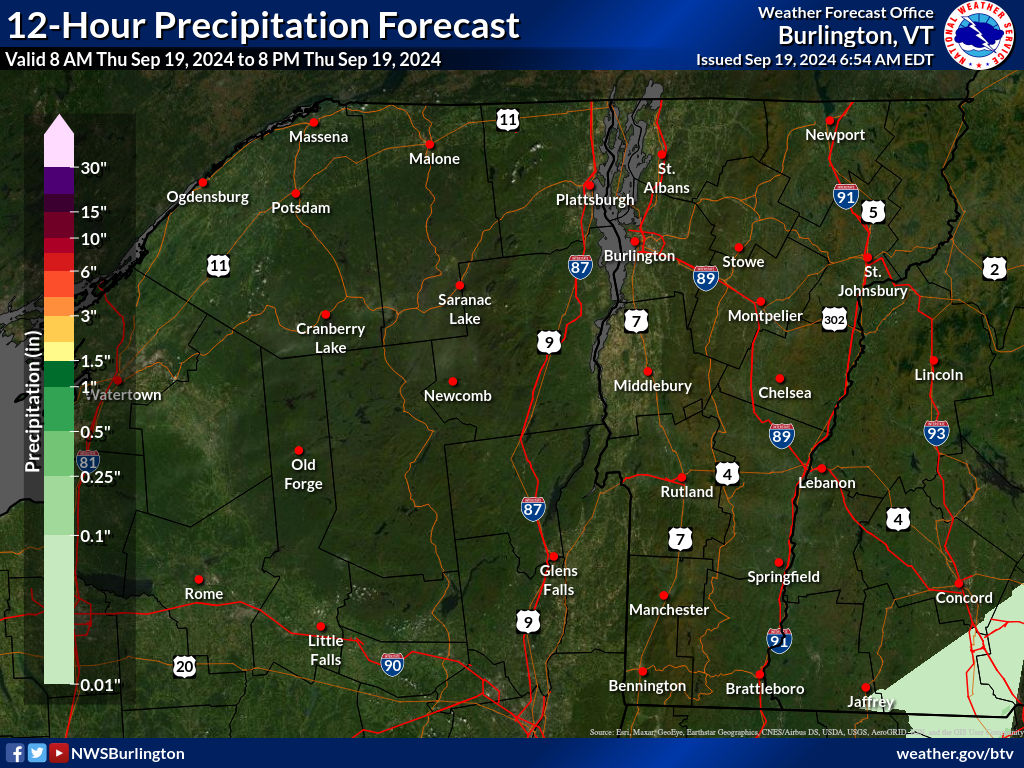
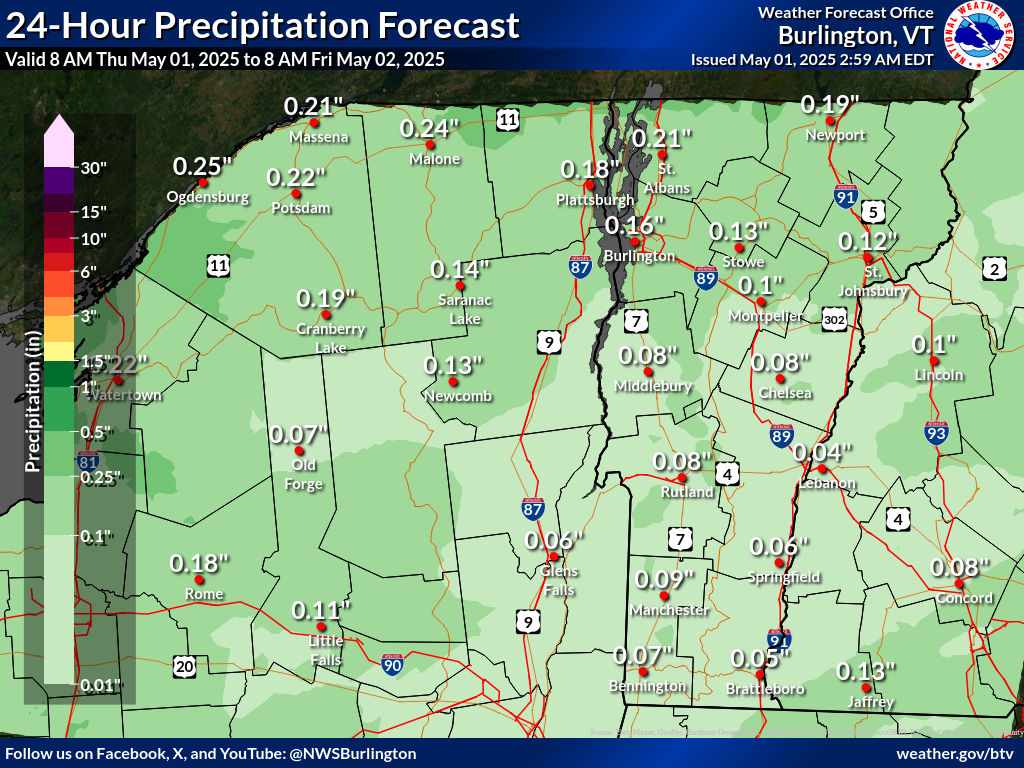
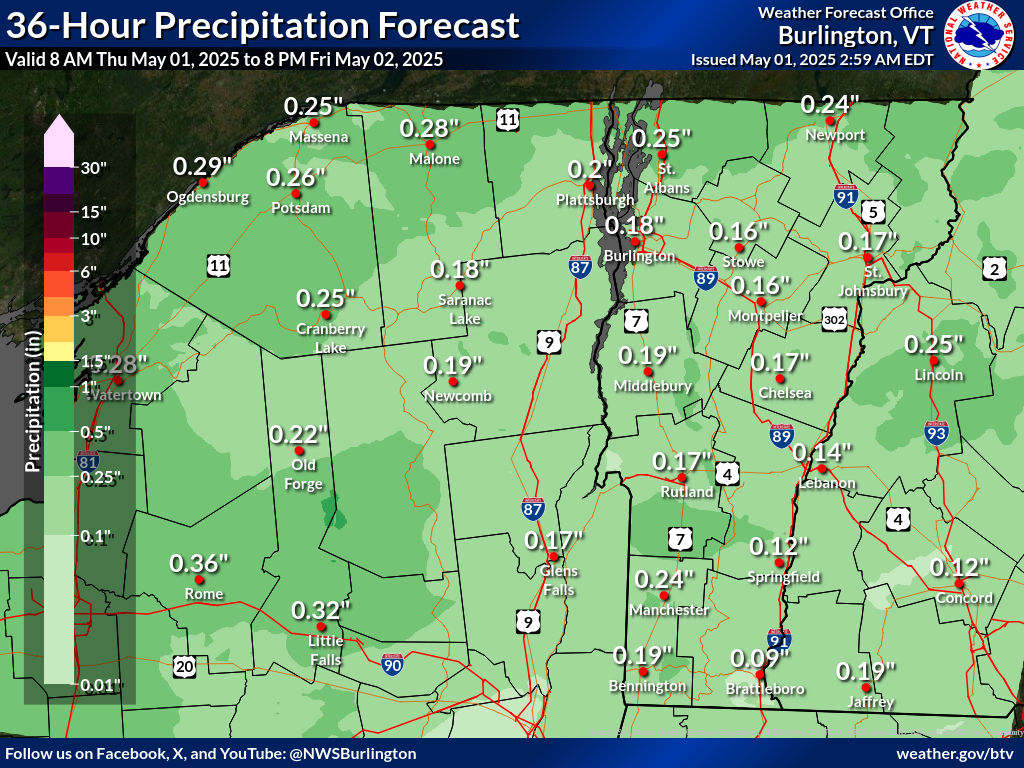
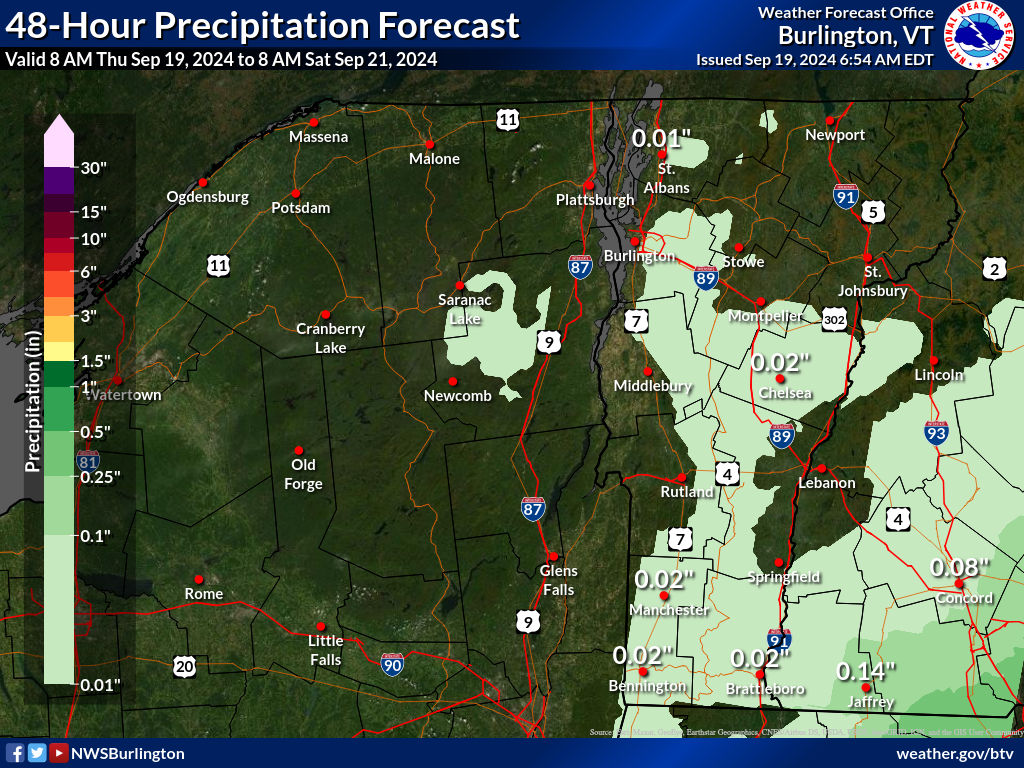
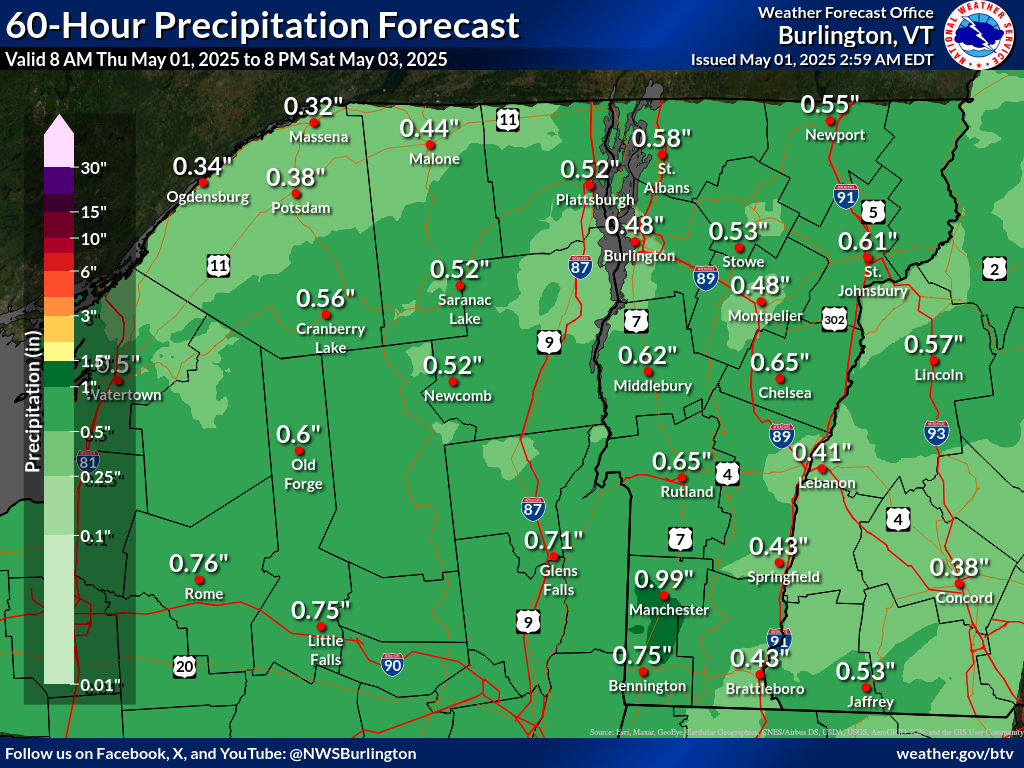
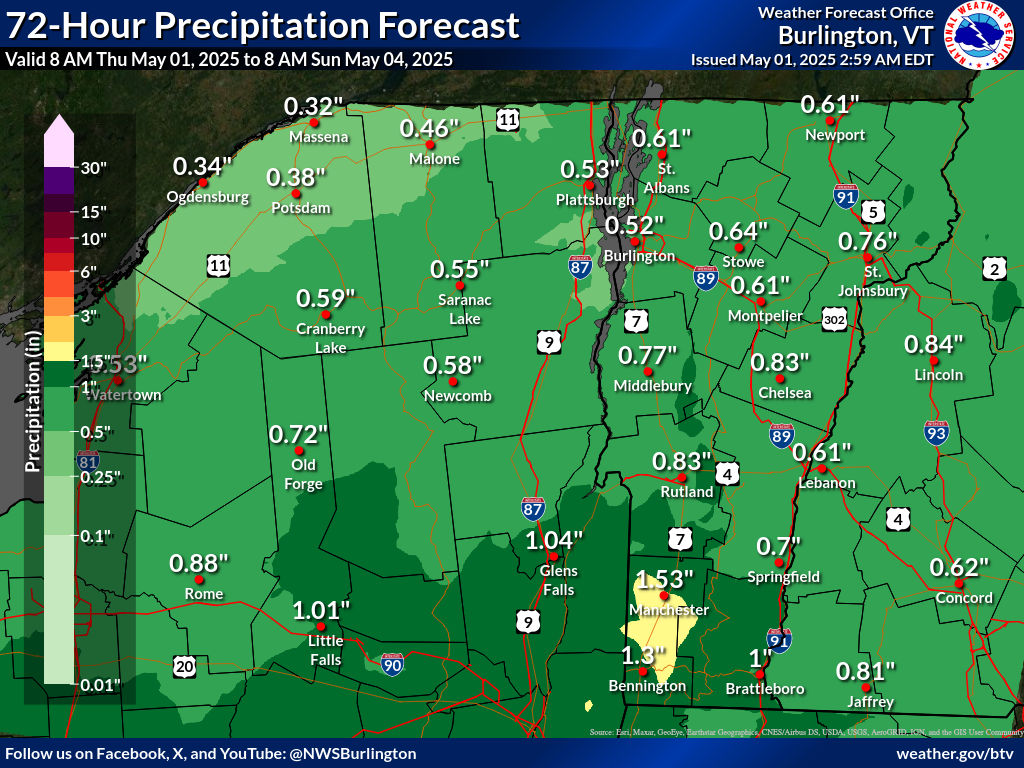
Liquid Precipitation Forecasts
These maps are official NWS liquid precipitation forecasts in inches for the time
periods as shown on the graphics. This liquid precipitation is determined by NWS
forecasters to be the most likely outcome based on evaluation of data from computer
models, satellite, radar, and other observations.
Hover over thumbnails below to view larger image.