Heat expands across the Desert Southwest, Plains, Mississippi Valley and Midwest into Monday. Fire weather concerns continue for portions of the Intermountain West. Active monsoonal moisture fuels thunderstorms over the Southwest with possible flash flooding. Tropical cyclone Fausto in the Pacific, should weaken as it approaches Hawaii; Dangerous surf, swells and rip currents are expected. Read More >
Winter 2012 - 2013
|
|
The 2012-13 winter for Western and North Central New York finished warmer than normal with below normal snowfall. Compared to last year, which was an anomalously warm and snowless winter, this winter will give the impression of finishing closer to normal. The winter began with below normal temperatures in November, though this did not facilitate a snowier than normal month. December and January were similar to the prior winter with both months averaging more than 5 degrees above normal. February through April finished closer to normal temperature-wise, with March siding towards below normal temperatures.
After little snowfall in January, snowfall over the last three months returned closer to normal. Lake effect snow events of 7 inches or more were few this season, as only 6 events were measured. This is 4 events less than normal and 2 less than the previous season, despite the fact that there was less snow last winter. The final 5 events were strong with each dropping at least a foot and a half of snow east of either Lake Erie or Lake Ontario.
With the warmer than normal winter and below normal snowfall, ice jam flooding on area creeks and rivers was very minimal. There were several days of heavy rainfall late in the season that sent a few rivers to flood stage. Lake Erie loosely froze the beginning of February, and returned to open waters at the beginning of April.
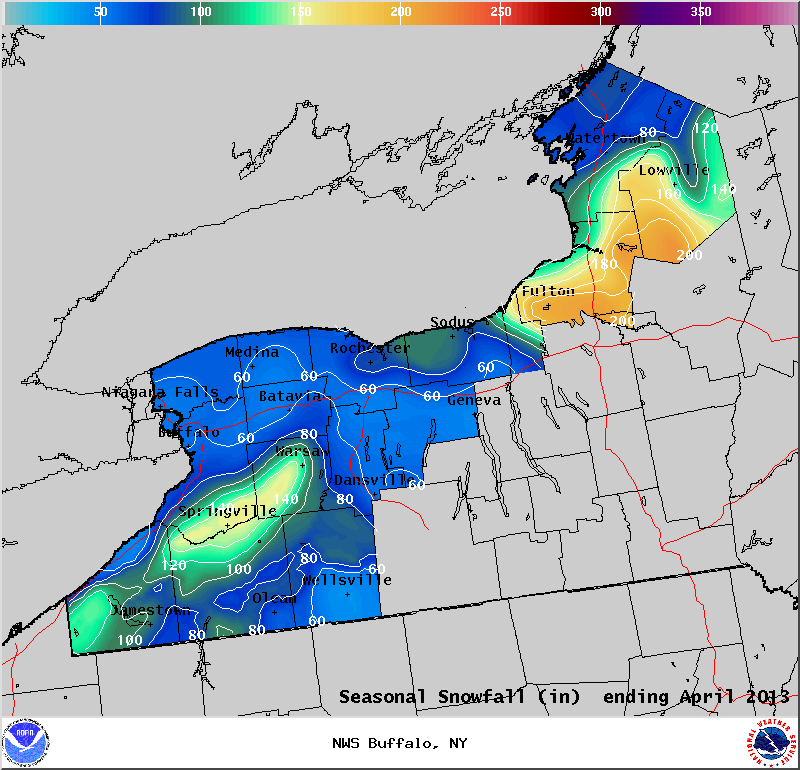
Snowfall
Snowfall this winter was again below normal for Western and North Central New York, though nearly every location received more snow than the previous winter.
The heaviest snowfall was found over northeastern Oswego County and the Tug Hill region where 200+ inches of snow fell, which is also coincidentally where a few of the heavier lake effect events occurred as well. Across western New York, a few higher elevations along the Chautauqua ridge and hills of Wyoming County reached the 160 to 180 inch mark, which is still a couple of feet below normal for these areas.
The upper Genesee Valley area received the least amount of snow. Areas from the Genesee Valley in Livingston County down through western Allegany County generally received between 3 and 4 feet of snow for the entire winter season.
As mentioned earlier only 6 lake effect snow events occurred downwind of Lakes Erie and Ontario this winter season, which ties for the fewest in the past 15 years. The winters of 2001-02 and 2009-10 also had only 6 events. Synoptic events made up the remainder of the snows across the region, and together with the lake effect snows the region still had a below normal snowfall.
Both Buffalo and Rochester, our two primary climate sites, both finished will below normal snowfall for the season. The greatest calendar snowfall was 10.1 inches for both sites of Buffalo and Rochester. However these snowfall maximums occurred in separate events, late December for Buffalo and mid February for Rochester.
Temperatures
November averaged below normal for our three climate sites (Buffalo, Rochester, and Watertown), the first below normal month since April of 2012. Mild weather returned in December with many days averaging above normal. This well above normal trend continued into the middle of January before the first deep winter cold outbreak reached the area. Though it was cold with single digits lows and inland and higher elevation below zero readings, there were no record lows set at any of the three main climate sites with this
cold spell.
Following this cold outbreak, temperatures through February and March averaged close to winter’s normal. Still there were no record lows or record low highs set through the winter months at both Buffalo and Rochester, while Watertown did set a record lows on April 21st and 22nd, with a reading of 22F on both days.
April as a whole averaged near normal, though several cold spells brought winter’s final breaths with several rounds of below normal temperatures.
For the winter months of November through April, both Buffalo and Rochester finished about a degree and a half above normal.
Hemispheric Pattern
While the Winter of 2012-13 was colder and snowier than the previous year, it was still a far cry from a typical winter in the Lower Great Lakes. This was largely due to the very slow start to our winter season as December and much of January were dominated by ridging over the eastern half of the country. The ridge was part of a strong +PNA pattern that included one of the most stubborn west coast troughs in nearly a decade. This long wave pattern promoted a persistent sub-tropical jet that extended northeast from the Equatorial Pacific to the Southern Plains and eventually the Great Lakes. The result was anomalously mild conditions across the Lower Great Lakes that rivaled those from the previous winter when monthly temperatures averaged more than 5 deg F above normal. Naturally, this had a large impact on the amount of lake effect snow that was generated. December and January are typically the two most active months for lake effect snow in our region, and as a result, this time period is when Western and North Central New York picks up the majority of its seasonal snowfall. Very little lake effect snow fell in December through the first half of January, and this led to snowfall departures of nearly 2 feet for the larger metropolitan areas while departures exceeded 3 feet in the lake effect snowbelts south of Buffalo and east of Lake Ontario. All of this started to change during the second half of January when the region experienced a major pattern change. During the last couple weeks of January, a shift in the hemispheric pattern resulted in a coupled +PNA/-NAO pattern where anomalously strong ridging developed over the eastern Pacific while high latitude blocking remained in place over Greenland and the North Atlantic. Climatologically, this pattern correlates very strongly to below normal temperatures, and this was certainly no exception. The corresponding northerly fetch opened the door for a more persistent feed of cold air to pour southwards from the Canadian Arctic which in turn finally set the stage for more typical lake effect snow. In fact, the most impressive lake response of the season occurred at the onset of the pattern change (Jan 20-24) when over 3 feet of snow fell over a large portion of Oswego County and up to 2 feet of snow accumulated across the Chautauqua Ridge. The remainder of winter (late January through March) featured even stronger ridging over Greenland while the sub-tropical jet was firmly locked deep to our south across the Gulf States. This pattern was much more conducive for cold air intrusions over the Great Lakes, and this supported a seasonably cold and snowy second half to winter. The change was not significant enough though to keep our region from experiencing another year of below normal snowfall while average temperatures once again finished at above normal levels. Looking at the winter in its entirety, the most striking difference from the 2011-2012 season was the strength and phase of the North Atlantic Oscillation. The Greenland block was nearly absent last winter, whereas THIS winter it was quite persistent…particularly from mid January through the end of March. Once again, a neutral ENSO over the Equatorial Pacific allowed the NAO to dominate our weather pattern. During years in which moderate to strong ENSO events are in place, the corresponding importance of the NAO is notably diminished.
Winter Statistics for Buffalo and Rochester
Buffalo
Average Temperature November: April: 35.2F (1.5F above normal)
Snowfall: 58.8"; 35.9" below normal (ranked 25th least of 129 years)
Days with 1" or more on ground: 48 (ranked 18th least of 119 years)
Rochester
Average Temperature November: April: 35.4F (1.7F above normal)
Snowfall: 78.1"; 22.2" below normal (ranked 62nd least of 129 years)
Days with 1" or more on ground: 60 (ranked 17th (tie) least of 119 years)
November 2012
November began with a weak surface trough passing across the area with light rainfall. A cool northwesterly flow followed through the first week of the month with snow flurries flying several days. On the 11th, a warm front lifted into the region and ushered in much warmer temperatures, bringing record highs across the region. The warmth did not last long as a strong cold front swept across the area with a band of rain showers. A very quiet and benign weather pattern developed during the middle part of the month and lasted right through Thanksgiving Day with high pressure camped out over the eastern Great Lakes and New England states. Winter returned on the 23rd with a strong cold front crossing New York. This brought about a response from the eastern Great Lakes with a snow band setting up downwind of both Lake Erie and Lake Ontario. Several lighter snowfalls of less than an inch closed the month.
December 2012
Snowfall for December totaled below normal for much of the region. On December 21, the first notable synoptic snow storm this month would hit the area dropping a few inches of snow across the region. This snow came as the result of colder air and moisture wrapping around the back side of a strong low pressure system. Several days later a second, even colder and more significant snow storm hit the area. Snowfall with this storm averaged around a foot across Western New York, with slightly lesser amounts towards eastern areas.
January 2013
January in Western and North Central New York resembled a rollercoaster ride in terms of daily temperatures. The year started off seasonable with some lake effect snow across the region. Then, temperatures warmed dramatically, with highs peaking at 65F on Jan 13. This was followed by an abrupt drop in temperatures with lows dropping into the single digits and below zero by the 25th. The month ended with another strong warm-up, with spring-like days again on the 29th and 30th. Snowfall across the region this month was low, with all areas well below normal.
February 2013
The first 10 days of February saw wintry conditions with several lake effect snow events. The first event was a little unusual in that the greatest snow totals around Buffalo and Watertown actually fell over areas north of both cities. A synoptic low brought general snow across the area Sunday evening the 3rd that then transitioned over to lake effect snow, this time across typical areas south of Buffalo and Watertown. Another upper level synoptic low brought widespread snow to the region on Friday the 8th. Ahead of a cold front temperatures soared into the upper 40s and lower 50s on Monday the 11th, followed by gusty winds of over 50 mph through the evening and overnight hours. Another thaw and gusty wind event came a week later on the 19th, though not as dramatic. The last week of the month a slow moving synoptic low brought heavy rain into the Buffalo metro area on the evening of the 26th, which changed to a mix of light rain and snow to close the month.
March 2013
March for the Eastern Great Lakes region will go down in the record books as a dry and cool month with very few notable weather events. There was one, long lasting lake effect snow event that brought impressive 3-foot snow amounts to the Tug Hill region the third week of the month. Across southern New York a foot and a half of snow fell across the western Southern Tier. While days with measurable precipitation were only a few days below normal, much of the events this month were on the light side. Many areas had one of their driest Marches in many years.
April 2013
After a series of fronts brought fluctuating temperatures, and some snow to the region, the month of April ended on a quiet and warm note as high pressure settled in across the northeastern United States The warmer temperatures also aided in limiting snowfall across the region, with all areas remaining under a half a foot of new snow for the month. The bulk of the snow that fell occurred during the first week of the month.
|
WFO Buffalo 2012 - 2013 |
||||||||||||
| Snowfall | ||||||||||||
| County | ID | Town | OCT | NOV | DEC | JAN | FEB | MAR | APR | TOTAL | ||
| Niagara | ||||||||||||
| C02 | North Tonawanda | 0.5 | 15.9 | 7.8 | 27.1 | 8.0 | 0.0 | 59.3 | ||||
| C10 | Lockport | 0.0 | 15.9 | 7.5 | 20.1 | I | 0.0 | 43.5 | ||||
| C12 | Lockport | 0.0 | 20.0 | 10.4 | 28.7 | 9.7 | 0.0 | 68.8 | ||||
| C17 | Pendleton | 0.0 | 15.6 | 7.0 | 23.8 | 6.6 | 0.0 | 53.0 | ||||
| OP | Youngstown | 0.9 | 14.6 | 9.4 | 28.7 | 8.0 | 0.3 | 61.9 | ||||
| OP | North Tonawanda | 1.2 | 16.5 | 7.4 | 24.4 | 9.8 | 0.4 | 59.7 | ||||
| OP | Niagara Falls | 0.1 | 12.3 | 8.1 | 28.5 | 5.6 | 0.2 | 54.8 | ||||
| Erie | ||||||||||||
| C07 | Williamsville (East) | 2.1 | 20.0 | 6.2 | 19.8 | 5.7 | 0.0 | 53.8 | ||||
| C39 | Hamburg | 1.1 | 16.2 | 16.4 | 15.0 | 7.2 | 0.1 | 56.0 | ||||
| C50 | East Aurora | 1.8 | 21.5 | 10.4 | 18.9 | 19.4 | 1.4 | 73.4 | ||||
| C51 | Clarence Center | 1.5 | 13.4 | 4.1 | 18.4 | 6.0 | 0.0 | 43.4 | ||||
| C53 | West Seneca | 7.3 | 19.1 | 7.5 | 13.0 | 7.7 | 0.3 | 54.9 | ||||
| C57 | Kenmore | 0.9 | 17.6 | 5.7 | 18.1 | 4.2 | 0.0 | 46.5 | ||||
| C59 | Kenmore | 1.0 | 19.2 | 5.1 | 21.7 | 6.8 | 0.0 | 53.8 | ||||
| C60 | Blasdell | 4.5 | 15.3 | 12.2 | 14.5 | 7.5 | 0.7 | 54.7 | ||||
| C63 | Glenwood | 5.2 | 22.4 | 32.2 | 36.3 | 36.7 | 3.1 | 135.9 | ||||
| C65 | Boston | 4.8 | 21.4 | 28.8 | 29.8 | 25.1 | 1.5 | 111.4 | ||||
| C66 | East Aurora | 2.0 | 25.5 | 12.5 | 26.5 | 26.5 | 0.7 | 93.7 | ||||
| C70 | Alden-Millgrove | 3.2 | 18.6 | 8.4 | 26.9 | 16.0 | 73.1 | |||||
| C72 | Tonawanda | 0.3 | 10.0 | 4.0 | 11.5 | 2.2 | 0.0 | 28.0 | ||||
| C75 | Elma Center | 2.3 | 19.8 | 8.2 | 14.9 | 13.0 | 0.4 | 58.6 | ||||
| C77 | Holland | 5.2 | 26.4 | 28.1 | 33.5 | 37.8 | 4.0 | 135.0 | ||||
| C83 | Williamsville | 1.8 | 17.5 | 5.4 | 22.7 | 8.3 | 0.0 | 55.7 | ||||
| C94 | Orchard Park | 4.3 | 18.5 | 4.2 | 20.5 | 17.3 | 1.8 | 66.6 | ||||
| C95 | Buffalo | 0.5 | 11.4 | 4.3 | 10.5 | 6.3 | 0.0 | 33.0 | ||||
| C96 | Elma | 4.6 | 21.6 | 9.1 | 17.7 | 23.1 | 1.5 | 77.6 | ||||
| OP | Cheektowaga - KBUF | 2.4 | 19.6 | 6.2 | 20.5 | 9.8 | 0.3 | 58.8 | ||||
| OP | Coldon | 5.5 | 24.9 | 28.4 | 40.1 | 33.6 | 3.3 | 135.8 | ||||
| OP | Springville | 10.7 | 19.5 | 25.0 | 60.5 | 45.5 | T | 161.2 | ||||
| OP | Wales | 2.5 | 25.0 | 20.6 | 23.7 | 23.9 | 1.8 | 97.5 | ||||
| Orleans | ||||||||||||
| OP | Albion | T | 13.0 | 12.5 | 27.0 | 6.0 | T | 58.5 | ||||
| OP | Lyndonville | T | 14.2 | 17.9 | 30.6 | 7.3 | T | 70.0 | ||||
| Genesee | ||||||||||||
| OP | Batavia | T | 22.5 | 8.0 | 11.0 | 7.0 | T | 48.5 | ||||
| C06 | Stafford | 0.4 | 22.2 | 6.3 | 22.3 | 13.8 | 0.7 | 65.7 | ||||
| OP | Pavilion | 0.7 | 19.2 | I | 11.6 | I | 0.7 | 32.2 | ||||
| Wyoming | ||||||||||||
| OP | Perry | 1.0 | 18.5 | 16.5 | 18.0 | 13.2 | 67.2 | |||||
| OP | Portageville | 1.2 | 21.0 | 6.7 | 22.1 | 10.2 | 1.1 | 62.3 | ||||
| OP | Warsaw | 5.0 | 17.8 | 25.3 | 52.8 | 36.6 | 4.8 | 142.3 | ||||
| OP | Bennington | 2.8 | 21.4 | 11.5 | 24.3 | 26.3 | 2.3 | 88.6 | ||||
| OP | Silver Springs | 1.1 | 25.8 | 15.6 | 26.7 | 18.6 | 2.9 | 90.7 | ||||
| Chautauqua | ||||||||||||
| C06 | Forestville | 4.0 | 21.5 | 27.0 | 24.5 | 12.0 | 0.0 | 89.0 | ||||
| C09 | Dunkirk | 0.7 | 11.0 | 17.0 | 15.1 | 2.5 | 0.0 | 46.3 | ||||
| C19 | Ripley | 0.6 | 21.1 | 39.1 | 34.3 | 38.0 | 0.8 | 133.9 | ||||
| OP | Dunkirk | 0.7 | 11.0 | 16.1 | 16.0 | 2.5 | T | 46.3 | ||||
| OP | Portland | T | 13.0 | 21.5 | 19.5 | 14.0 | 0.0 | 68.0 | ||||
| OP | Jamestown | 2.2 | 29.9 | 21.0 | 23.3 | 22.8 | 0.8 | 100.0 | ||||
| Cattaraugus | ||||||||||||
| C02 | Randolph | 7.0 | 25.0 | 24.5 | 23.5 | 19.0 | 1.5 | 100.5 | ||||
| C05 | Portville | 0.5 | 6.3 | 12.2 | 8.2 | 5.1 | 0.0 | 32.3 | ||||
| C06 | Olean | 4.4 | 24.3 | 11.7 | 7.9 | 19.1 | 0.9 | 68.3 | ||||
| C11 | Allegany | 6.1 | 34.1 | 18.7 | 28.6 | 28.0 | 1.8 | 117.3 | ||||
| C15 | West Valley | 4.4 | 20.0 | 33.5 | 32.0 | 41.0 | 4.0 | 134.9 | ||||
| C21 | Little Valley | 0.5 | 21.7 | 19.0 | 15.0 | 16.9 | 1.6 | 74.7 | ||||
| OP | Allegheny Park | 7.0 | 18.0 | 7.0 | 15.5 | 19.0 | T | 66.5 | ||||
| OP | Franklinville | 3.5 | 28.0 | 16.0 | 25.8 | 28.5 | 3.0 | 104.8 | ||||
| OP | Little Valley | 5.0 | 29.0 | 19.5 | 32.5 | 25.0 | 111.0 | |||||
| OP | New Albion | 4.6 | 17.5 | 17.3 | 26.5 | 18.3 | 0.6 | 84.8 | ||||
| OP | Olean | 3.6 | 23.8 | 10.9 | 11.2 | 11.8 | 1.5 | 62.8 | ||||
| OP | Perrysburg | 5.5 | 29.0 | 37.9 | 67.5 | 41.7 | 1.5 | 183.1 | ||||
| Allegany | ||||||||||||
| C02 | West Almond | 3.6 | 25.2 | 21.0 | 21.9 | 16.0 | 1.9 | 89.6 | ||||
| OP | Alfred | 3.3 | 22.1 | 10.1 | 16.5 | 14.3 | 0.7 | 67.0 | ||||
| OP | Angelica | 1.6 | 17.3 | 9.4 | 9.6 | 7.2 | 1.0 | 46.1 | ||||
| OP | Rushford | 5.8 | 24.7 | 18.3 | 29.2 | 15.5 | 1.8 | 95.3 | ||||
| OP | Wellsville | 1.0 | 18.0 | 5.1 | 9.7 | 7.7 | 2.0 | 43.5 | ||||
| OP | Whitesville | 1.2 | 20.0 | 7.3 | 10.3 | 9.9 | 1.6 | 50.3 | ||||
| Livingston | ||||||||||||
| C01 | Dansville | 2.3 | 23.2 | 9.0 | 23.8 | 10.8 | 0.0 | 69.1 | ||||
| C05 | Dansville | 0.4 | 20.9 | 9.9 | 14.5 | 5.5 | 0.0 | 51.2 | ||||
| OP | Avon | T | 18.5 | 4.4 | 9.8 | 4.4 | 1.7 | 38.8 | ||||
| OP | Dansville | 0.0 | 18.6 | 3.6 | 4.0 | 0.5 | T | 26.7 | ||||
| OP | Mount Morris | T | 9.7 | 4.0 | 13.5 | 3.7 | 0.0 | 30.9 | ||||
| Ontario | ||||||||||||
| OP | Honeoye Lake | T | 23.0 | 3.8 | 14.4 | 5.7 | 1.0 | 47.9 | ||||
| OP | Geneva | T | 20.7 | 5.9 | 15.1 | 3.7 | 0.1 | 45.5 | ||||
| Monroe | ||||||||||||
| C12 | North Chili | 0.5 | 19.5 | 5.4 | 19.9 | 5.2 | 1.0 | 51.5 | ||||
| C15 | Brockport | 1.0 | 17.2 | 10.1 | 24.3 | 5.4 | 0.0 | 58.0 | ||||
| C23 | Greece | 0.5 | 23.0 | 13.1 | 24.8 | 6.7 | 0.9 | 69.0 | ||||
| C28 | Webster (NE) | 1.2 | 24.6 | 18.5 | 17.2 | 9.0 | 0.0 | 70.5 | ||||
| C29 | Brockport | 1.0 | 23.9 | I | I | 8.0 | 0.0 | 32.9 | ||||
| OP | KROC | 0.8 | 22.6 | 11.7 | 28.8 | 11.9 | 2.3 | 78.1 | ||||
| OP | Webster | 1.3 | 24.4 | 18.1 | 27.1 | 8.7 | 1.3 | 80.9 | ||||
| Wayne | ||||||||||||
| C06 | Palmyra | 0.3 | 27.3 | 10.7 | 26.0 | 7.3 | 1.3 | 72.9 | ||||
| C10 | Walworth | 1.3 | 32.2 | 14.6 | 29.6 | 15.5 | 2.3 | 95.5 | ||||
| OP | Newark | 0.5 | 20.5 | 5.0 | 19.0 | 14.2 | 0.6 | 59.8 | ||||
| Oswego | ||||||||||||
| C01 | Lacona | 16.3 | 25.2 | 41.6 | 39.5 | 26.6 | 0.0 | 149.2 | ||||
| C03 | Scriba | 8.7 | 35.6 | 35.7 | 16.3 | 17.9 | 0.0 | 114.2 | ||||
| C13 | Redfield | 22.5 | 44.0 | 45.0 | I | 67.0 | 0.0 | 178.5 | ||||
| C15 | Minetto | 7.2 | 34.6 | 40.6 | 42.0 | 16.6 | 0.9 | 141.9 | ||||
| OP | Palermo | 9.2 | 34.8 | 44.5 | 63.8 | 19.8 | 1.8 | 173.9 | ||||
| C20 | Fulton | 16.3 | 45.3 | 56.2 | 69.8 | 19.3 | 3.0 | 209.9 | ||||
| C26 | Mexico | 8.8 | 34.9 | 31.0 | 42.2 | 17.9 | 0.2 | 135.0 | ||||
| OP | Bennetts Bridge | 21.0 | 26.0 | 53.0 | 71.0 | 44.0 | 0.0 | 215.0 | ||||
| OP | Fulton | 9.9 | 36.5 | 51.1 | 82.9 | 23.5 | 3.6 | 207.5 | ||||
| Lewis | ||||||||||||
| C02 | Harrisville | 2.7 | 17.3 | 11.9 | 25.3 | 10.9 | 0.0 | 68.1 | ||||
| C03 | Constableville | 19.0 | 45.5 | 24.7 | 61.2 | 41.7 | 4.7 | 196.8 | ||||
| C04 | Copenhagen | 15.0 | 48.4 | 29.0 | 46.7 | 41.1 | 4.3 | 184.5 | ||||
| OP | Copenhagen | 6.0 | 51.9 | 25.2 | 46.0 | 50.0 | 5.0 | 184.1 | ||||
| OP | Highmarket | 13.8 | 38.1 | 41.3 | 68.5 | 44.4 | 5.5 | 211.6 | ||||
| OP | Hooker | 16.3 | 48.7 | 29.5 | 50.5 | 42.0 | 4.3 | 191.3 | ||||
| OP | Lowville | 8.9 | 30.2 | 13.5 | 42.4 | 34.3 | 2.0 | 131.3 | ||||
| Jefferson | ||||||||||||
| C07 | Theresa | 3.1 | 22.5 | 8.9 | 29.3 | 9.0 | 0.0 | 72.8 | ||||
| OP | Black River | 0.3 | 21.6 | 11.5 | 15.5 | 8.1 | 0.0 | 57.0 | ||||
| OP | Watertown | 2.0 | 31.0 | 11.5 | 27.3 | 9.1 | T | 80.9 | ||||
| Nearby Cities | ||||||||||||
| Albany | 0.1 | 13.3 | 6.2 | 11.1 | 19.5 | 1.2 | 51.4 | |||||
| Syracuse | 2.8 | 32.4 | 11.6 | 36.4 | 20.2 | 12.0 | 115.4 | |||||
| Binghamton | 4.6 | 20.4 | 9.2 | 19.6 | 14.4 | 0.9 | 69.1 | |||||
| Erie | 3.1 | 20.4 | 29.0 | 26.7 | 25.2 | 1.0 | 105.4 | |||||
| Cleveland | 0.3 | 15.2 | 5.4 | 19.8 | 10.7 | 0.3 | 51.7 | |||||
| New York City (Park) | 4.7 | 0.4 | 1.5 | 12.2 | 7.3 | 0.0 | 26.1 | |||||