Dangerous, record-breaking heat will intensify across most of the central and eastern U.S this week. Heat indices will likely exceed 100 degrees. Severe thunderstorms are forecast from parts of the central High Plains into the Upper Midwest, and across parts of the Northeast. Critical fire weather conditions will continue across portions of the Four Corners and Great Basin. Read More >
Winter 2013 - 2014
|
|
The winter of 2013-14 finished as one of the coldest winters in recent memory for New York State. Snowfall across Western and North Central New York was above normal for many areas, and in some locations well above normal. This winter comes on the heels of two previous mild winters, making the cold and snow this winter feel that much harsher.
Temperatures this winter finished below normal every month, and the January through March timeframe finished at least 4 degrees below normal for the two primary climate stations of Western New York (Buffalo and Rochester). The greatest monthly departure from normal this winter came in March. Only in April, where we the big transition from winter to spring did a month finish just shy of normal.
Snowfall was bountiful throughout the winter, both in lake effect snow events and synoptic storm systems. There were two blizzards this winter, the first a lake effect event that brought blizzard conditions near Lake Erie. A second blizzard came later in the season, with widespread blizzard conditions south of Lake Ontario from a synoptic system. Lake effect events were plentiful as well this winter. There were 15 lake effect snow events this winter season, which is about 4 more than normal. A mean upper level trough through the winter across the Western Great Lakes a favorable southwest flow brought above normal lake effect snow to areas across the northern Niagara Frontier, and northern Jefferson County. It is these regions that saw the greatest above normal snowfall this winter season.
The bitterly cold temperatures brought plentiful ice coverage to both the rivers and lakes this winter. Ice on the rivers led to ice jam flooding during mild and wet spells over the winter, and ice coverage on both Lakes Erie and Ontario was some of the greatest all-time. On Lake Erie ice formed on the eastern lake surface January 4th, about 2 weeks before normal, and solidly remained through the beginning of May. This May 3rd ice out date is about two and a half weeks later than normal, and the latest ice out date since May 3rd of 1996.
The combination of ample snowfall and thick ice cover on area rivers brought three significant river flooding events across the region. In December snowmelt along with rainfall brought several creeks and rivers across Western New York into minor to moderate flood stage. Ice jam flooding in January brought several creeks and rivers again into flood south of Lake Ontario. In April the above normal snow cover across the Tug Hill region combined with rain and a rapid warm-up to bring rivers into flood stage across the Eastern Lake Ontario region, including the Black River which crested just below major flood stage in Jefferson County.
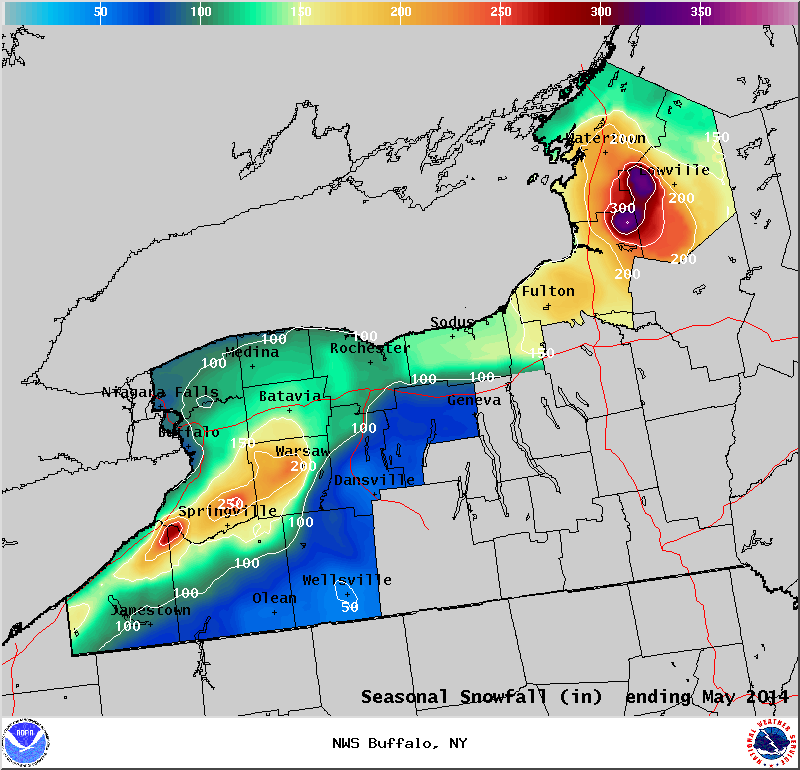
Snowfall
Snowfall this winter season sharply contrasted the two previous winters, with above normal snowfall found throughout the Eastern Great Lakes region. Snow was plentiful through the entire winter with lake effect events evenly spread throughout the winter. These lake effect events brought above normal snowfall to the east and northeast of the lakes, including such large cities as Buffalo and Watertown. Only across the inland Southern Tier and upper Genesee Valley did snowfall average below normal. These areas tended to miss out on the large lake effect snow events. The greatest snow totals were found across the Tug Hill with 325-350 inches of snow measured in locations such as Redfield and Hooker, NY. To the east of Lake Erie the greatest snowfall totals were found across the hill tops of the Chautauqua ridge where locations such as Perrysburg, NY measured around 300 inches. There were two blizzards this season. The first occurred January 6th through the morning hours of January 8th. This blizzard brought Buffalo its first blizzard since March of 1993. Blizzard conditions within a band of lake effect snow impacted Erie County and inland across Genesee and Wyoming counties. The second blizzard occurred March 12th and blitzed counties south of Lake Ontario with strong northeast winds and heavy snow.
Winter Statistics for Buffalo and Rochester
Buffalo
Average Temperature November – April: 29.7F (4.0F below normal)
Snowfall: 129.9” 35.2” above normal (ranked 7th greatest of 130 years)
Days with 1” or more on ground: 84 (ranked 33rd (tie) greatest of 120 years)
Rochester
Average Temperature November – April: 30.3F (3.4F below normal)
Snowfall: 112.7” 13.2” above normal (ranked 22nd snowiest of 130 years)
Days with 1” or more on ground: 88 (ranked 27th greatest of 120 years)
Temperatures
A mean ridge of high pressure over western North America, and a deep trough of low pressure over central and eastern North America brought numerous bouts of cold airmasses across the Great Lakes region. Mild spells through the winter were few in number, and cold airmasses brought new daily extremes across Western and North Central New York State. The November through March time frame across the Great Lakes region was one of the coldest in recent memory.
In Buffalo, the November through March 5-month timeframe finished with an average temperature of 26.4 degrees Fahrenheit. This is the 8th coldest alltime and coldest since records were moved to the airport in the summer of 1943. This same 5-month timeframe was 6.5F degrees colder than last year, and 11.9F degrees colder than 2 years ago.
In Rochester, the November to March 5-month timeframe was 27.1 degrees Fahrenheit. This is tied for 13th coldest alltime, and coldest since the winter of 1993-94 which finished at 27.0F degrees. This same 5-month timeframe was 6.1 degrees colder than last year, and 11.0 degrees colder than the winter 2 years prior.
In Watertown, the 5-month timeframe was tied with 2003-04 for 4th coldest. The average temperature of 23.1 degrees Fahrenheit these past 5 months was only 1.1 degrees warmer than the all-time coldest 5-month stretch (1977-78 at 22.0F).
Temperature Records
There were several daily temperature records set or tied this winter season. The table below lists new temperature records set at Buffalo, Rochester and Watertown in the November through April timeframe.
Buffalo
|
Type |
Date |
New Record (F) |
Old Date |
Old Record (F) |
|
Low Maximum |
January 7th |
9 |
January 7th, 1942 |
9 |
|
Low Minimum |
January 7th |
-5 |
January 7th, 1942 |
-5 |
|
Low Maximum |
January 22nd |
7 |
January 22nd, 1888 |
8 |
|
Low Minimum |
March 4th |
-3 |
March 4th, 1943 |
-3 |
Rochester
|
Type |
Date |
New Record (F) |
Old Date |
Old Record (F) |
|
Low Minimum |
November 13th |
17 |
November 13th, 1986 |
18 |
|
Low Maximum |
November 24th |
24 |
November 24th, 1917 |
24 |
|
Low Minimum |
December 17th |
-4 |
December 17th, 1919 |
-3 |
|
Low Maximum |
January 3rd |
8 |
January 3rd, 1981 |
8 |
|
Low Minimum |
January 3rd |
-6 |
January 3rd, 1981 |
-4 |
|
Low Maximum |
January 7th |
5 |
January 7th, 1886 |
8 |
|
Low Minimum |
March 6th |
-9 |
March 6th, 1948 |
-3 |
Watertown
|
Type |
Date |
New Record (F) |
Old Date |
Old Record (F) |
|
Warm Minimum |
November 6th |
49 |
November 6th, 1977 |
47 |
|
Low Maximum |
November 12th |
32 |
November 12th, 1990 |
32 |
|
Warm Minimum |
November 17th |
53 |
November 17th, 1987 |
51 |
|
Low Minimum |
November 25th |
7 |
November 25th, 1995 |
9 |
|
Low Maximum |
November 28th |
27 |
November 28th, 1974 |
27 |
|
Low Minimum |
November 30th |
1 |
November 30th, 1958 |
3 |
|
Warm Maximum |
December 5th |
60 |
December 5th 1982 |
57 |
|
Low Minimum |
December 17th |
-22 |
December 17th, 1963 |
-16 |
|
Low Maximum |
January 2nd |
-2 |
January 2nd, 1957 |
10 |
|
Warm Minimum |
January 11th |
39 |
January 11th, 1975 |
37 |
|
Low Minimum |
January 20th |
-21 |
January 20th, 2009 |
-18 |
|
Low Minimum |
January 21st |
-33 |
January 21st, 2009 |
-26 |
|
Low Maximum |
January 22nd |
-1 |
January 22nd, 2005 |
-1 |
|
Low Minimum |
January 22nd |
-37 |
January 22nd, 1970 |
-32 |
|
Low Minimum |
January 24th |
-30 |
January 24th, 2011 |
-30 |
|
Low Minimum |
February 12th |
-27 |
February 12th, 1979 |
-25 |
|
Low Minimum |
March 3rd |
-19 |
March 3rd, 1950 |
-15 |
|
Low Minimum |
March 5th |
-15 |
March 5th, 2005 |
-2 |
|
Low Minimum |
March 6th |
-21 |
March 5th 2003 |
-9 |
|
Low Maximum |
March 26th |
27 |
March 26th 1972 |
27 |
|
Warm Maximum |
April 13th |
79 |
April 13th, 1968 |
79 |
|
Low Maximum |
April 16th |
34 |
April 16th, 2007 |
39 |
|
Low Minimum |
April 16th |
22 |
April 16th, 1995 |
25 |
Hemispheric Pattern
The winter of 2013-14 was one of the coldest and snowiest in decades across Western and North Central New York. For the first time since the winters of 1995-96 and 2002-03, temperatures for all five of the winter months (Nov thru March) averaged below normal. In fact, these departures generally became more significant as the winter progressed. Not even the notorious winters of the mid and late 70s exhibited such consistency with the cold air. Dealing with the frigid conditions was made even more difficult by the fact that the two previous winters were unusually mild, particularly the winter of 2011-12 when temperatures averaged more than 5 degrees Fahrenheit above normal for each winter month.
As we progressed through the Autumn of 2013, there was some suspicion that the upcoming winter would be more challenging than the past few years. Sea surface temperatures across the Equatorial Pacific averaged close to normal, verifying a forecast of a neutral ENSO event. Historically, the stronger an ENSO event, whether it is an El Nino or La Nina, the greater the potential for relatively mild winter temperatures in the Great Lakes Region. Our coldest winters have typically occurred during neutral ENSO events when our weather is more susceptible to the influences of high latitude blocking. This can occur from persistent ridging over Greenland (-NAO characteristic), or similar blocking along the West Coast of North America. The latter is often defined as a positive PNA pattern and was certainly the most dominant weather player across North America during the winter of 2013-14.
Ridging became established along the West Coast of North America during the second half of autumn, with anomalously strong high pressure in the mid levels of the atmosphere being observed across the Bering. This led to a broad downstream trough across much of North America, and in particular, across Eastern Canada and the Great Lakes region. While this pattern supported below normal temperatures and respectable snowfall (averaging close to a foot) across Western and North Central New York during the month of November, we were unable to generate our first significant lake effect snow storm. That would have to wait until December, when the weather became quite active over our region.
The high latitude blocking over North America became exaggerated during the month of December when the West Coast ridge strengthened and extended across the Arctic Circle to Eastern Siberia. This in turn deepened the longwave trough over the eastern half of North America…which encouraged the now infamous Polar Vortex to drift southward…away from its normal residency within the Arctic Circle. This mid level feature would end up spending much of the remainder of the winter in the vicinity of Hudson Bay and Northern Ontario.
Unlike most winters when there would be two main cores of frigid air, one on each side of the Pole, the earlier described pattern lent itself to the heart of the arctic air being concentrated over the high latitudes of Canada where it could be easily directed southwards into the lower 48. The resulting thermal contrast between this airmass and the one over the southern United States likely contributed to an unusually strong upper level exit jet off the Mid Atlantic Coast…one that would have a direct impact on helping to generate near record precipitation across Great Britain.
For our forecast area, the amplified trough-ridge pattern over North America would keep our average temperatures below normal during the month of December while the lake effect machine over the Lower Great Lakes would be put into high gear. Given the ideal conditions, a half dozen lake effect snowstorms were spawned during the month, including a long duration event that resulted in nearly four feet of snow falling over the Tug Hill Plateau.
The hemispheric pattern changed very little during the month of January, as a strong persistent ridge remained in place along the West Coast of North America with positive height anomalies stretching from one side of the pole to the other. The lone difference was the development of an arctic cold core over Siberia, but this would be short lived. In any case, the polar vortex centered near Hudson Bay supported frequent intrusions of very cold air that continued to make their way south of the Canadian border. This supported near record lake effect snowfall downwind of many of the Great Lakes. One storm in particular produced five feet of snow over the northern portions of the Tug Hill.
It is interesting to note that while the Great Lakes Region was experiencing the bitter grips of a persistent Arctic airmass, the high latitude blocking pattern was producing record warmth upstream over Alaska. This is a common teleconnection, and in hindsight, is one that should not come as a surprise. Temperatures in our 49th state averaged 15 to 20 deg F above normal in January. Those are phenomenal departures for monthly averages! Since 1950, our forecast area has never experienced such positive monthly temperature departures. The closest we came was in January of 2006 when the mercury was just over 10 deg F above normal.
The highly amplified pattern broke down somewhat during the month of February, although the much publicized polar vortex remained in place over Hudson Bay. Given the extensive snow cover over much of Canada and the Great Lakes region that came as a result of the persistent high latitude blocking, the core of the arctic airmass was likely self-sustained with frigid air being manufactured in place rather than being reinforced from the pole, which was actually experiencing higher than normal temperatures. This kept mercury levels well below normal across Western and North Central New York with relentless lake snows, despite the record ice coverage across all of the Great Lakes.
Deamplification of the overlying steering flow continued during the final winter month of March although the polar vortex remained in the vicinity of Hudson Bay. This kept anomalously cold air in place over Eastern Canada and the Great Lakes Region, and resulted in the greatest negative temperature departures for our forecast area for the entire winter. Mercury readings averaged more than 7 degrees below normal in Buffalo with slightly less impressive deviation in Rochester and Watertown.
Looking at the winter of 2013-14 as a whole, the controlling upper level pattern was very similar to that from the winter of 1976-77. To begin with, both years featured a weak or neutral ENSO event over the Equatorial Pacific. They also shared a highly amplified positive PNA pattern with a West Coast ridge extending across the North Pole to Siberia…effectively displacing the polar vortex southwards to Northern Ontario and Hudson Bay. The proximity of the underlying arctic air made it easy for frequent intrusions of frigid air across the Great Lakes Region. In effect, the presence of a well established ENSO event would have very likely prevented the latter hemispheric pattern from developing.
Monthly Highlights
November
Strong winds marked the start of November and the winter season as an area of low pressure moved through the Great Lakes in the early hours of November, while rapidly deepening. This storm system swung a cold front across the region on the 1st. The classic track of a deepening low to New York’s north and west brought strong winds to the region, felled trees, and brought down power lines. Much chillier air behind the cold front dropped high temperatures down into the 30s by Sunday the 3rd. An amplified and progressive pattern followed, with days above and below normal through the first half of the month. Behind another cold front on the 11th, rain changed to snow on Monday evening and brought much of the region its first measurable snow of the season. On Sunday evening the 17th a squall line passed across Western New York, though damage was minimal with just a few trees reported down across the Southern Tier. Winds became stronger once again behind a cold front on the 18th with a deepening area of low pressure moving to the northwest of western New York. Wind gusts again produced damage across the region with downed trees and power lines. Behind this strong cold front a pattern change occurred with a deep and broad pool of cold Canadian air passing over the Great Lakes Region. This would be the first of many cold Canadian air masses dropping across the Great Lakes region this winter. This air mass brought mainly below normal temperatures and some lake effect snows to close out the month of November. Conditions were not primed for any big lake effect snows, with mainly manageable events occurring, and largely to the south of Buffalo across the typical snow belts and also across the Tug Hill region. A synoptic low brought widespread snow late on the 26th and through Wednesday the 27th. This storm brought several inches of snow, with upwards of a half a foot of snow found across the Genesee Valley and Eastern Lake Ontario region, and near a foot across the hills well south of buffalo. The cold finish to the month also brought the formation of ice on local backyard ponds and streams.
December
December featured a very active weather pattern. It all started with a brief period of warm weather the first week of December, with temperatures briefly touching the low 60’s across portions of the region. A cold front moved through the region on the 6th and successive rounds of colder air plunged southward from Canada into the United States including across the Eastern Great Lakes region through the middle to latter half of December. This cold was also accompanied by several synoptic and lake effect snow events. The colder air spilling across the region from December 10th through the 11th would be responsible for the first of two notable lake effect snow events off Lakes Erie and Ontario. The first event dropped several feet of snow across the traditional snow belts east of both Lakes. A second lake effect snow event on the 12th and 13th came on the heels of our first major lake effect snow event. However this time snow was not as great and the band was a little farther north spreading several inches of snow across the larger cities of Buffalo, Rochester and Watertown. Following this period of cold and snowy weather, a brief warm-up occurred along with copious amounts of precipitation. The combination of rain on top of the recent snowfall caused area creeks and rivers south of Lake Ontario to spill over their banks, while many of their tributaries also produced field flooding, flooded basements and road closures. The warm and wet weather was short lived and on the 24th of December a cold front would bring the region back to a winter wonder land.
January
Relentless cold continued through the month of January across the region. January began with an ongoing lake effect snow event that was quickly followed by synoptic snows as a storm system passed by to our south. Early on the 6th a strong cold front crossed New York State, taking temperatures from the 40s to down below the freezing mark before sunrise. A gusty, cold westerly wind sent temperatures plummeting through the day into the low single digits. Later in the day lake effect snow organized east of Lake Erie and Lake Ontario, with a strong band of snow falling across the portions of the region on the 6th through the early morning hours of the 8th. Downwind of Lake Erie blizzard conditions were seen on these days across metro Buffalo and inland across Genesee and Wyoming counties. Downwind of Lake Ontario, blizzard like conditions were also seen, and 5 feet of snow fell across southern Jefferson and northwestern Lewis County. Following this event the upper level trough shifted westward and focused the coldest air towards the Northern Plains. This allowed for some warmer days across the region. From the 18th till the later days of the month a long wave trough again settled over eastern North America, with polar flow sending temperatures across New York State back below normal. Gusty winds this period brought brutal wind chills several days this period. Snowfall events were light through the end of the month. Temperatures began to moderate some towards the end of the month as the core of the cold air shifted eastward, and the last day of the month saw temperatures climb to just above normal.
February
February rounded out what will be an old fashion winter, one with plenty of cold air masses and snow. A brief respite from the cold began February as a warm front with rain lifted across New York State. Air temperatures soared above freezing, though the deep frozen ground lagged behind and created a thin glaze of ice over road surfaces. This brief warm-up ended on the 2nd when winds veered to northerly and brought subfreezing temperatures and scattered snow showers back across the Eastern Great Lakes region. A sunny start to the day on the 4th ended with a cloudy sky and flurries flying ahead of a storm system, one that tracked from Texas to the Ohio valley, and then to the mid Atlantic coastline. This storm system dropped half to one foot of snow across Western and North Central New York State, and was the largest snowstorm for primary climate sites for the date. For the next 2 weeks following this storm temperatures averaged 10 degrees below normal with nickel and dime snowfall events. On Thursday the 20th a deep storm system passed by to our west. This system brought warm air northward, and rainfall associated with this warm front combined with snow melt caused area creeks and rivers to rise. A cold front crossed the area late on the 22nd, and brought the return of colder air Sunday that remained over the region through the end of the month.
March
A cold front crossed Western New York late on the 1st and sent the region back into the grip of winter, with light snow and frigid temperatures. Highs on the 2nd through the 5th averaged in the teens, which is about 20 degrees below normal. Temperatures would remain below average the first week of the month. Our first early taste of spring occurred on the 10th and 11th. A stalling and weakening cold front, combined with the increasing effects of daytime heating brought highs into 50s across the region by Tuesday the 11th. On Tuesday night and Wednesday a strong late winter snowstorm developed, one that brought blizzard conditions across Western New York. This system dumped a foot to a foot and a half of snow across Western New York and strong winds brought frequent whiteout conditions. Behind this system a typical roller coaster of temperatures occurred through the end of the month. A storm system on the evening of the 29th to the morning of the 30th brought a spring heavy wet snow across Western New York. Totals, somewhat higher across higher terrain averaged 6 to 10 inches across Western and North Central New York.
April
April began on a pleasant note with temperatures warming into the mid 50s through the afternoon and evening, just ahead of a cold front. The first storm system of the month brought around a half inch of rainfall on Friday the 4th followed by a quick dusting of snow across portions of the region on the 5th. The last minor snow of the season occurred on the 15th of the month when a few tenths to an inch of snow was recorded across portions of Western and North Central New York
State.
| Snowfall | ||||||||||||
| County | ID | Town | OCT | NOV | DEC | JAN | FEB | MAR | APR | TOTAL | ||
| Niagara | ||||||||||||
| C02 | North Tonawanda | 0.0 | 8.0 | 20.3 | 28.4 | 21.9 | 22.9 | 0.0 | 101.5 | |||
| C11 | Niagara Falls | 0.0 | 7.1 | 17.1 | 25.5 | 21.1 | 17.4 | 1.0 | 89.2 | |||
| C12 | Lockport | 0.0 | 6.2 | 22.5 | 36.5 | 29.3 | 14.9 | 0.6 | 110.0 | |||
| C17 | Pendleton | 0.0 | 4.9 | 21.5 | 23.2 | 15.8 | 17.2 | 0.5 | 83.1 | |||
| OP | Youngstown | 0.0 | 9.1 | 18.1 | 26.5 | 19.7 | 20.8 | 3.2 | 97.4 | |||
| OP | North Tonawanda | 0.0 | 11.4 | 30.9 | 25.1 | 20.5 | 22.7 | 0.6 | 111.2 | |||
| OP | Niagara Falls | 0.0 | 6.7 | 16.0 | 26.1 | 19.1 | 19.2 | 0.7 | 87.8 | |||
| Erie | ||||||||||||
| C07 | Williamsville (East) | 0.0 | 5.6 | 22.7 | 42.8 | 19.3 | 20.0 | 0.5 | 110.9 | |||
| C39 | Hamburg | 0.0 | 10.0 | 35.9 | 36.9 | 18.6 | 13.7 | 0.3 | 115.4 | |||
| C50 | East Aurora | 0.0 | 14.5 | 50.7 | 43.4 | 24.0 | 24.9 | 1.0 | 158.5 | |||
| C51 | Clarence Center | 0.0 | 7.1 | 27.3 | 29.6 | 17.2 | 17.8 | 1.0 | 100.0 | |||
| C53 | West Seneca | 0.0 | 11.2 | 21.5 | 41.5 | 17.0 | 18.0 | 0.5 | 109.7 | |||
| C57 | Kenmore | 0.0 | 5.8 | 27.6 | 34.2 | 19.7 | 23.7 | 0.5 | 111.5 | |||
| C59 | Kenmore | 0.0 | 7.5 | 29.0 | 32.1 | 19.5 | 21.7 | 0.9 | 110.7 | |||
| C60 | Blasdell | 0.0 | 10.8 | 18.3 | 30.3 | 17.3 | 15.3 | 1.0 | 93.0 | |||
| C63 | Glenwood | 0.0 | 21.0 | 70.1 | 46.9 | 31.0 | 28.4 | 1.3 | 198.7 | |||
| C65 | Boston | 0.0 | 18.8 | 68.9 | 46.2 | 38.4 | 31.3 | 1.0 | 204.6 | |||
| C66 | East Aurora | 0.0 | 14.5 | 58.0 | 46.0 | 22.0 | 29.0 | 1.0 | 170.5 | |||
| C75 | Elma Center | 0.0 | 14.0 | 30.2 | 40.3 | 17.7 | 22.3 | 0.0 | 124.5 | |||
| C77 | Holland | 0.5 | 21.1 | 87.1 | 49.7 | 42.5 | 36.2 | 2.3 | 239.4 | |||
| C83 | Williamsville | 0.0 | 9.1 | 28.6 | 35.8 | 18.5 | 18.4 | 1.3 | 111.7 | |||
| C96 | Elma | 0.0 | 12.3 | 26.6 | 53.3 | 28.0 | 11.7 | 1.7 | 133.6 | |||
| C98 | Amherst | 0.0 | 5.3 | 25.2 | 33.7 | 23.5 | 20.1 | 0.0 | 107.8 | |||
| C102 | Cheektowaga | 0.0 | 10.0 | 27.1 | 44.0 | 22.8 | 24.5 | 1.2 | 129.6 | |||
| C103 | Buffalo (south) | 0.0 | 9.2 | 15.0 | 24.3 | 14.6 | 12.2 | 0.0 | 75.3 | |||
| OP | Buffalo Int'l Airport | T | 10.0 | 28.5 | 42.4 | 23.3 | 24.5 | 1.2 | 129.9 | |||
| OP | Coldon | T | 21.3 | 91.8 | 60.4 | 44.5 | 30.8 | 1.3 | 250.1 | |||
| OP | Springville | T | 15.5 | I | I | 33.8 | 27.3 | 1.1 | 77.7 | |||
| OP | Wales | T | 17.0 | 66.0 | 40.1 | 22.3 | 25.9 | 1.0 | 172.3 | |||
| SS | Buffalo (State College) | 0.0 | 7.1 | 16.7 | 30.5 | 16.0 | 16.0 | 86.3 | ||||
| Orleans | ||||||||||||
| OP | Albion | 0 | 6.0 | 17.0 | 20.0 | 29.0 | 26.0 | 1.0 | 99.0 | |||
| OP | Lyndonville | T | 4.1 | 21.0 | 24.4 | 20.6 | 21.4 | 1.0 | 92.5 | |||
| Genesee | ||||||||||||
| OP | Batavia | 0 | 7.5 | 26.6 | 41.5 | 23.7 | 36.8 | 0.1 | 136.2 | |||
| C06 | Stafford | 0 | 13.3 | 35.7 | 27.4 | 21.1 | 26.2 | 0.2 | 123.9 | |||
| OP | Pavilion | 0 | 10.4 | I | 12.9 | I | 21.7 | 45.0 | ||||
| Wyoming | ||||||||||||
| OP | Portageville | T | 8.0 | 19.2 | 12.3 | 14.6 | 18.9 | 73.0 | ||||
| OP | Warsaw | T | 21.6 | 82.7 | 42.8 | 37.9 | 33.4 | 0.5 | 218.9 | |||
| OP | Bennington | T | 19.1 | 52.5 | 46.5 | 37.5 | 35.1 | 2.5 | 193.2 | |||
| OP | Silver Springs | T | 12.7 | 53.3 | 19.4 | 20.2 | 20.5 | 1.0 | 127.1 | |||
| Chautauqua | ||||||||||||
| C06 | Forestville | 0.0 | 23.0 | 72.5 | 30.0 | 28.0 | 27.9 | 0.0 | 181.4 | |||
| C09 | Dunkirk | 0.0 | 5.2 | 69.5 | 21.1 | 14.3 | 19.1 | 0.5 | 129.7 | |||
| C19 | Ripley | 0.3 | 13.1 | 32.9 | 42.4 | 31.0 | 28.8 | 2.2 | 150.7 | |||
| OP | Dunkirk | 0.5 | 8.9 | 69.5 | 21.1 | I | 19.1 | 0.5 | 119.6 | |||
| OP | Portland | T | 16.5 | 34.0 | 24.0 | 23.5 | 25.5 | 2.0 | 125.5 | |||
| OP | Jamestown | 2 | 17.8 | 22.5 | 26.7 | 22.4 | 7.5 | T | 98.9 | |||
| Cattaraugus | ||||||||||||
| C02 | Randolph | 1 | 16.0 | 27.5 | 26.0 | 24.5 | 12.5 | 1.0 | 108.5 | |||
| C06 | Olean | 0 | 7.3 | 15.6 | 16.2 | 19.9 | 7.5 | 0.4 | 66.9 | |||
| C11 | Allegany | 0.3 | 15.6 | 22.7 | 24.0 | 23.5 | 11.7 | 0.8 | 98.6 | |||
| C15 | West Valley | 1 | 15.0 | 63.5 | 28.5 | 45.5 | 9.0 | 0.0 | 162.5 | |||
| C21 | Little Valley | 0.5 | 15.5 | 44.2 | 19.1 | I | 5.5 | 0.2 | 85.0 | |||
| OP | Allegheny Park | T | 10.5 | 15.5 | 17.0 | 16.8 | 10.5 | T | 70.3 | |||
| OP | Franklinville | 0.5 | 13.0 | 28.5 | 21.0 | 30.2 | 12.0 | 0.5 | 105.7 | |||
| OP | Little Valley | 0 | 14.0 | 35.5 | 36.5 | 27.0 | 14.5 | 0.0 | 127.5 | |||
| OP | New Albion | 3 | 14.7 | 27.7 | 18.3 | 17.4 | 13.4 | 94.5 | ||||
| OP | Olean | T | 6.0 | 13.2 | 17.5 | 16.5 | 5.5 | T | 58.7 | |||
| OP | Perrysburg | T | 28.0 | 117.0 | 75.0 | 57.5 | 33.5 | 311.0 | ||||
| SS | West Valley | 3 | 20.0 | 70.0 | 18.0 | 33.5 | 21.0 | 0.5 | 166.0 | |||
| Allegany | ||||||||||||
| C02 | West Almond | 0.2 | 9.6 | 17.4 | 20.2 | 20.3 | 13.5 | 0.2 | 81.4 | |||
| OP | Alfred | 0.2 | 6.4 | 14.3 | 18.8 | 17.7 | 14.6 | T | 72.0 | |||
| OP | Angelica | 1 | 6.8 | 13.7 | 16.5 | 19.7 | 12.5 | T | 70.2 | |||
| OP | Rushford | 4.1 | 12.0 | 29.9 | 19.7 | 22.0 | 14.3 | 0.2 | 102.2 | |||
| OP | Wellsville | T | 6.4 | 8.5 | 11.9 | 14.7 | 7.6 | T | 49.1 | |||
| OP | Whitesville | T | 5.3 | 10.6 | 14.3 | 13.3 | 7.8 | T | 51.3 | |||
| Livingston | ||||||||||||
| C05 | Dansville | 0 | 5.9 | 7.0 | 12.1 | 15.6 | 13.3 | 0.0 | 53.9 | |||
| OP | Avon | 0 | 8.4 | 16.0 | 16.9 | 15.5 | 56.9 | T | 113.7 | |||
| OP | Dansville | 0 | 4.0 | 10.7 | 6.9 | 17.1 | 15.6 | 0.0 | 54.3 | |||
| OP | Mount Morris | 0 | 6.0 | 11.0 | M | M | 18.0 | M | 35.0 | |||
| Ontario | ||||||||||||
| OP | Honeoye Lake | T | 5.5 | 20.0 | 14.1 | 14.0 | 23.0 | T | 76.6 | |||
| OP | Geneva | 0.0 | 9.2 | 12.5 | 13.0 | 19.5 | 18.7 | 1.2 | 74.1 | |||
| Monroe | ||||||||||||
| C12 | North Chili | 0.0 | 9.5 | 25.3 | 16.3 | 23.0 | 23.9 | 0.0 | 98.0 | |||
| C15 | Brockport | 0.0 | 7.1 | 26.2 | 31.5 | 23.4 | 35.2 | 0.2 | 123.6 | |||
| C23 | Greece | 0.0 | 9.1 | 22.4 | 27.1 | 28.5 | 22.7 | 0.0 | 109.8 | |||
| C26 | Webster | 0.0 | 7.6 | 20.0 | 28.1 | 28.4 | I | 0.2 | 84.3 | |||
| C29 | Brockport | 0.0 | 7.6 | 23.2 | 29.3 | 19.1 | 28.7 | 0.5 | 108.4 | |||
| OP | Rochester Int'l Airport | 0 | 13.5 | 22.5 | 20.8 | 26.3 | 29.3 | 0.3 | 112.7 | |||
| OP | Webster | 0.2 | 9.8 | 30.0 | 33.9 | 35.1 | 20.6 | 0.4 | 130.0 | |||
| 0.0 | ||||||||||||
| Wayne | 0.0 | |||||||||||
| C06 | Palmyra | 0 | 14.7 | 20.0 | 20.2 | 26.2 | 26.3 | 0.5 | 107.9 | |||
| C10 | Walworth | 0 | 10.7 | 27.2 | 35.8 | 33.1 | 34.7 | 1.7 | 143.2 | |||
| C18 | Macedon | 0 | 14.5 | 16.8 | 21.3 | 21.1 | 20.9 | 0.2 | 94.8 | |||
| OP | Newark | 0 | 9.0 | 16.5 | 30.5 | 19.3 | 26.4 | T | 101.7 | |||
| 0.0 | ||||||||||||
| Oswego | 0.0 | |||||||||||
| C01 | Lacona | 0 | 7.2 | 78.9 | 67.2 | 39.0 | 24.7 | 1.7 | 218.7 | |||
| C03 | Scriba | 0.5 | 11.0 | 34.0 | 55.2 | 56.0 | 17.7 | 1.2 | 175.6 | |||
| C13 | Redfield | 1.3 | 14.0 | 146.5 | 93.0 | 61.0 | 33.0 | 5.0 | 353.8 | |||
| C15 | Minetto | 0.2 | 6.0 | 32.8 | 43.9 | 52.0 | 21.9 | 0.3 | 157.1 | |||
| C20 | Fulton | 0 | 14.1 | 48.0 | 45.1 | 64.9 | 21.4 | 0.2 | 193.7 | |||
| C21 | Pulaski | 0.2 | 7.0 | 50.8 | 92.5 | 25.4 | 20.0 | 0.0 | 195.9 | |||
| C26 | Mexico | 0 | 7.9 | 26.1 | 41.5 | 56.0 | 13.5 | 0.0 | 145.0 | |||
| OP | Palermo | T | 11.4 | 32.7 | 39.4 | 67.5 | 17.3 | 0.7 | 169.0 | |||
| OP | Fulton | 0 | 12.8 | 42.6 | 43.1 | 58.6 | 20.0 | 1.1 | 178.2 | |||
| OP | Bennetts Bridge | 0 | 5.0 | 82.0 | 75.0 | 53.0 | 22.5 | 1.0 | 238.5 | |||
| SS | Pulaski | 0.2 | 6.6 | 65.2 | 61.0 | 29.1 | 21.6 | 0.2 | 183.9 | |||
| SS | Fulton | 0 | 11.9 | 37.2 | 39.4 | 59.2 | 20.1 | 0.9 | 168.7 | |||
| 0.0 | ||||||||||||
| Lewis | 0.0 | |||||||||||
| C02 | Harrisville | 0 | 10.0 | 22.9 | 44.6 | 32.2 | 21.9 | 0.0 | 131.6 | |||
| C03 | Constableville | 4.5 | 10.3 | 102.4 | 61.9 | 42.5 | 39.2 | 2.0 | 262.8 | |||
| C04 | Copenhagen | 0.8 | 22.1 | 68.9 | 101.1 | 81.9 | I | 4.7 | 279.5 | |||
| C10 | Croghan | 0 | 16.0 | 35.1 | 55.7 | 35.9 | 22.3 | 0.5 | 165.5 | |||
| OP | Copenhagen | 0 | 17.5 | 46.8 | 76.5 | 52.5 | 37.5 | 4.5 | 235.3 | |||
| OP | Highmarket | 6.8 | 12.3 | 105.7 | 61.8 | 40.7 | 36.0 | 2.3 | 265.6 | |||
| OP | Hooker | 0.7 | 22.1 | 68.9 | 101.1 | 81.9 | 45.9 | 4.7 | 325.3 | |||
| OP | Lowville | T | 6.9 | 59.4 | 43.5 | 34.7 | 25.0 | 1.7 | 171.2 | |||
| OP | Beaver Falls | T | 4.2 | M | 29.0 | 25.5 | 15.5 | 1.0 | 75.2 | |||
| 0.0 | ||||||||||||
| Jefferson | 0.0 | |||||||||||
| C07 | Theresa | 0 | 7.9 | 19.9 | 39.9 | 29.7 | 24.6 | 0.0 | 122.0 | |||
| C11 | Carthage | 0 | 9.6 | 15.4 | I | 36.8 | 19.3 | 0.9 | 82.0 | |||
| C25 | Watertown | 95.2 | 61.0 | I | 0.0 | 156.2 | ||||||
| C26 | Mannsville | 36.5 | 27.5 | 13.9 | 0.0 | 77.9 | ||||||
| OP | Black River | 0 | 2.0 | 12.5 | 69.5 | 66.5 | 13.2 | 0.5 | 164.2 | |||
| OP | Watertown | 0 | 10.0 | 23.0 | 76.3 | 60.8 | 31.5 | 0.5 | 202.1 | |||
| I = Incomplete data | ||||||||||||
| M = Missing data | ||||||||||||