The National Weather Service in Cleveland's county warning area (CWA) lies in a unique region of the United States, meaning that a wide variety of natural hazards occur year-round. From tornadoes in the spring and summer to blizzards in the winter, residents of northern Ohio and northwest Pennsylvania know that the weather can change in an instant, regardless of the season or time of year.
This webpage highlights a broad range of historical trends and climatological extremes across NWS Cleveland's area of responsibility to provide users with information on better understanding and preparing for severe weather, extreme precipitation, winter weather, extreme heat and cold, and even tropical cyclone remnants.
.png) |
Tornado Climatology Northern Ohio and Northwest Pennsylvania are far from immune to the impacts of tornadoes. In fact, all counties in the NWS Cleveland County Warning Area (with the exception of Lake County, OH) have documented at least 12 tornadoes since 1950, with Huron County reporting the most (40). A total of 549 tornadoes have been confirmed in our region between 1950 and 2025. The vast majority of local tornadoes are short-lived and weak (F/EF0 or F/EF1), but long-tracked, violent tornadoes remain a rare yet inevitable part of our climate. Perhaps the most notorious of these was the F5 tornado that impacted Niles, OH, on May 31, 1985. The most recent EF4+ tornado occurred in Wood and Ottawa counties in June 2010. Though violent outbreaks are infrequent events, severe atmospheric conditions do not solely exist in the Great Plains or the Southeast. Understanding that every county has a proven history of tornadic thunderstorms underscores why severe weather readiness is essential for every community in our region. |
|
This tornado frequency heatmap shows the average number of tornadoes per year within 25 miles of a given point from 1950 to 2025. Based on this, the vast majority of northern Ohio and northwest Pennsylvania can expect to see at least one tornado within 25 miles of their location each year. Tornadoes are more likely to occur in the western half of NWS Cleveland's CWA, but there are some localized pockets in the central and eastern counties that have seen more tornadoes than others. The most notable "hotspot" of tornadoes from 1950 to 2025 lies in Seneca and Huron Counties, where some locations can expect to see 4 to 5 tornadoes within 25 miles of their location each year. While this may seem intimidating, remember that tornadoes are relatively small compared to the land they track across. Additionally, a 25-mile radius covers roughly 1,960 square miles, an area larger than the entire state of Rhode Island! The odds of a specific location occurring within the path of a tornado are extremely small, often less than a fraction of a percent in a given year. However, it is always important to be prepared and have a plan in case you are placed under severe weather and tornado alerts. |
.png) |
|
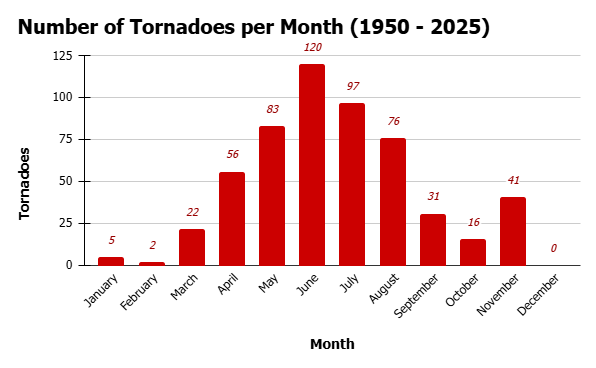
This chart shows the number of tornadoes in NWS Cleveland's CWA during each calendar month from 1950 to 2025. Most tornadoes have occurred between April and August with the highest amount being observed in the month of June, but they can occur any time of the year given enough instability, moisture, and wind shear. Notably, a secondary uptick in tornado frequency occurs in November, and our area has recorded no tornadoes during the month of December. |
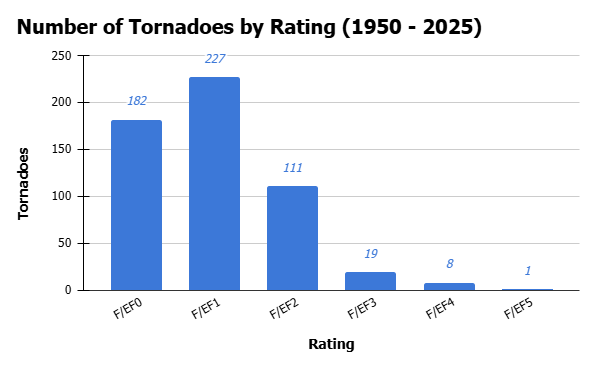
This chart depicts the number of tornadoes by F and EF rating in NWS Cleveland's CWA from 1950 to 2025. The vast majority (74.6%) are relatively "weaker" F/EF0 and F/EF1 tornadoes (still containing winds of 60 to 110 mph!), but significant (F/EF2+) tornadoes can still occur in northern OH and northwest PA. Nine violent (F/EF4+) tornadoes have been recorded in our area since 1950, meaning that one of that strength is expected to occur on average every 8 to 9 years. |
|
This map shows the probability of a tornado within 25 miles of a given location, using data from 1955 to 2024. The highest probabilities lie in the western part of NWS Cleveland's CWA (60-70%), with probabilities gradually tapering to the east and north. Remember that these trends are historical, and the probability of a tornado can vary from location to location depending on the distribution of severe weather ingredients. |
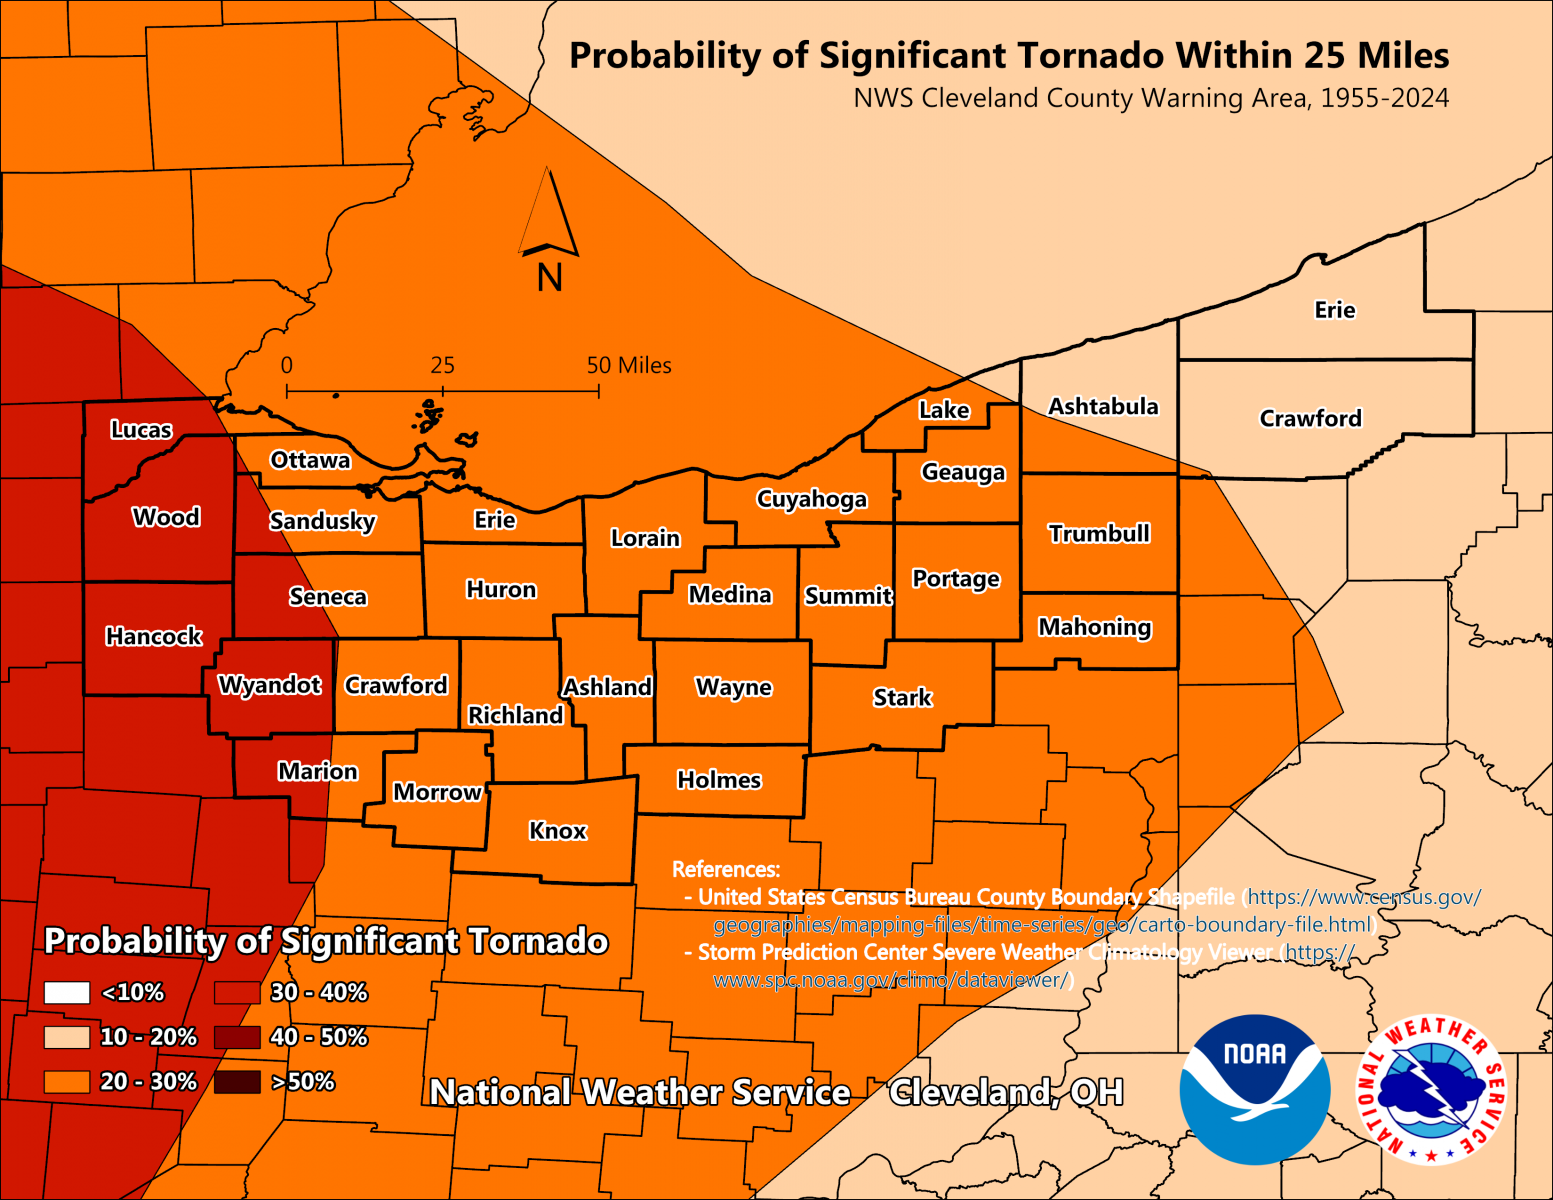
This map shows the probability of a significant tornado (EF2+) within 25 miles of a given location, using data from 1955 to 2024. Similar to all tornadoes, the probabilities are maximized in the western portion of the CWA (30-40%), with probabilities lowering toward the east and north. |
This map shows the average number of tornado warnings per year for a given location across NWS Cleveland's CWA, using data from 1986 to 2025. The county average is displayed as the number, as there are variations from point to point across a given county. The highest concentration of warnings appears to be in Wayne and Stark Counties, with a location expected to average 2 tornado warnings per year there. |
Most Recent Tornado in Each County
| County | Date of Last Tornado | Rating | County | Date of Last Tornado | Rating |
| Ashland | June 15, 2023 | EF0 | Mahoning | July 21, 2026 | EF0 |
| Ashtabula | November 5, 2017 | EF2 | Marion | August 12, 2023 | EF1 |
| Crawford OH | April 17, 2024 | EF1 | Medina | July 7, 2025 | EF0 |
| Crawford PA | June 14, 2026 | EF1 | Morrow | March 26, 2026 | EF1 |
| Cuyahoga | August 6, 2024 | EF1 | Ottawa | June 18, 2025 | EF0 |
| Erie OH | June 18, 2025 | EF1 | Portage | May 11, 2024 | EF0 |
| Erie PA | June 9, 2025 | EF2 | Richland | March 14, 2024 | EF2 |
| Geauga | March 31, 2026 | EF1 | Sandusky | April 2, 2025 | EF0 |
| Hancock | March 14, 2024 | EF1 | Seneca | March 14, 2024 | EFU |
| Holmes | June 9, 2025 | EF1 | Stark | June 5, 2025 | EF0 |
| Huron | August 13, 2025 | EF1 | Summit | August 6, 2024 | EF1 |
| Knox | March 26, 2026 | EF0 | Trumbull | July 21, 2026 | EF0 |
| Lake | August 6, 2024 | EF1 | Wayne | March 31, 2026 | EF0 |
| Lorain | June 18, 2025 | EF1 | Wood | November 17, 2013 | EF1 |
| Lucas | June 15, 2023 | EF0 | Wyandot | August 5, 2007 | EF0 |
Some Significant Events
|
May 31, 1985
The most violent tornado outbreak in our region by a wide margin, a total of ten tornadoes were confirmed in northeast Ohio and northwest Pennsylvania, with nine of the ten being significant (F2 or higher). A whopping four of these were violent (F4 or higher), including the only F5 recorded in northeast OH and northwest PA history. See more information about this event here! |
July 12, 1992
This outbreak featured the highest quantity of tornadoes confirmed in northern Ohio in a single calendar day, with 19 reported across several counties in NWS Cleveland's domain. Nine of these were rated F2 or higher, with two of them being intense F3 tornadoes with winds of at least 158 miles per hour. |
November 10, 2002
An unusually potent late-season setup contributed to 15 tornadoes spawning in northern Ohio and northwest Pennsylvania across a rather widespread area of the CWA. Five of these were rated F2, and one was rated F3 in Seneca County. See more information about this event here! |
|
November 5, 2017
Another significant late-season severe weather outbreak affected northern Ohio and northwest Pennsylvania in early November, contributing to 14 total tornadoes across the area. Twelve of these were reported in the western and central counties of the CWA, and a total of three EF2 tornadoes were confirmed across northern Ohio. See more information about this event here! |
June 15, 2023
An unexpected tornado outbreak occurred late on June 15, 2023, in north-central Ohio. Generated from a particularly intense supercell, 12 tornadoes were confirmed from Lucas County to Ashland County, with three of them being rated EF2. Huron County alone experienced five tornadoes that evening. See more information about this event here! |
August 24, 2023
Yet another significant tornado outbreak in 2023, an additional 12 tornadoes were confirmed mainly across the Ohio lakeshore counties. Two of these tornadoes were rated EF2, one in eastern Cuyahoga County and another in eastern Geauga County. See more information about this event here! |
Data sources used in this page include the United States Census Bureau County Boundaries Shapefile, Storm Prediction Center SVRGIS Data, Storm Prediction Center Severe Weather Climatology Viewer, and Iowa Environmental Mesonet Watches, Warnings, and Advisories.
Damaging Wind & Severe Hail Climatology
Non-tornadic severe thunderstorms are a frequent hazard each year across northern Ohio and northwest Pennsylvania, particularly in the spring and summer months. While tornadoes often gain the most public attention, non-tornadic severe weather, namely damaging straight-line winds and large hail, accounts for the vast majority of storm damage across the NWS Cleveland CWA.
|
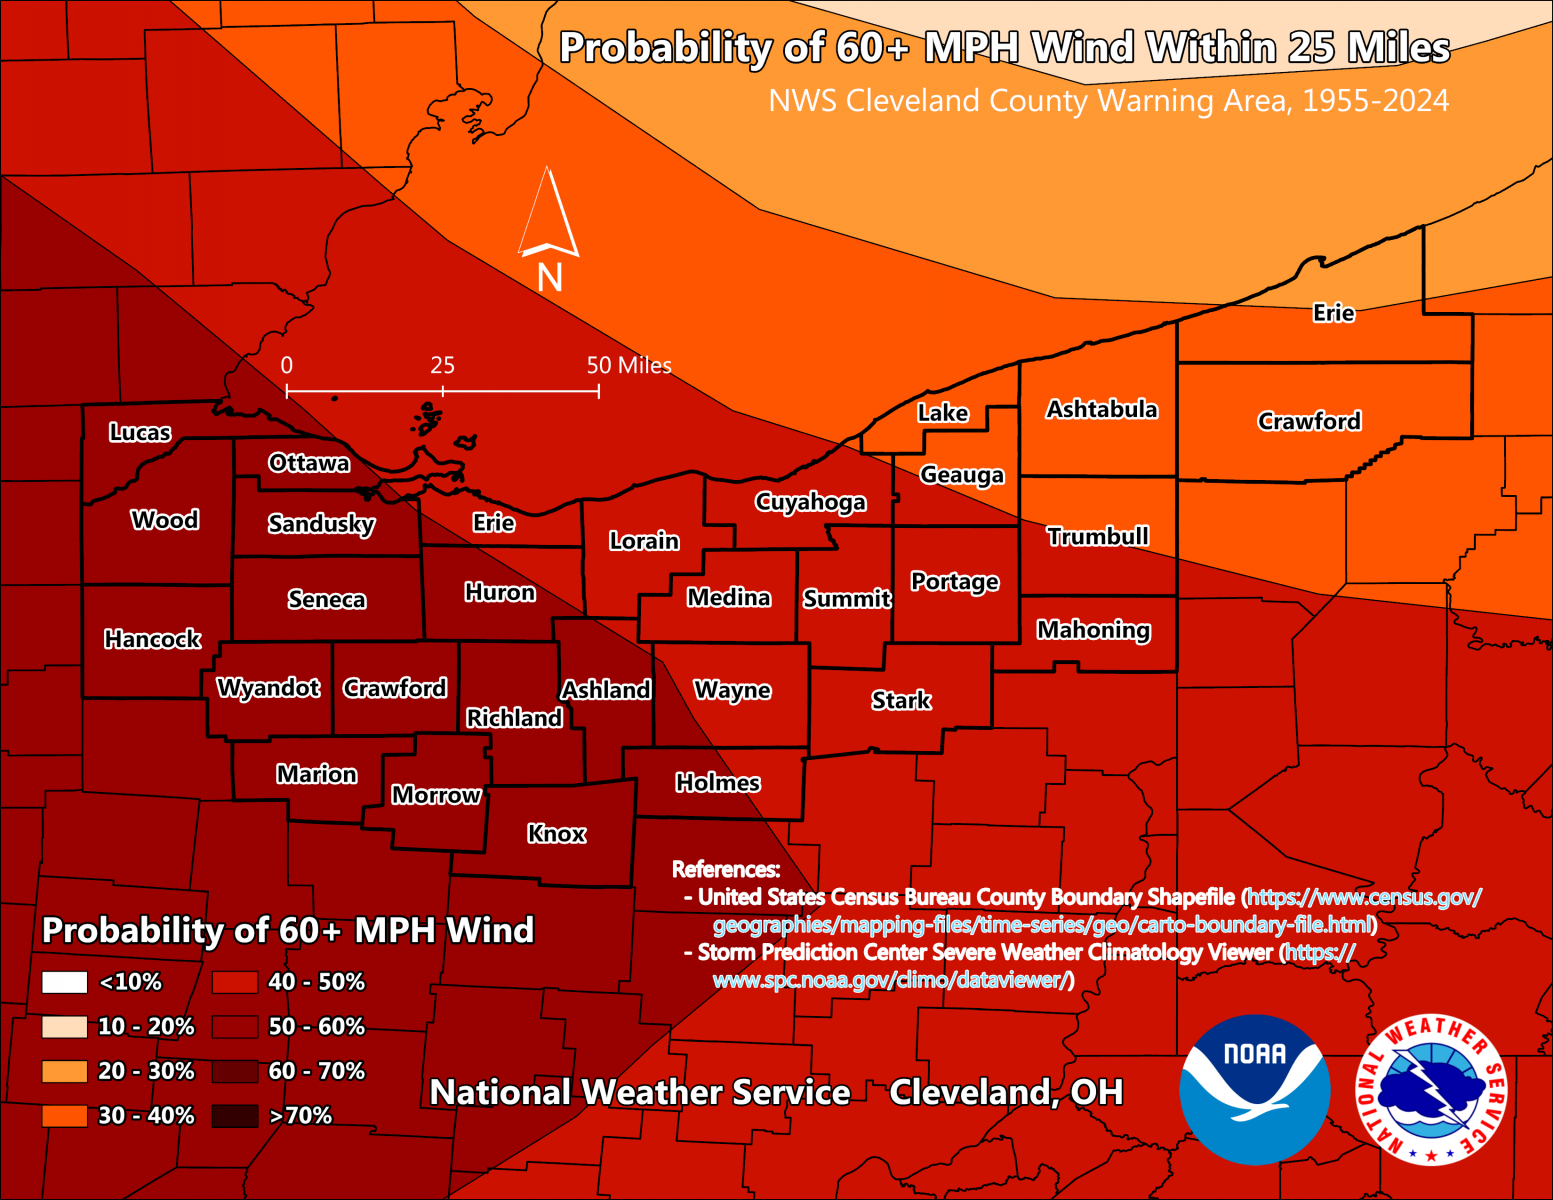
This map depicts the probability of 60+ mph straight-line winds within 25 miles of a given location each year, using data from 1955 to 2024. Probabilities are maximized (60-70%) in the western and southern portions of NWS Cleveland's CWA, with values decreasing with northward and eastward extent. Remember though that the probability of severe weather can vary locationally on a given day based on the distribution of severe weather ingredients. |
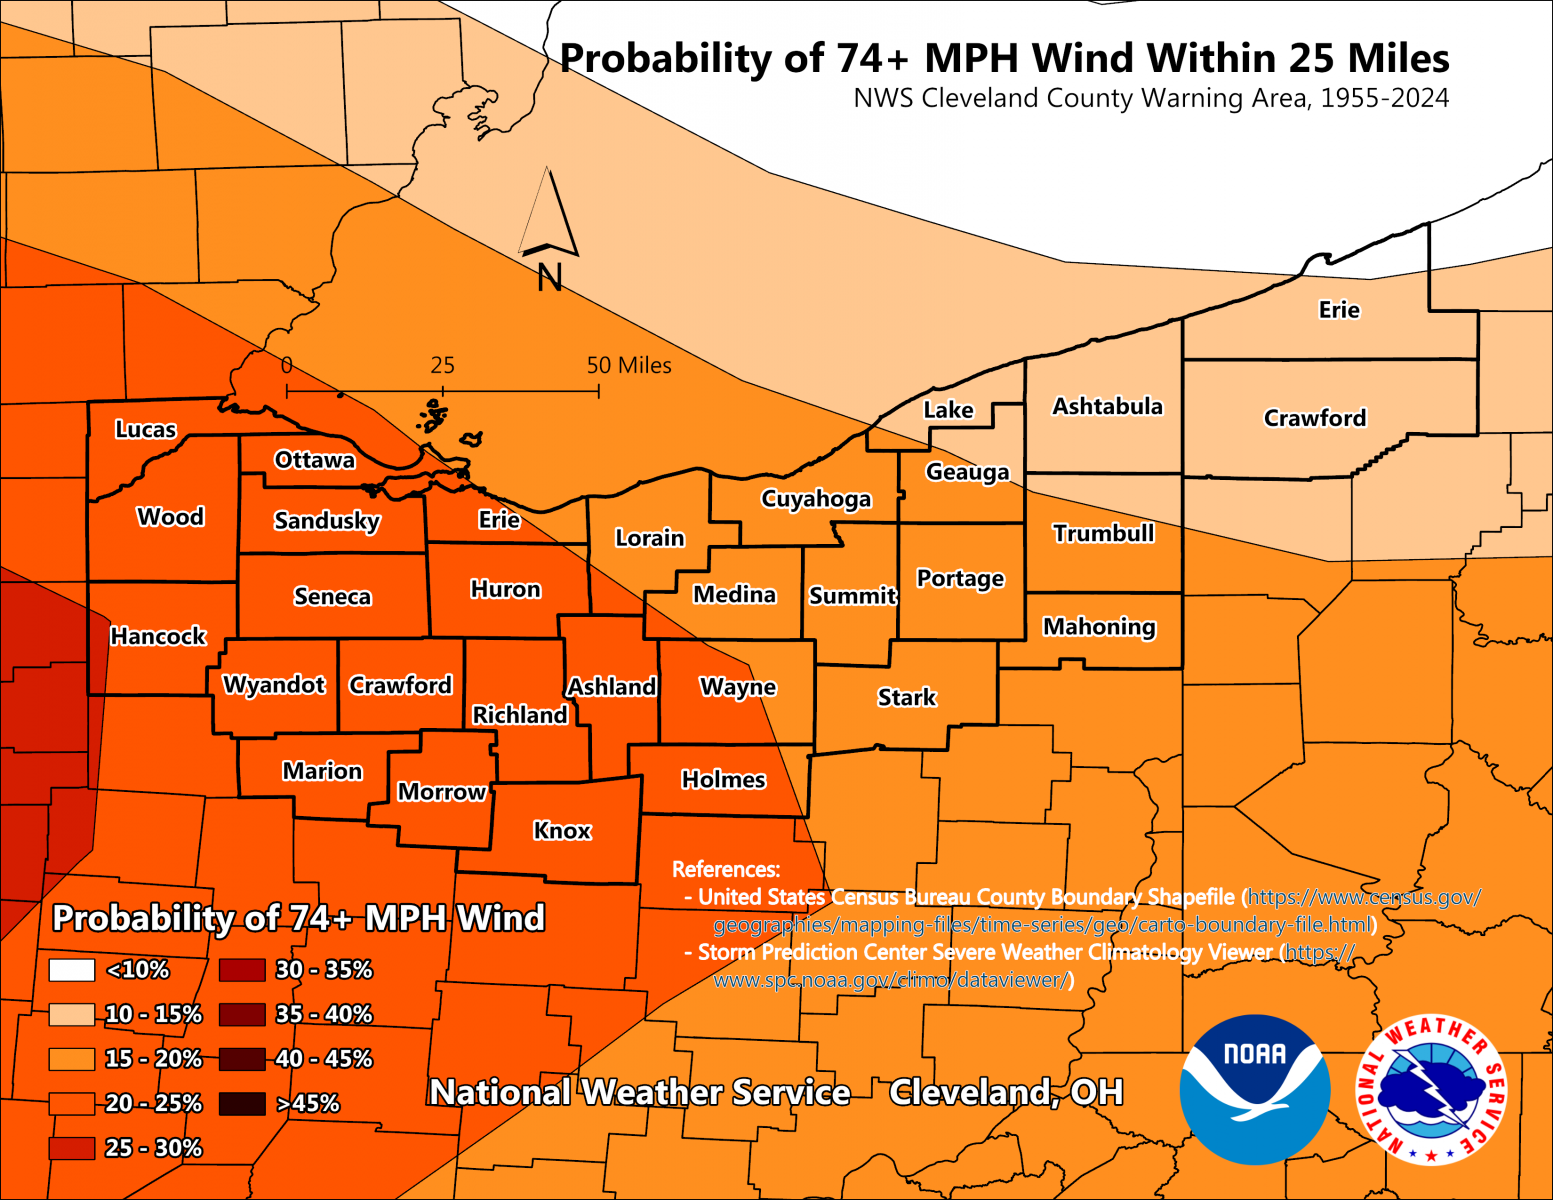
This map shows the probability of hurricane-force (74+ mph) straight-line winds within 25 miles of a given location each year, using data from 1955 to 2024. Like the map for 60+ mph winds, the probabilities are highest in the western and southern portions of NWS Cleveland's area of responsibility, with chances decreasing to the north and east. |
|
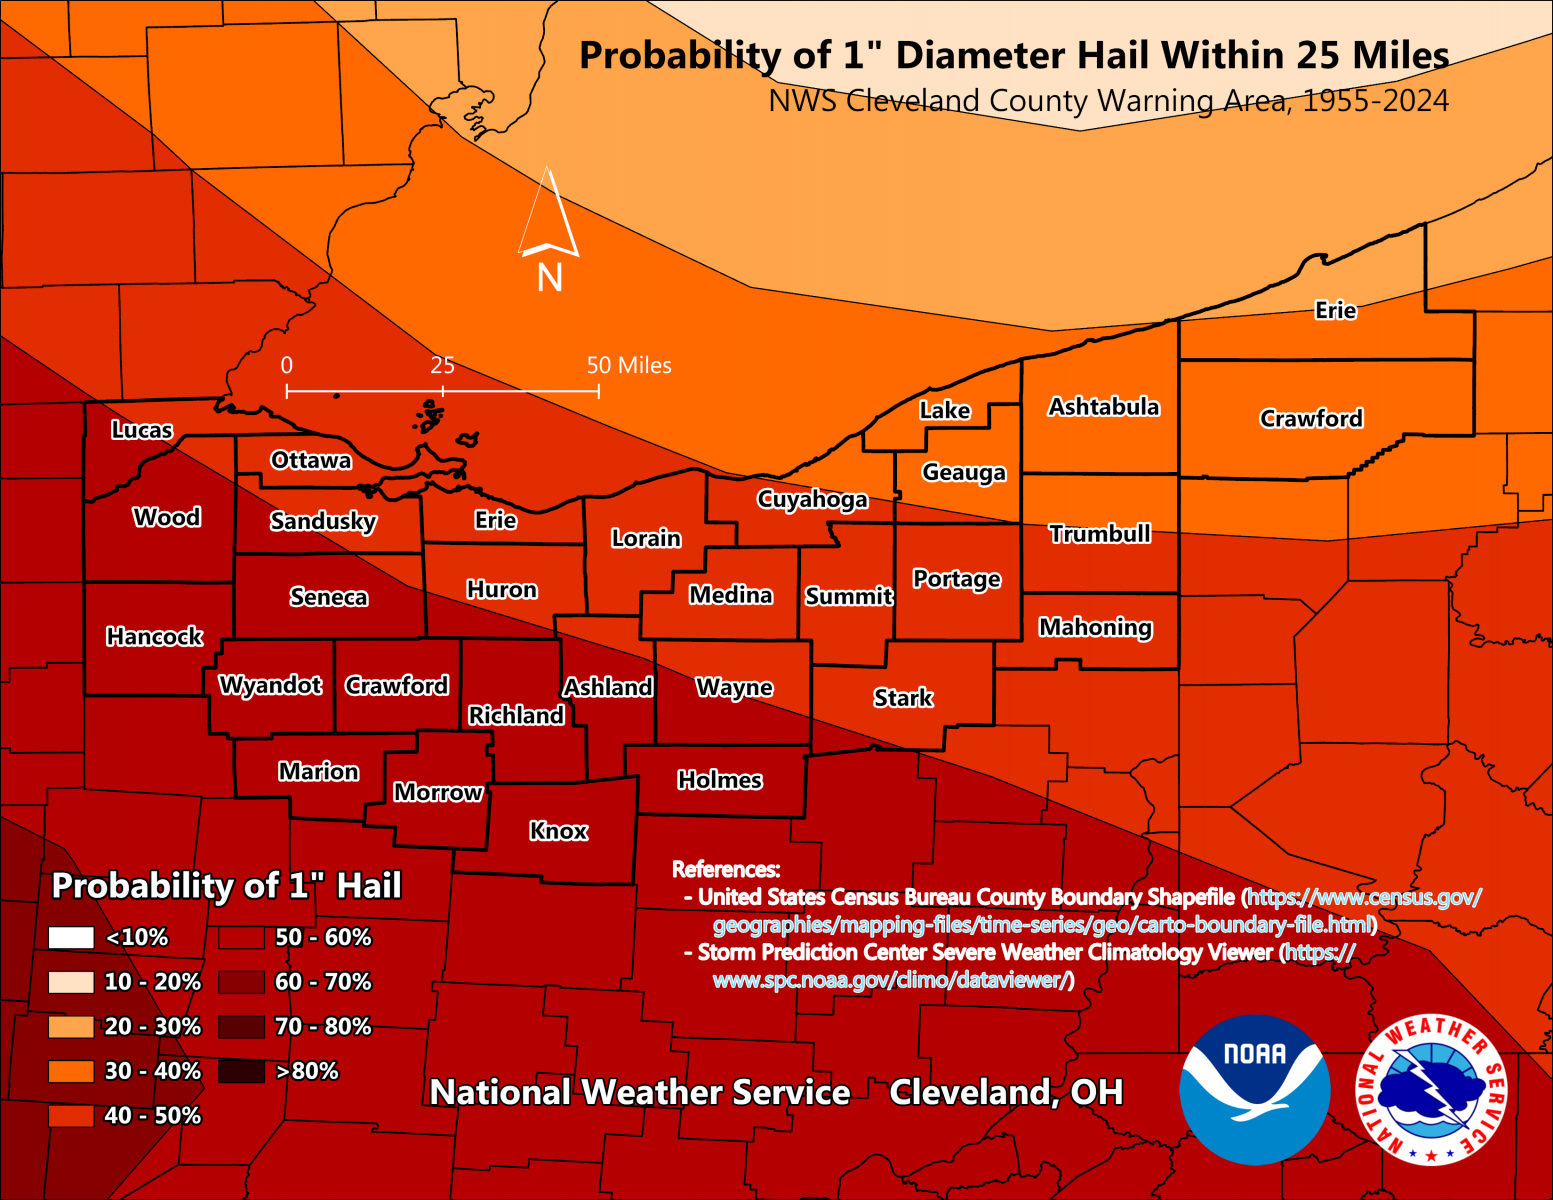
This map shows the probability of one-inch diameter (quarter-size) hail or greater within 25 miles of a given location each year, taking data from 1955 to 2024. Similar to the previous maps, chances are highest (50-60%) in the southern and western counties of the area each year, and values decrease toward the north and east. |
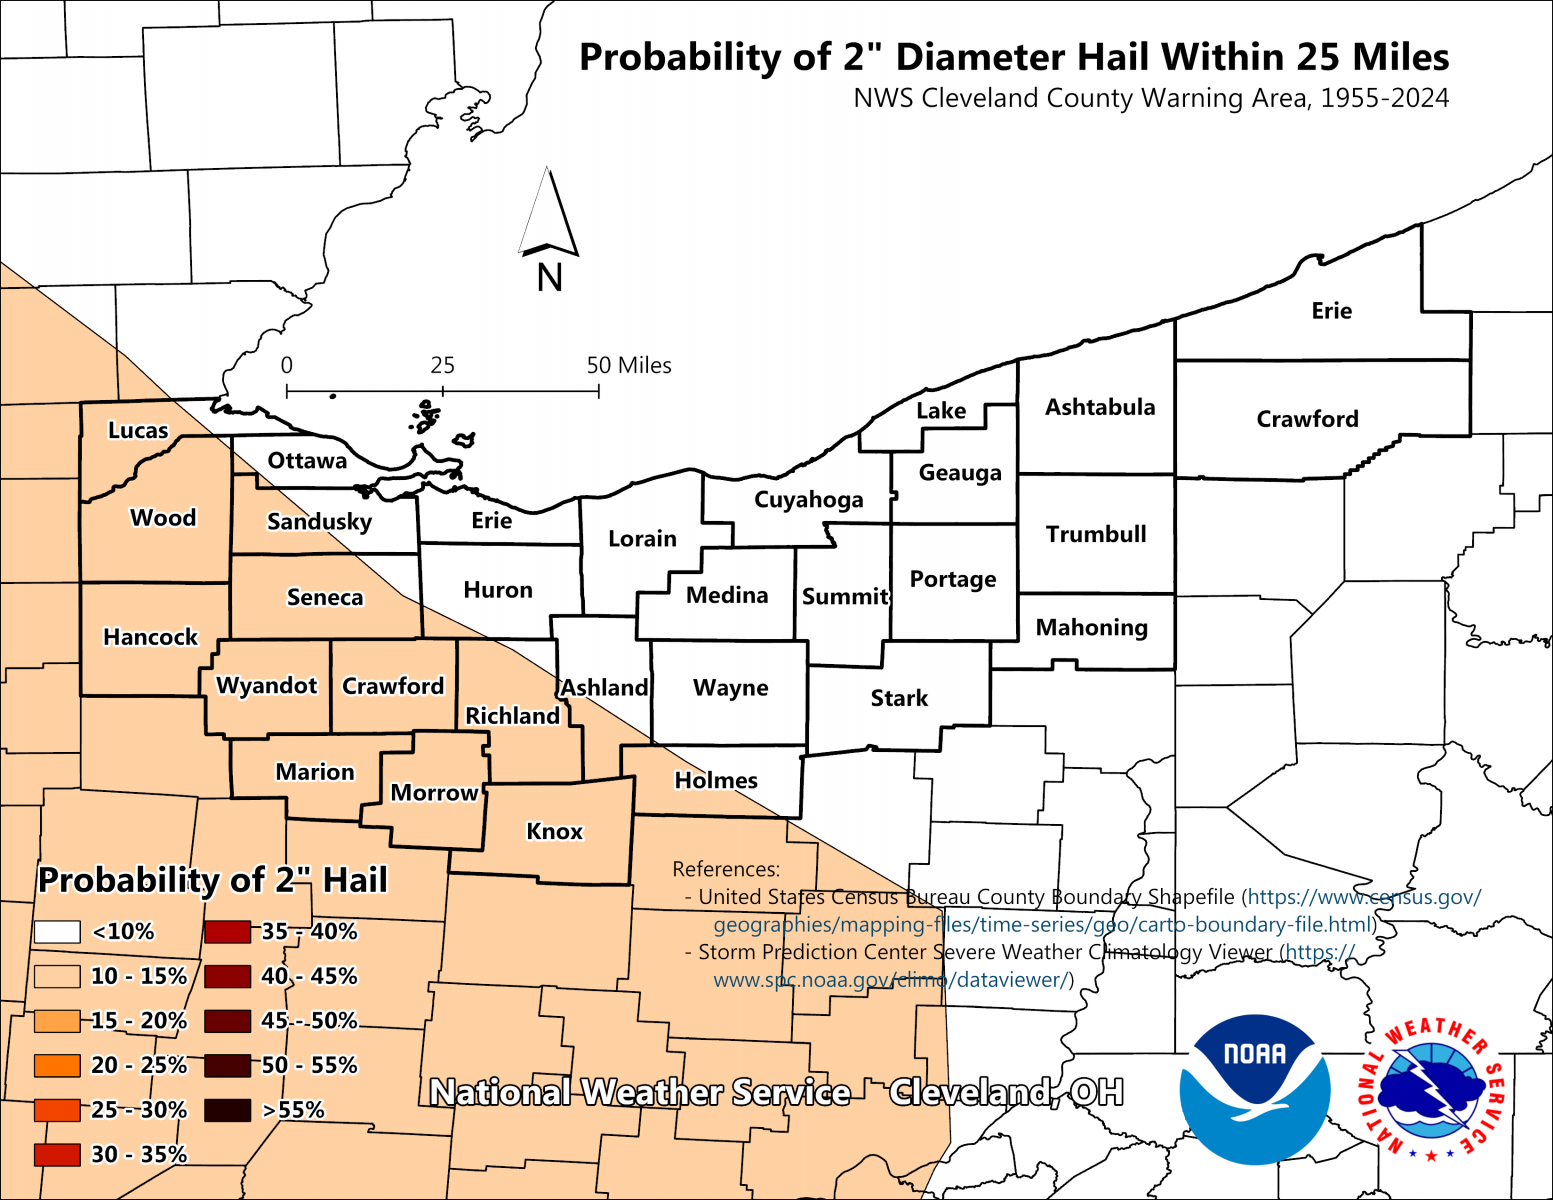
This map displays the probability of two-inch diameter (lime- or egg-size) hail or greater within 25 miles of a given location each year, using data from 1955 to 2024. Unlike the other maps, probabilities are significantly lower across our area, with values peaking in the southern and western counties at about 10-15% in a given year. Fortunately, our area does not usually have to worry about giant hail, but it still can occur so it is important to be prepared just in case. |
Between 1950 and 2025, thousands of damaging wind and large hail events have been reported throughout NWS Cleveland's CWA. Every single county in the region has recorded over 100 wind damage or measured severe gust reports (58 mph or greater) and more than 50 reports of large hail (one inch in diameter or greater).
|
|
.png) |
On a county-level scale, Cuyahoga County leads the region with 588 damaging wind and 285 large hail reports between 1950 and 2025. While this is the highest value in the CWA, Cuyahoga County is also the most populous in the area. Higher population density means more buildings, vehicles, and power lines to sustain visible damage, as well as significantly more eyes to spot and report severe weather. Similar trends can be seen in other urban and suburban areas like Lorain, Summit, Stark, Trumbull, and Erie County, PA.
Physical land area also skews county totals. Crawford County, PA, yields the second highest number of damaging wind reports (480) as well as an elevated large hail report count (185). While less densely populated than Cuyahoga County, for instance, Crawford County, PA, is geographically large, giving severe weather a much larger area to strike and be recorded over time.
Because of these observational biases, known specifically as population and geographic sampling errors, raw report totals alone can make mapping true severe weather frequency challenging.
|
The Severe Thunderstorm Warning is the most common severe weather warning issued by the National Weather Service in Cleveland each year. These warnings account for the potential of damaging straight-line winds, large hail, and sometimes the small chance of a brief tornado. The map on the right shows the average annual number of severe thunderstorm warnings for a given location, with the bolded values representing the overall county average. Lorain and Cuyahoga Counties have the highest frequency, with specific locations in these counties averaging 18 to 19 warnings per year. Warnings counts generally decrease toward the west and south, likely reflecting lower population density and fewer spotter reports. Notably, the eastern portion of most counties averages 1 to 3 additional warnings per year than the western side. The spatial difference does not mean eastern areas experience more severe weather; rather, it reflects storm evolution. As thunderstorms track eastward across a county, they often will intensify, triggering a warning for the eastern half while the western half has already experienced the storm. |
.png) |
.png) |
Flash Flood Climatology An often overlooked weather hazard, flooding and flash flooding can pose significant risks to life and property. Occurring anytime during the year, high-water events can range from rapid-onset flash floods in urban locations to prolonged river flooding across regional watersheds. During the spring and summer, slow-moving, training thunderstorms can drop several inches of rain in just a few hours. Densely populated areas with paved surfaces are particularly vulnerable to rapid runoff, overwhelmed storm sewers, and submerged roadways. In the winter and early spring, heavy rain falling on frozen ground or melting snowpacks quickly fills local river basins. Ice jams on rivers can cause water to back up and inundate nearby communities. Whether it's a sudden summer downpour or a spring river crest, more weather-related fatalities occur annually from flooding than from tornadoes or severe winds. Remembering to "Turn Around Don't Drown" is a highly effective way to stay safe when water overtakes the roadway. |
|
Flash Flood Warnings are another frequent alert issued by the National Weather Service in Cleveland. These warnings are triggered when runoff from either prolonged moderate rain or sudden heavy downpours threatens to cause rapid flooding. The map on the right illustrates the average annual number of flash flood warnings per location, with the bolded values indicating each county's overall average. Cuyahoga County and Crawford County, PA, average the most, with specific locations receiving about 4.1 warnings per year. In Cuyahoga County, this higher frequency likely sources from its dense population and extensive urban runoff risk. In Crawford County, PA, the primary driver is likely its large geographical size and its topography, making low-lying areas more prone to flash flooding. Overall, warning counts tend to be higher in more urbanized areas, but this reflects population and infrastructural density rather than an absence of flash flooding in rural communities. |
.png) |
|
|
Precipitation Extremes Extreme precipitation events are a primary driver of flash flooding across northern Ohio and northwest Pennsylvania. Looking at historical records spanning from 1871 through 2025, every single county in the NWS Cleveland CWA has experienced a 24-hour rainfall event of at least four inches, with the maximum amount occurring in Erie County, PA, reaching 10.37 inches on July 22, 1947. What stands out in the historical data is how widely spread the dates of record daily precipitation are. Rather than a single system smashing records for the entire region, individual county records occurred across vastly different years and decades. Because these extremes are often brought about by slow-moving thunderstorms training over a specific area, record-breaking rainfall rarely impacts every county simultaneously. However, the distribution of these dates proves that every community in northern Ohio and northwest Pennsylvania has a distinct, proven history of heavy precipitation. |
The table below provides further information on where and when the record one-day precipitation amount occurred in each county. Most of these extreme precipitation totals occurred during the summer months, though a few did occur in the late winter and early spring, showing how flooding and extreme precipitation can occur at any time of the year. Four of the thirty counties in NWS Cleveland's CWA experienced their record daily precipitation totals on July 5, 1969, following a destructive derecho that occurred the night before.
| County | Location | Precip. Amount | Date | County | Location | Precip. Amount | Date |
| Ashland | Mohicanville Dam | 8.96" | July 5, 1969 | Mahoning | Canfield 1 S | 5.40" | July 22, 1897 |
| Ashtabula | Jefferson | 7.15" | June 7, 1947 | Marion | La Rue | 6.03" | March 17, 1942 |
| Crawford OH | Bucyrus | 8.68" | August 21, 2007 | Medina | Brunswick 0.5 NE | 4.79" | August 15, 2011 |
| Crawford PA | Saegerstown | 5.66" | July 18, 1897 | Morrow | Mt Gilead Lakes Park | 5.81" | July 1, 1987 |
| Cuyahoga | Strongsville | 6.63" | August 27, 1903 | Ottawa | Port Clinton 2.5 W | 6.25" | August 24, 2023 |
| Erie OH | Milan 1 SE | 7.15" | February 22, 2000 | Portage | Berlin Lake | 9.29" | March 17, 2004 |
| Erie PA | Erie Intl Airport | 10.37" | July 22, 1947 | Richland | Mansfield 5 W | 5.19" | August 21, 2007 |
| Geauga | Chardon | 5.50" | July 28, 2006 | Sandusky | Fremont | 7.95" | July 5, 1969 |
| Hancock | Findlay WPCC | 6.25" | September 1, 1959 | Seneca | Tiffin | 6.24" | July 23, 2011 |
| Holmes | Millersburg | 6.79" | August 7, 1935 | Stark | Alliance | 5.26" | July 10, 1937 |
| Huron | Norwalk WWTP | 9.02" | July 5, 1969 | Summit | Akron | 6.78" | June 30, 1989 |
| Knox | Greer | 6.62" | July 11, 2006 | Trumbull | Warren 3 S | 4.92" | September 2, 1972 |
| Lake | Painesville 4 NW | 7.30" | July 20, 2013 | Wayne | Wooster Exp Station | 9.37" | July 5, 1969 |
| Lorain | Lorain 2.6 NE | 6.34" | August 24, 2023 | Wood | Toledo Exec Airport | 5.78" | June 27, 2015 |
| Lucas | Toledo Blade | 5.93" | September 4, 1918 | Wyandot | Upper Sandusky | 9.35" | August 21, 2007 |
Data sources used in this page include the United States Census Bureau County Boundaries Shapefile, Storm Prediction Center Severe Weather Climatology Viewer, NCEI Storm Events Database, Iowa Environmental Mesonet Watches, Warnings, and Advisories, NWS Rivers of the U.S. Shapefile, and SC ACIS.
.png) |
Snowfall Extremes Residents of northern Ohio and northwest Pennsylvania are well-versed in heavy snowfall events, but the regional distribution of wintry precipitation varies significantly across the area. The snowfall map to the left highlights the maximum one-day snowfall event by county, showing a distinct spatial pattern dominated by lake-effect snow mechanics, especially in the northeastern counties. Seasonal accumulation totals generally rise from west to east across the region. Counties located farther to the west experience lower snow totals annually while counties situated directly downwind of Lake Erie consistently receive the most snow each winter. Cold, arctic air traveling over the relatively warm waters of Lake Erie picks up moisture and deposits heavy, narrow snow bands across these areas. The peak snowfall totals on the map correspond with the areas that receive the most lake-effect snow, with Erie County, PA, recording the highest single-day total of 32.4 inches in 2017. As winter storms move eastward and align with prevailing westerly winds, the fetch across Lake Erie maximizes, leaving the primary snowbelt counties significantly more prone to extreme snowfall events than western counties. |
The table below provides further information on where and when the record one-day snowfall amount occurred in each county. The four highest daily totals occurred in the northeastern counties of NWS Cleveland's CWA, where lake-effect snow can cause extreme snowfall reports to occur. Three counties experienced their highest daily snowfall amounts on November 24-25, 1950, with Lorain, Lake, and Crawford (PA) Counties experiencing well over one foot of snow. Four additional counties experienced their highest daily snowfall in late December 2004 during a severe winter storm just before Christmas Day.
| County | Location | Snowfall Amount | Date | County | Location | Snowfall Amount | Date |
| Ashland | Charles Mill Lake | 16.0" | January 13, 1964 | Mahoning | Canfield 1 S | 14.0" | January 13, 1964 |
| Ashtabula | Geneva 4 SW | 23.0" | December 9, 1962 | Marion | Prospect | 15.0" | December 23, 2004 |
| Crawford OH | Bucyrus | 16.7" | December 23, 2004 | Medina | Chippewa Lake | 22.0" | November 9, 1913 |
| Crawford PA | Meadville 1 S | 23.1" | November 25, 1950 | Morrow | Cardington | 11.0" | February 17, 1910 |
| Cuyahoga | Cleveland (Euclid Ave) | 17.4" | November 10, 1913 | Ottawa | Put-in-Bay | 13.0" | December 26, 1926 |
| Erie OH | Sandusky | 14.0" | February 28, 1984 | Portage | Ravenna 2 S | 18.0" | December 2, 1974 |
| Erie PA | Erie 5.6 SW | 32.4" | December 26, 2017 | Richland | Mansfield Lahm Intl Airport | 15.2" | December 22, 2004 |
| Geauga | South Russell 2 W | 18.9" | January 4, 2010 | Sandusky | Fremont | 13.0" | December 23, 2004 |
| Hancock | Benton Ridge | 20.0" | January 12, 1895 | Seneca | Tiffin | 14.0" | December 26, 1926 |
| Holmes | Millersburg | 18.0" | December 2, 1974 | Stark | New Berlin | 18.0" | April 20, 1901 |
| Huron | Norwalk WWTP | 14.0" | February 14, 2007 | Summit | Akron-Canton Airport | 19.7" | April 4, 1987 |
| Knox | Greer | 17.0" | January 27, 1978 | Trumbull | Warren 3 S | 30.0" | April 20, 1901 |
| Lake | Painesville 4 NW | 21.0" | November 24, 1950 | Wayne | Wooster Exp Station | 19.0" | December 2, 1974 |
| Lorain | Elyria 3 E | 16.5" | November 25, 1950 | Wood | Bowling Green WWTP | 13.0" | February 28, 1900 |
| Lucas | Toledo Blade | 18.0" | February 28, 1900 | Wyandot | Upper Sandusky | 12.0" | March 30, 1942 |
|
Extreme Cold While heavy snow and lake effect snow bands often dominate winter headlines, extreme cold is another dangerous hazard that occurs every winter across northern Ohio and northwest Pennsylvania. Every location within the NWS Cleveland coverage domain has recorded a low temperature of at least -20°F or colder, illustrating how severe arctic cold can affect the entire region, regardless of proximity to Lake Erie. The spatial distribution of these extreme low temperatures, however, reveals a clear trend: inland areas, primarily to the south and east, seem to experience colder temperatures than communities closer to the Lake Erie shoreline. The lake acts as a massive thermal buffer, moderating air temperatures for coastal locations during arctic outbreaks. As a result the region's all-time record low was set well inland at -37°F in Titusville, PA (located in Crawford County), on February 26, 1963, while multiple readings below -30°F have been recorded to the south and west of there. Beyond overnight minimums, daytime temperatures can also remain dangerously low during major arctic blasts. The record for the region's lowest maximum temperature occurred on January 20, 1985, when Findlay in Hancock County, OH, only reached -13°F. Spatially, the coldest daytime highs are heavily concentrated in the southern and western counties of the NWS Cleveland CWA. Lacking the immediate thermal presence of Lake Erie and sitting directly in the path of continental arctic surges coming from the High Plains and Upper Midwest, these inland areas struggle the most to recover during the daytime hours. Temporally, almost all record low maximums across northern Ohio and northwest Pennsylvania were established during just two infamous, generational Arctic outbreaks: the historic cold spells of January 1985 and January 1994. |
|
|
|
Extreme Heat While northern Ohio and northwest Pennsylvania are better known for winter weather, the region has seen a history of dangerously intense summer heat. The all-time regional record stands at 111°F, set in Bucyrus (Crawford County, OH) on August 7, 1918. Across the NWS Cleveland county warning area, temperatures exceeding 100°F are exceptionally rare in any given year, making these historical peaks true extreme events. A striking pattern on the map to the left is that the overwhelming majority of all-time record high temperatures were established during 1918, 1934, 1936, and 1938. The mid-1930s cluster coincides with the Dust Bowl, when severe national drought and very dry topsoil exacerbated heatwaves across the Great Lakes. Similar to the winter temperature distribution, for the most part, Lake Erie provides a moderating effect during summer heatwaves, keeping coastal counties slightly cooler than inland areas, though even lakeshore communities felt the brunt of the historic 1930s hot spells. When examining record high minimum temperatures (the warmest overnight lows on record), Lake Erie shifts from a cooling buffer to a heat reservoir. Because water retains thermal energy far longer than the land surface, nighttime temperatures along the immediate shoreline struggle to drop during summer heatwaves, keeping coastal communities warm well after dark. The regional peak stands at an anomalously high overnight low of 90°F, recorded in both Put-in-Bay (Ottawa County) on July 30, 1916, and Willoughby (Lake County) on July 18, 1930. Unsurprisingly, the majority of these warm overnight records are strung along the lakeshore. While these elevated low temperatures span a wide range of years, the historical distribution shows two distinct era. The initial wave occurred primarily during the widespread heatwaves of the 1910s and 1930s, but the region has experienced a notable modern resurgence, with an increasing number of record high minimums set between 2006 and 2013. |
Data sources used in this page include the United States Census Bureau County Boundaries Shapefile, NCEI Snowfall Extremes. and SC ACIS.
.png) |
Tropical Cyclone Climatology While northern Ohio and northwest Pennsylvania are safe from direct hurricane strikes, post-tropical remnants regularly track through or near the region during the late summer and fall. As these decaying tropical systems move inland, they bring deep tropical moisture that can interact with mid-latitude cyclones. This interaction can often yield some of the region's most extreme multi-day rainfall totals, triggering severe flash flooding and high river flow. Historical events like Hurricane Agnes in 1972 and the back-to-back impacts of Frances and Ivan in 2004 dropped record rainfall, causing extensive infrastructure damage across the region. Beyond heavy rainfall, tropical remnants can also deliver destructive high winds and severe lakeshore hazards. When a remnant low interacts with existing strong regional pressure gradients, it can produce widespread severe wind gusts well inland. A prime example of this occurred in September 2008, when the remnants of Hurricane Ike generated 70 to 80 mph wind gusts across northern Ohio, causing hundreds of thousands of people to lose electricity. Additionally, systems passing to the south or east of the area often produce strong, persistent northerly winds across Lake Erie. This creates lakeshore flooding, massive waves, and extensive shoreline erosion, as most infamously demonstrated during Superstorm Sandy in 2012. |
While no hurricane has ever entered the NWS Cleveland CWA at full strength, the region has experienced indirect and direct impacts of several notable tropical systems over the past century. The table below outlines major tropical cyclones, ranging from historic storms like Agnes (1972), Ike (2008), and Sandy (2012) to recent events like Beryl (2024) and Debby (2024), and notes their maximum overall intensity to their status as they passed through or near our area.
| Year | Name | Category over CLE CWA | Maximum Category | Year | Name | Category over CLE CWA | Maximum Category |
| 1892 | Four | Post-Tropical | Tropical Storm | 1988 | Gilbert | Tracked outside of CWA | Category 5 Hurricane |
| 1896 | Four | Tracked outside of CWA | Category 3 Hurricane | 1989 | Hugo | Tropical Storm | Category 5 Hurricane |
| 1902 | Two | Post-Tropical | Category 1 Hurricane | 1995 | Opal | Post-Tropical | Category 4 Hurricane |
| 1926 | One | Post-Tropical | Category 4 Hurricane | 1996 | Fran | Tropical Depression | Category 3 Hurricane |
| 1939 | One | Post-Tropical | Tropical Storm | 2003 | Isabel | Post-Tropical | Category 5 Hurricane |
| 1954 | Hazel | Tracked outside of CWA | Category 4 Hurricane | 2005 | Dennis | Remnant Low | Category 4 Hurricane |
| 1955 | Connie | Tropical Storm | Category 4 Hurricane | 2005 | Katrina | Tracked outside of CWA | Category 5 Hurricane |
| 1957 | Audrey | Tracked outside of CWA | Category 3 Hurricane | 2008 | Ike | Tracked outside of CWA | Category 4 Hurricane |
| 1968 | Candy | Tropical Depression | Tropical Storm | 2012 | Sandy | Post-Tropical | Category 3 Hurricane |
| 1969 | One | Subtropical Depression | Subtropical Storm | 2017 | Nate | Post-Tropical | Category 1 Hurricane |
| 1971 | Heidi | Tracked outside of CWA | Tropical Storm | 2018 | Florence | Tracked outside of CWA | Category 4 Hurricane |
| 1972 | Agnes | Tracked outside of CWA | Category 1 Hurricane | 2020 | Bertha | Remnant Low | Tropical Storm |
| 1976 | Three | Tracked outside of CWA | Subtropical Storm | 2021 | Fred | Tracked outside of CWA | Tropical Storm |
| 1979 | Frederic | Tracked outside of CWA | Category 4 Hurricane | 2024 | Beryl | Tracked outside of CWA | Category 5 Hurricane |
| 1985 | Juan | Tracked outside of CWA | Category 1 Hurricane | 2024 | Debby | Tracked outside of CWA | Category 1 Hurricane |
Notable Tropical System Hazards and Impacts
Decaying tropical systems regularly track through or near the Great Lakes and Ohio Valley during the late summer and autumn. As these post-tropical remnants interact with mid-latitude cyclones, massive plumes of tropical moisture can overspread the region. This frequently results in extreme rainfall rates that rapidly overwhelm infrastructure, as shown by multiple storms in our region's history. Tropical Storm Hugo (1989) dumped 4.30 inches of rain in just two hours, and a staggering 7 inches of rain fell in three hours during the post-tropical remnants of Hurricane Debby (2024), flooding the Cuyahoga River and shutting down Interstate 76 in Barberton.
Historically, it is also clear that tropical hazards exist far beyond heavy rainfall:
| Wind Damage | Coastal Flooding and Waves | Isolated Tornadoes |
| Despite the winds potentially decreasing following initial landfall along the Gulf or East Coast, high winds can accompany the remnants of tropical cyclones in our area. The remnants of Hurricane Ike (2008) delivered hurricane-force gusts across northern Ohio, causing over $300 million in damage, cutting power to over 310,000 customers, and resulting in two fatalities and several injuries. | Strong pressure gradients from passing systems create severe lakeshore hazards. During October 1995, the remnants of Hurricane Opal produced northeast winds gusting to 70 mph and generated 10- to 14-foot waves on Lake Erie. Additionally, Superstorm Sandy (2012) caused Burke Lakefront Airport to report wind gusts up to 68 mph. The winds of this caliber created waves of 15 to 20+ feet, resulting in catastrophic coastal erosion, severe lakeshore flooding, and extensive damage to coastal property. | Decaying tropical systems carry strong low-level wind shear, which can occasionally create conditions favorable for brief tornadoes. In June 1968, the remnants of Tropical Storm Candy spawned a mini-outbreak of five tornadoes across eastern Ohio as they passed through the area. No other particularly notable tropical-induced tornadoes have occurred within our region, though they have occurred in neighboring forecast areas from other systems. |
The areal impact of tropical systems is not a recent phenomenon. As far back as 1896, torrential rains from the remnants of a category 3 hurricane famously disrupted William McKinley's presidential campaign events in Canton. More recently, the remnants of Tropical Storm Bertha (2020) set the record for the earliest former tropical cyclone to impact Ohio on record when it passed through during late May, proving that tropical weather remains a complex and persistent hazard across the region.
Data sources used in this page include the United States Census Bureau County Boundaries Shapefile and IBTrACS Tropical Cyclone Data.
 |
Media use of NWS Web News Stories is encouraged! Please acknowledge the NWS as the source of any news information accessed from this site. |
|




.png)
.png)
.png)
.png)
.png)
.png)
.png)
.png)
.png)
.png)
.png)
.png)
.png)
 Radar
Radar Current Weather
 Rivers & Lakes
 Satellite
 Forecast Maps
 Hour by Hour Forecast
 Tropical Weather
 Graphical Hazards
 Weather Hazard Briefing
 Forecaster's Discussion
 Text Bulletins
 Climate
 Skywarn
 Submit Storm Report
 NOAA Weather Radio
 Marine Forecasts
 Beach Forecast
 Drought
 Follow us on X
 Follow us on Facebook
 Follow us on YouTube
 CLE RSS Feed