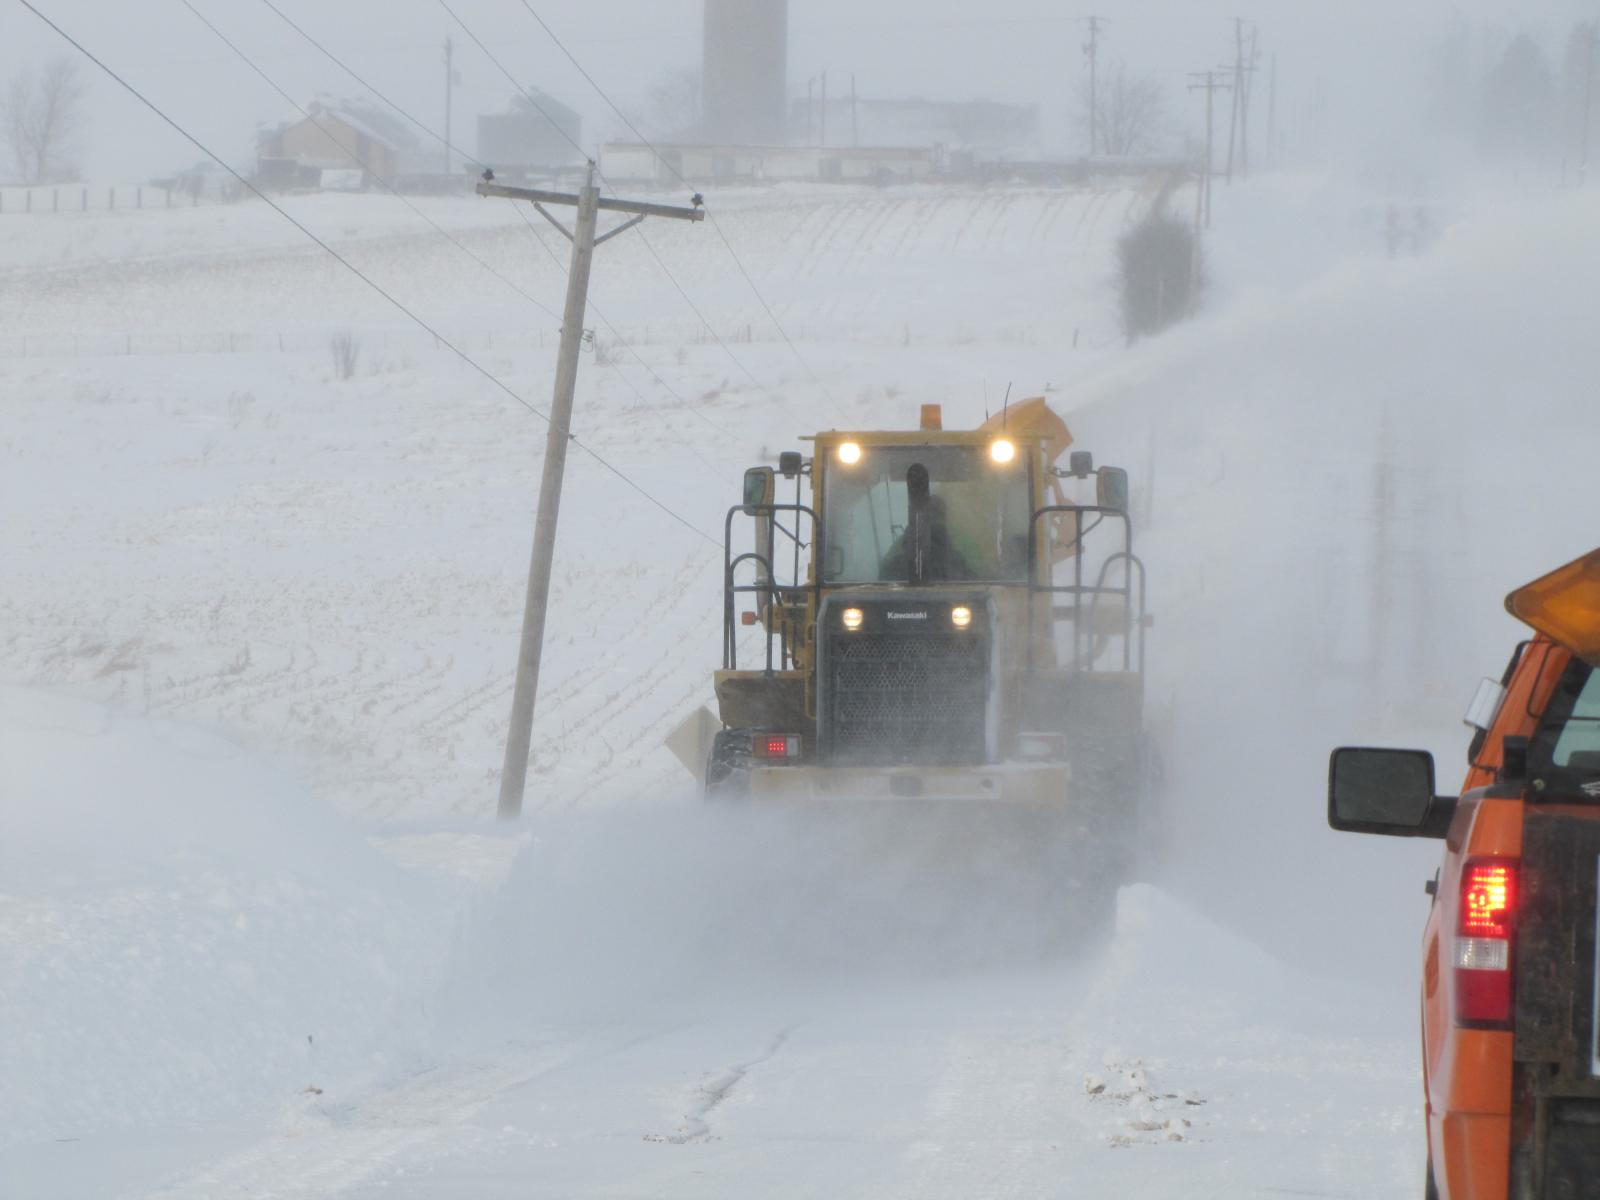
Snow removal equipment in Mahaska County. Photo from Mahaska County Emergency Management. Used with Permission.
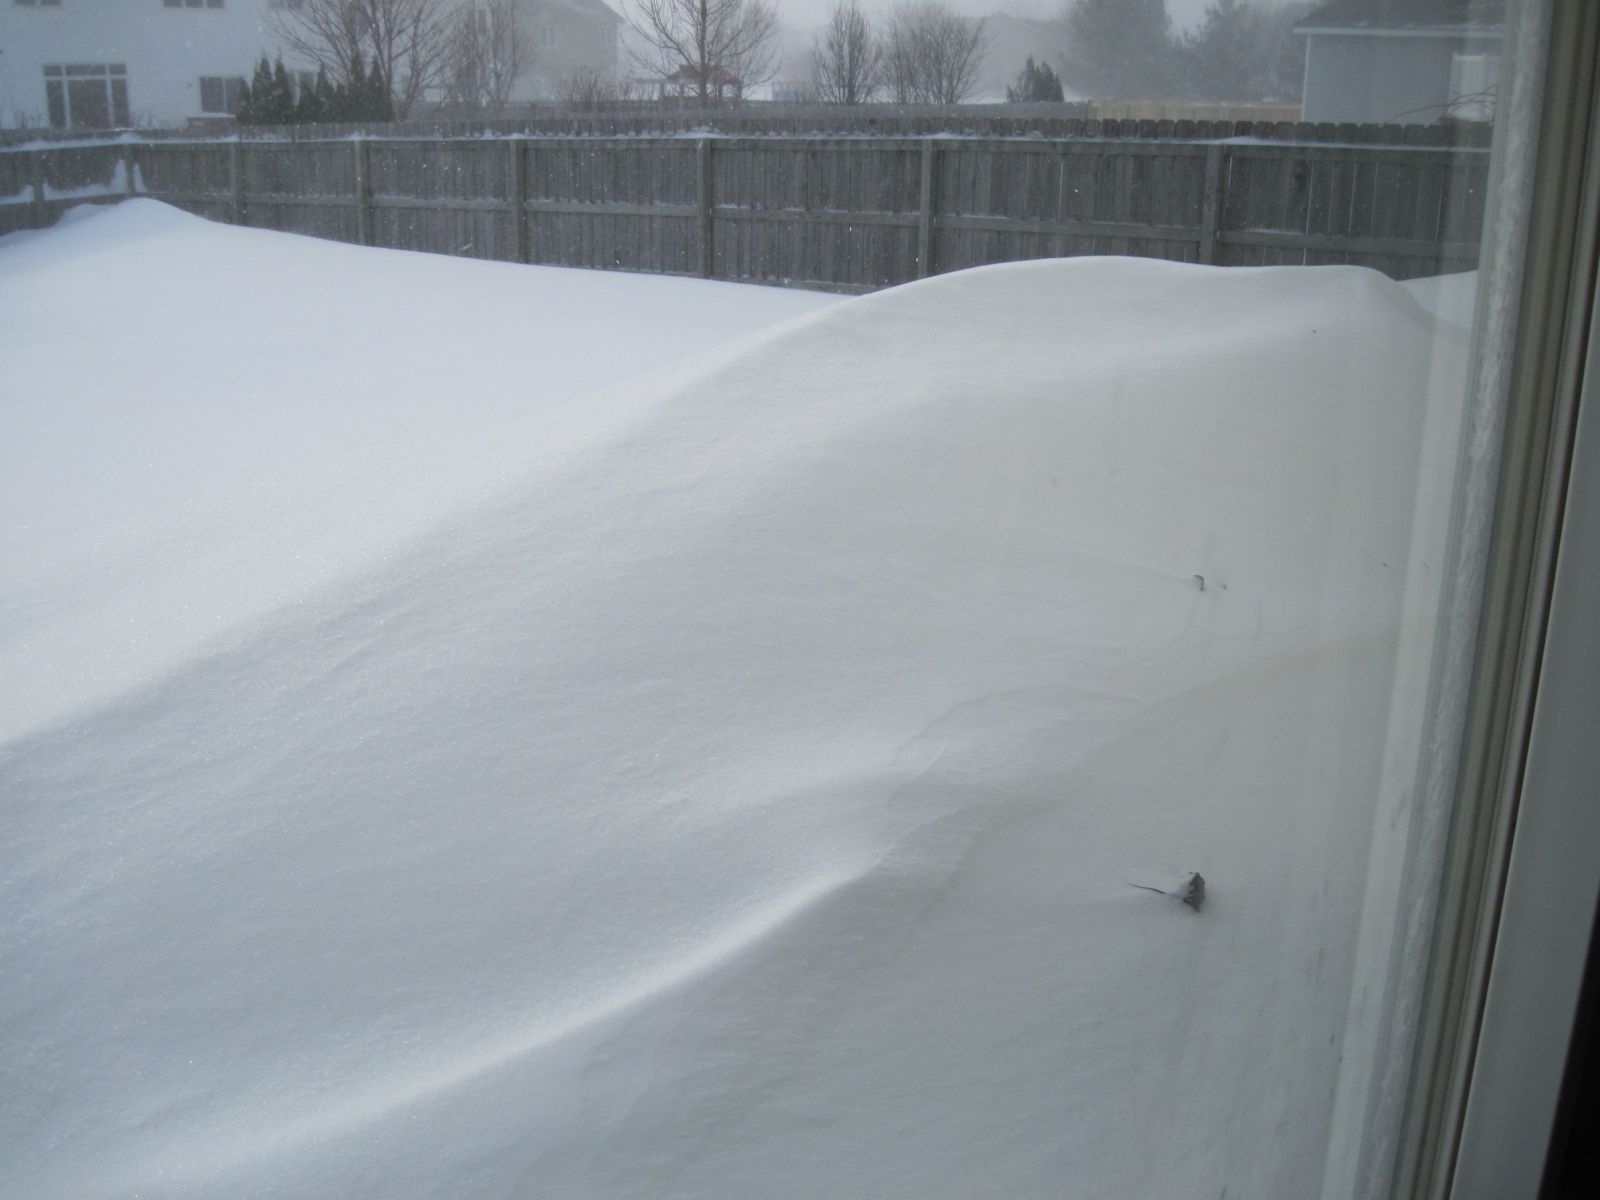
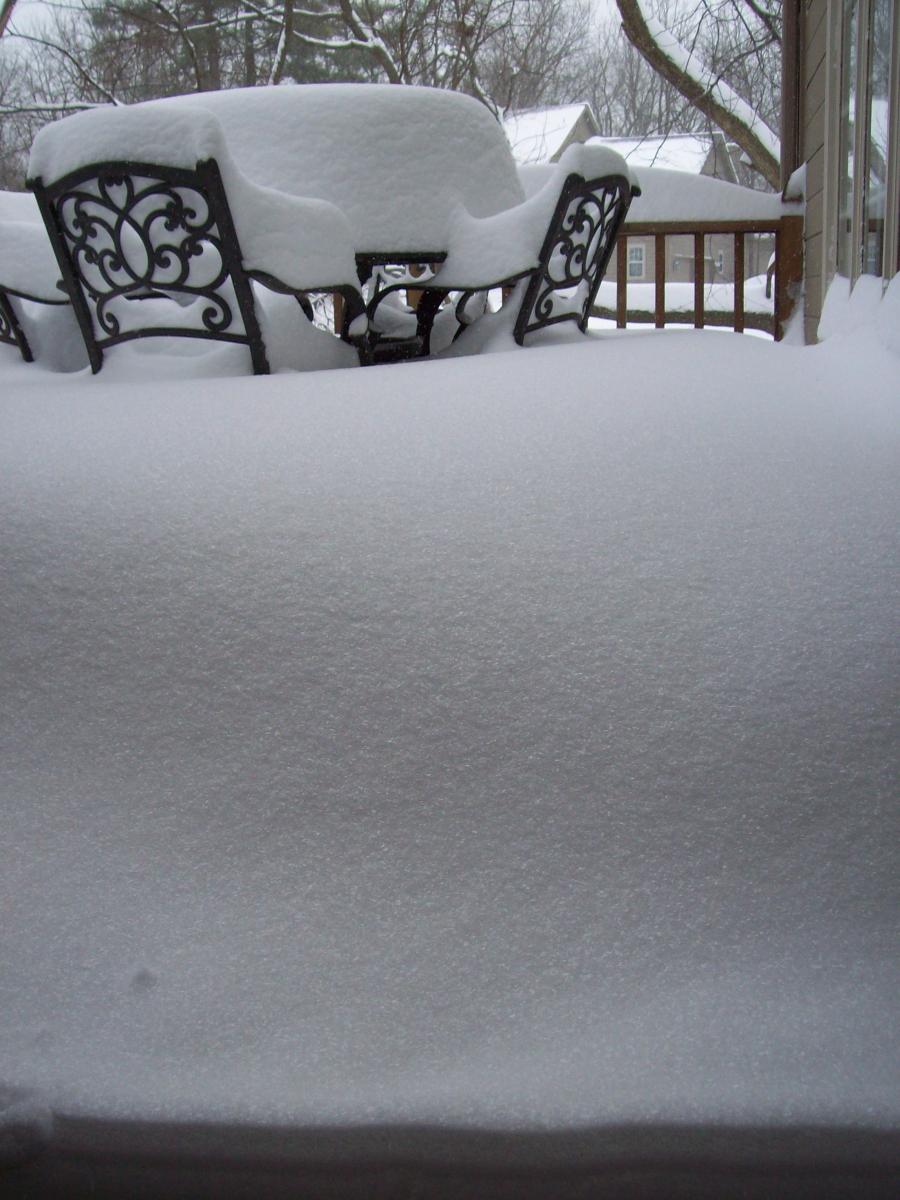
Large snow drift in an Ankeny resident's backyard. Photo Courtesy of Jeff Zogg, NWS Des Moines employee.
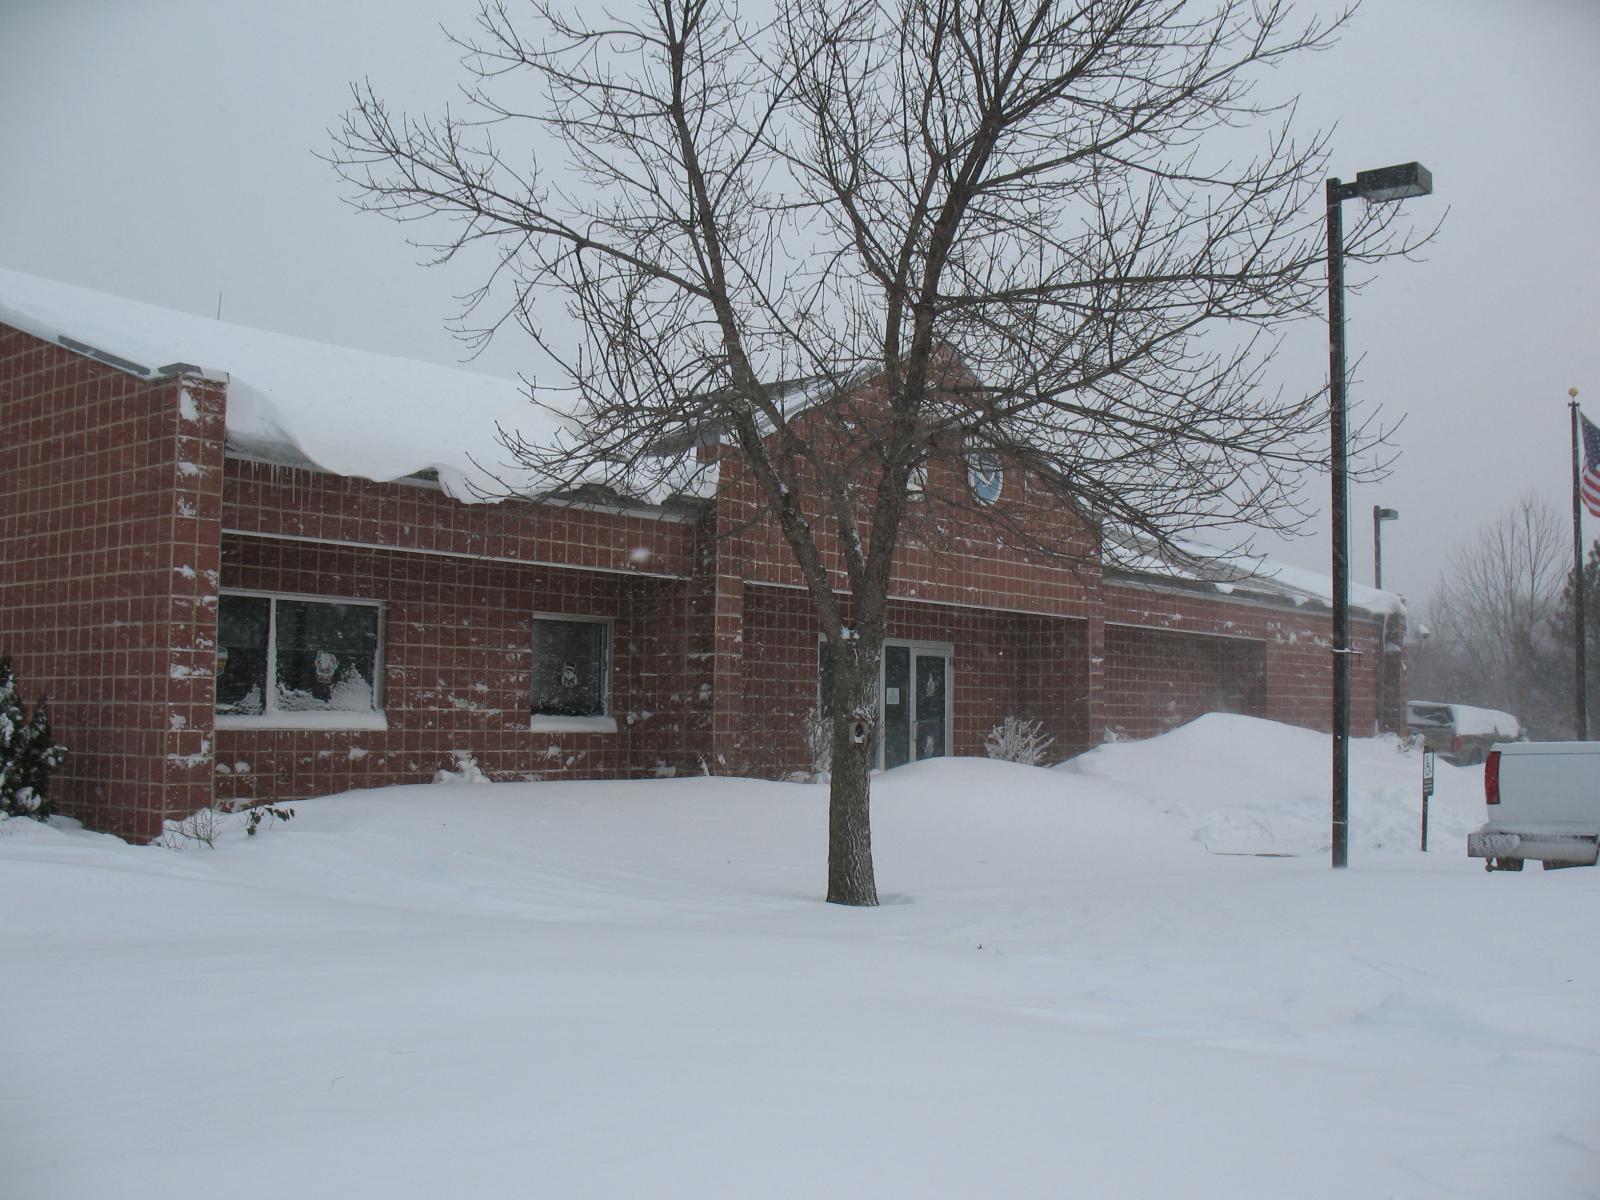
Plenty of snow at the NWS office in Johnston.
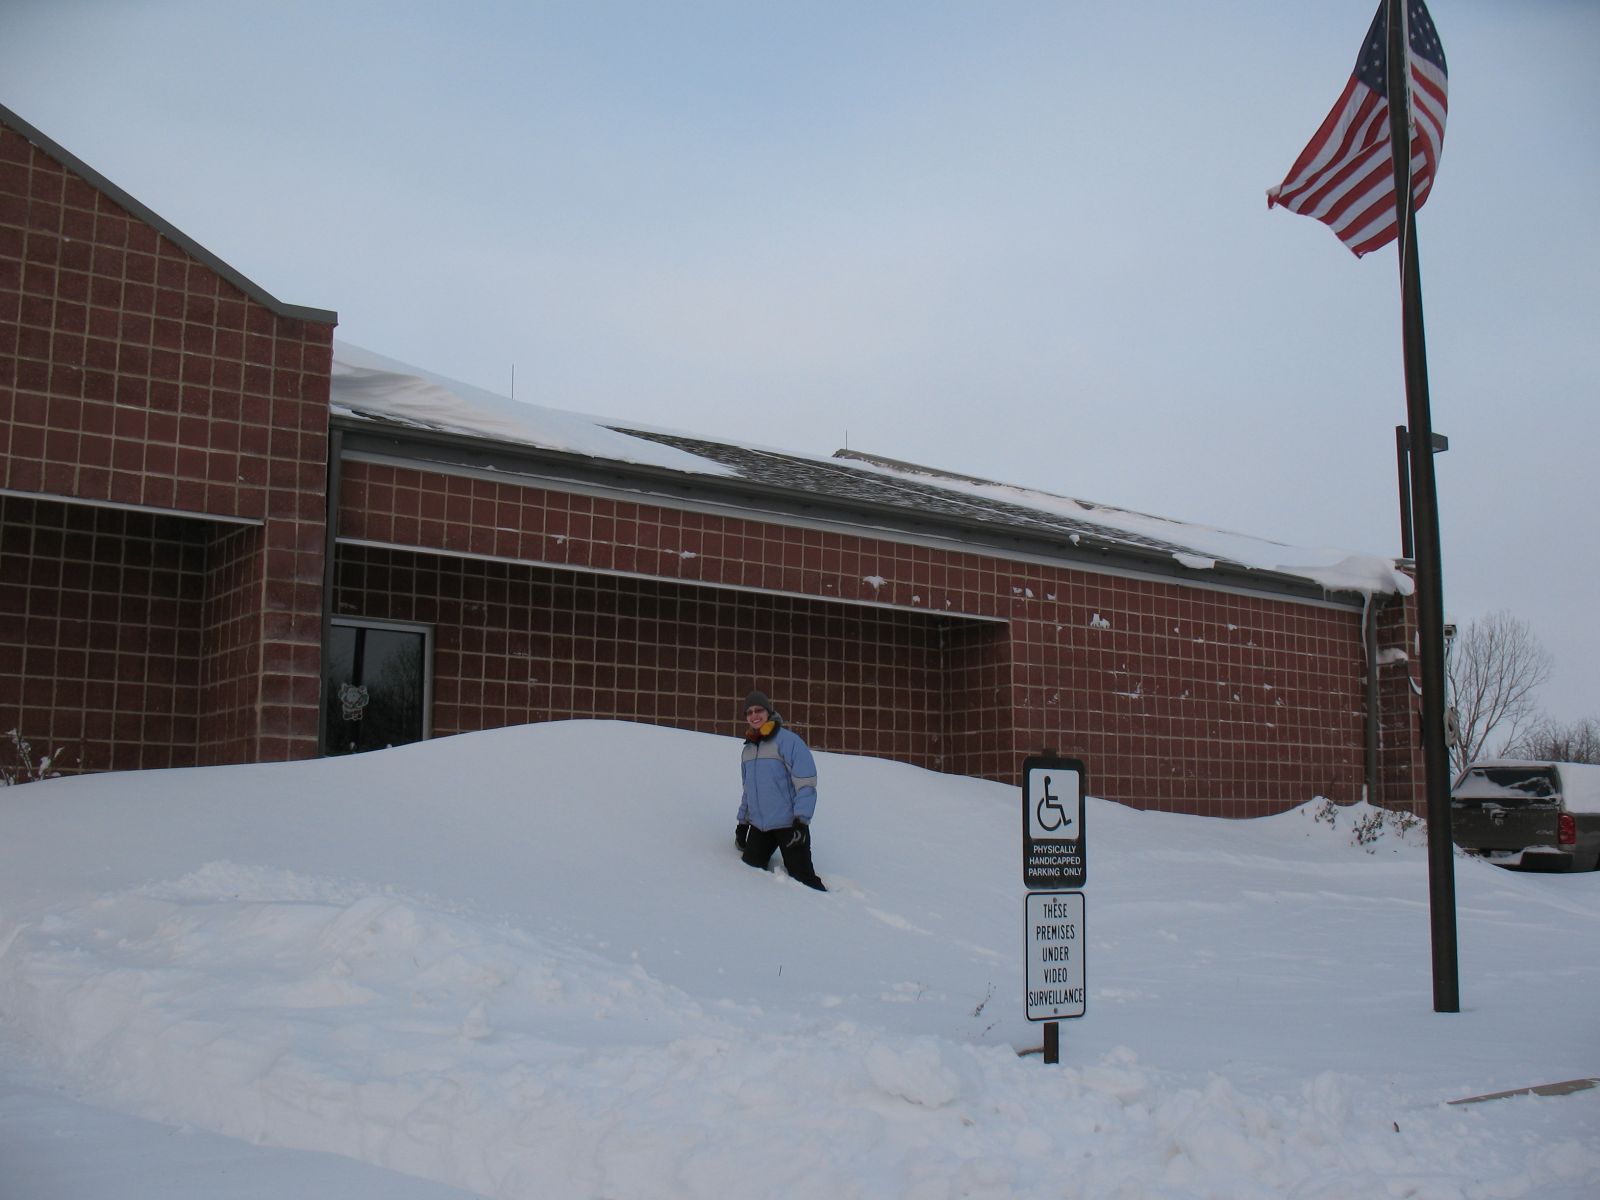
Drifts as tall as a forecaster at the NWS office in Johnston.
Big snow drifts in Grimes, Iowa. Photo courtesy of Ken Podrazik, NWS Des Moines employee.
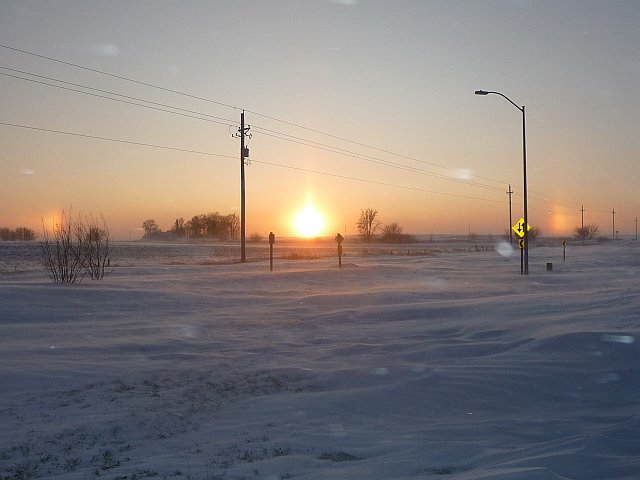
Sun dog on December 9, 2009, after the snow ceased but the strong blustery winds continued.
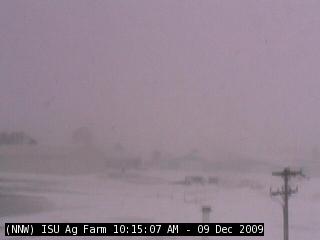
KCCI webcam on the ISU Ag Farm on the morning of the 9th. Photo Courtesy of KCCI. Used with Permission.
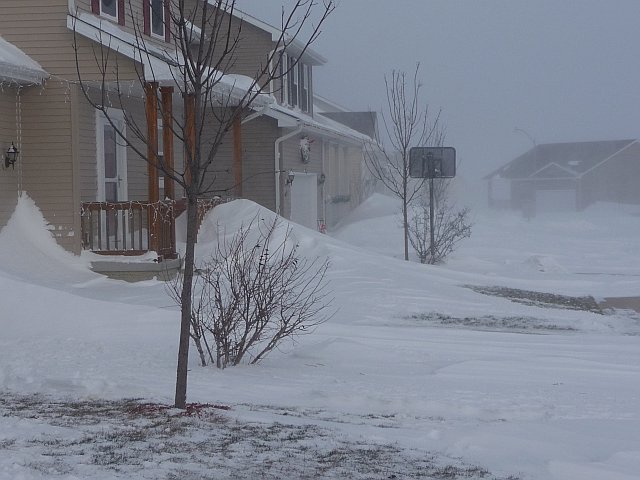
North side of Des Moines. Photo courtesy of Matt Kelley. Used with permission.
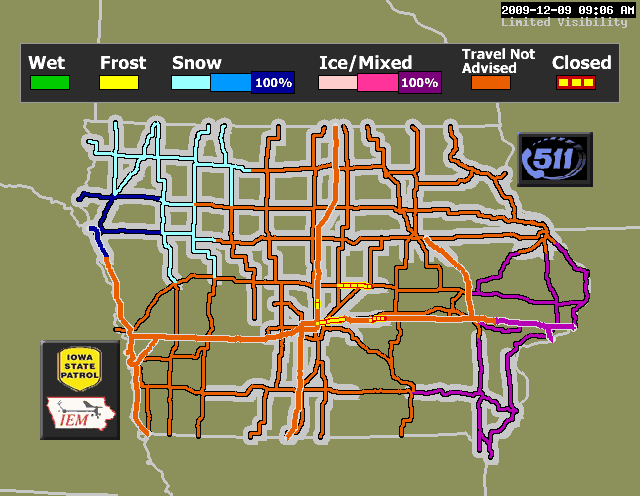
Figure 1: Road conditions Wednesday morning December 9, 2009. Image courtesy of Iowa State Patrol, IDOT, and IEM.
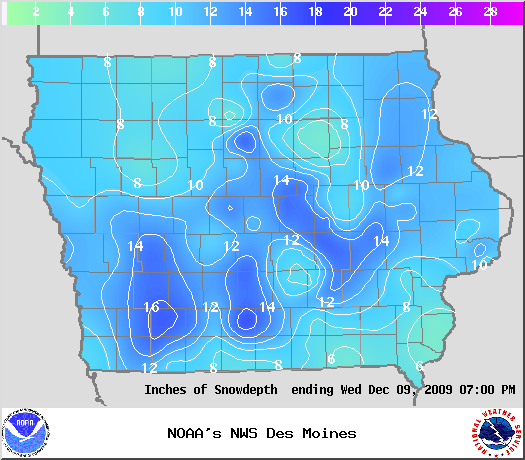
Figure 2: Total snowfall amounts across Iowa from the December 8-9, 2009 Blizzard. Snow totals ending at 7 PM on December 9, 2009.
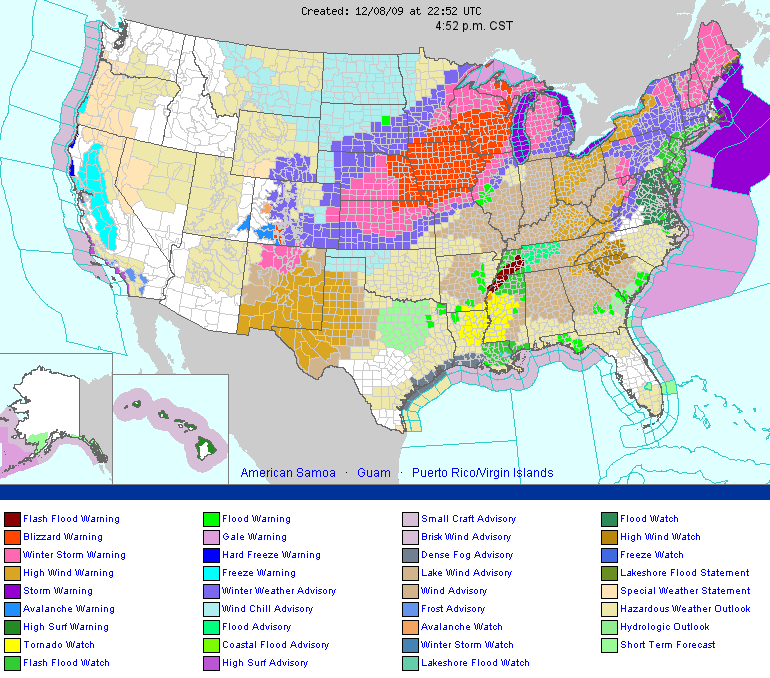
Figure 3: All 99 counties in Iowa had a blizzard warning in effect at 5 PM on December 8, 2009.
Image of most unstable CAPE values across Iowa during the blizzard. Note the area of 100 to 200 J/Kg (blue and green colors) of CAPE across southern Iowa.
Figure 4: Temperature difference across Iowa at 2 AM Wednesday morning December 9, 2014. Temperatures in the lower 30s were found in southeast Iowa while the northwest part of the state dropped to 5 to 10 above. Image via IEM.
Snowfall totals from the January 26, 1996 blizzard. The placement and intensity of the snow band from this event was very similar to the Dec 19-20, 2012 blizzard.
Figure 5: Visible satellite image from Thursday December 10, 2009 shows nothing but snow across much of the Midwest and Plains except for a few clouds over eastern Iowa.
Early in the event when there was mixed precipitation across southwest Iowa. Note the wide region of reduced CC (yellow and orange), with a distinct cutoff across southern Cass, Adair, Madison, and Warren Counties. Snow was falling north of this cutoff line (maroon colored CC and near zero ZDR). The radar is likely sampling large, water coated dendrites over Union and Ringgold counties where CCs fall to 0.80 or lower and ZDR values exceed 5-6 dB. An elevated melting layer was present at this altitude, which would cause a reduction of CC as snowflakes began to shed water droplets. An intense amount of lift in the dendrite production zone produced very large snowflakes, which when entering the melting level below and began accreting water on their surfaces, appeared as large, flat raindrops (flat because the dendrites fall with their face parallel to the ground).
Another example of a band of large, melting snowflakes over Winterset with mixed precip to the south and snow to the north. This band of large snowflakes is more noticeable on conventional reflectivity than the previous example.
Late in the evening, with the transition zone between rain and snow across central Marion, Warren, and Madison counties, then turning to the south into Clarke County. Areas to the south and east of this zone show up as primarily rain (higher ZDR values in this region indicate the presence of rain drops more so than snow), mixed in with snow in a few locations (0.90 to 0.95 CC values). Given that the beam height is several thousand feet above the ground in this location and the melting layer extended down to almost the surface, this precipitation more than likely reached the ground as rain. Note the pockets of rain mixed with snow outside of the main transition zone over western Madison County and in the lower left corner of the image.
Overview across southern Iowa around 9:00pm on the 19th, showing how well the dual-pol products are capturing the rain/snow line (black line) versus the conventional reflectivity in the top left. The rain/snow line becomes somewhat diluted west of Osceola, where the areas of rain become more cellular in nature with snow filling in the holes. Note the heavier bands of snow showing up northeast of Des Moines as a slight reduction in CC and elevated ZDR values.
Close up over south central Marion County around 11pm on the 19th, showing a snow shower (black circle) embedded in a rain/snow mix. Again, this does not show up in conventional reflectivity.
The rain/snow line becoming more diluted and pushing east by 1am on the 20th. Pockets of all snow are starting to show up even on the warm side of the black line. All snow is present to the north and west of the line.
A look across central Iowa by 4am on the 20th, showing all snow present with the system now (CC values near 1.00 and ZDR values close to 0 dB). Some banding structures are noticeable in ZDR, especially west of Des Moines (a few are visible to the east as well in ZDR). The reduction in CC and increase in ZDR over the western CWA is likely due to a change in ice crystal type. See the next image for a better example of this phenomenon.
A interesting feature noted on the backside of this system as it left the area in the late morning. Very high ZDR and somewhat noisy CC values were noted for several hours with this back edge. Reflectivity values in this region were low (10-15 dBz), so it is possible this could be an artifact of low signal to noise ratio. However, given its persistence and the cold air advection on the backside of the storm, this could be a region of high density ice crystals (plates) instead of snow.
A Blizzard that People Remember
A major blizzard blasted Iowa on December 8-9, 2009. NWS Des Moines Meteorologists still reminisce and discuss this high-impact event as it produced some memories they won’t soon forget. For instance, it took a few forecasters at least 3 times longer to make it to work to cover their shift on that snowy Tuesday into Wednesday and a couple even stayed the night in the office on cots to wait out the storm! A recently hired intern had the task of measuring snowfall in the blizzard and when she went out at midnight Tuesday night on the 8th, she learned the hard way to always bring her security card with her in order to re-enter into the building as she locked herself out. Other forecasters remember being snowed-in and digging out 6 foot drifts from their driveways on Wednesday.
The storm began early Tuesday morning on December 8th when light to moderate snowfall extended across central to southern Iowa. The snow slowly spread over the rest of the state and intensified during the afternoon and evening hours and significantly affected the Des Moines rush hour Tuesday night. Strong northwest winds increased to 25 to 35 mph and gusted to over 50 mph at times by late Tuesday night and continued into early Wednesday morning. There were even a couple of reports of wind gusts to 60 mph overnight Tuesday into Wednesday. The strong winds and heavy snow produced large drifts throughout the state, with several reports over 6 feet! Visibility became reduced significantly as widespread whiteout conditions were observed from the overnight hours Tuesday into Wednesday before improving Wednesday afternoon. Travel became impossible or nearly impossible across much of Iowa due to the large drifts and widespread white-out conditions (See Figure 1).
 |
 |
 |
|
Figure 1
|
Figure 2
|
Figure 3
|
 The powerful storm dropped anywhere from 8 to 17 inches over much of Iowa with the highest swath oriented southwest to northeast across the state (See Figure 2). In fact, the statewide average storm total snowfall was 10.2 inches became the highest storm total since 1971 and the third-highest on record in Iowa. Some of the higher totals around the state included 15.5 inches in Des Moines, 16.0 inches in Atlantic and Belle Plaine, 16.2 inches in Corning and Osceola, and a whopping 17.0 inches in Knoxville. Des Moines recorded its fourth-heaviest snow storm on record behind the December blizzard of 1888, the New Year’s storm of 1942, and the blizzard of March 2004.
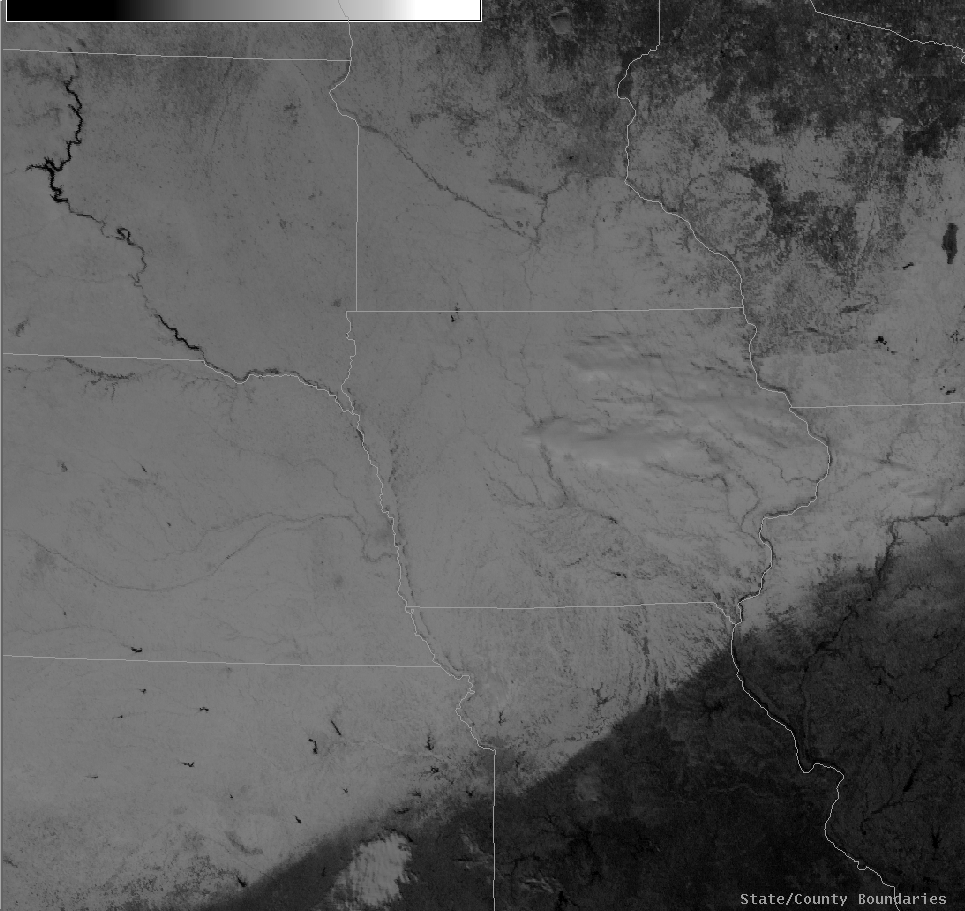 The severity of the storm affected the surrounding states of Iowa as well. Blizzard warnings covered portions of eastern Nebraska, southern Minnesota, northern Missouri, the southern half of Wisconsin, and far northeast Kansas. All 99 counties in Iowa were under a blizzard warning Tuesday night into Wednesday (See Figure 3). A temperature gradient across Iowa late Tuesday night was about a 25 degree difference from southeast to northwest Iowa (See Figure 4 above). By Wednesday afternoon, temperatures plummeted into the single digits to around 10 above, leading to wind chill values as low as -31°F at Mason City on the 9th. The snow finally tapered off by Wednesday afternoon but the howling winds continued into Wednesday night. High pressure built into the region and brought clear skies on Thursday allowing the large swath of snow to be seen on visible satellite (See image to left). If residents of Iowa remember, this big blizzard was just the beginning of a very active winter with frequent snowfalls and persistent deep snow pack across the state.
Photos and Video
Below are some photos taken across central Iowa after the blizzard.