Dangerous heat will expand from the Gulf Coast into the Southern Plains and Desert Southwest through week's end. Additional extreme heat impacting the Pacific Northwest will shift to the northern Plains by the weekend. Tropical Storm Bertha is expected to continue to impact portions of the northern Gulf Coast from the western Florida Panhandle to southeastern Louisiana through tonight. Read More >
| Climate/Almanac Data - JUL Normals - JUL Records | ||||||||||||||||||||||||||||||||||||||||||||||||||||||
| JULY | ||||||||||||||||||||||||||||||||||||||||||||||||||||||
|
||||||||||||||||||||||||||||||||||||||||||||||||||||||
| The ranking is listed in parentheses (__) when within the "Top 10". Note: Davenport and Iowa City do not have Top 10 listings due to a shorter period of record |
||||||||||||||||||||||||||||||||||||||||||||||||||||||
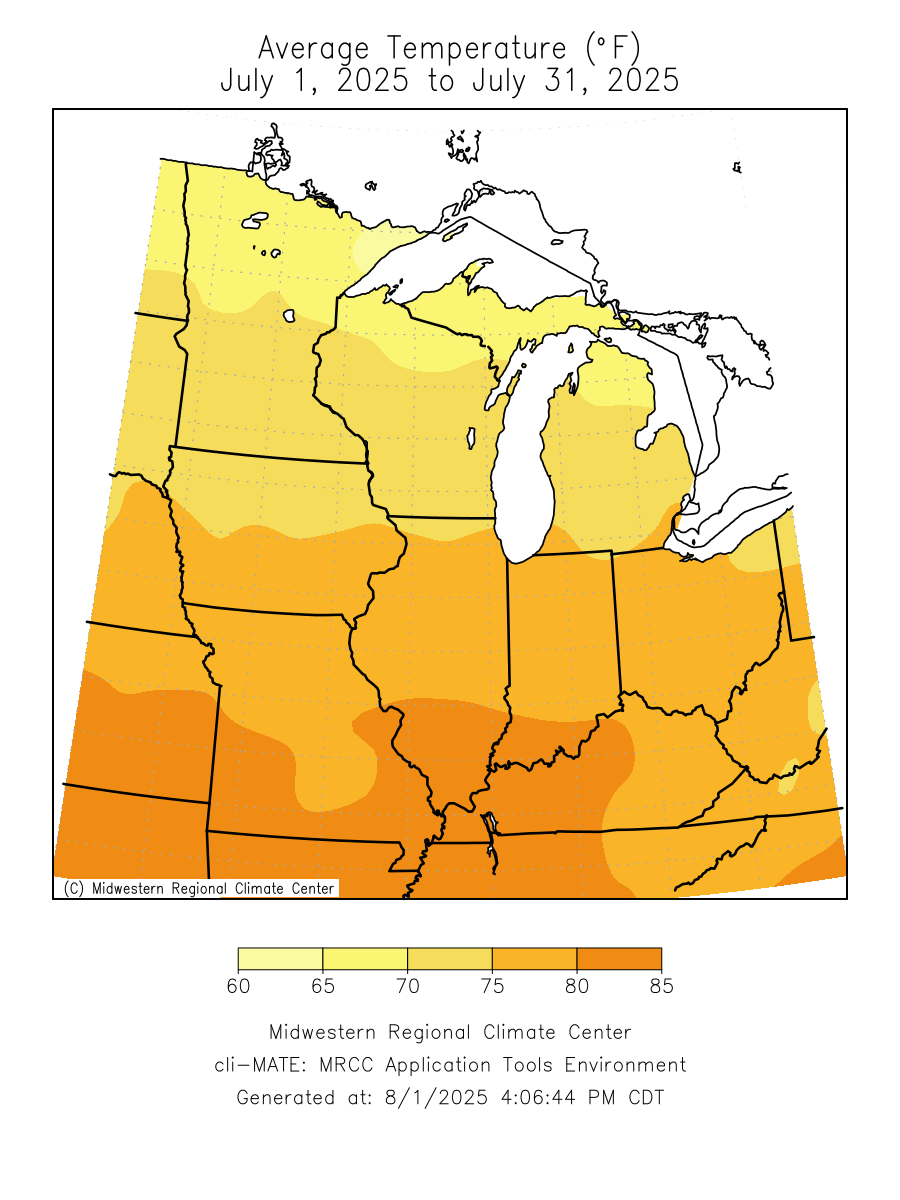
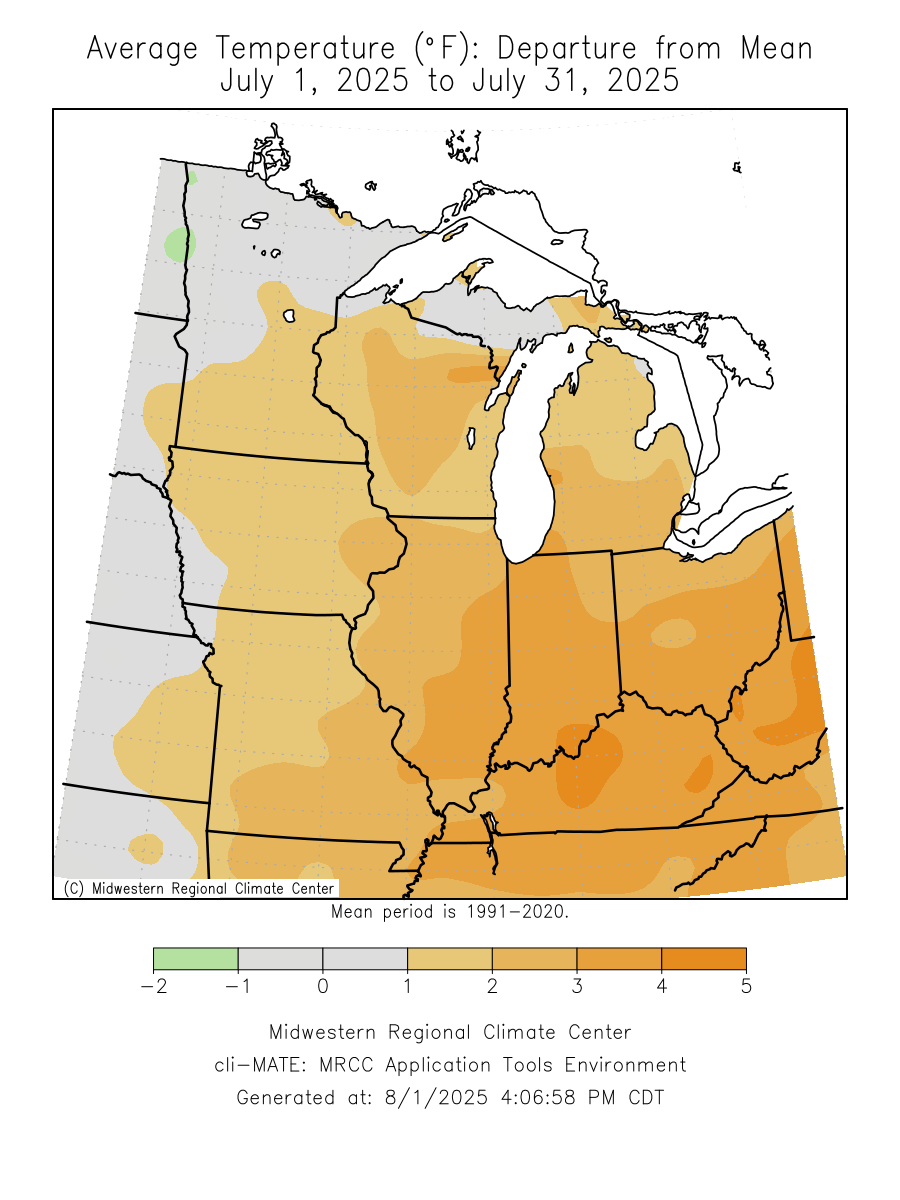
| July 2025 temperatures were 1.5 to 3 degrees above normal. | ||||||||||||||||||||||||||||||||||||||||||||||||||||||
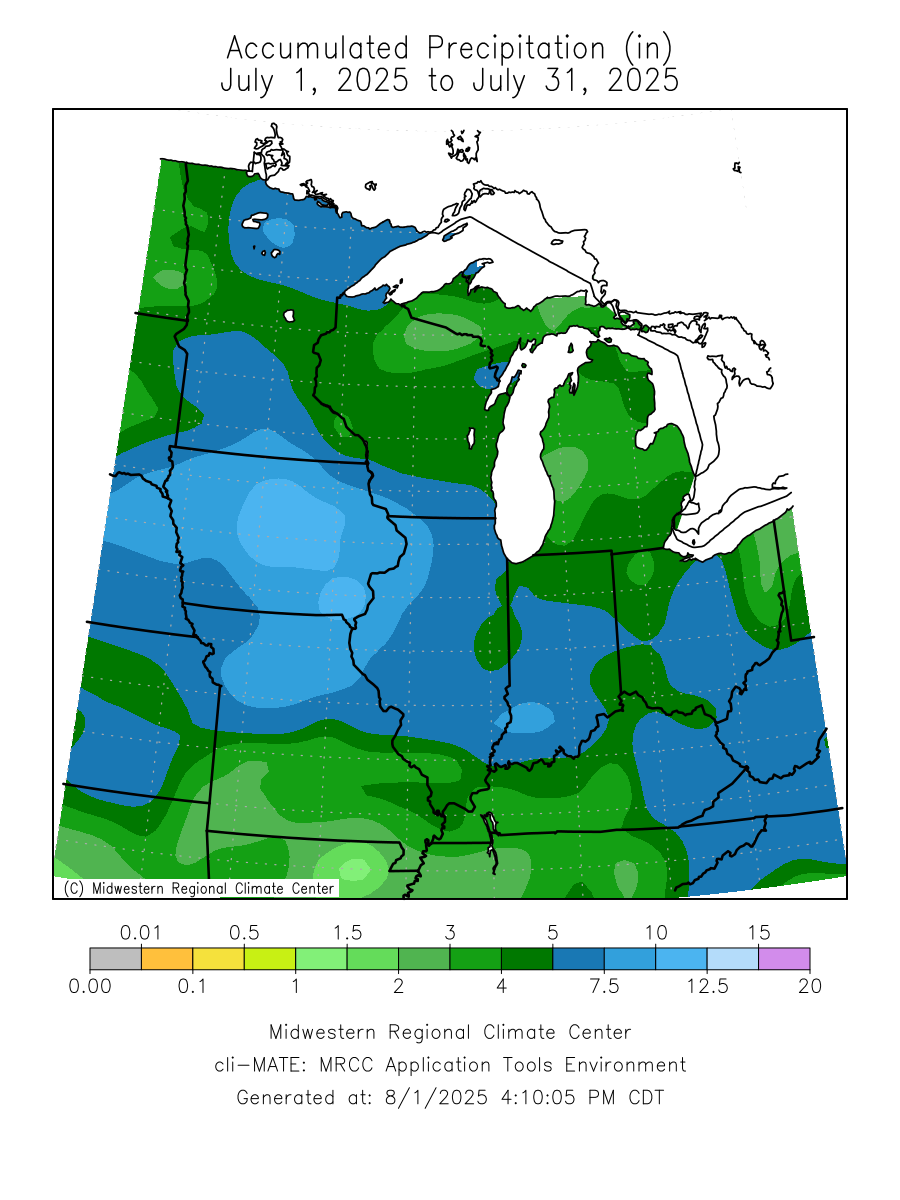
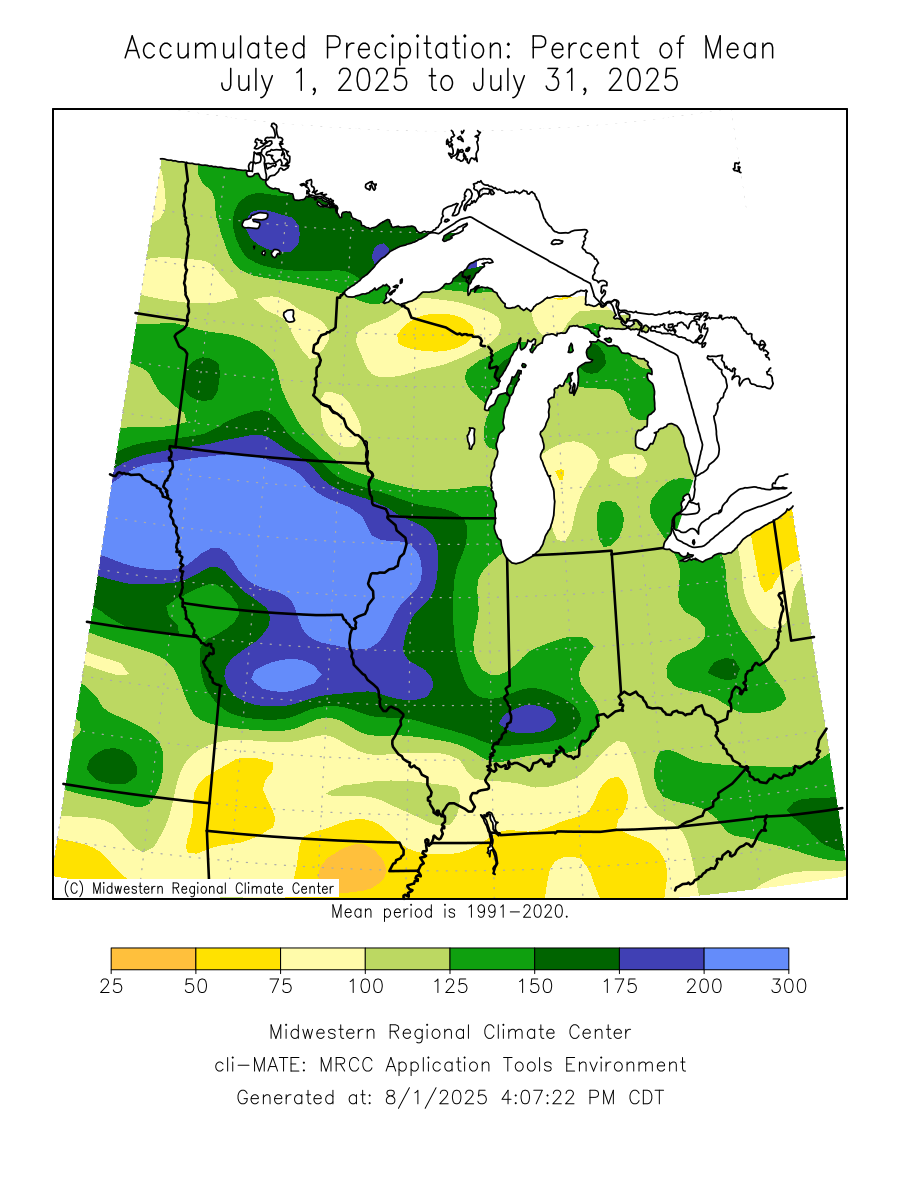
| Precipitation totals were well above normal for all climate sites. It was a Top 10 wettest month for Burlington, Dubuque, and Moline. There were three daily precipitation records broken during the month: Moline - 2.02" on 7/11, Burlington - 2.45" on 7/26, and Cedar Rapids - 1.27" on 7/30 |
||||||||||||||||||||||||||||||||||||||||||||||||||||||
| For more on the stormy and very wet pattern for July 2025, see this heat and heavy rain summary. | ||||||||||||||||||||||||||||||||||||||||||||||||||||||
|
||||||||||||||||||||||||||||||||||||||||||||||||||||||
| The climate maps below are courtesy of the Midwest Regional Climate Center. | ||||||||||||||||||||||||||||||||||||||||||||||||||||||
| These maps become available around 10 am on the first of the month. | ||||||||||||||||||||||||||||||||||||||||||||||||||||||
|
||||||||||||||||||||||||||||||||||||||||||||||||||||||
| A LOOK AHEAD | ||||||||||||||||||||||||||||||||||||||||||||||||||||||
| Climate Prediction Center | ||||||||||||||||||||||||||||||||||||||||||||||||||||||
|
||||||||||||||||||||||||||||||||||||||||||||||||||||||