
An upper trough and frontal boundary will focus showers and thunderstorms across portions of the Plains through this evening. A few severe thunderstorms along with heavy rainfall are expected. Meanwhile, low pressure off the Southeast Coast will bring inclement weather across the Carolina Shorelines through tonight. This system is forecast to meander off the mid-Atlantic coast early this week. Read More >
Jessica Brooks
NOAA/NWS WFO Quad Cities IA/IL
jessica.brooks@noaa.gov / @JessB_H20Wx
Presented by John Wetenkamp
NOAA/NWS WFO La Crosse, WI
-----------------------------------------------
2020 AMS Meeting - Boston
34th Conference on Hydrology
 |
| Link to .pdf version. |
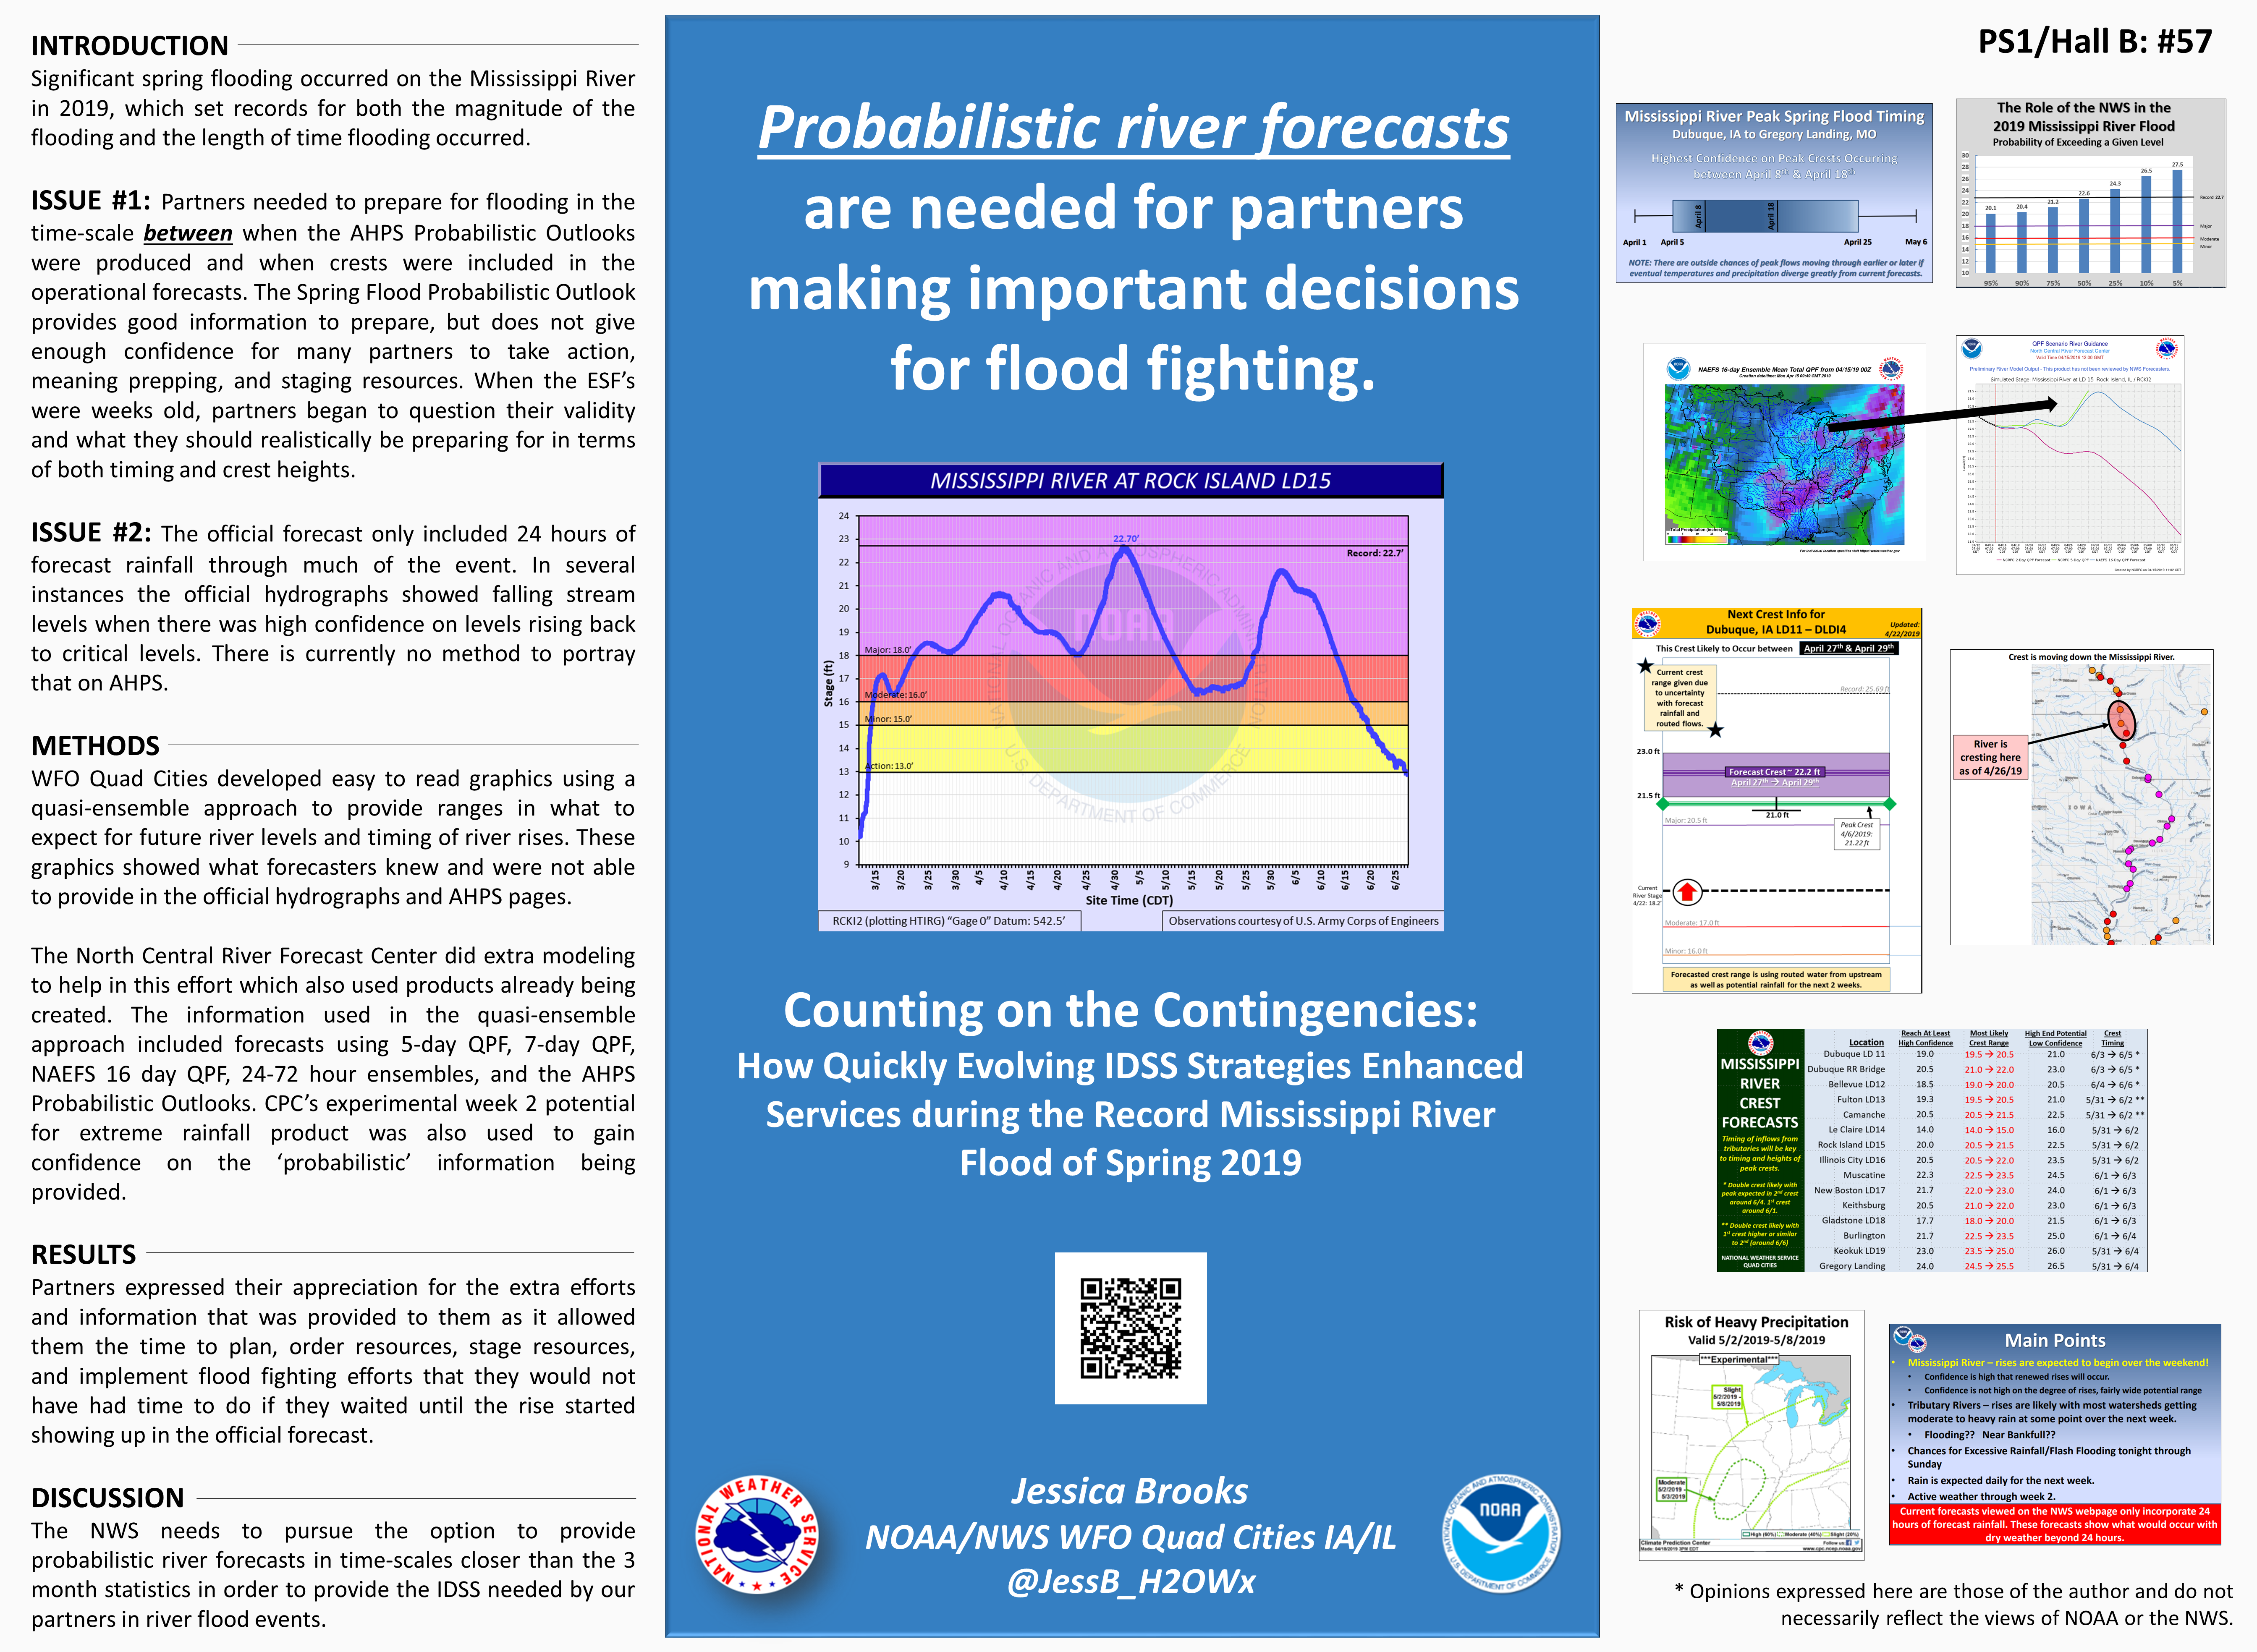
INTRODUCTION
Significant spring flooding occurred on the Mississippi River in 2019, which set records for both the magnitude and length of time of the flooding.
Weather Summary:
Wet fall conditions in September and October of 2018 set the stage for a busy spring 2019 as heavy rains and flooding occurred across the Upper Mississippi River watershed. Winter began with nearly saturated soils across a large portion of the watershed, then an arctic outbreak in late January caused deep frost to develop. Beginning in February, a very deep snowpack accumulated across Minnesota and Wisconsin as the storm track became very active and centered over the Upper Mississippi River region. The observed conditions by mid-February caused concern that spring flooding could be extremely impactful, but the severity of the flooding would still depend on the rate of the snow melt and how much additional precipitation would impact the region. By early March, the snowpack had built so much that there were high concerns of significant flooding.
Through much of the reach of the Mississippi River from Dubuque, Iowa through far northern Missouri, the probabilities for record flooding coming from the North Central River Forecast Center (NCRFC) in the updated Spring Flood Outlook were in the 40 to 50 percent range through the timeframe of mid-March through mid-June. These numbers put partners at high alert that this could be a very impactful flood event. Mid to late March brought about the melting of the snowpack, which turned out to be quite favorable as it melted in tiers within a 3-4 week time. However, the frozen and saturated ground, along with the shear amount of liquid in the snowpack moving into the river systems still caused a top ten flood event in many locations in early April. The fact that the snow melted slowly provides the realization that this initial crest in early April had the potential to be much higher had a faster melt occurred.
Additional heavy snow fell across Minnesota in April. That snow melted in a matter of 2 day and when combined with a continued wet pattern across the region through the end of the month into early May, the Mississippi River began to rise a second time resulting in higher crests in late April/early May. Following these peak levels, very wet conditions continued through May with numerous bouts with flash flooding and additional flooding on many local rivers. Across the Midwest, May 2019 was the 3rd wettest in history (since 1895) and was the 10th straight month with above normal precipitation (maps available from the Midwestern Regional Climate Center – www.mrcc.illinois.edu/cliwatch/1905/climwatch.1905.htm). The wet conditions along with the already very high river levels and saturated ground caused yet another rise of the river, with locations downstream of the USACE Lock and Dam 16 (Muscatine, IA) seeing their highest peak of the season.
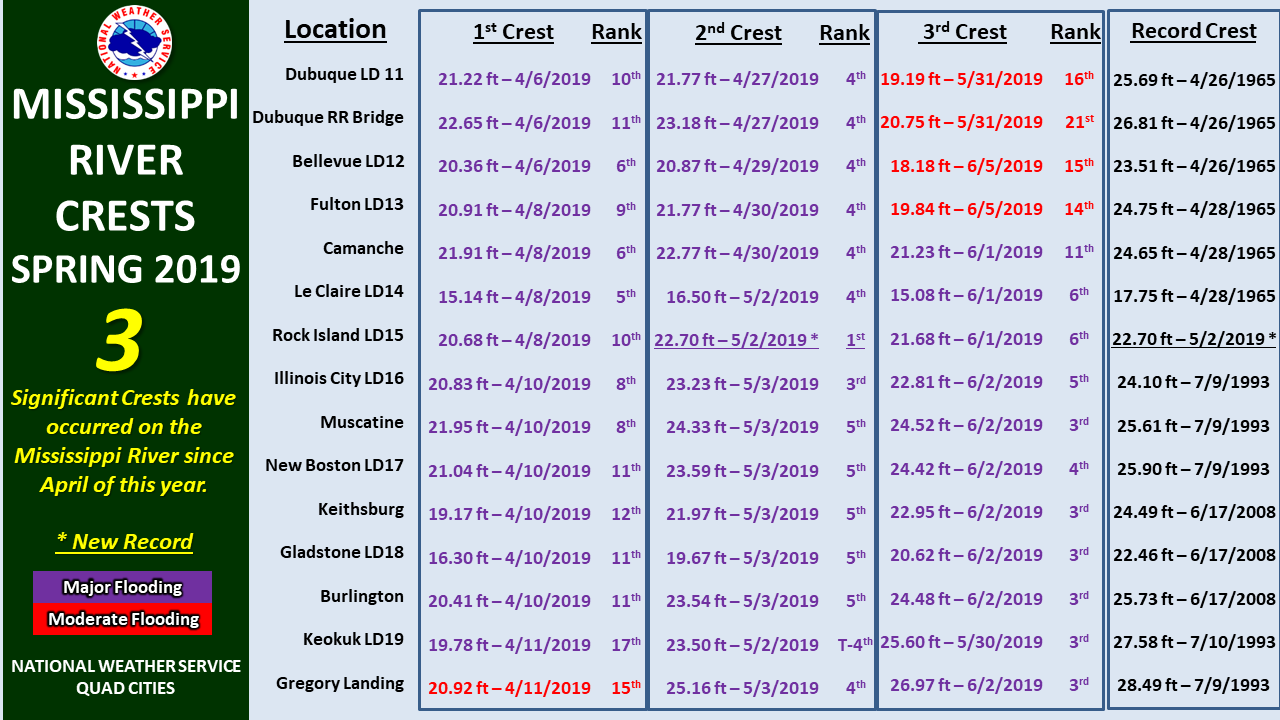
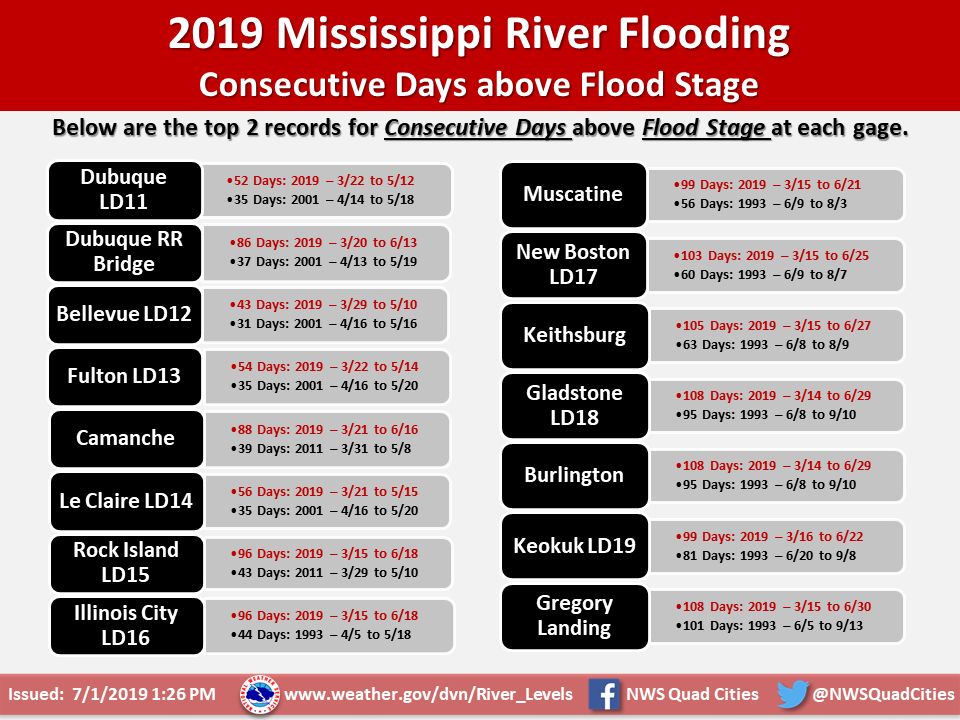
Overall, the 2019 spring flood season on the Mississippi River lasted 126 days, with records broken for consecutive days above flood stage, consecutive days above major flood stage, and one record gage height record broken, which occurred at the Rock Island, IL Lock and Dam 15 location. Economic impacts were high as the river was closed to navigation for almost 3 months. This specifically affected the barging industry and subsequently the agriculture industry. Aside from homes, businesses, and infrastructure that were impacted by flood waters, the entire region saw agricultural losses as crops were planted late (through June rather than in April and May), while many acres of land were not able to be farmed at all.
This flood event proved challenging from a forecasting/IDSS perspective for the Quad Cities WFO. This was due to the length of time the river was flooding, as well as communicating multiple river rises in a 3-month period that peaked in the top 5 crests of all time for most locations.
ISSUE #1: Partners needed to prepare for flooding in the time-scale between when the AHPS Probabilistic Outlooks were produced and when crests were included in the operational forecasts. The Spring Flood Probabilistic Outlook provides good information to prepare, but does not give enough confidence for many partners to take action, meaning purchasing, preparing, and staging resources. When the Probabilistic Flood Outlooks (ESFs) were weeks old, partners began to question their validity and what they should realistically be preparing for in terms of both timing and crest heights.
This was the first year we were aware of the number of people using the Probabilistic Flood Outlook statistics and graphics for their decision-making. The inquiries received by WFO Quad Cities brought to our understanding the need for more IDSS in that mid-range time frame leading up to a peak crest.
As time moved forward from the issuances of the Spring Flood Probabilistic Outlooks (February 21, 2019 and March 7, 2019), as conditions changed, for instance, substantial snow or rain fell, or significant melting occurred, inquiries became numerous as partners wondered if the numbers in the outlooks remained correct. The other frequent question received was the timing of the crest moving down-river. Partners and the public use graphics developed by the NCRFC housed on AHPS for ‘Weekly Chances of Exceeding Levels’ to make decisions on when they need to begin preparations based on the statistical analysis of when the peak flows will come through their area of interest. With rapidly changing conditions in March, the timing of the peak flows became highly sought after. The graphics, which were anywhere from 2 to 3 weeks old were not providing the best decision support information as our partners did not have confidence in the information because they deemed it to be outdated. This proved to be challenging to message the worth of this information and how customers should be using it.
As the wet pattern stayed dominant across the Upper Mississippi River Watershed through April and May, it became understood that this event could be a long one as soil conditions were not seeing much improvement. After the first two peak crests, the decision point that was challenging for our partners and the general public was when they would be able to remove their flood protection. Local county Emergency Management agencies were also wanting to start clean-up efforts, but wanted to make sure the river wasn't going to rise again before beginning those tasks.
The challenge with these issues is that the NWS does not have a good way to communicate the answers to these questions at this time with our standard product suite so local efforts were needed to provide the IDSS our partners desired.
ISSUE #2: The official forecast only included 24 hours of forecast rainfall through much of the event. In several instances the official hydrographs showed falling stream levels when there was high confidence on levels rising back to critical levels. There is currently no method to portray that on the Advanced Hydrologic Prediction System (AHPS).
Feedback from partners and customers indicated that our messaging was confusing as we were communicating another rise forthcoming due to expected rain in the forecast in periods beyond 24 hours with a likelihood to reach significant heights while the official forecast was falling. This information became of highest concern between each crest. Human nature causes people to want to clean up as soon as possible after an event, and the 2019 flooding was no exception. As customers were wanting to begin cleanup efforts and take down flood protection, seeing a falling forecast gave them a false sense of security that the flooding was over. Much effort was put into the explanation to not use the current official forecast as there was high confidence that river levels would in fact be rising again.
The NWS’s core partners understand that beyond a period of 24 hours, confidence in a precipitation forecast diminishes quickly and the NWS often doesn’t have enough confidence to use more than 24 hours of forecast precipitation in a river forecast. However, the operations our partners are running and the decisions they are tasked with making do rely on knowing what could happen, especially if there is confidence in heavy rain despite the uncertainty in exactly where and how much it will be. Many partners and customers are also wanting to know ‘How bad could it get?’ Answers to this question can help them when determining contingency plans, whether it be to get more resources ready, evacuate individuals, etc.
WFO Quad Cities tries to manage this problem by attending meetings and taking part in outreach opportunities to explain what goes into our forecasts and what the limitations are. Continued efforts in building relationships and trust with our partners is essential so they know to trust in what we are messaging to them. Nevertheless, the issue is with those customers we haven't had the opportunity to build these trusting relationships with. Our fear is that people will just use the hydrograph verbatim, where bad decisions could be made off of that information. Anecdotal reports suggest this actually occurred.
These issues led to the determination that partners and customers of the NWS need to be provided with river forecast information on a probabilistic type of framework.
METHODS
In order to provide the probabilistic-type information desired by our partners, the WFO Quad Cities developed easy to read graphics using a quasi-ensemble approach to make available ranges in what to expect for future river levels and timing of river rises. These graphics showed the information forecasters knew, yet were not able to provide in the official hydrographs and AHPS pages.
Creating these graphics was possible through collaboration with the NCRFC. The NCRFC does create ensemble forecasts that use quantitative precipitation forecasts (QPF) through 3 days providing forecasts using the 5th, 50th, and 95th percentile of QPF in each of 24, 48, and 72 hour time-frames. This data provides an idea of the high end and low end scenarios, but only if the bulk of the rainfall is expected in the next 72 hours. There was a need identified to provide information on what the river could do given heavy rains beyond 72 hours.
Knowing our partners were required additional information on top of what we were currently able to provide in order to make the decisions they needed to make, upon the request of WFO Quad Cities, the NCRFC began running extra models using varied QPF inputs to help in this effort.
The information used in the quasi-ensemble approach included river forecasts using 5-day QPF, 7-day QPF, the North American Ensemble Forecast System (NAEFS) 16 day QPF, the ensemble forecasts using the 95th, 50th, and 5th percentiles of QPF in the 24, 48, and 72 hour time-scales, along with the AHPS Probabilistic Outlooks. CPC’s experimental week 2 potential for extreme rainfall product was also used to gain confidence on the ‘probabilistic’ information being provided as well as provide partners with an idea if heavy rain was expected.
RESULTS
Partners expressed their appreciation for the extra effort put in by the WFO Quad Cities staff to provide them the information they needed to allow them the time to plan, order resources, stage resources, and implement flood fighting efforts they would not have had time to do if they waited until the rise started showing up in the official forecast. Also, this information gave them a basis to determine to keep flood protection in place and to hold off on beginning clean-up efforts. The alternative would have been very expensive and time consuming, with duplication of efforts being done.
DISCUSSION
The NWS needs to pursue the option to provide probabilistic river forecasts in time-scales closer than the 3-month statistical analysis currently provided which could be updated more frequently than monthly. These types of resources would be valuable to provide the IDSS needed by our partners in river flood events. Other improvements would be to have a more flexible webpage in AHPS to be able to provide additional information, including a more visible way to display how much QPF is being used in the forecast they are viewing.
Through the 165 days of flooding, the WFO Quad Cities adapted services to the meet the needs of our partners. To provide the messaging needed, Situation Reports were sent whenever there was pertinent information to pass along, which was nearly daily for a good portion of this time-frame, webinars provided updates weekly, a webpage was stood up in support of the event to post any necessary information, along with the WFO Quad Cities having a presence on social media. Some of the primary messaging topics included:
ACKNOWLEDGEMENTS
WFO Quad Cities would like to recognize the NCRFC for the work they did throughout this event in support of our office as they accommodated the requests we had for additional data and models and visuals throughout the long event to the best of their abilities. The extra efforts put into their operations allowed our office to provide to our partners the information they needed to know to make their decisions.
FOLLOWUP
Many conversations have occurred between different offices in the NWS (WFO’s, RFC’s, and Regional Headquarters) since late summer 2019, with goals of improving the services the NWS can provide for IDSS in flood events. As of early January, discussions continue with the hope that development of new tools identified in this event become available in the near future.
The scientific results and conclusions, as well as any view or opinions expressed herein, are those of the author and do not necessarily reflect the views of NWS, NOAA, or the Department of Commerce.
Information to summarize the flooding from 2019 across eastern Iowa, western Illinois, and northeast Missouri can be found below.
 |
 |
Flood event summaries from WFO Quad Cities:
Contact Details:
Jessica Brooks
Service Hydrologist
NWS WFO Quad Cities IA/IL
Email: Jessica.Brooks@noaa.gov
Twitter: @JessB_H20Wx

