| Previous Month | Next Month |
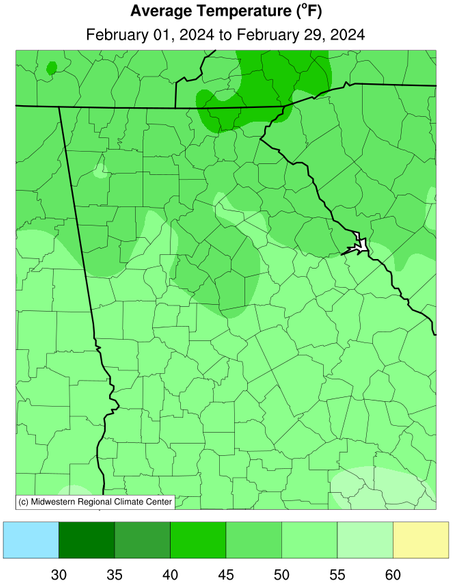
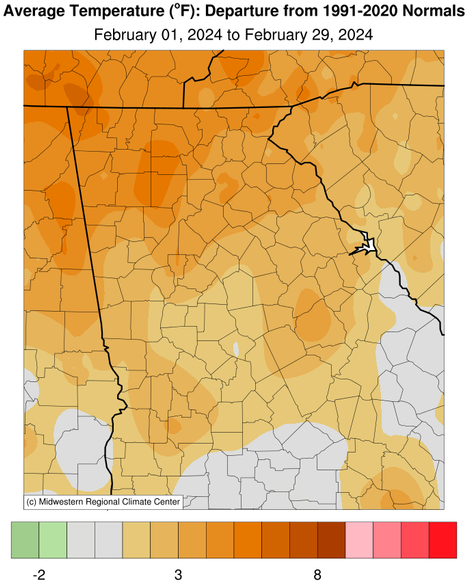
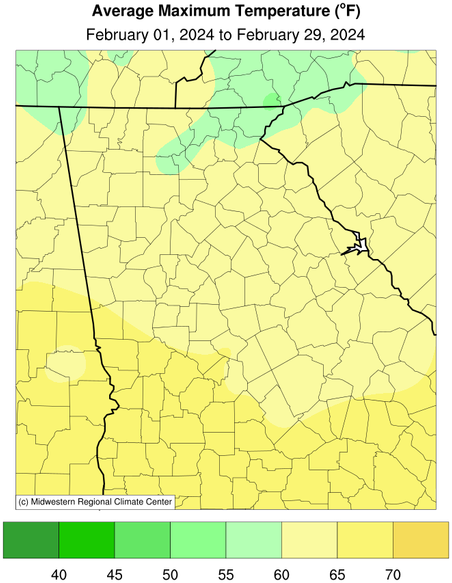
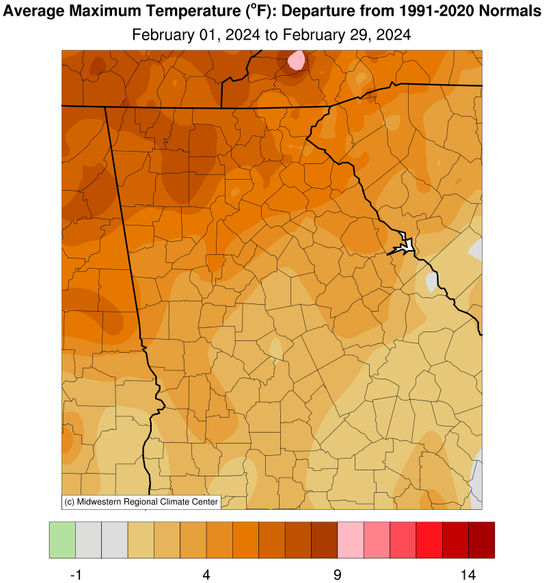
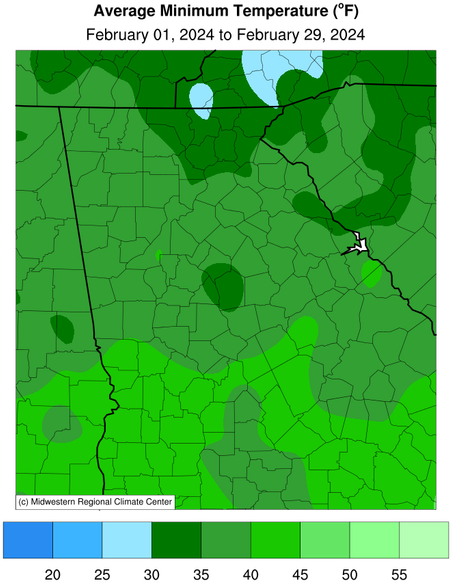
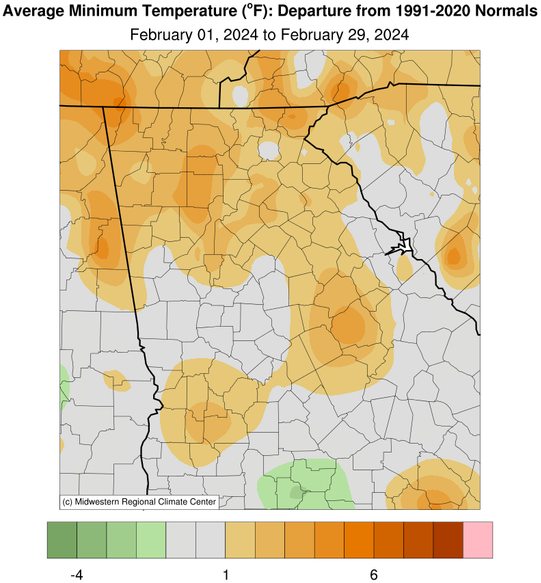
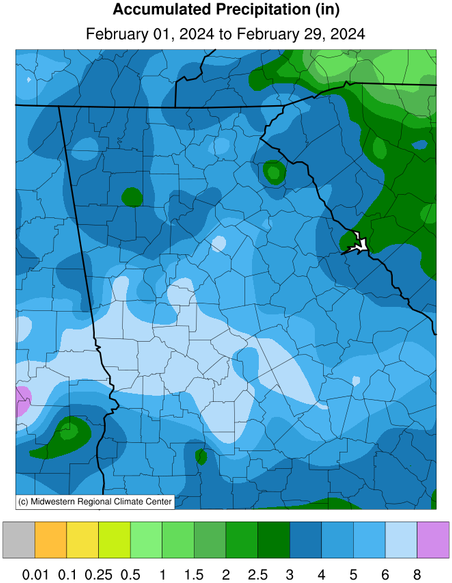
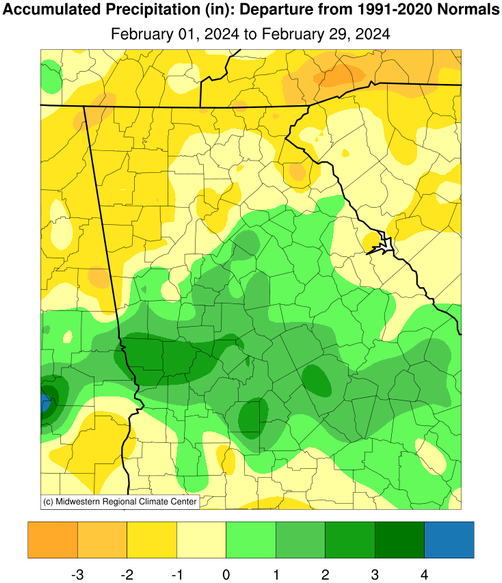
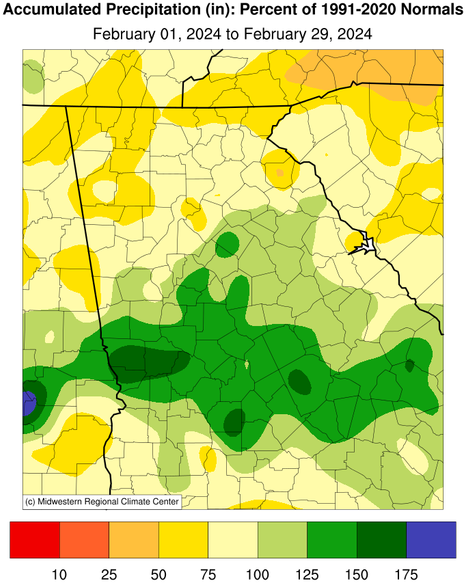
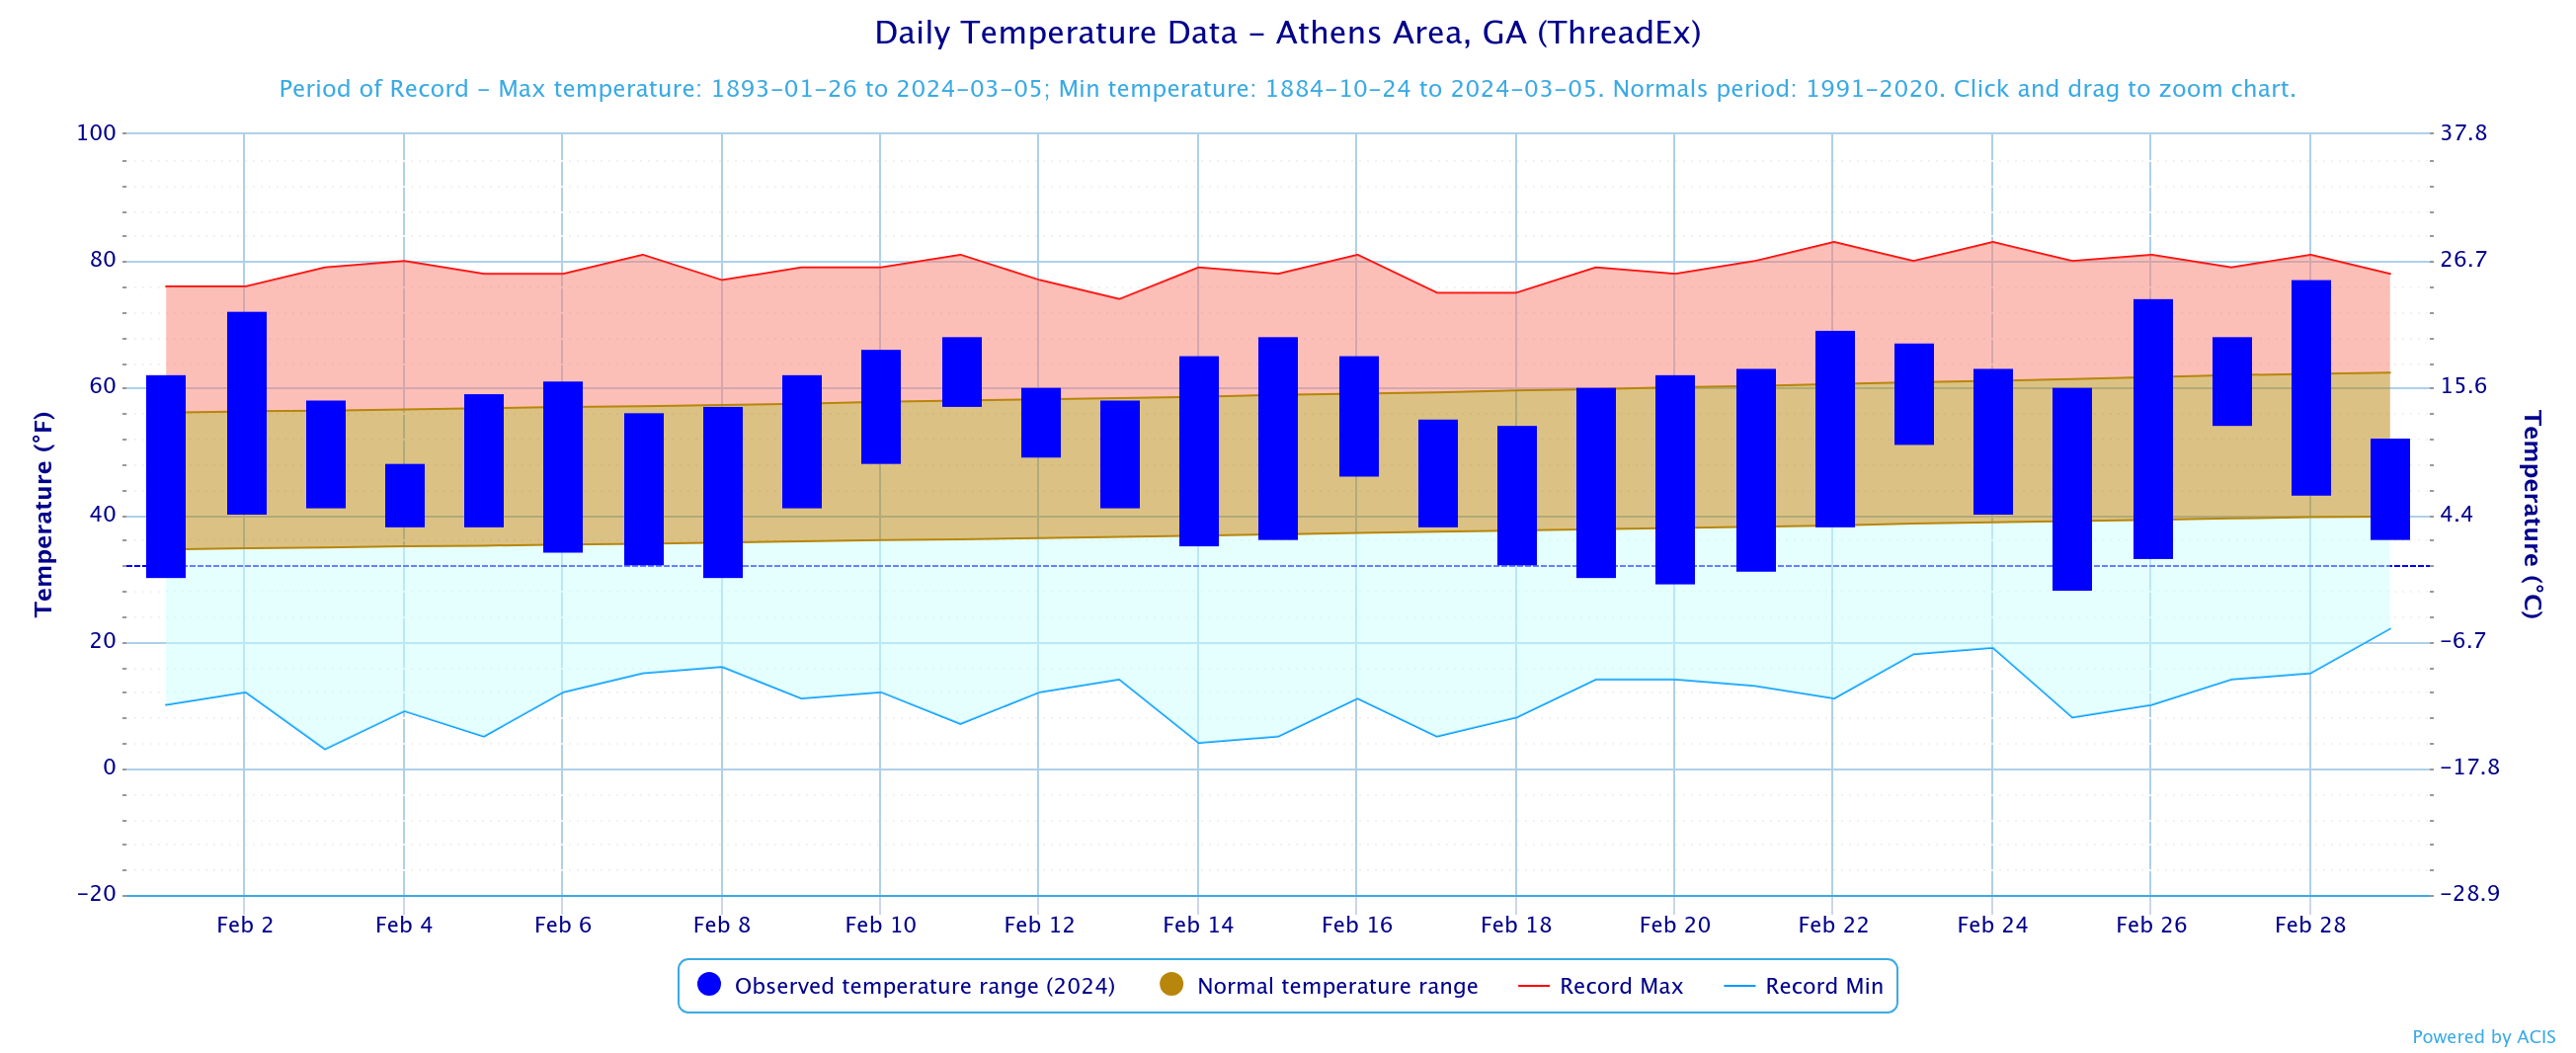
Temperatures through the month of February were three degrees above normal. Precipitation through the month of February was around normal.
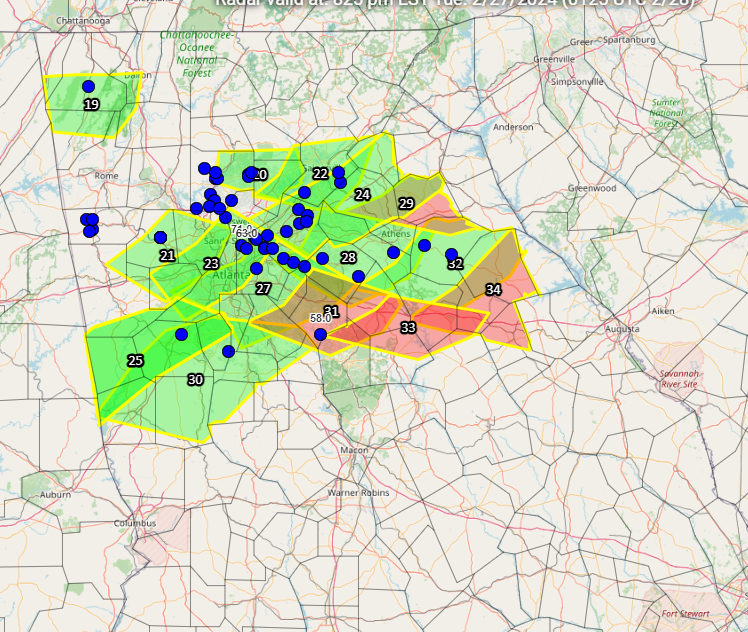
Climate Site Temperatures Precipitation Climate Site Maximum Temperature Max T Date Climate Site Total Precipitation DFN (Departure Climate Site Maximum Daily Precip (in inches) Max P Date Data prepared by NWS Peachtree City/Atlanta February 28, 2024 Severe Weather Outbreak Breaks in the clouds allowed for much more destabilization than expected ahead of a strong cold front for the singular severe weather event in February. As the cold front pushed through, our area was mostly impacted by a squall line that produced damaging winds especially in the metro Atlanta area.
Based on the Climate Prediction Center's outlook for March, Georgia has an 40% to 50% chance of seeing above normal temperatures. For precipitation, north and central Georgia has a 50% to 60% chance of above normal precipitation.
Overview
Climate Graphs
Records
Events
March Outlook
Below are the overview stats for February 2024 for our 10 climate sites.
February 2024 February Rankings
Athens
19th Warmest
54th Wettest
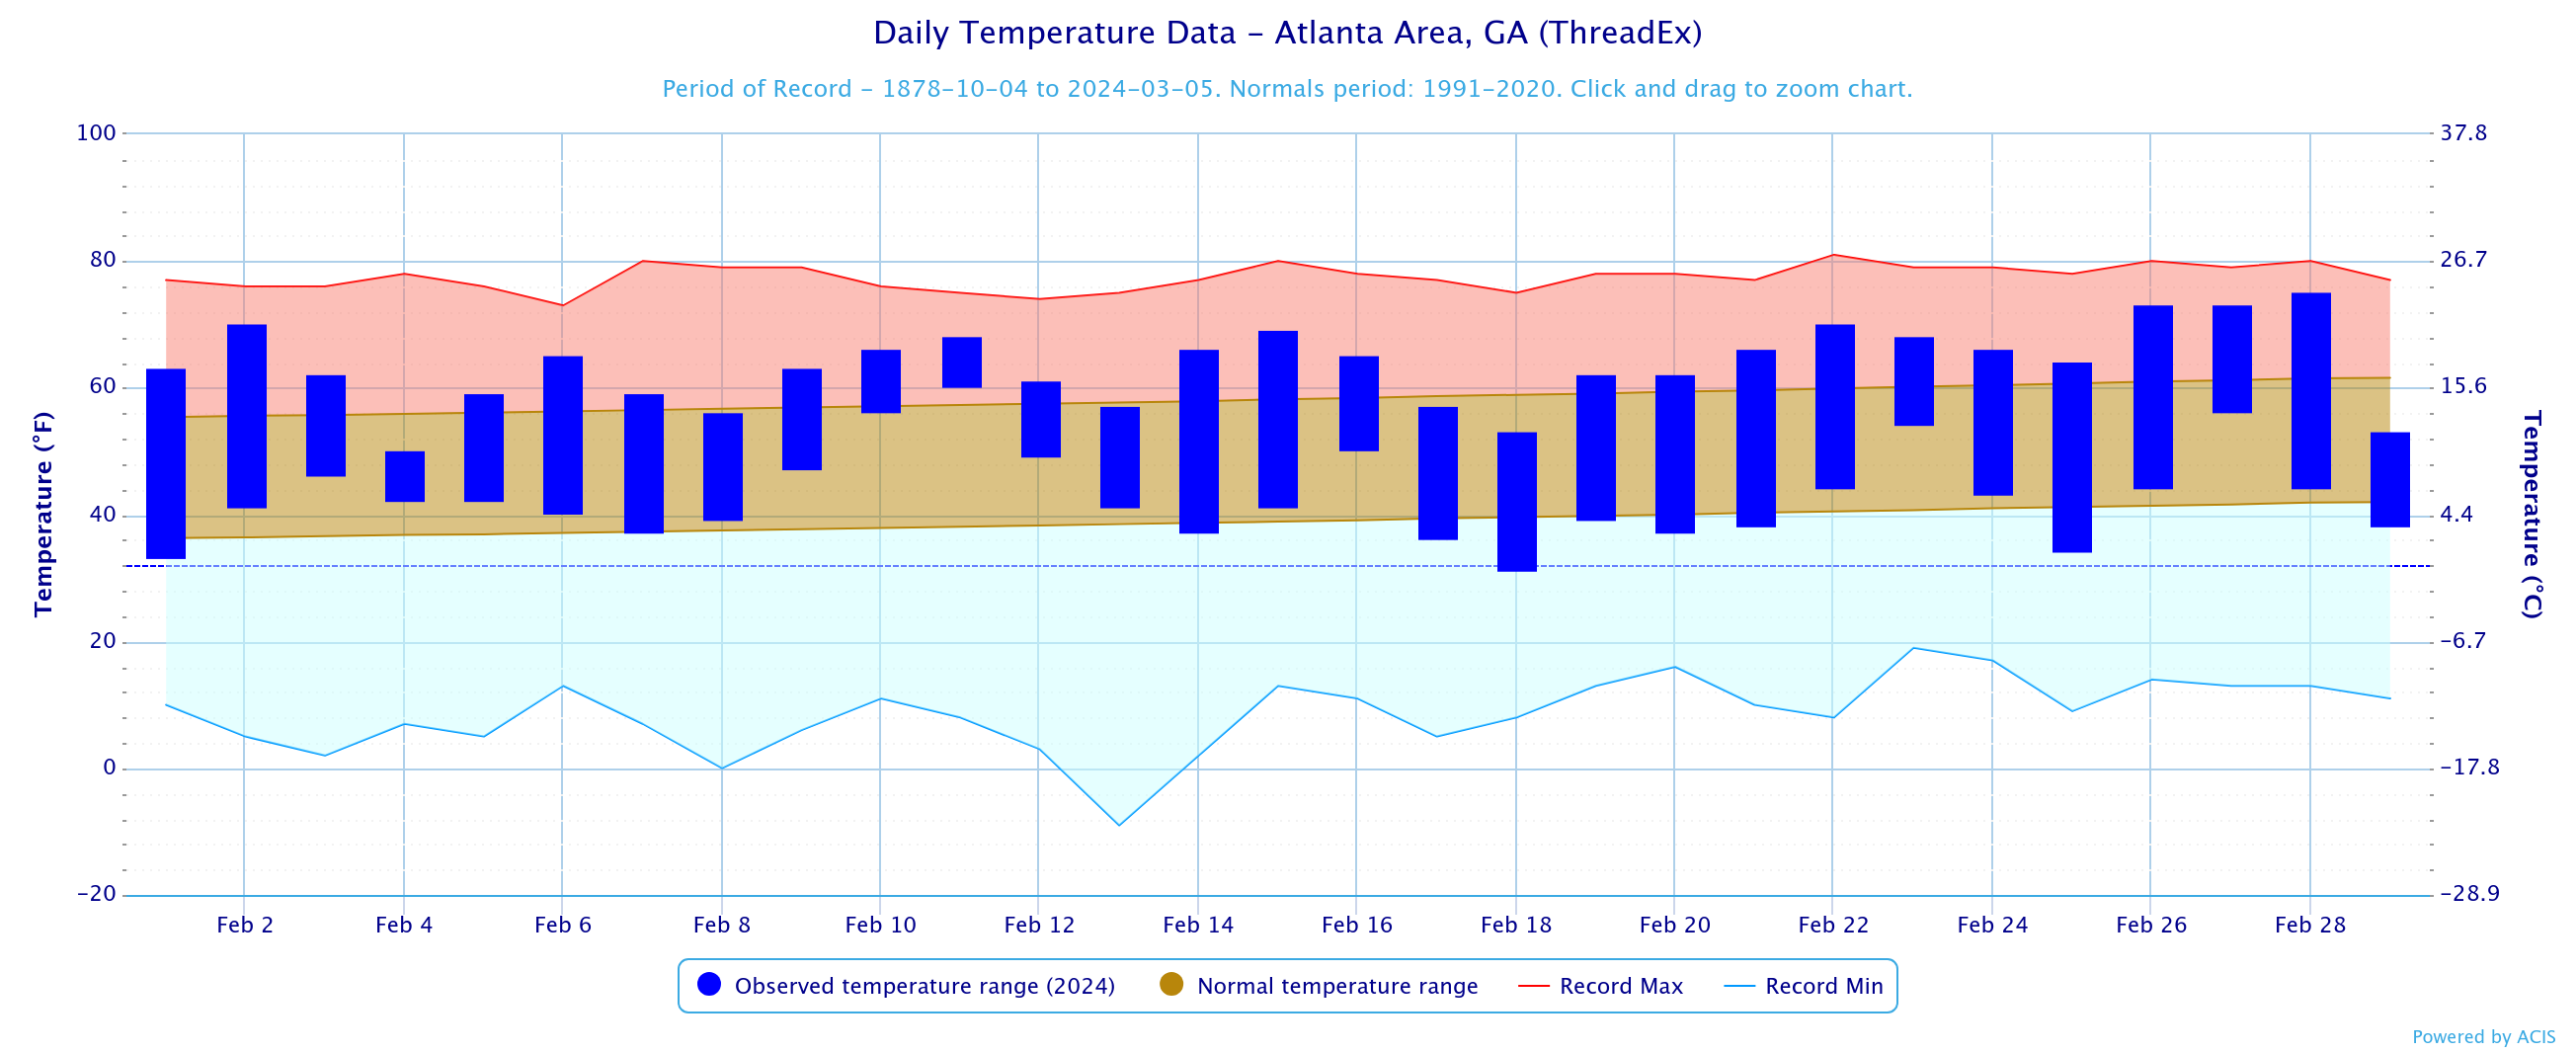
Atlanta
10th Warmest
63rd Wettest
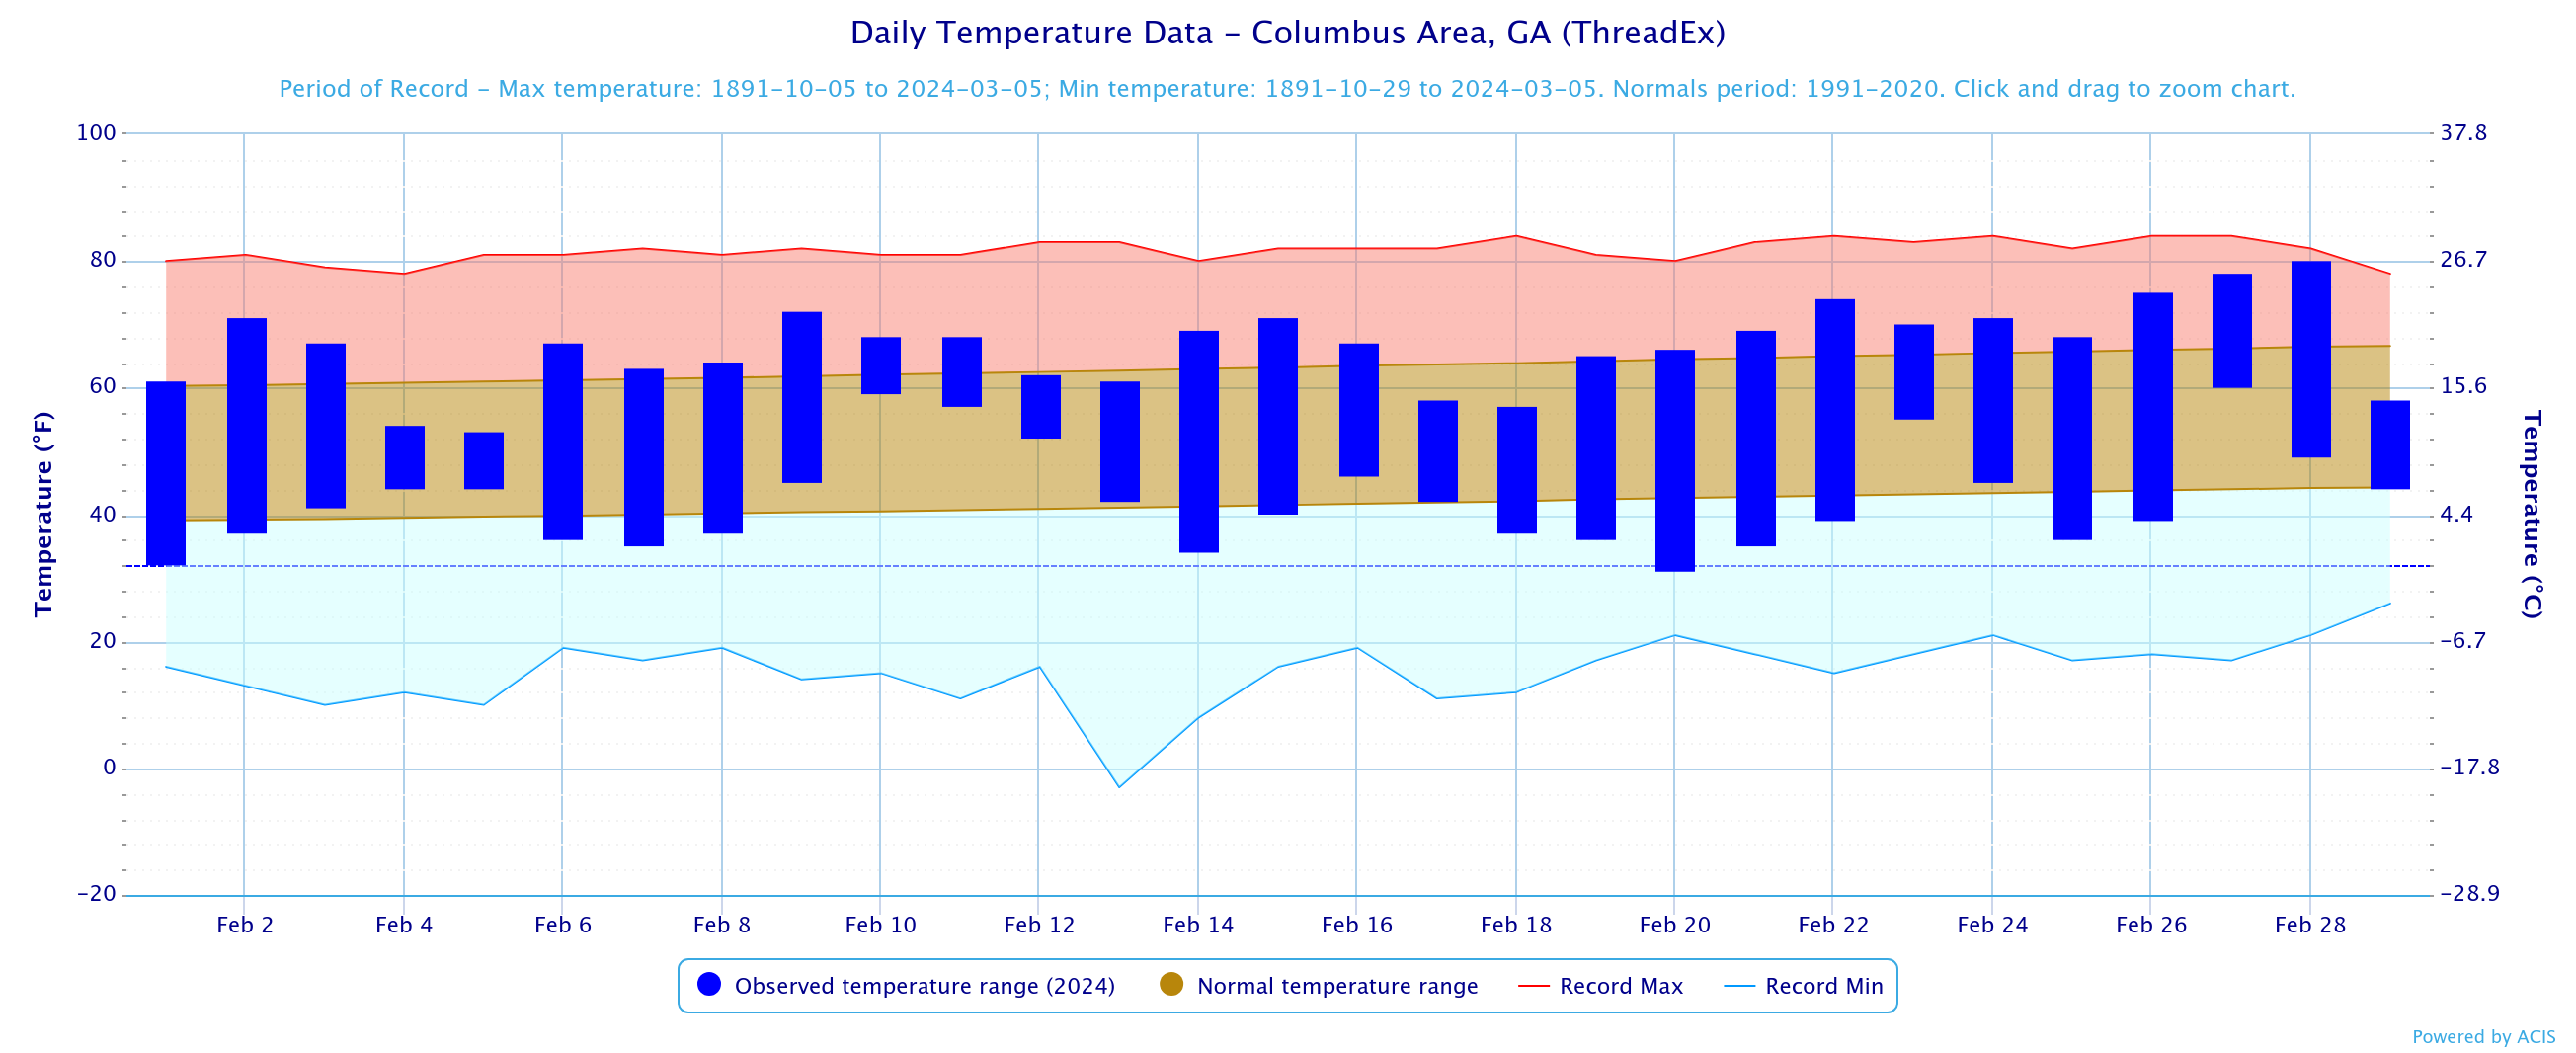
Columbus
24th Warmest
14th Wettest
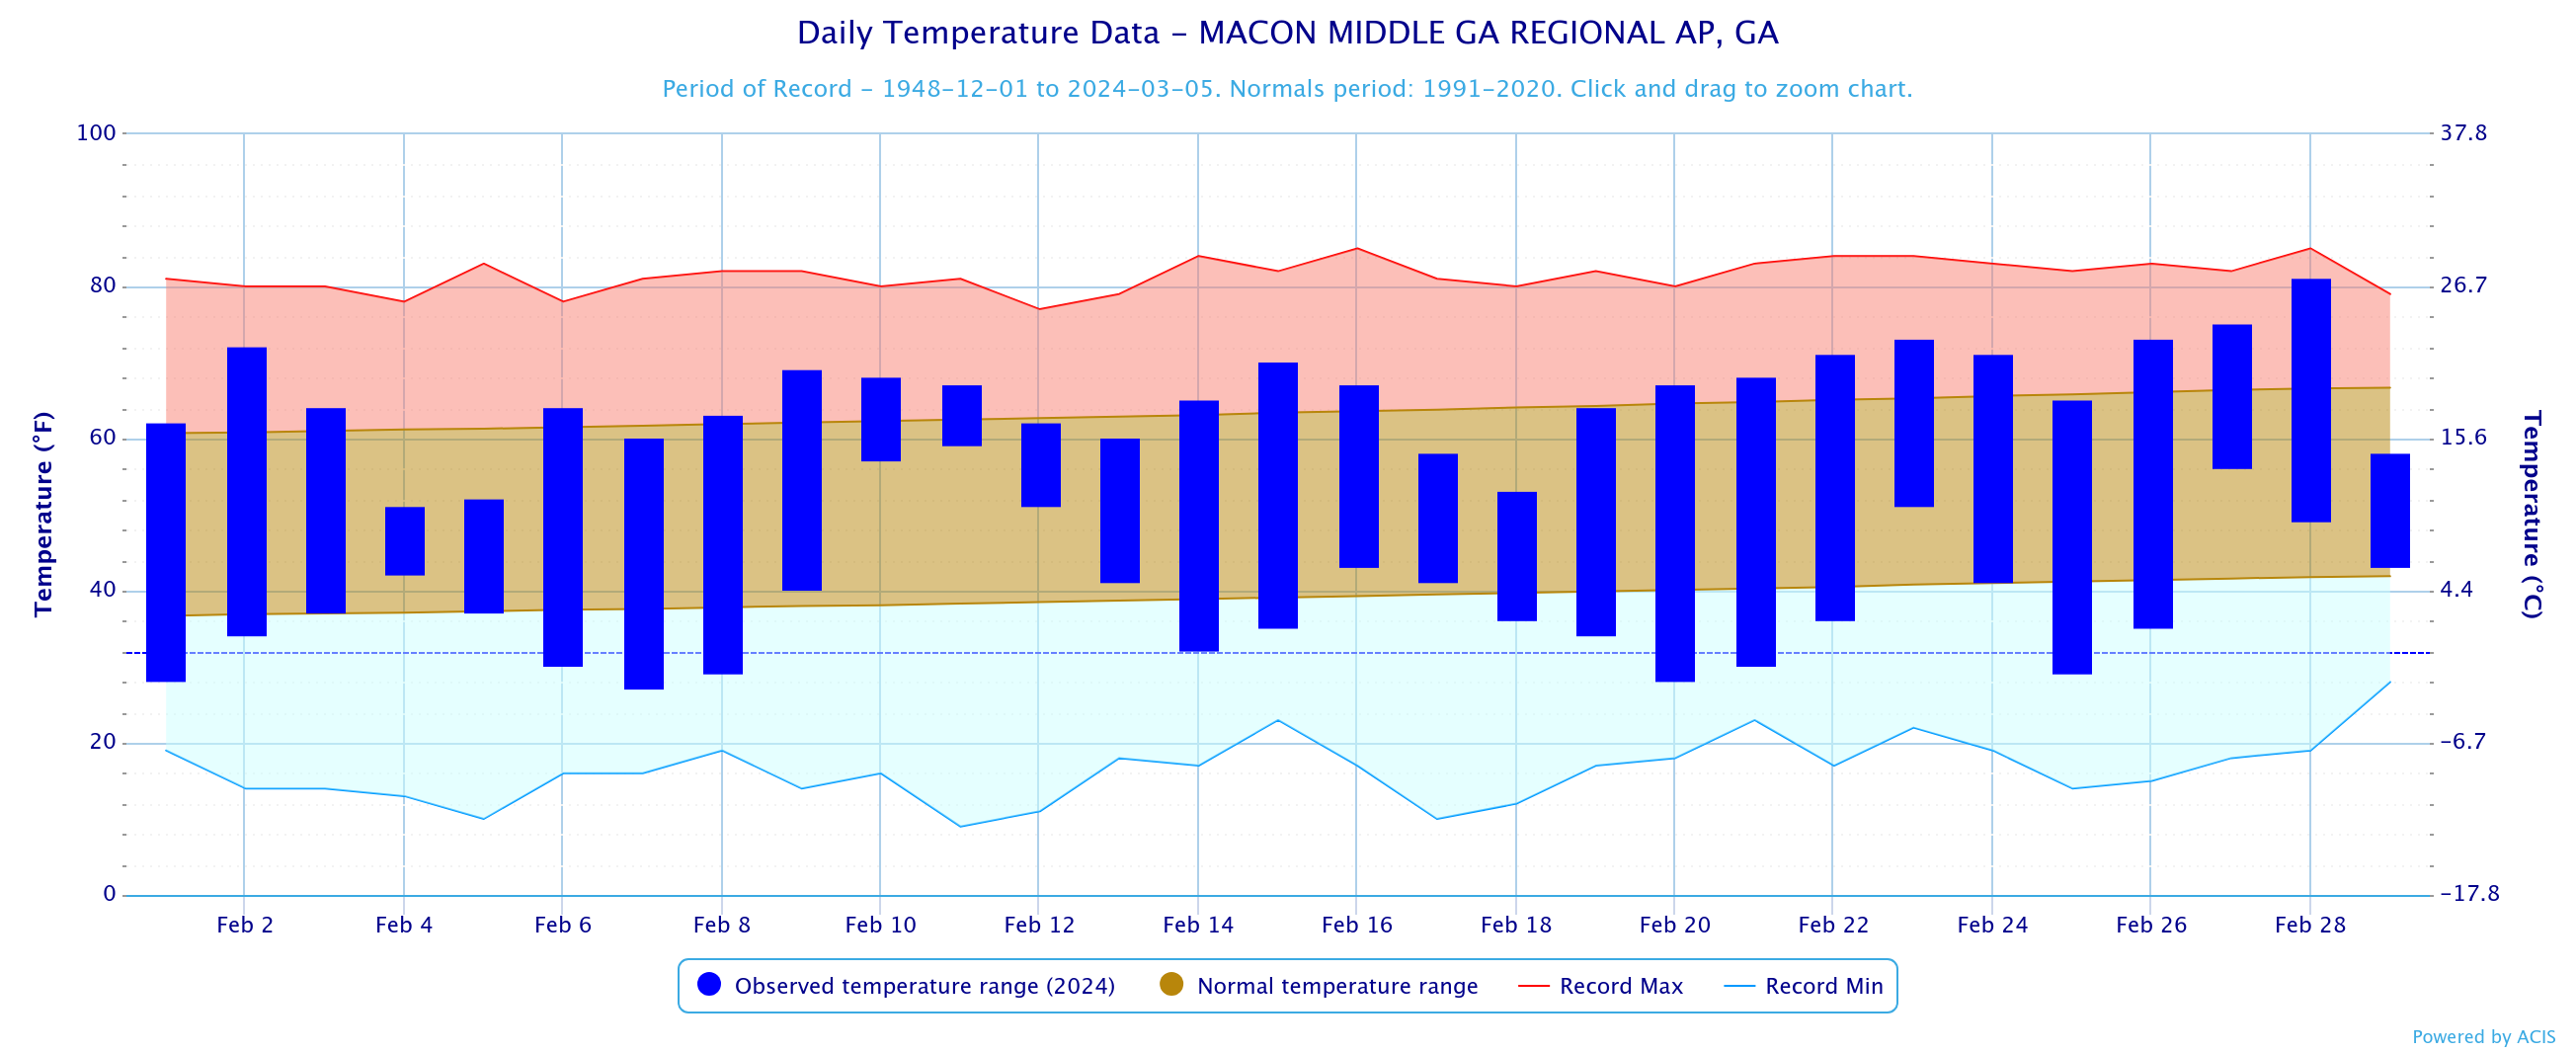
Macon
39th Warmest
32nd Wettest
February 2024 Climate Averages
Climate Site
February Temp (°F)
Average Temp
Departure from normal
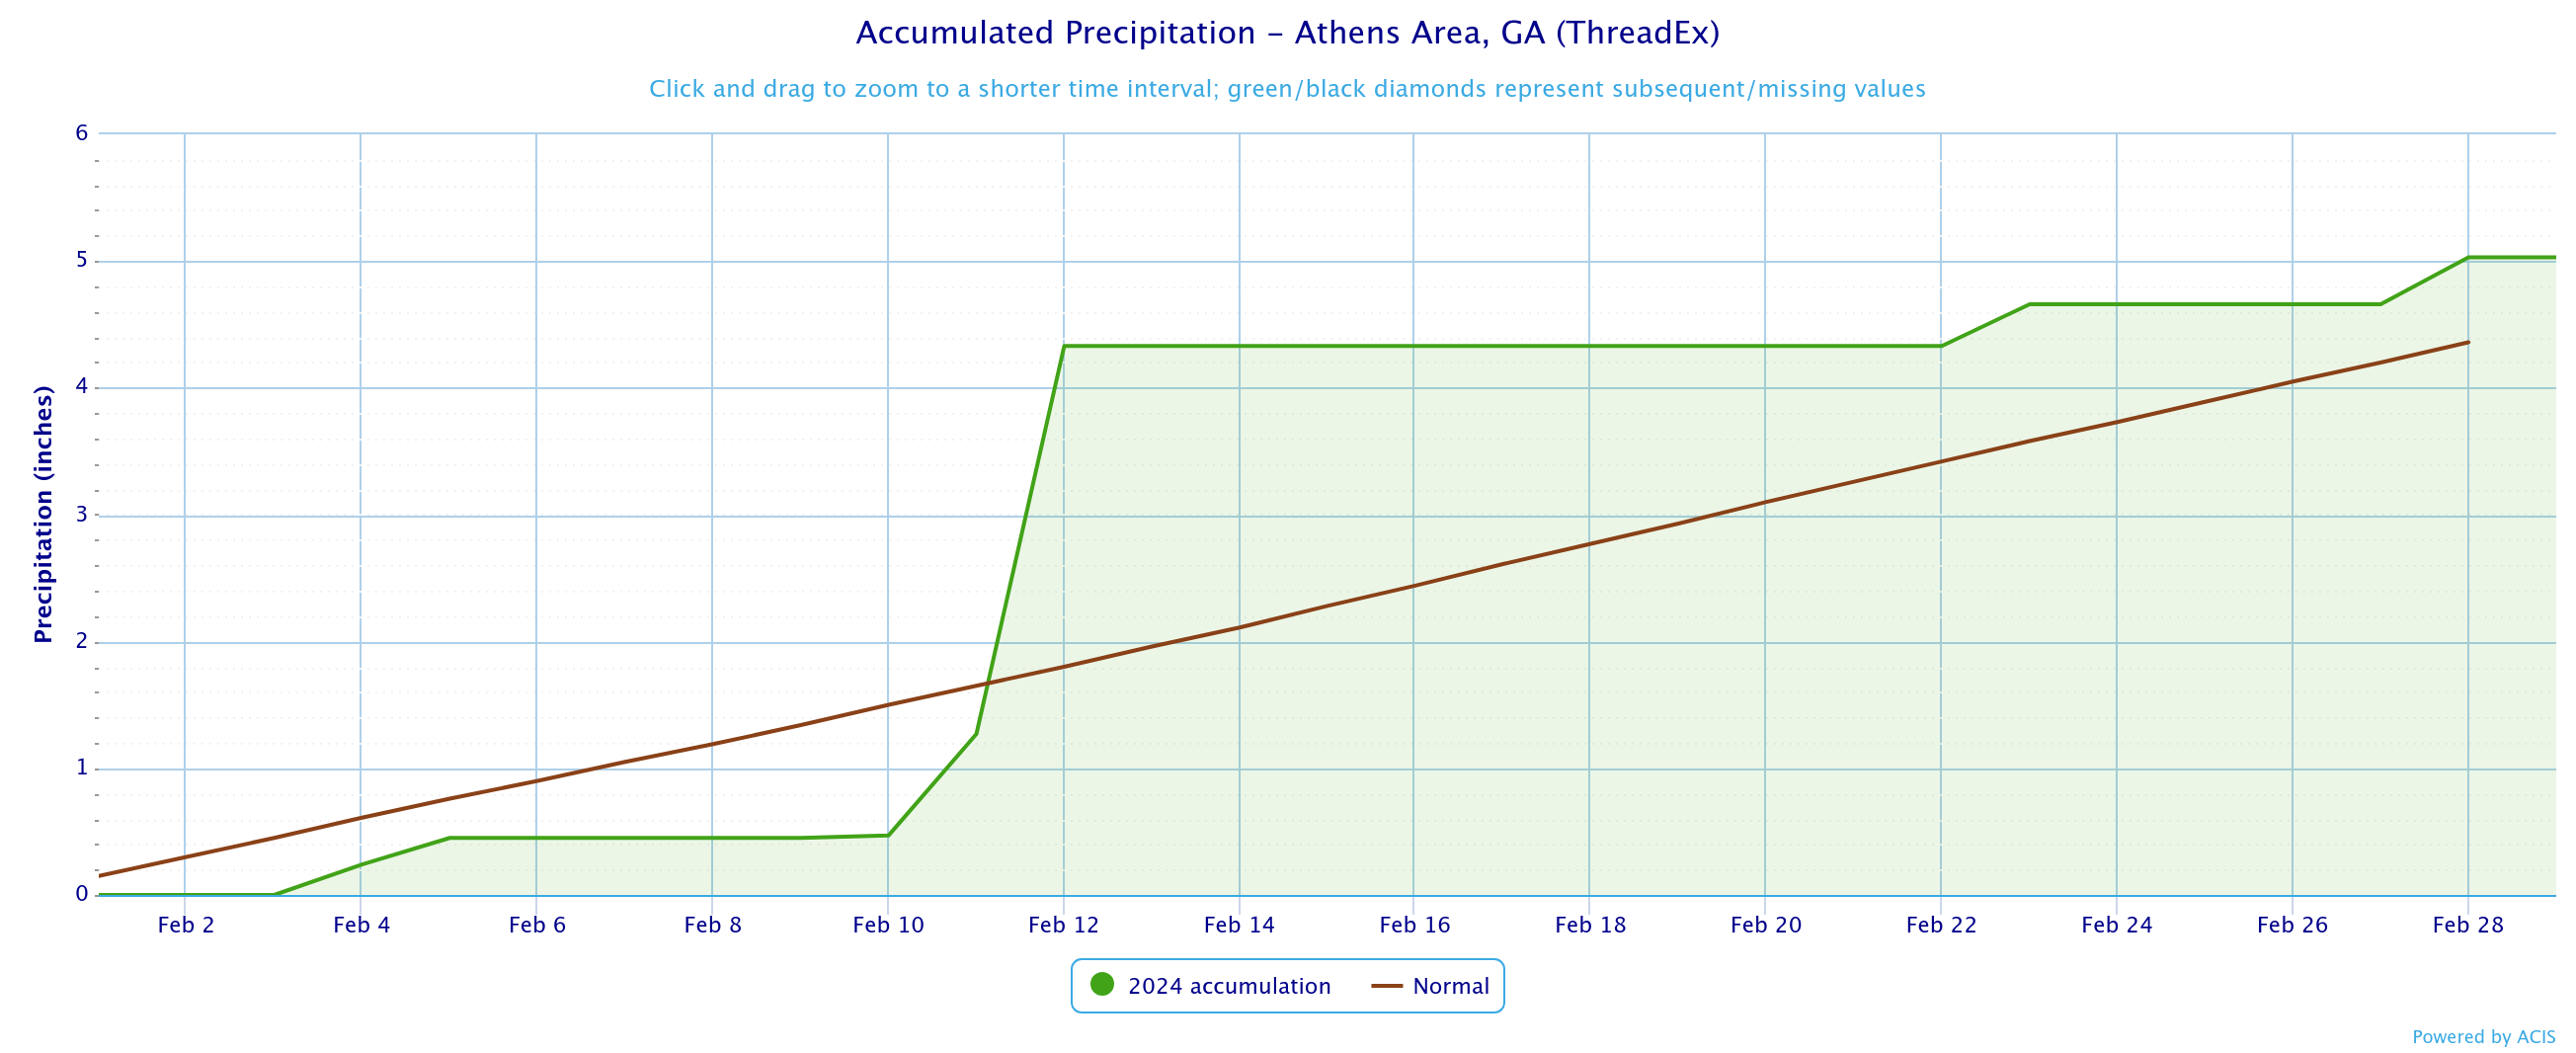
Athens
50.8
48.0
+2.8
Atlanta
53.1
48.5
+4.6
Columbus
54.4
52.3
+2.1
Macon
52.1
51.2
+0.9
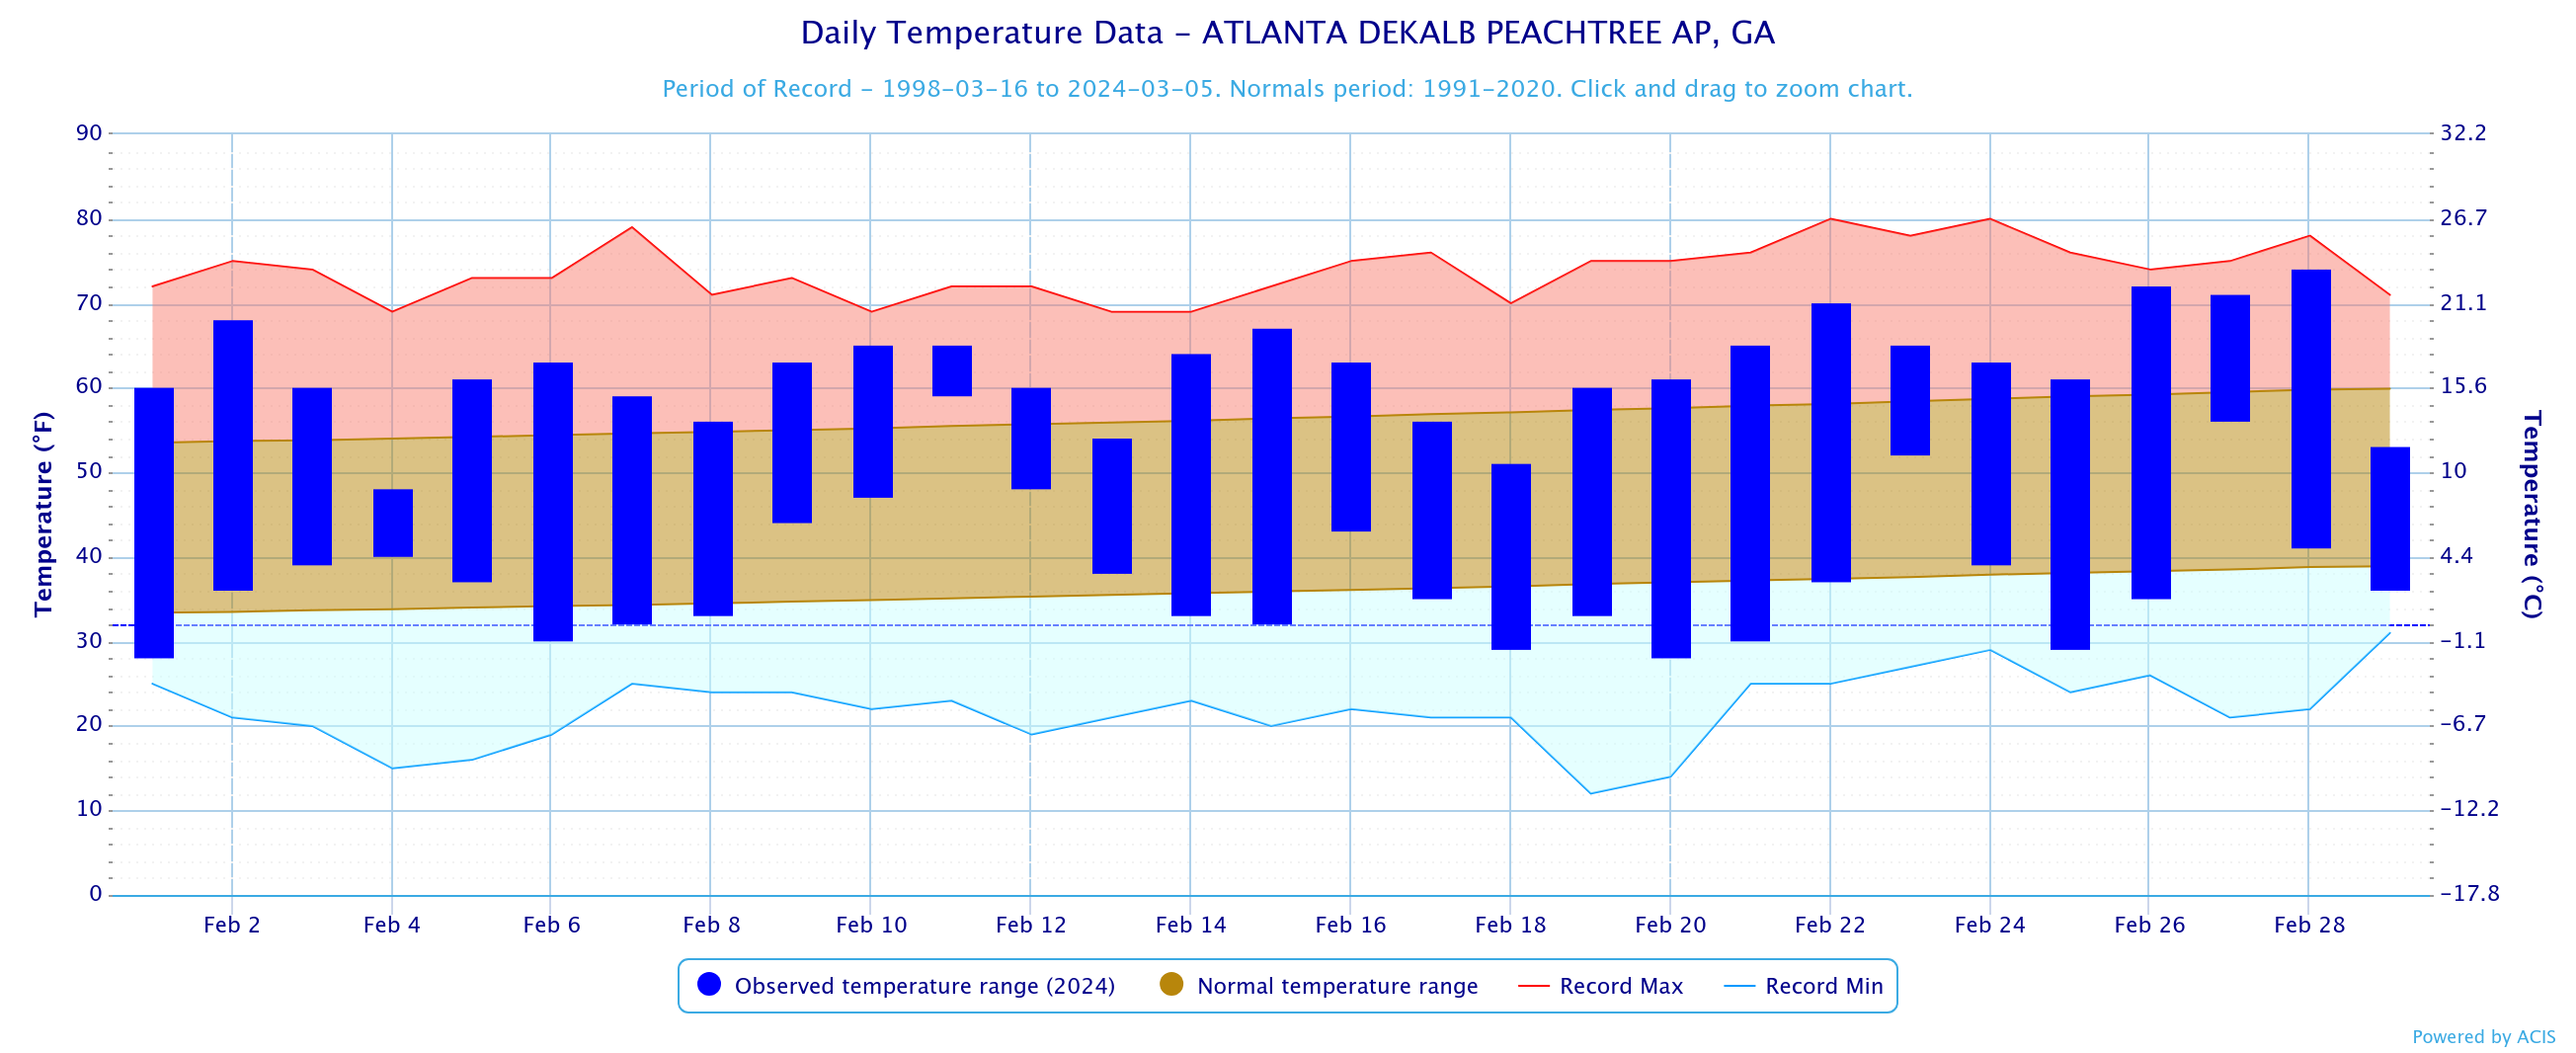
Dekalb Peachtree Arpt
49.9
46.1
+3.8
Fulton Co Arpt
50.9
47.5
+3.4
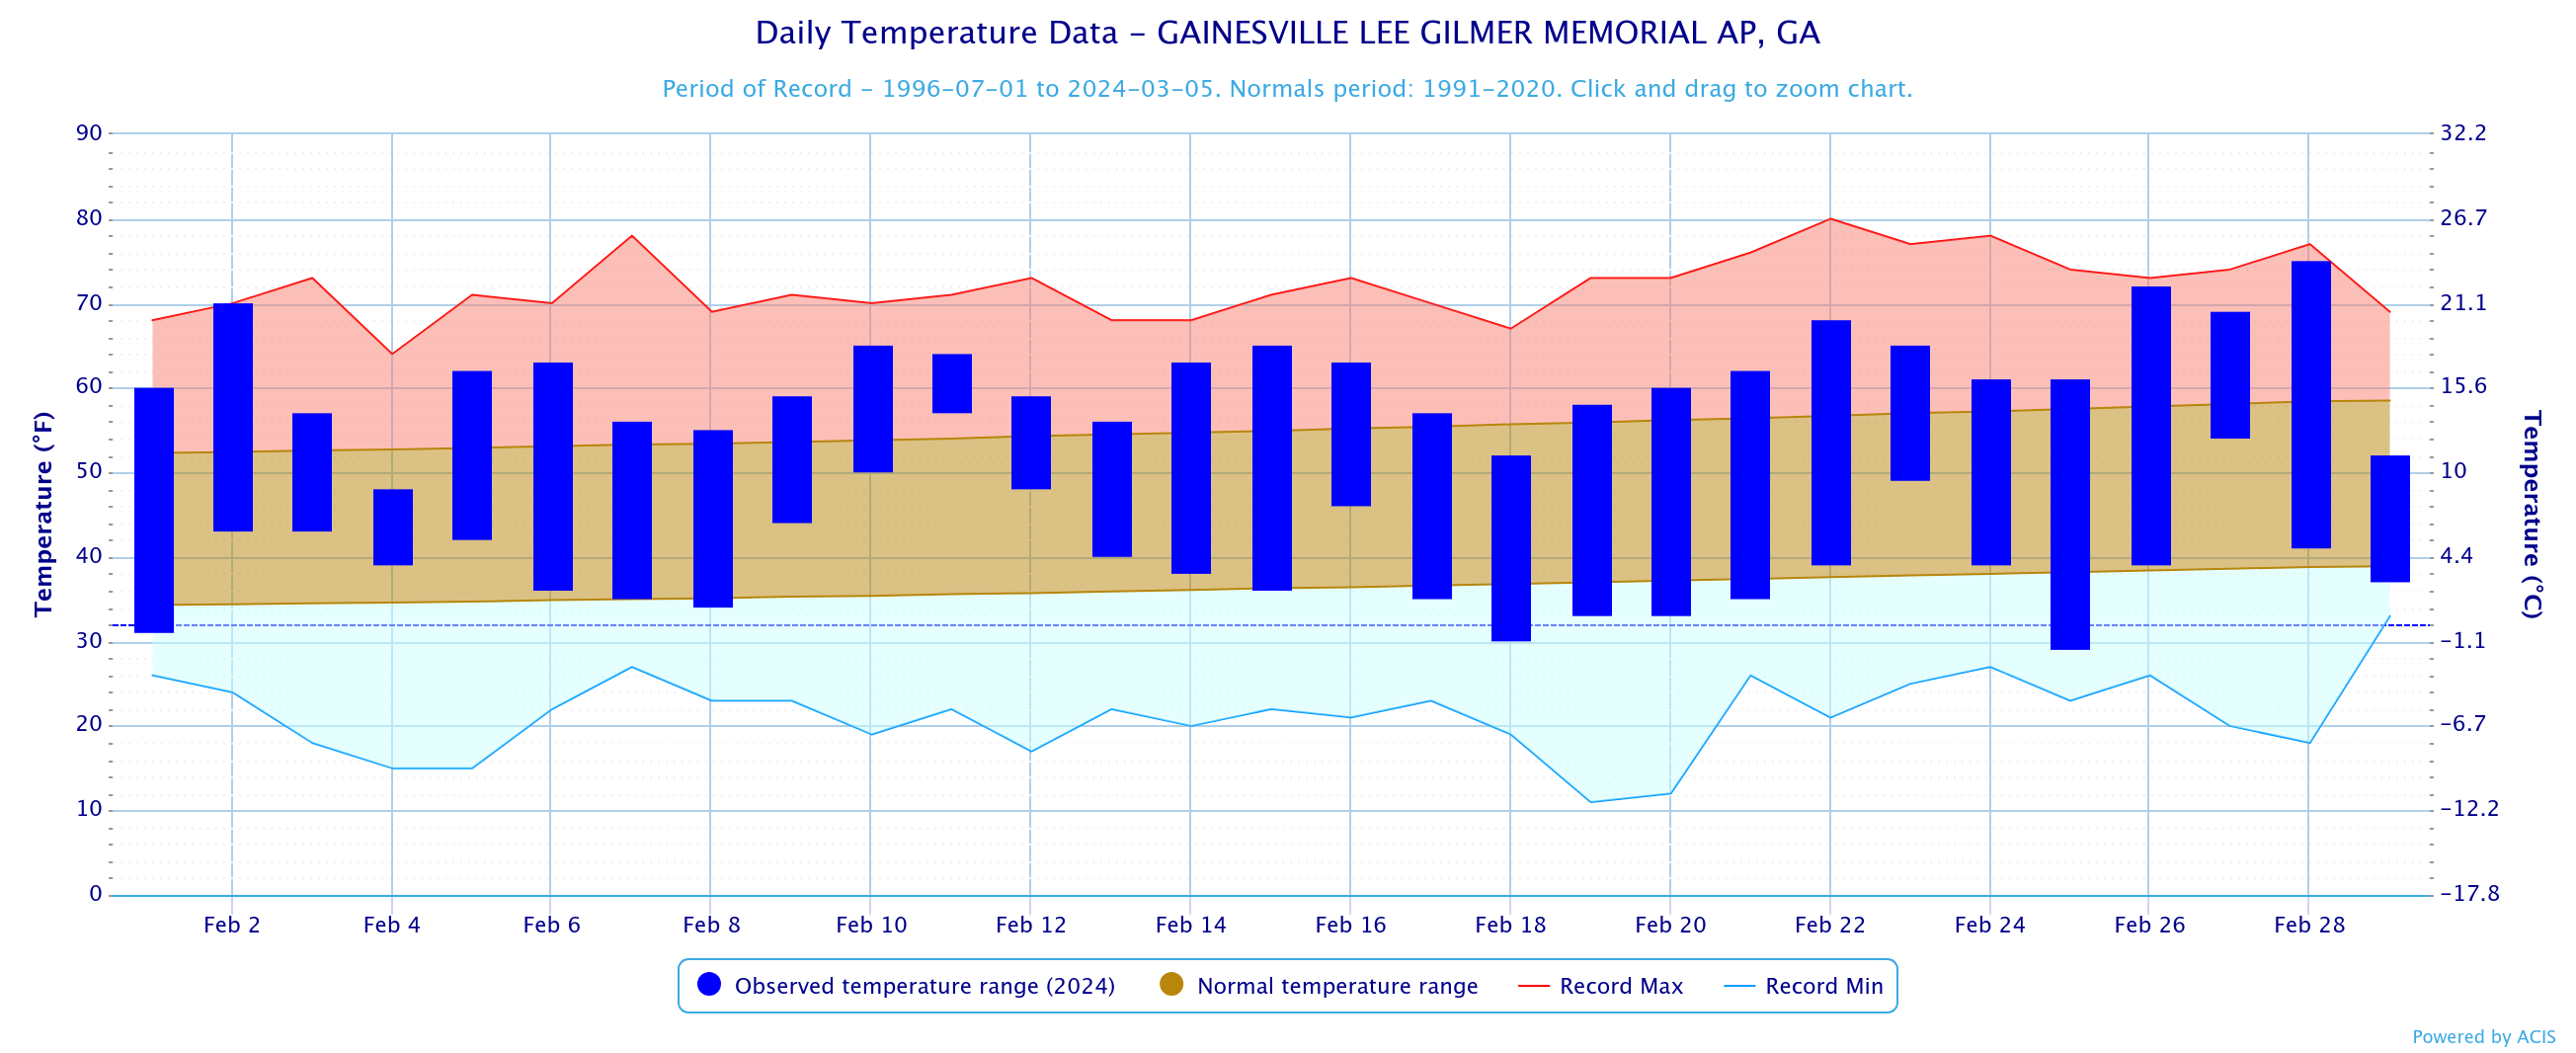
Gainesville
50.6
45.7
+4.9
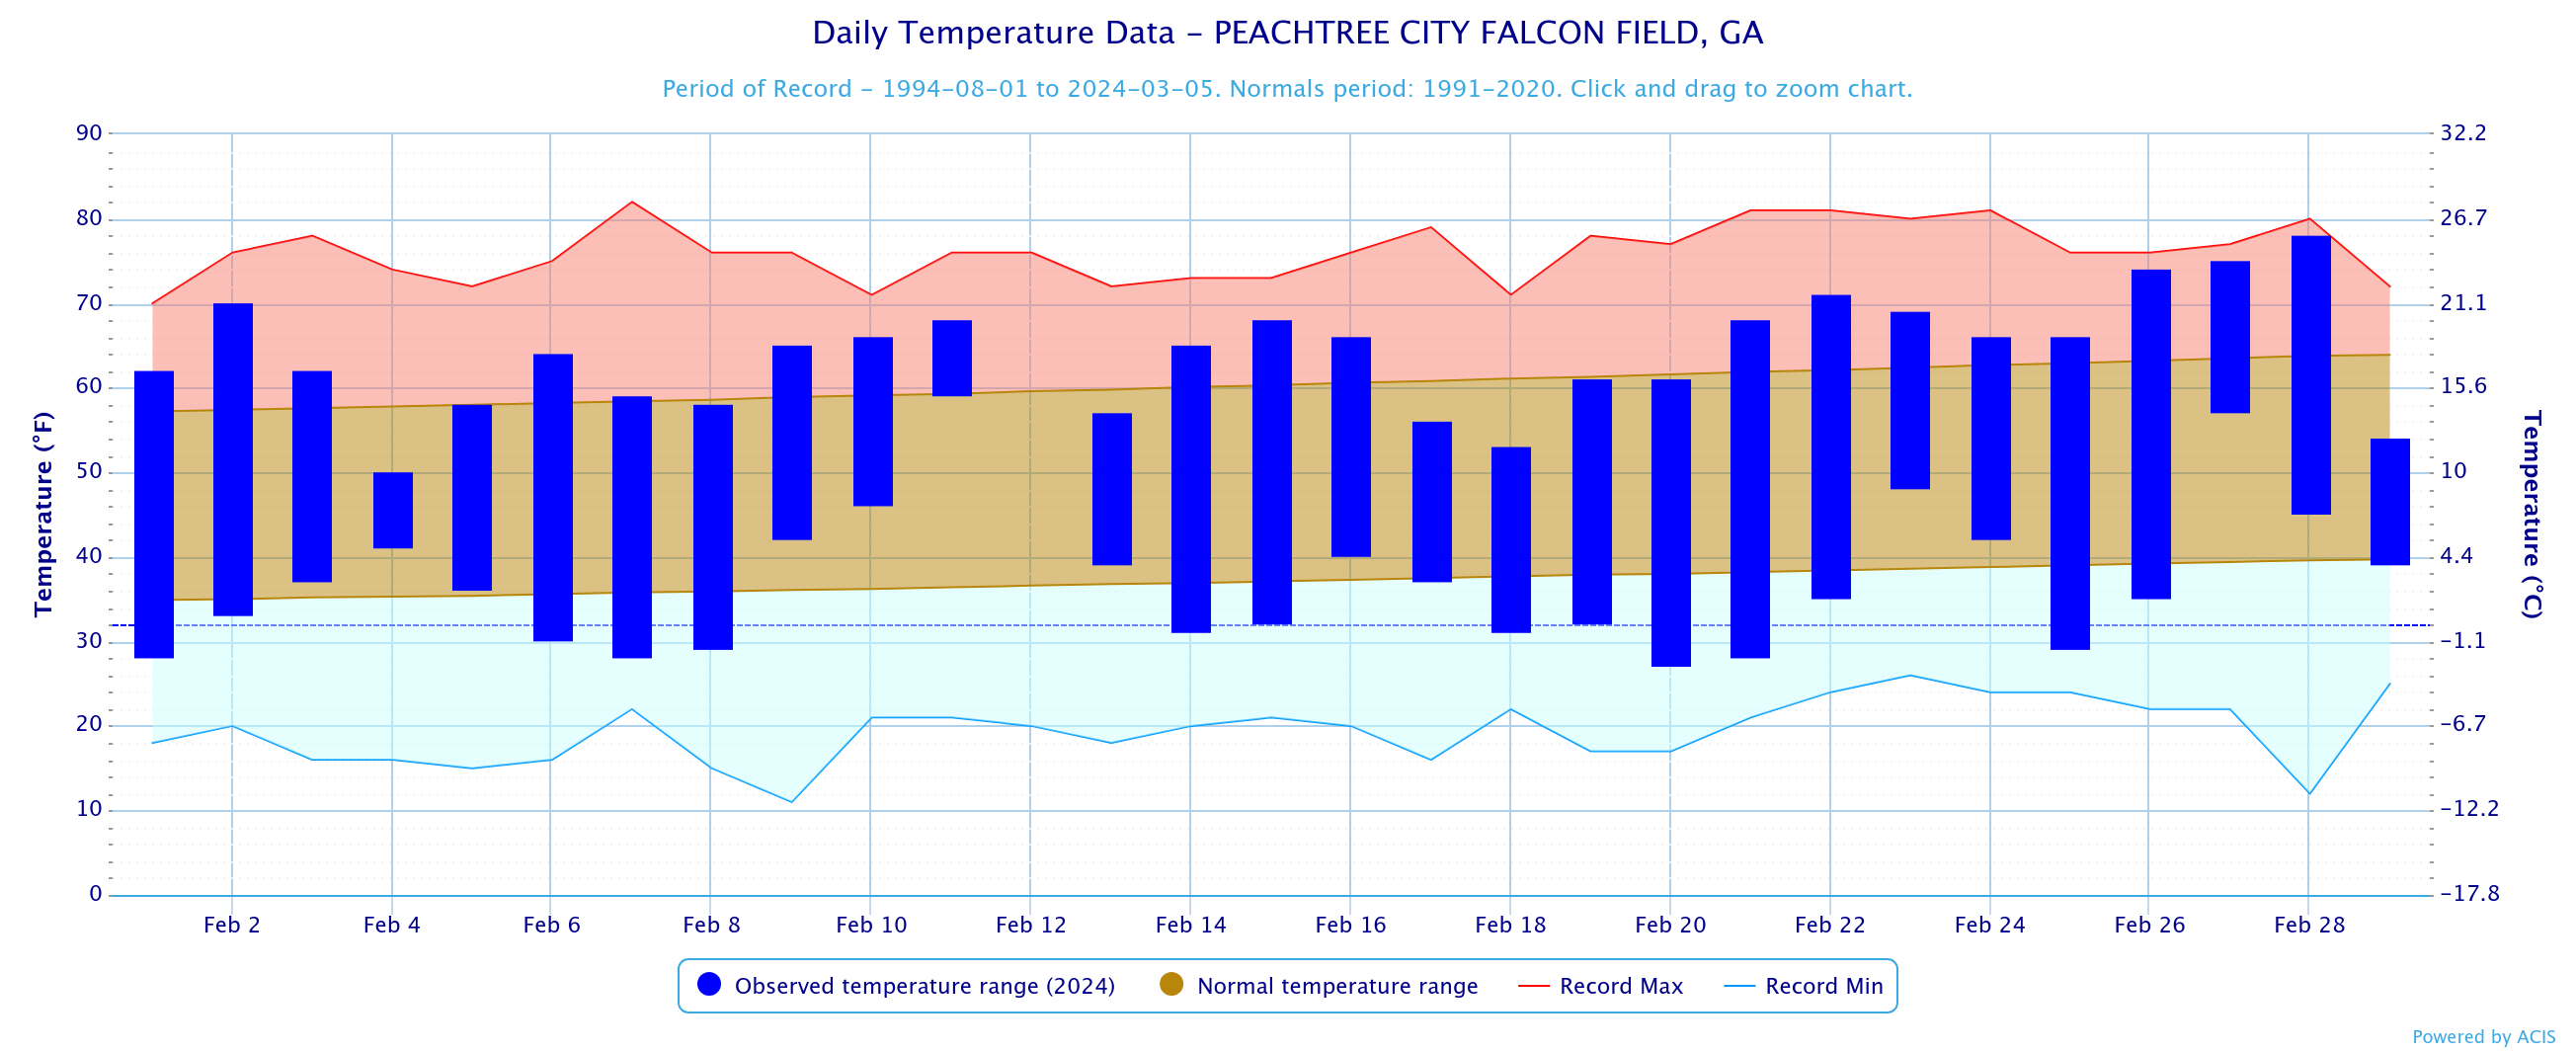
Peachtree City
50.8
48.7
+2.1
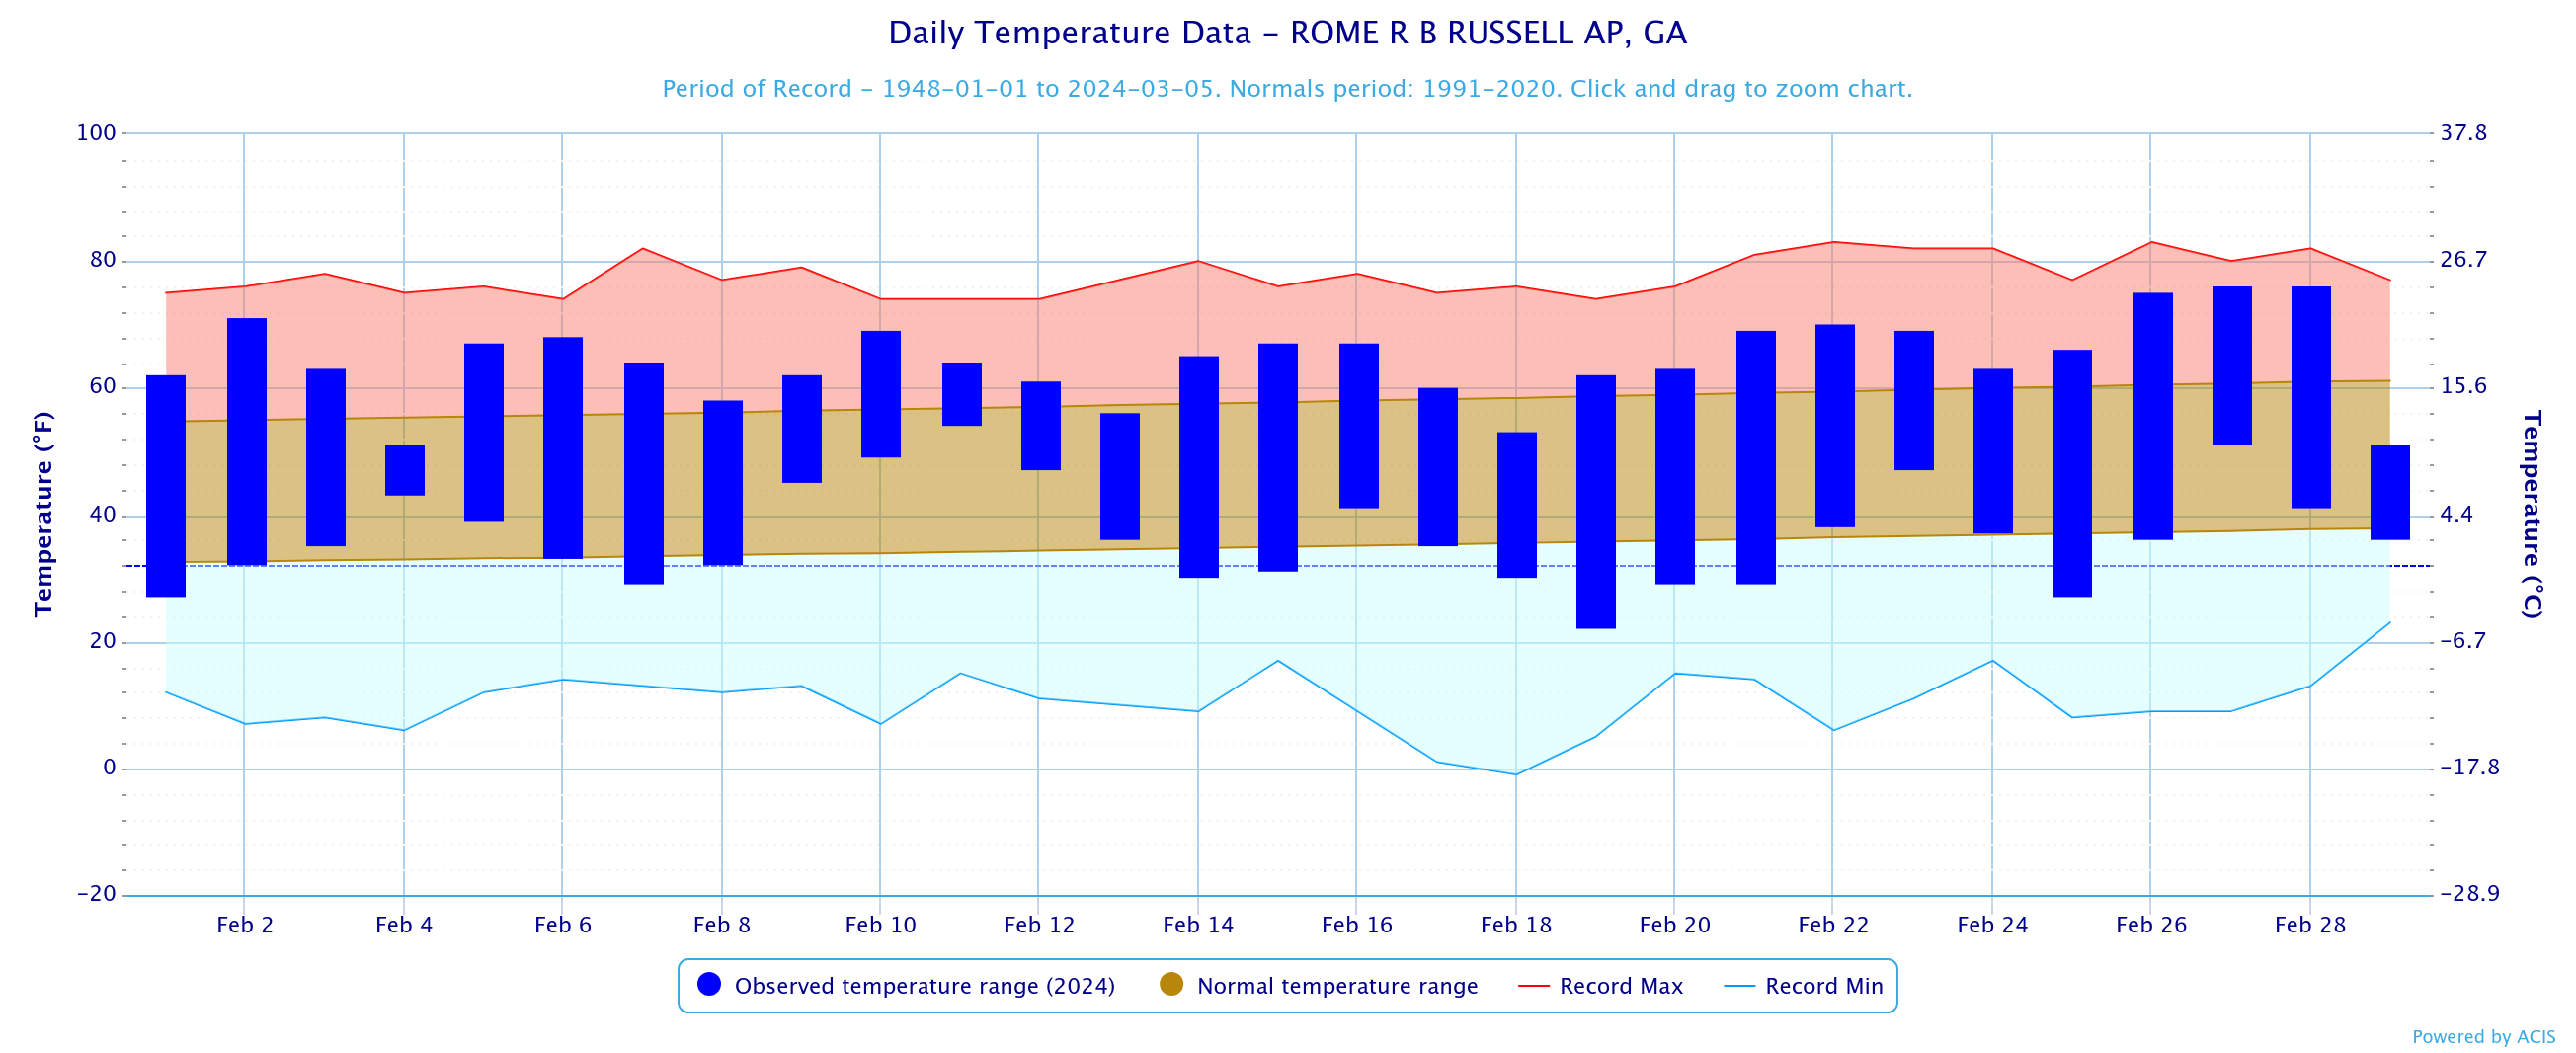
Rome
50.5
46.3
+4.2
February 2024 Temperature Climate Statistics
Minimum Temperature
Min T Date
Athens
77
2/28
28
2/25
Atlanta
75
2/28
31
2/18
Columbus
80
2/28
31
2/20
Macon
81
2/28
27
2/7
Dekalb Peachtree Arpt
74
2/28
28
2/1, 20
Fulton Co Arpt
76
2/28
28
2/20
Gainesville
75
2/28
29
2/25
Peachtree City
78
2/29
27
2/20
Rome
76
2/27, 28
22
2/19
February 2024 Precipitation Climate Statistics
Average Precipitation
From Normal)
Athens
5.03
4.36
+0.67
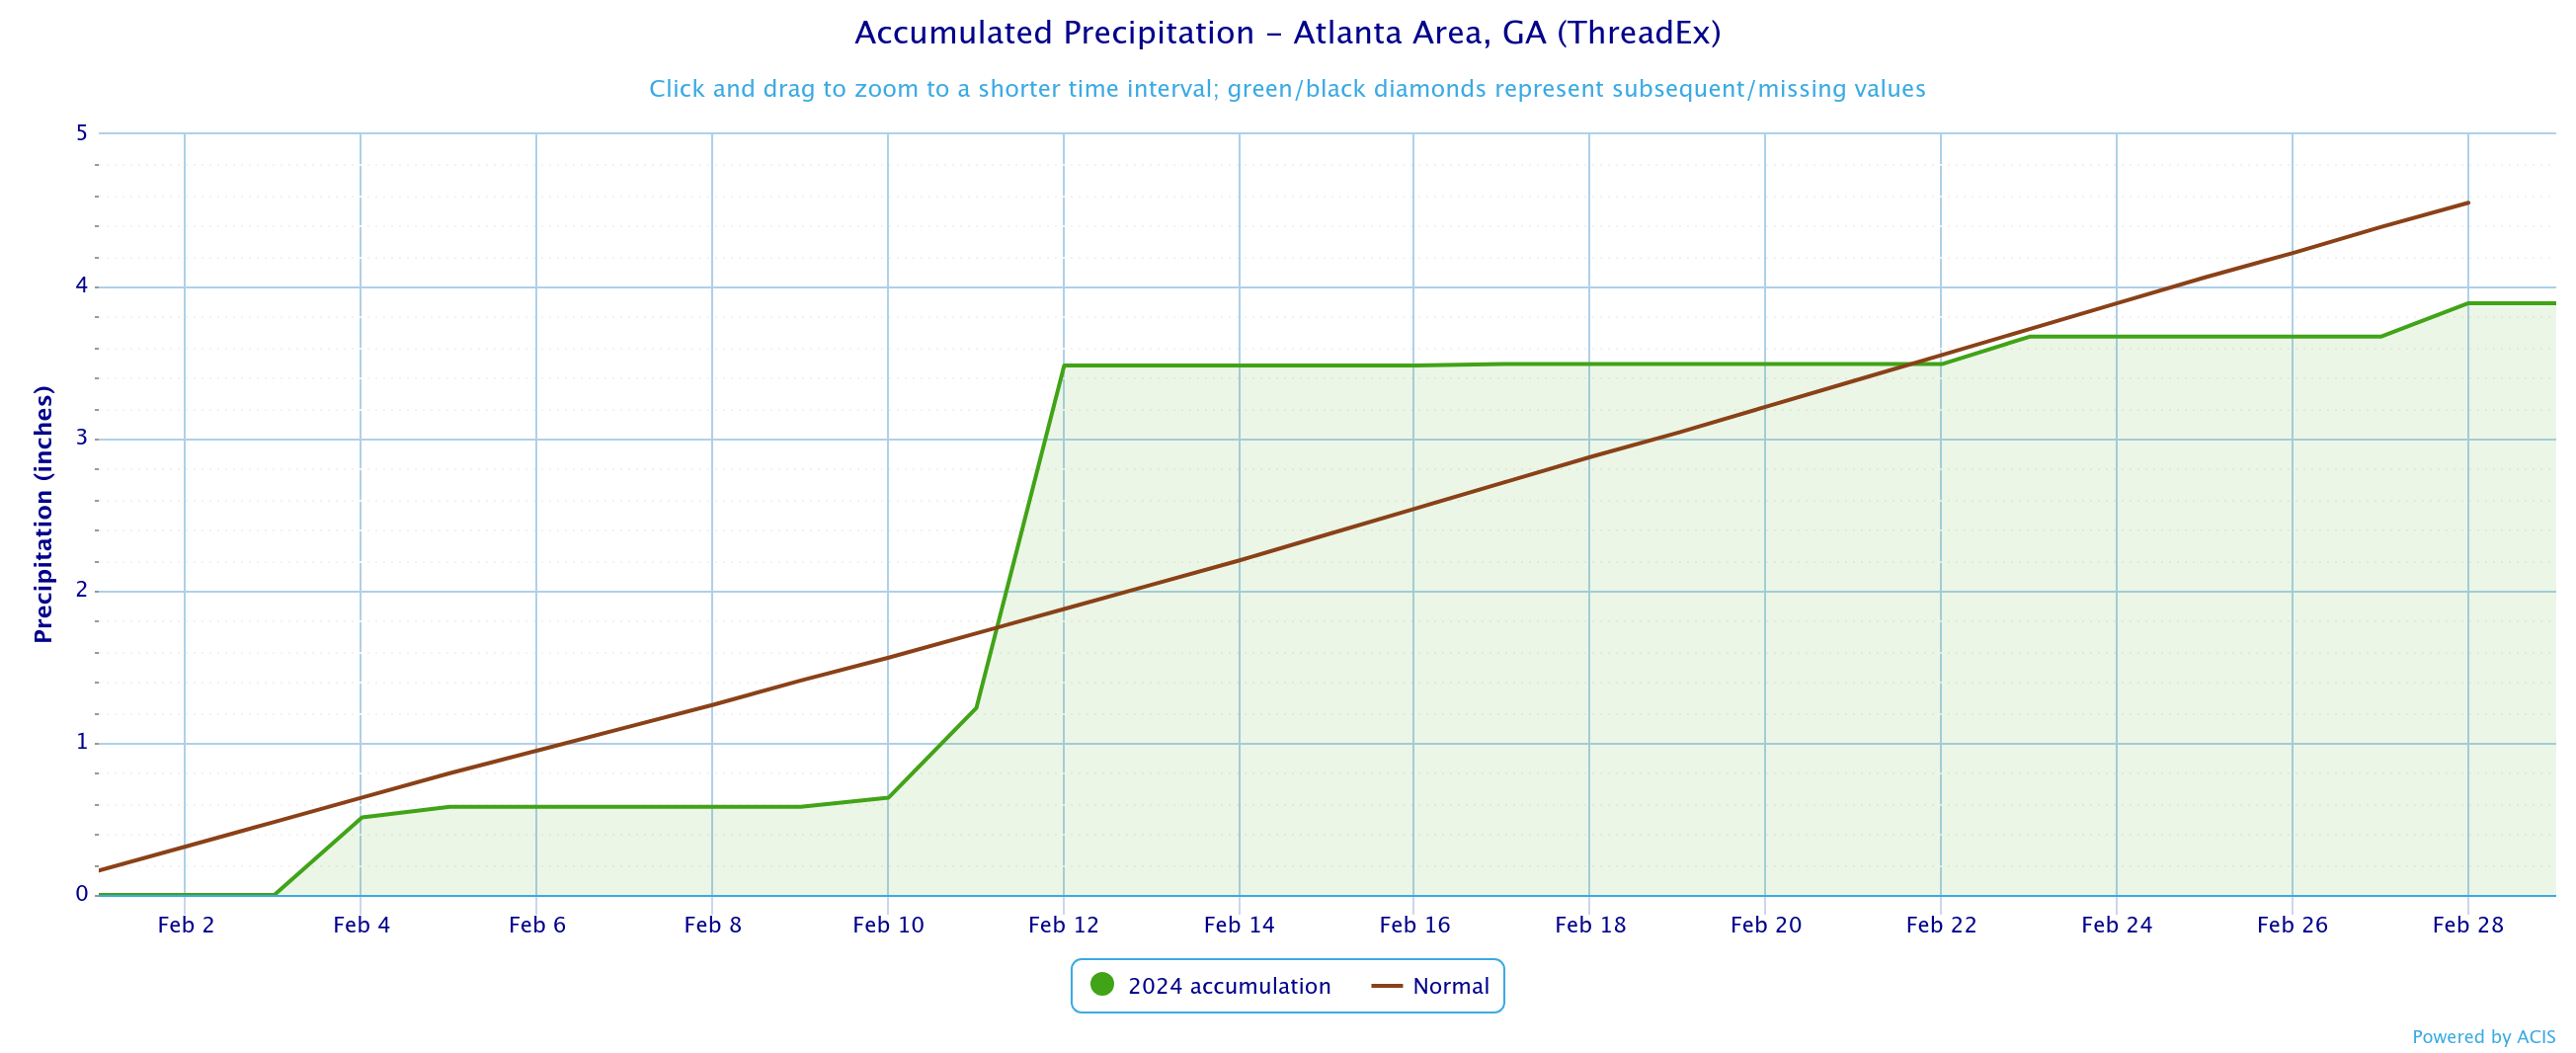
Atlanta
3.89
4.55
-0.66
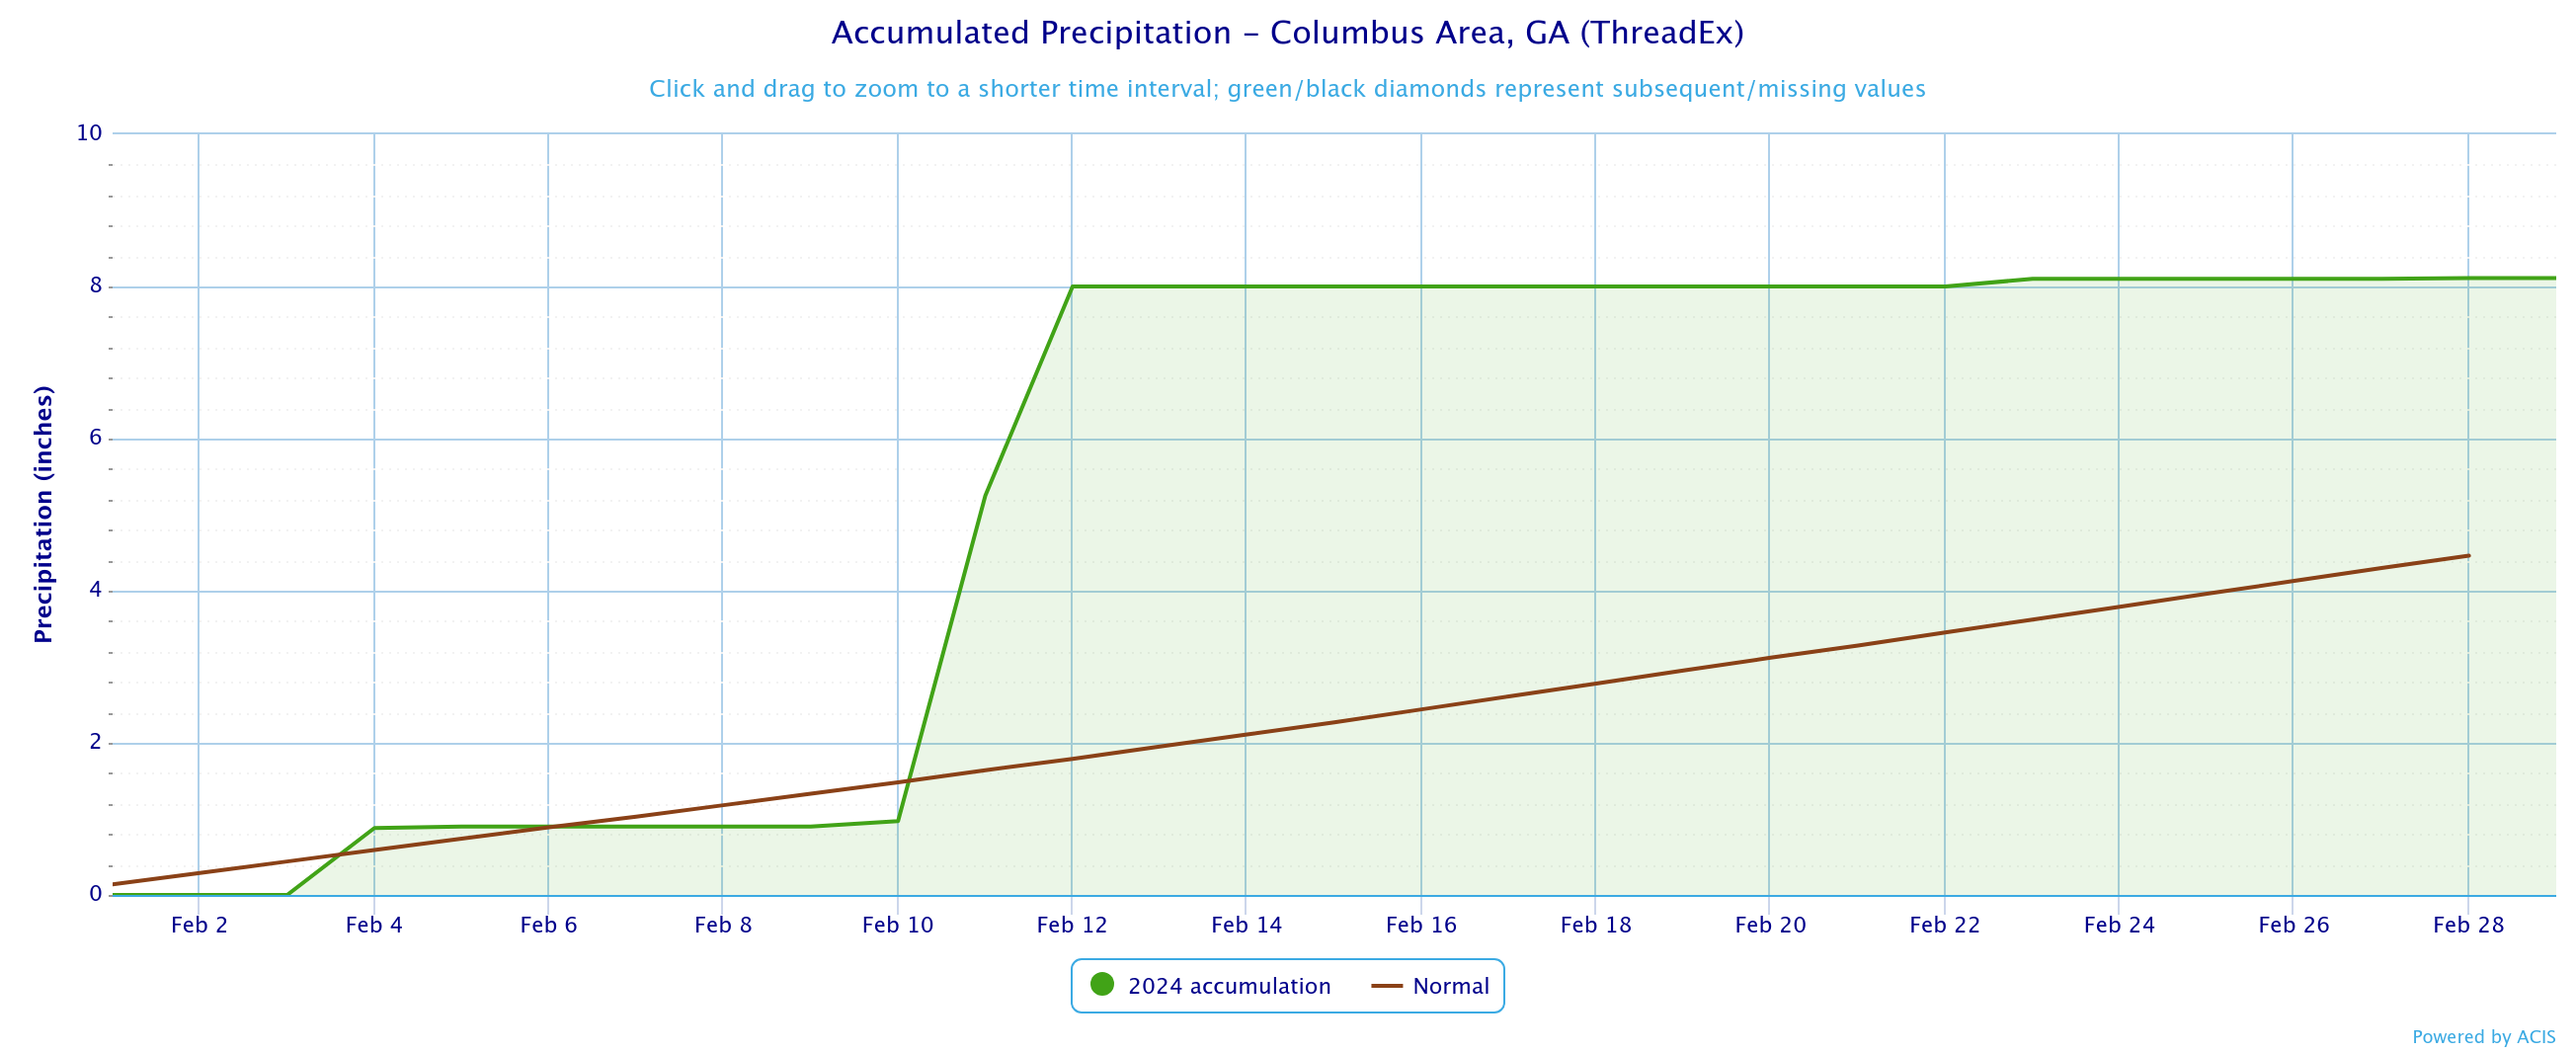
Columbus
8.11
4.46
+3.65
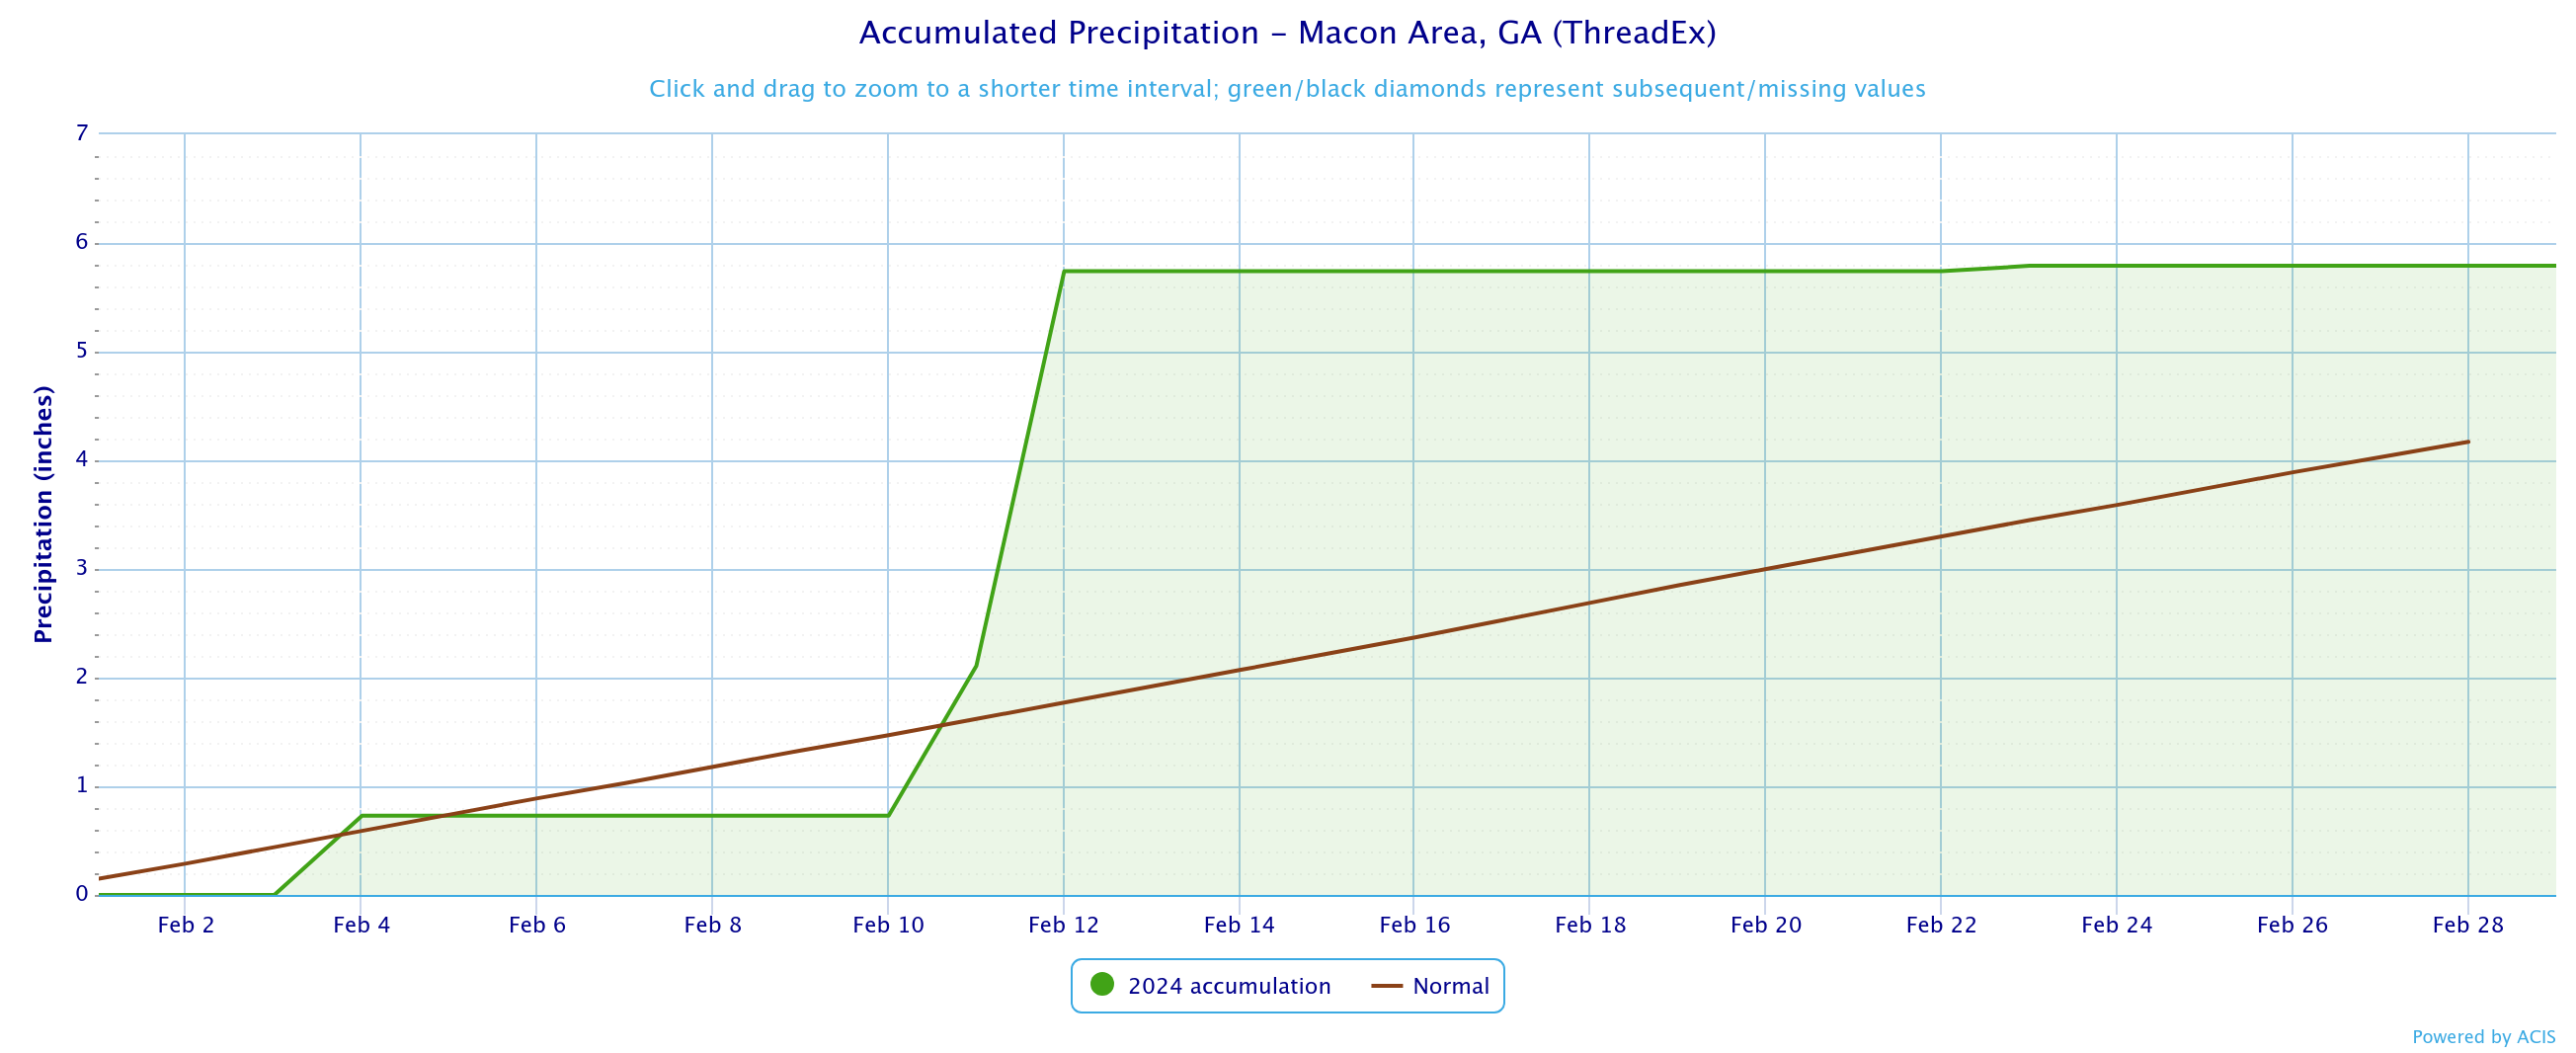
Macon
5.79
4.17
+1.62
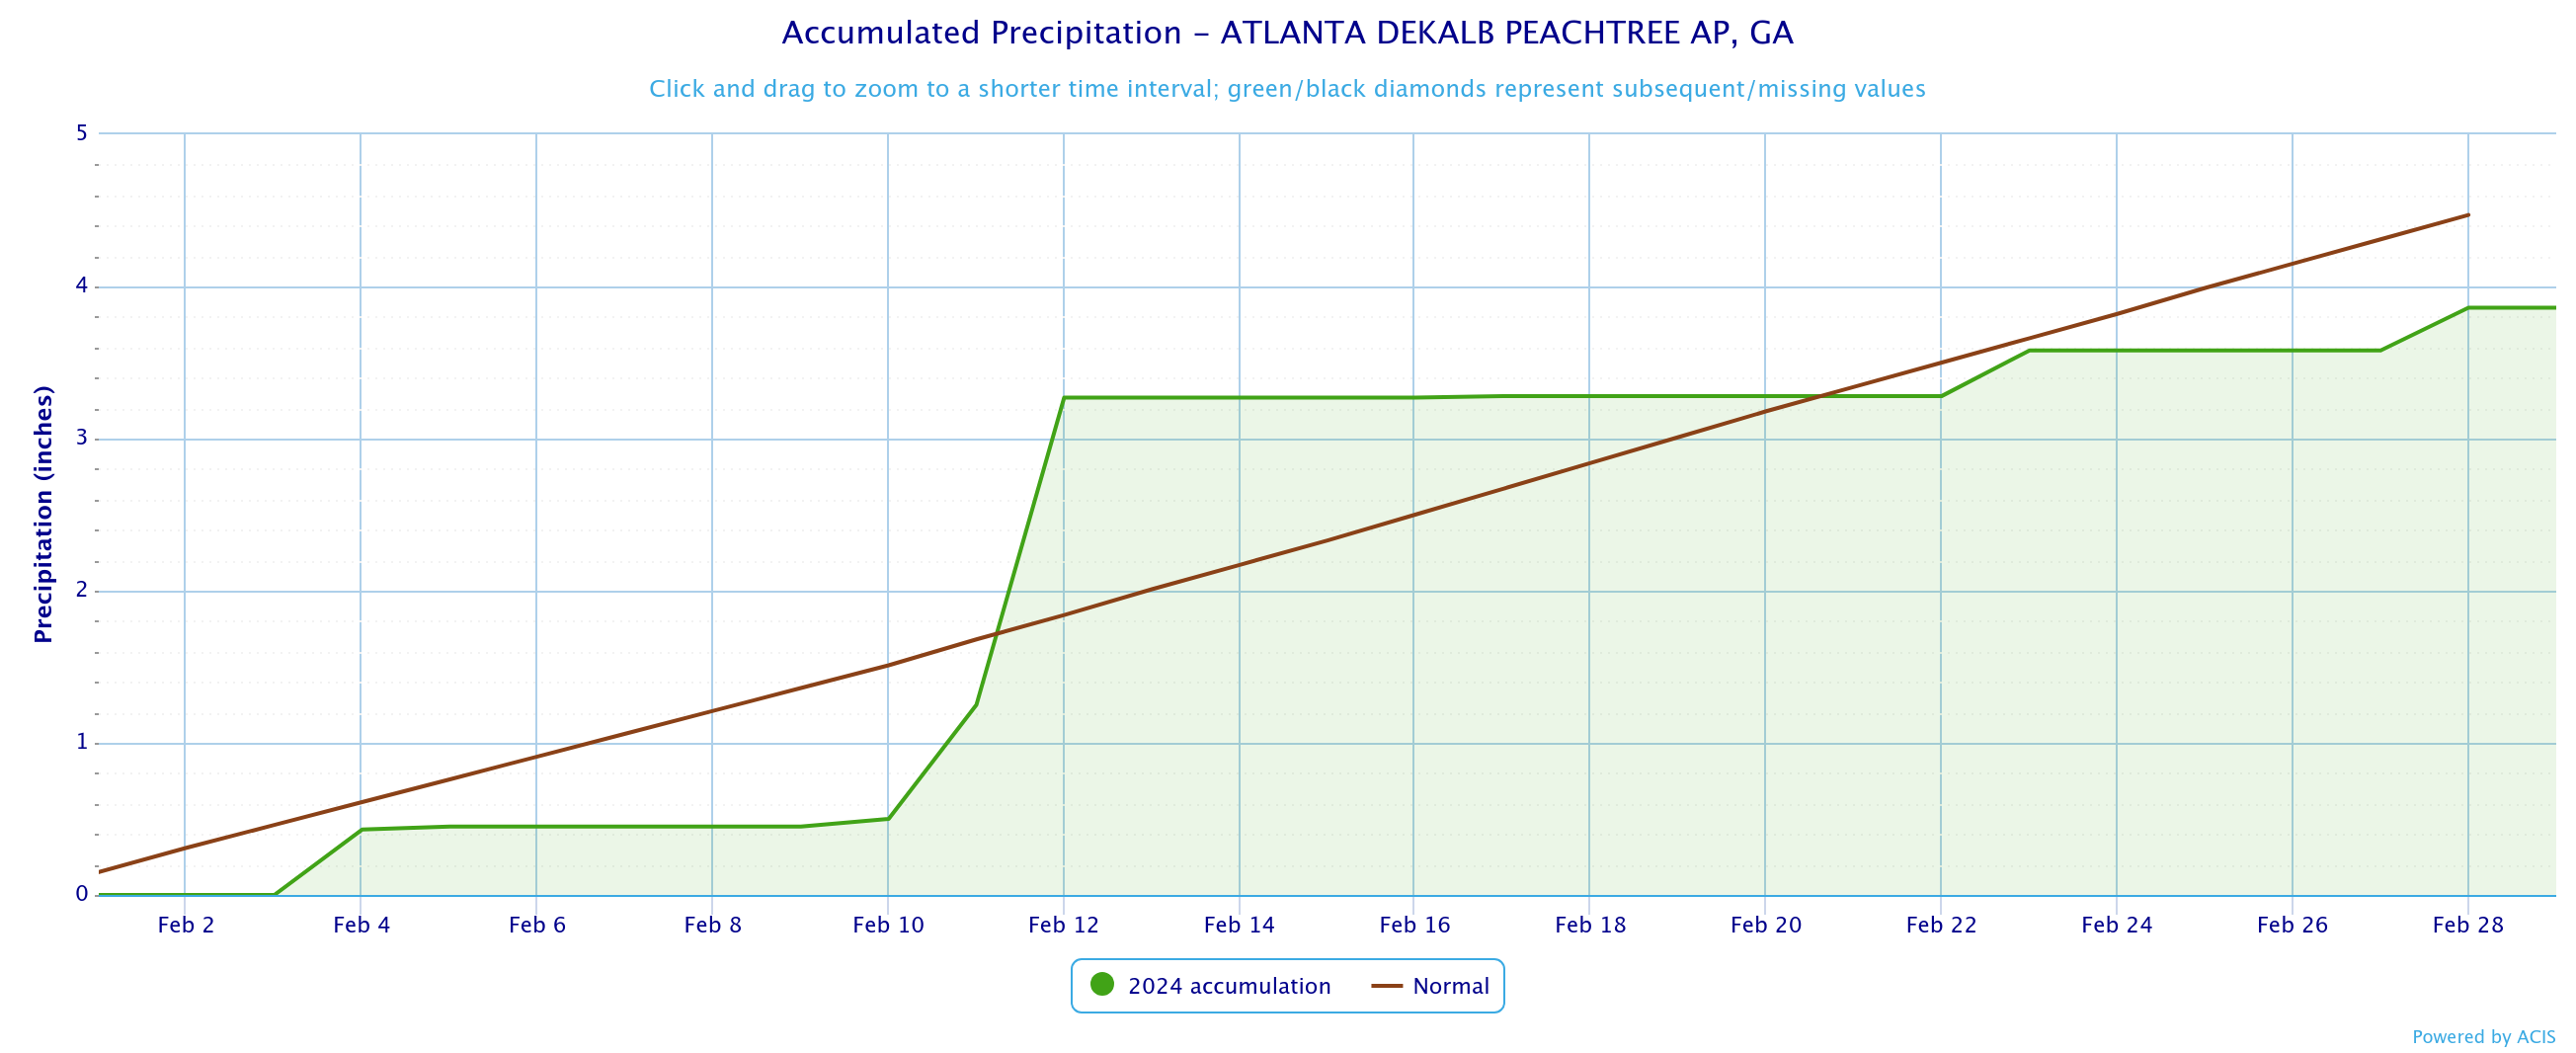
Dekalb Peachtree Arpt
3.86
4.47
-0.61
Fulton County Arpt
3.10
4.34
-1.24
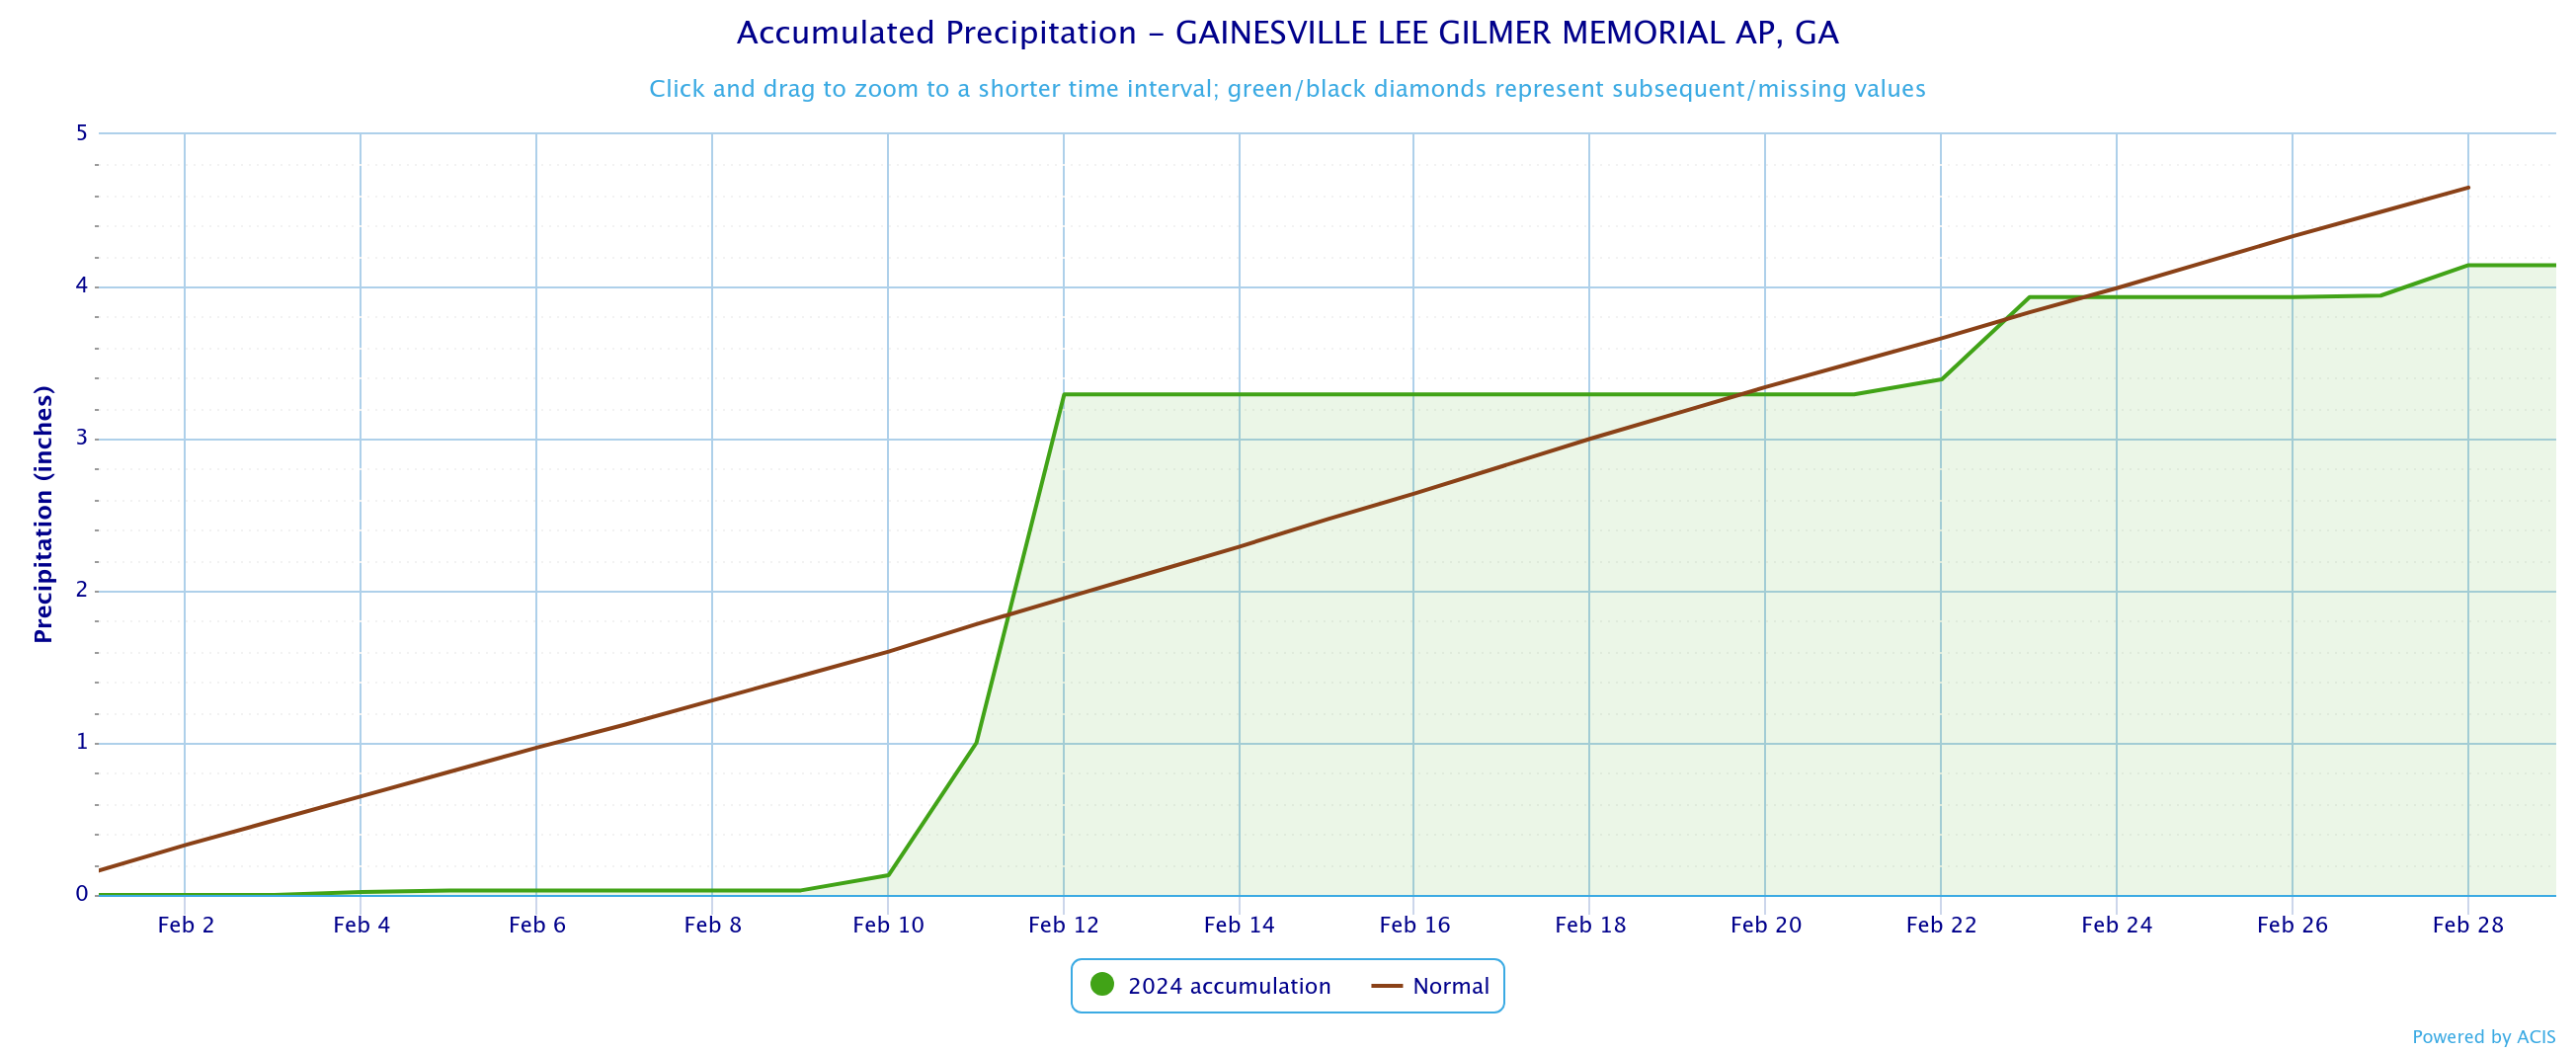
Gainesville
4.14
4.65
-0.51
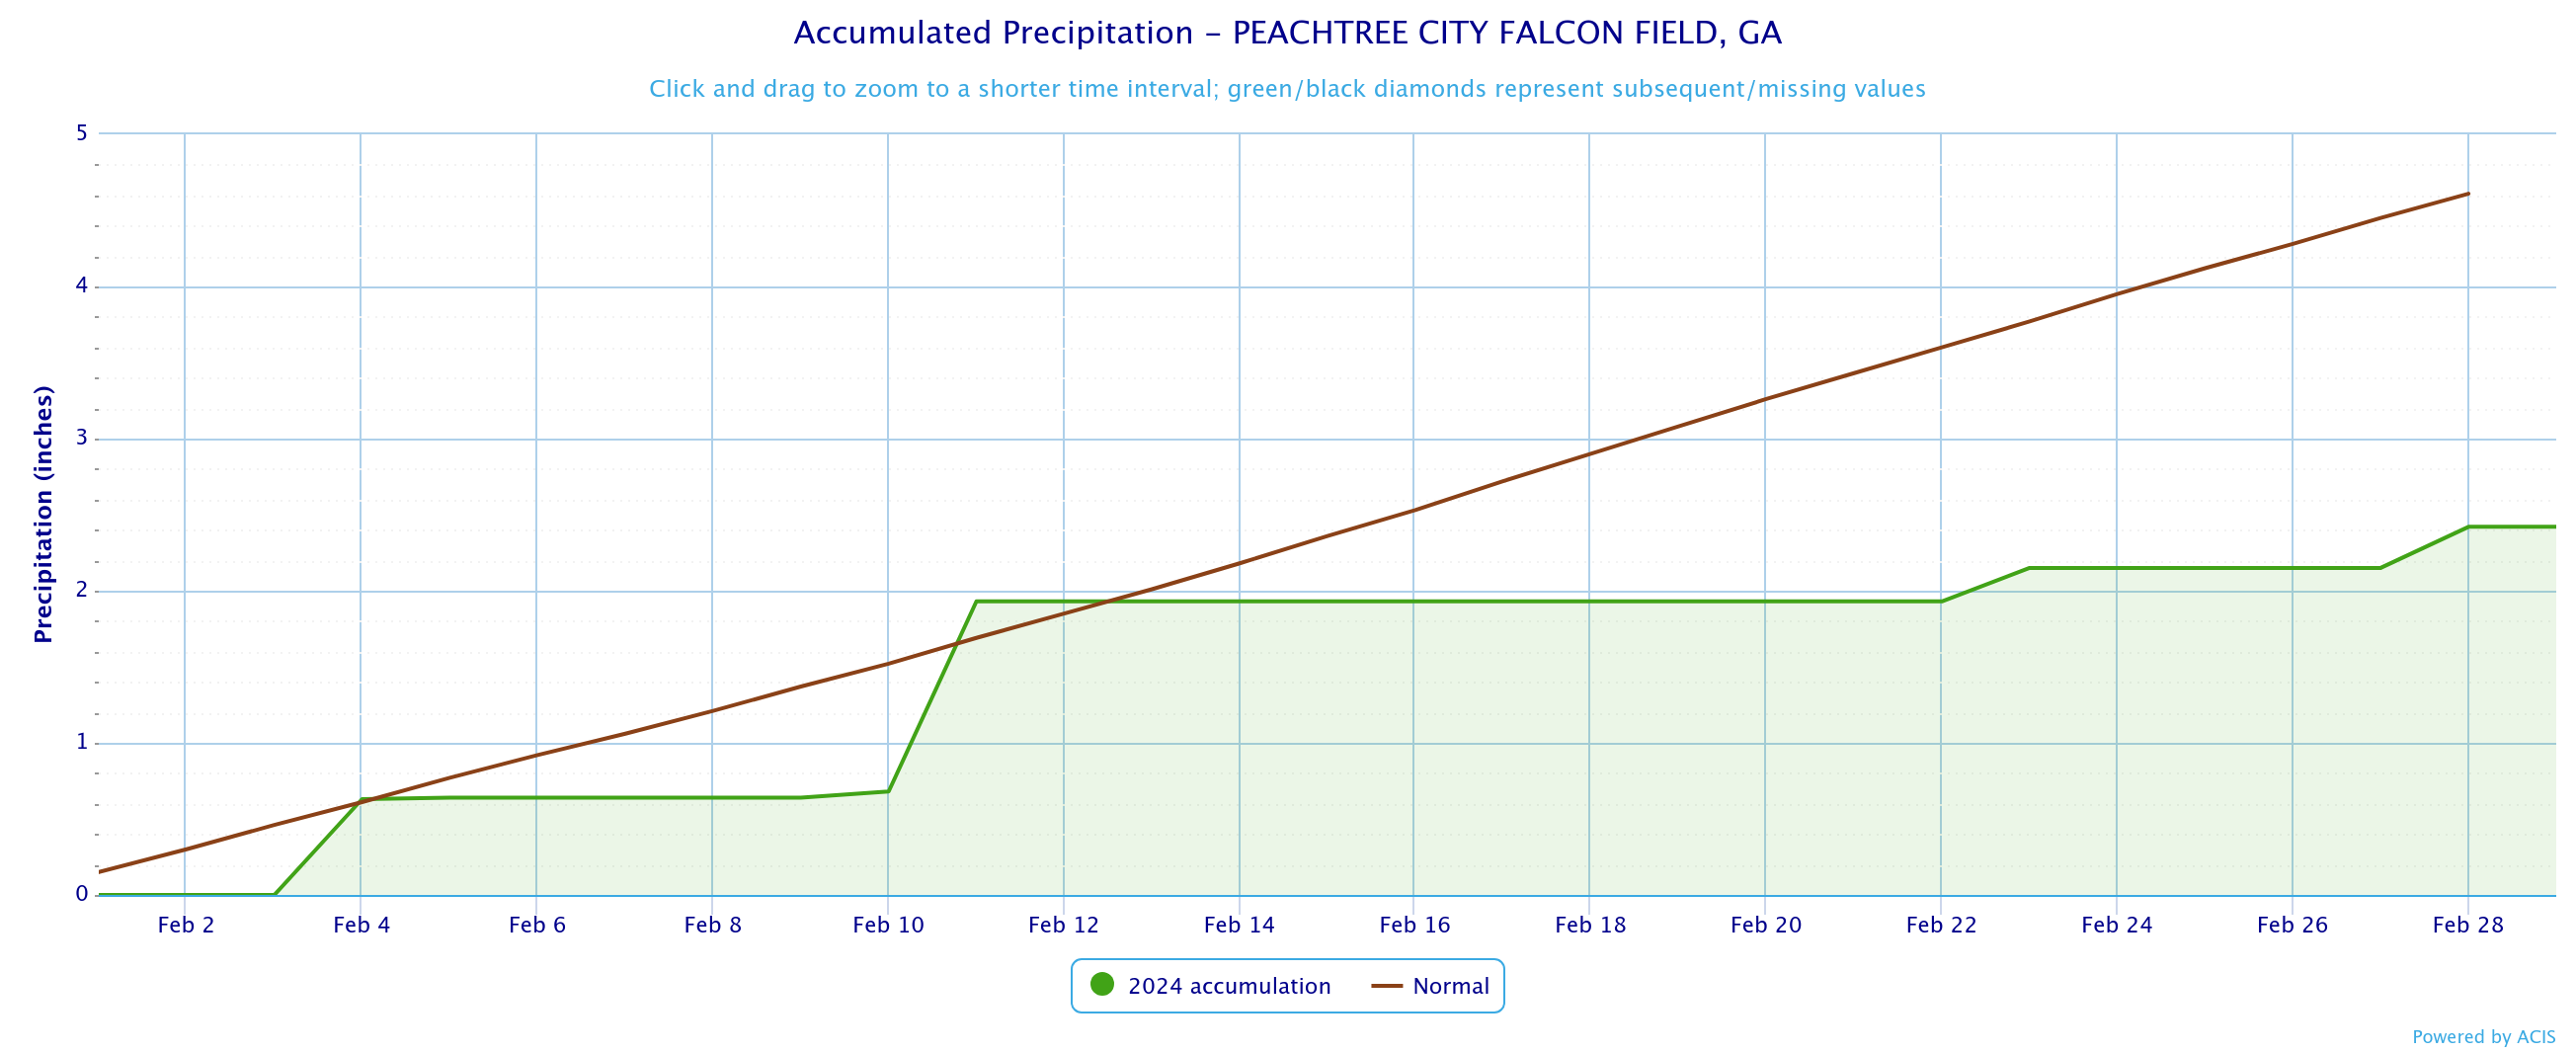
Peachtree City
2.42
4.61
-2.19
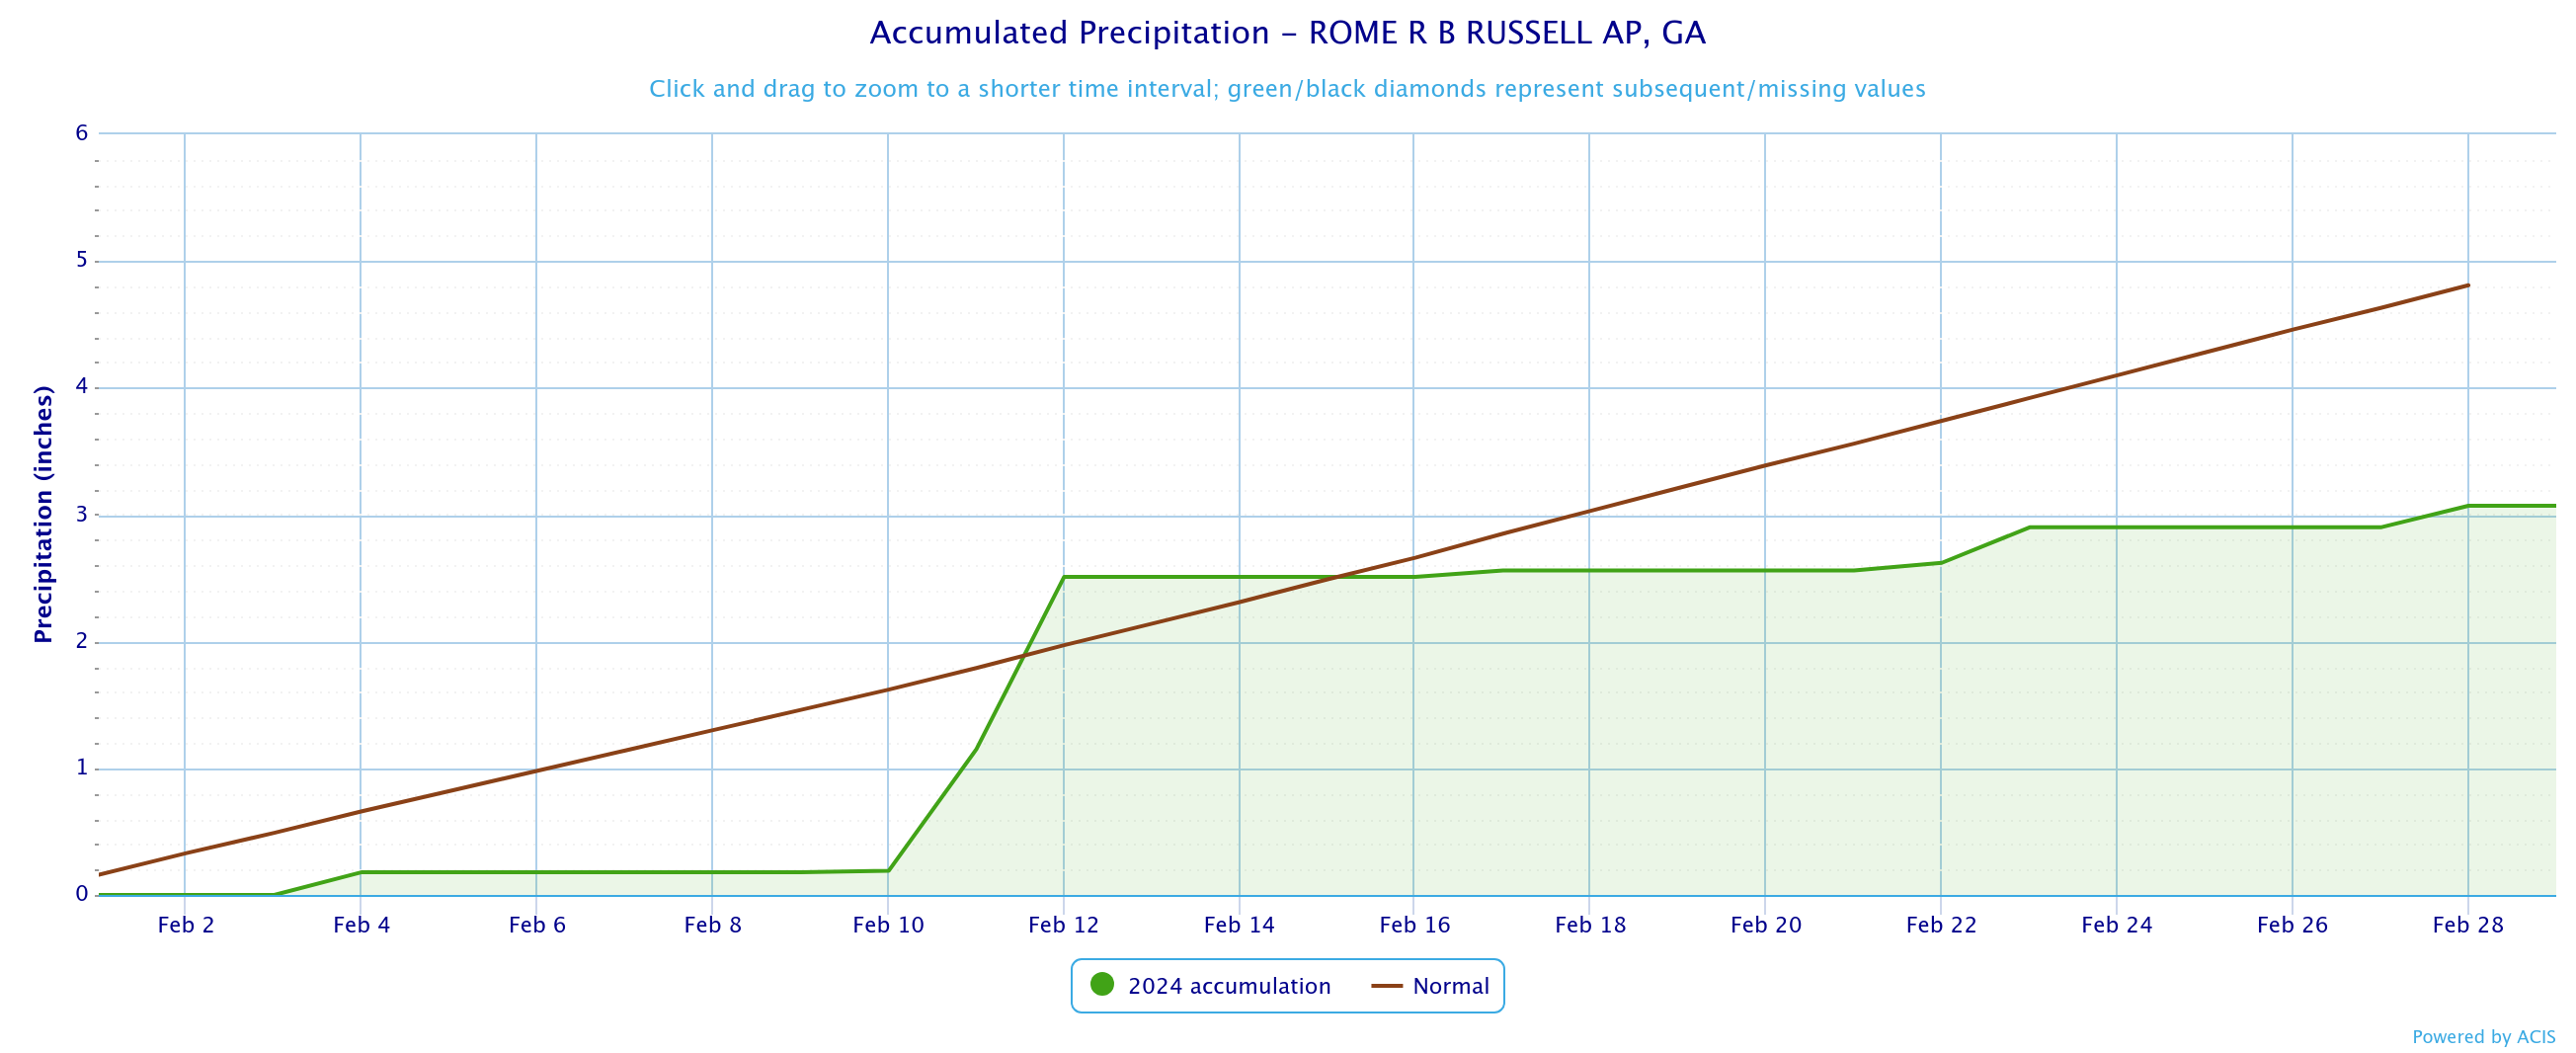
Rome
3.07
4.81
-1.74
February 2024 Precipitation Climate Statistics
Athens
3.73
2/11
Atlanta
2.67
2/11
Columbus
6.90
2/11
Macon
4.92
2/11
Dekalb Peachtree Arpt
2.59
2/11
Fulton Co Arpt
2.37
2/11
Gainesville
2.77
2/11
Peachtree City
1.25
2/11
Rome
1.55
2/11
Click the links below to explore the temperature and precipitation data across north and central Georgia for the month of February 2024.
Temperature Maps
Precipitation Maps
Temperature Graphs
Precipitation Graphs
Temperature and precipitation records at our 4 main climate sites are located below.
February 2024 Climate Records
Date
Type
Location
Records set over a 24 hour period
2/12
Precip
Athens
A record 24 hour rainfall total was set at 3.06". This breaks the old record of 2.08" set in 1945.
2/12
Precip
Columbus
A record 24 hour rainfall total was set at 4.28". This breaks the old record of 3.65" set in 1900.
2/12
Precip
Macon
A record 24 hour rainfall total was set at 3.63". This breaks the old record of 3.61" set in 1905.
Larger events that occurred across north and central Georgia this past February can be found here.
March Outlook