| Previous Month | Next Month |
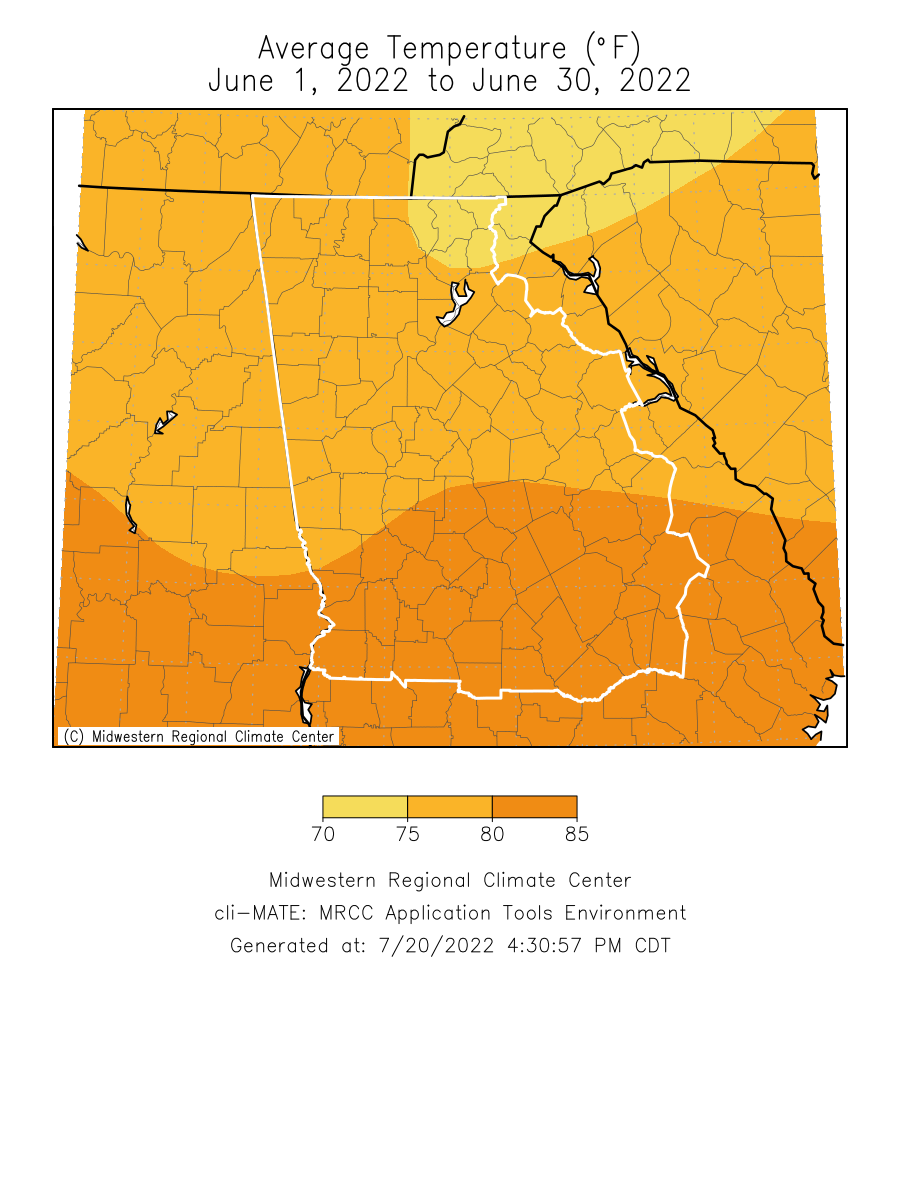
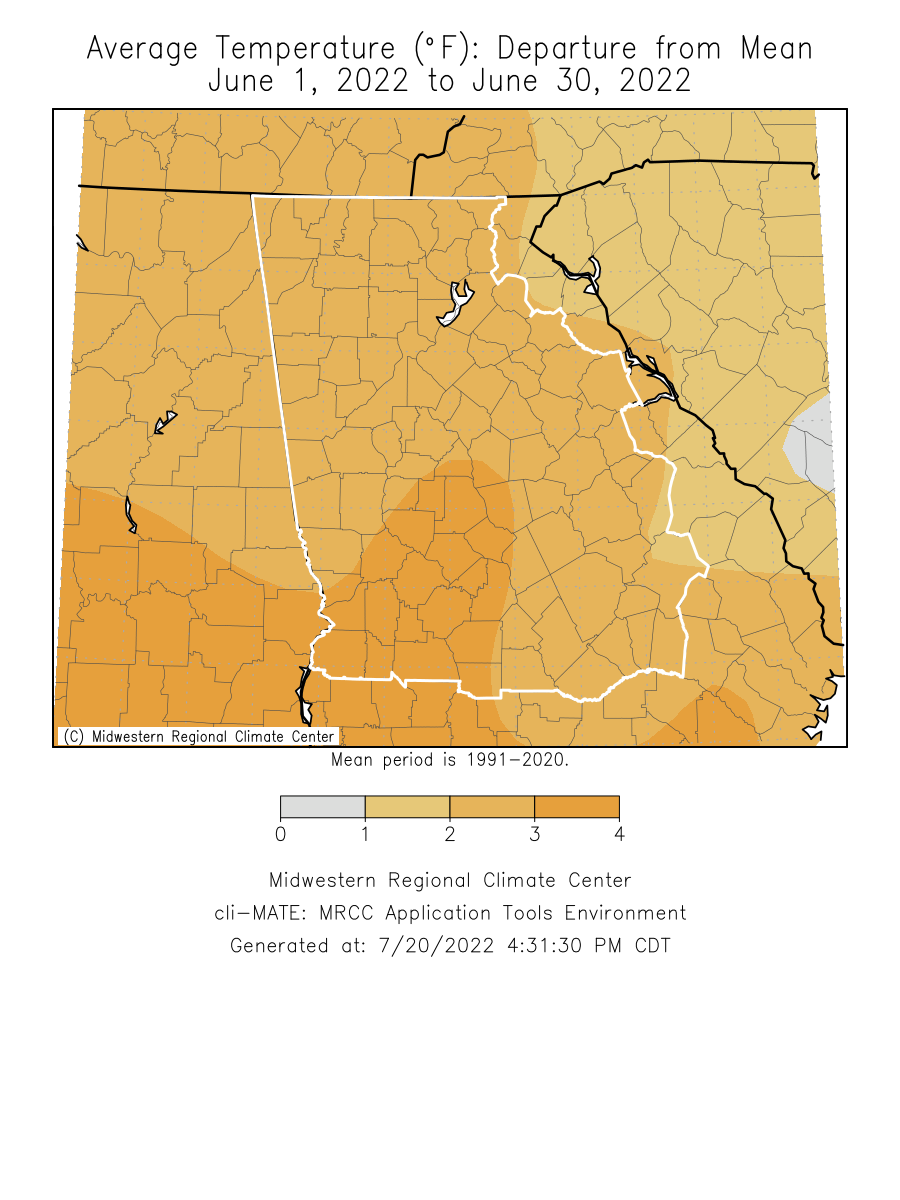
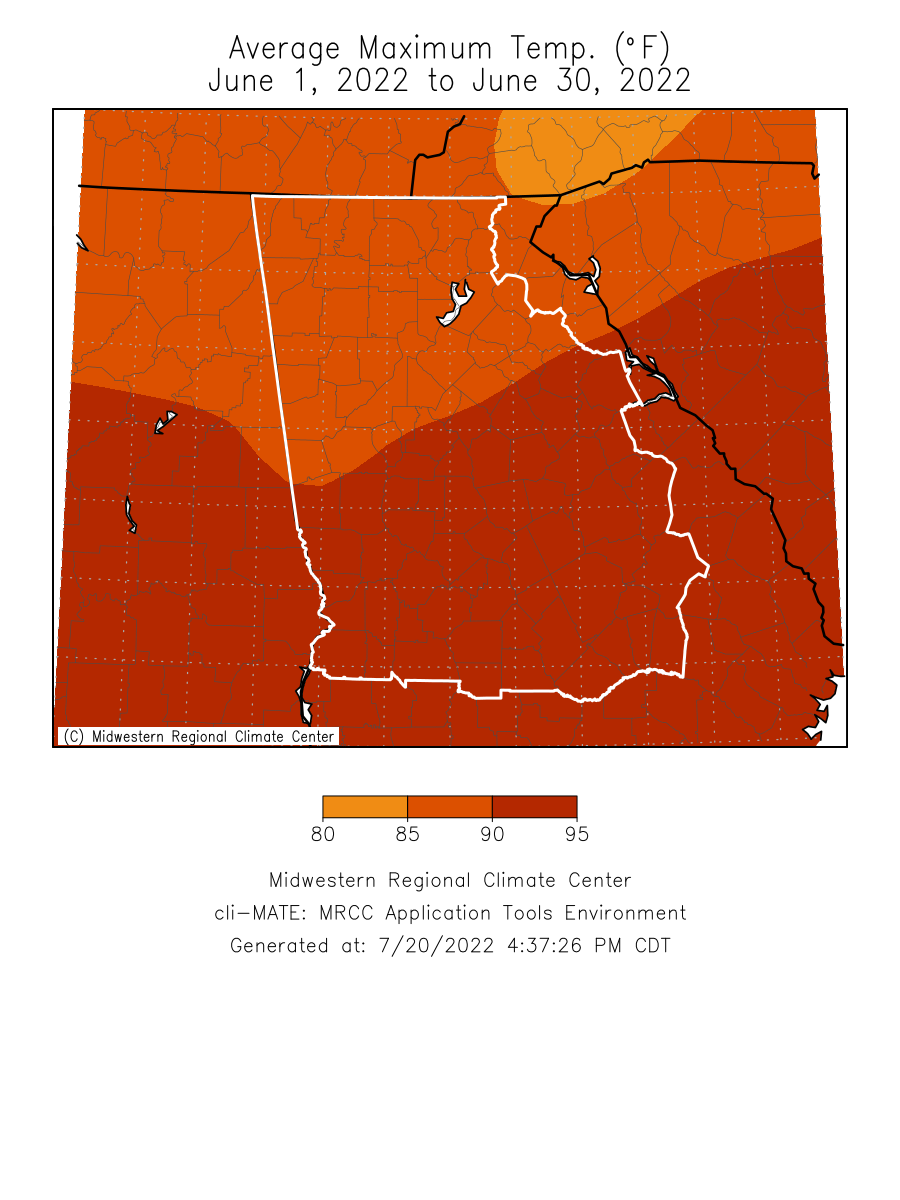
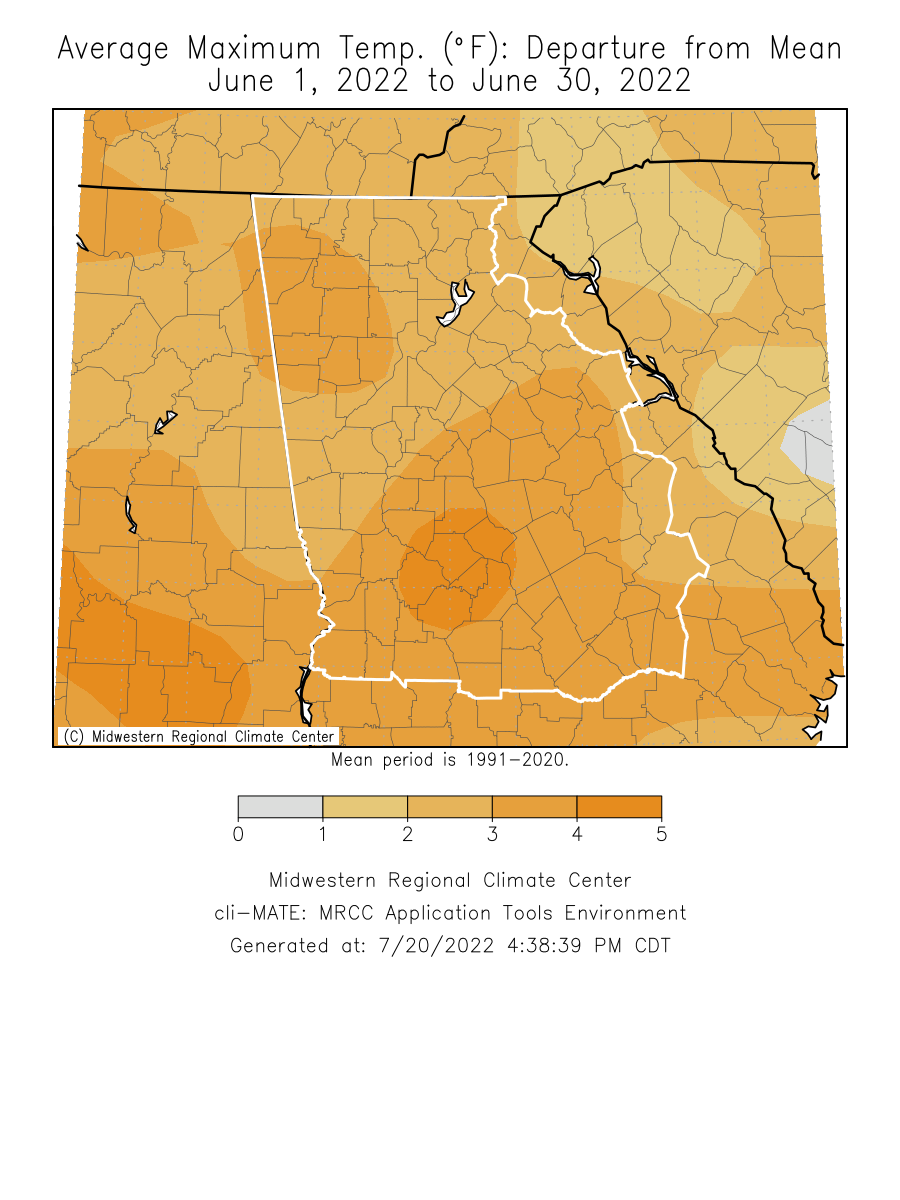
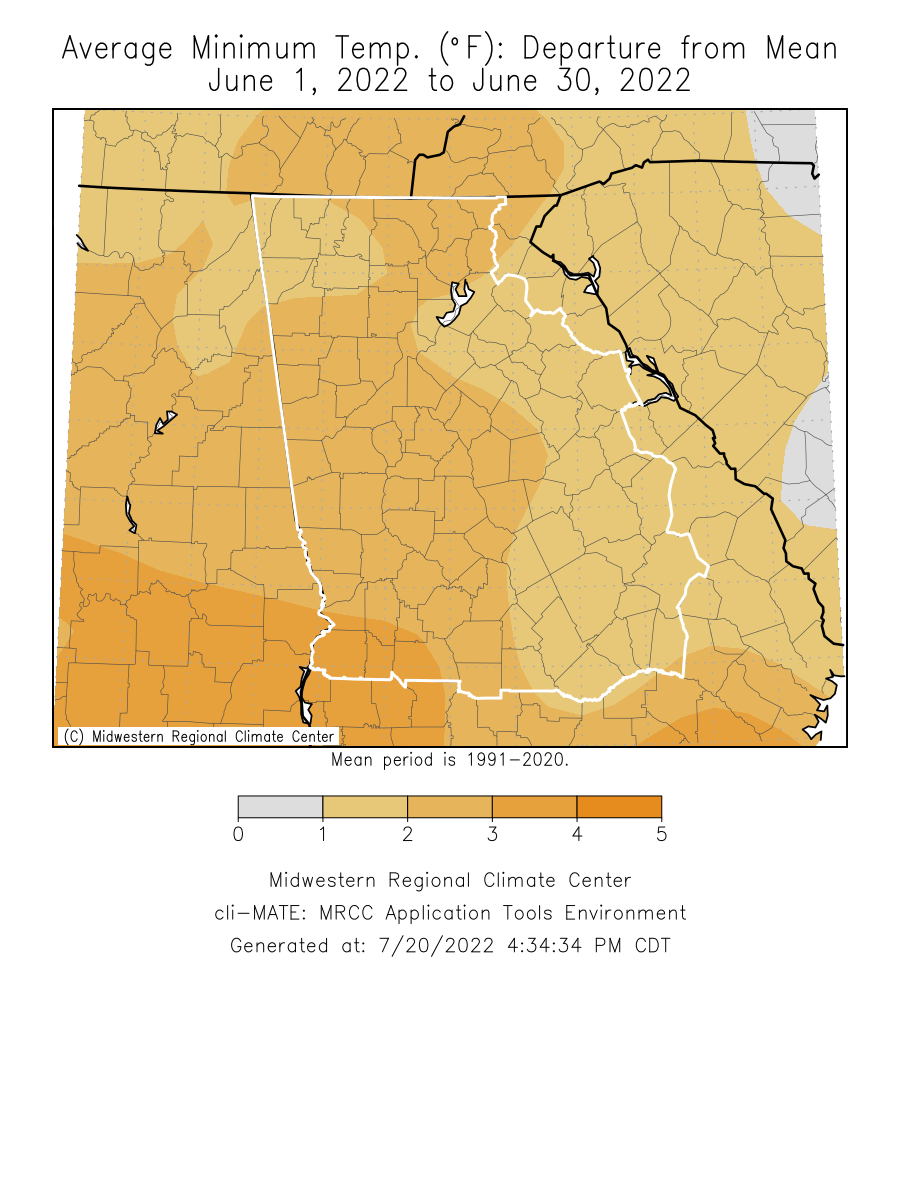
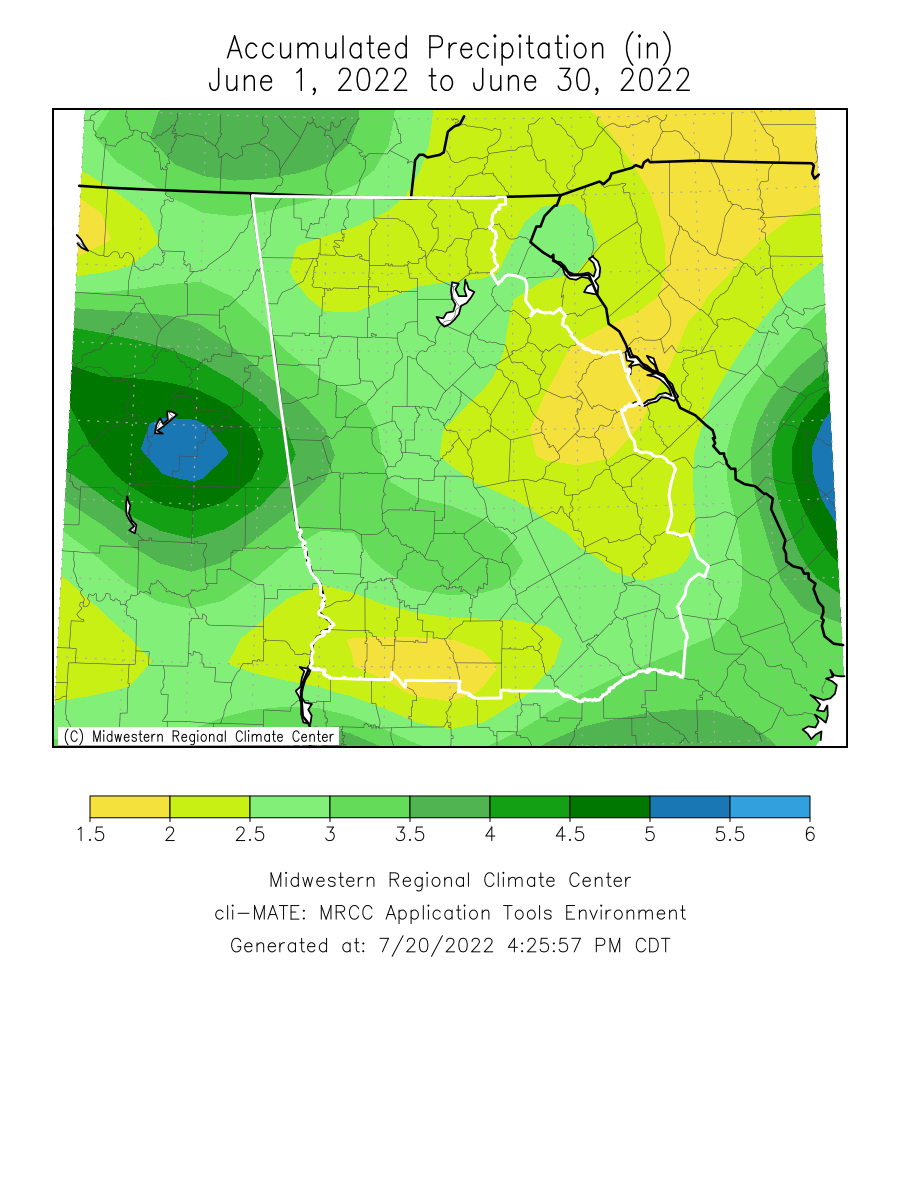
Temperatures through the month of June were around 3 degrees above of normal. Precipitation through the month of May was within 3 inches of normal.
Climate Site Maximum Temperature Max T Date *Indicates a daily record was set Climate Site Total Precipitation DFN (Departure Climate Site Maximum Daily Precip (in inches) Max P Date *Indicates a daily record was set Data prepared by NWS Peachtree City/Atlanta June 2nd North Georgia June 2nd: Strong daytime heating out ahead of a cold front across the southern Appalachians created an environment with plenty of surface based instability. This combined with strong midlevel lapse rates allowed afternoon convection storms to become strong to severe. While an organized thunderstorm threat was never realized, across northern Georgia there were multiple reports of tree damage due to winds. June 15-17 North Georgia June 15-16th: By the late morning, temperatures were well on the way to triple digits across the area. Some weak easterly flow was enough to cause a loosely formed MCS to emerge driven by the cold pools of local convections. The MCS provided additional evaporative cooling as well as an outflow boundary which allowed for numerous damaging downbursts across the western part of the CWA. June 17th: A long lived MCS out of Kentucky and Tennessee took advantage of another day of triple digit temperatures across the SE to roll through Georgia all the way to the Atlantic Coast. A well mixed boundary layer and steep mid-level lapse rates allowed for damaging wind swaths and locally severe wind gusts to sweep across north and central Georgia before finally dying out as it interacted with the sea breeze from the GA/SC coast. June 24th South/Central Georgia June 24th: High heat and humidity created a very unstable airmass. A corridor of dewpoints in the mid to upper 70s developed from central FL and extended into central GA. As daytime heating continued, pockets of MLCAPE exceeding 3000 J/KG. Given the soupy conditions, shear was nearly non existent and the threat was limited to locally strong damaging microbursts in the late afternoon. Based on the Climate Prediction Center's outlook for July, northern Georgia has a 40% to 50% chance for above normal temperatures while central Georgia has a 50% to 60% chance for above normal temperatures. For precipitation, central Georgia has an equal chance for above or below normal precipitation, while northern Georgia has a 33%-40% chance for above normal precipitation. Data prepared by NWS Peachtree City/Atlanta
Overview
Climate Graphics
Records
Events
July Outlook
Below are the overview stats for June 2022 for our 10 climate sites.
June 2022 Climate Averages
Climate Site
June Temp (°F)
Average Temp
Departure from normal
80.7
77.0
3.7
81.1
77.1
4.0
82.9
79.4
3.5
81.9
79.2
2.7
78.6
76.1
0.2
79.4
77.5
1.9
79.2
77.3
1.9
79.2
76.3
2.9
79.6
76.2
3.4
80.0
76.3
3.7
June 2022 Temperature Climate Statistics
Minimum Temperature
Min T Date
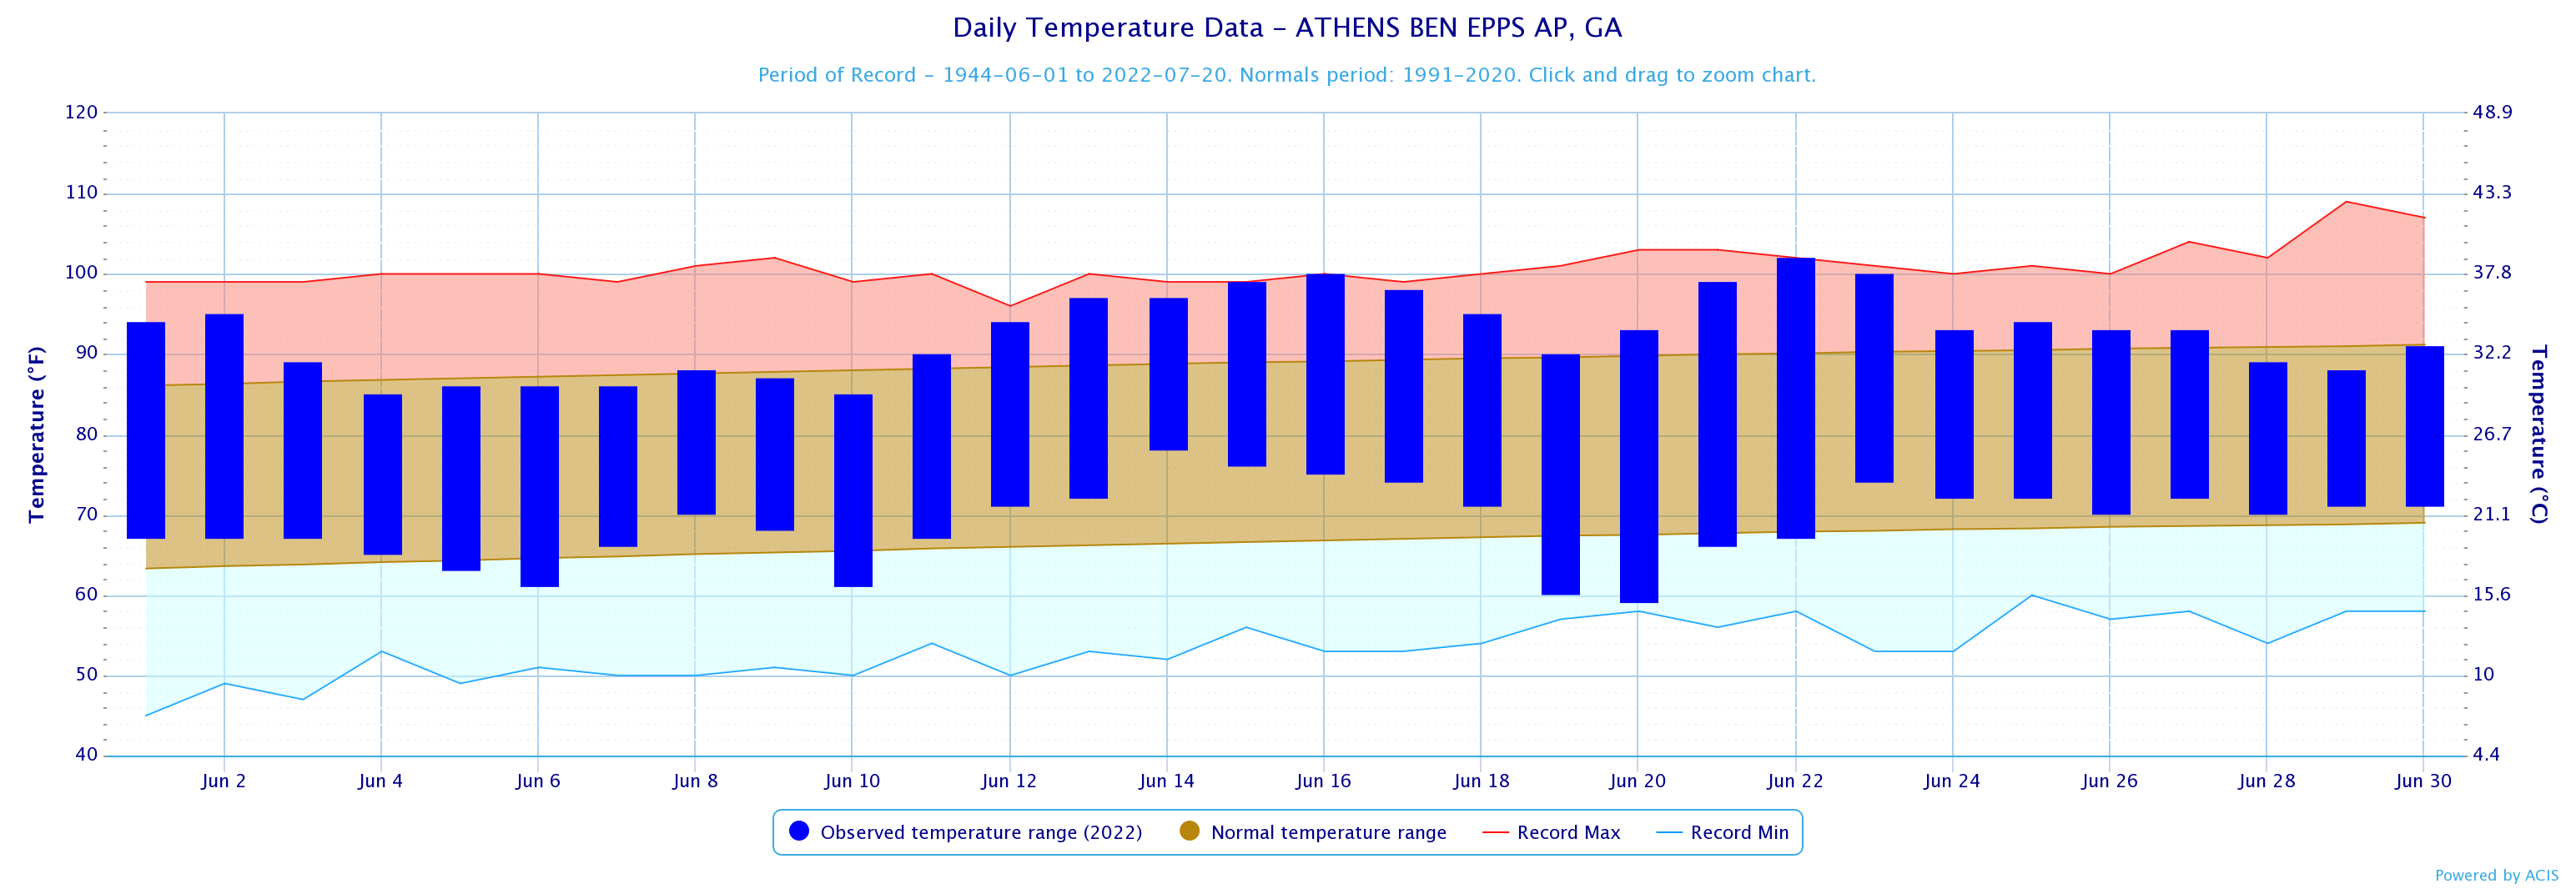
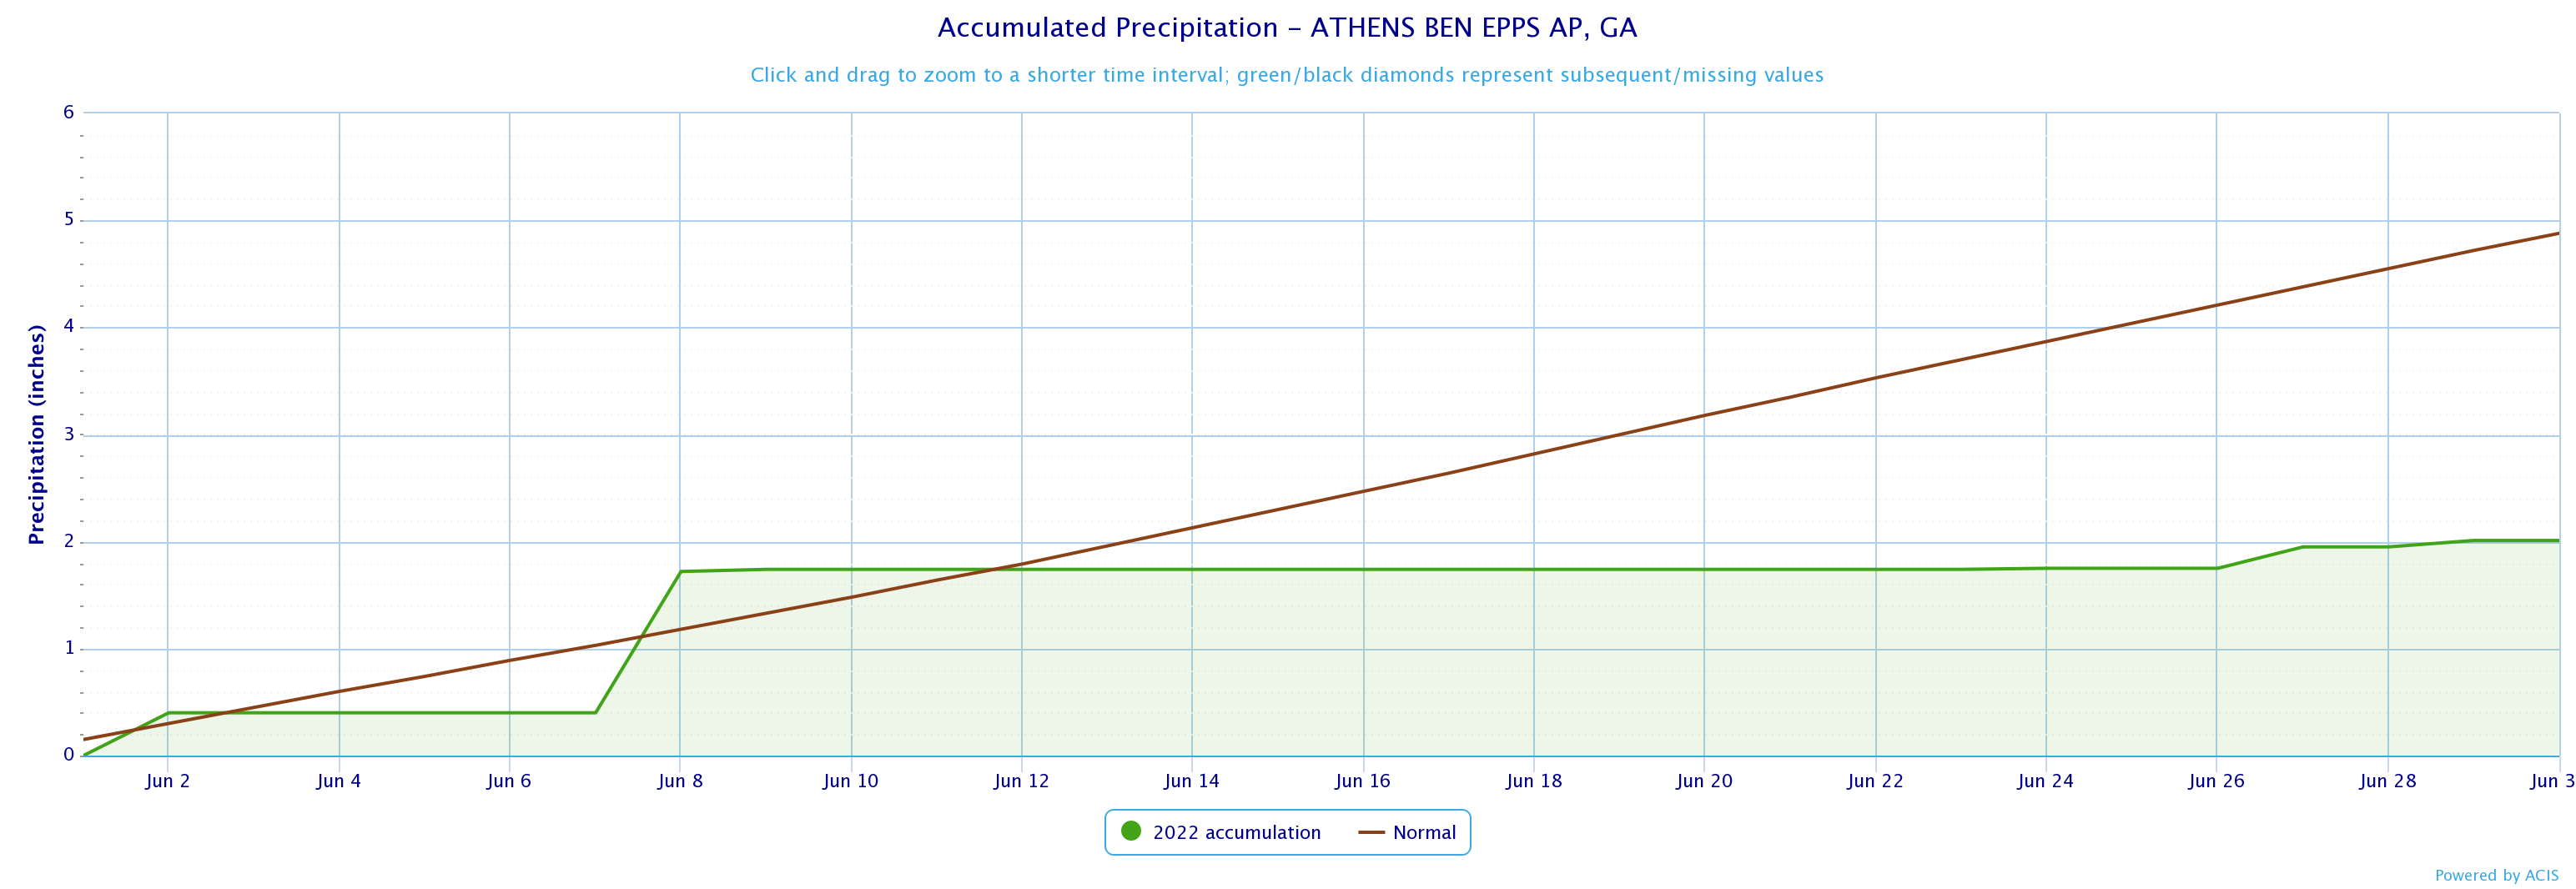
Athens
102
6/22
59
6/20
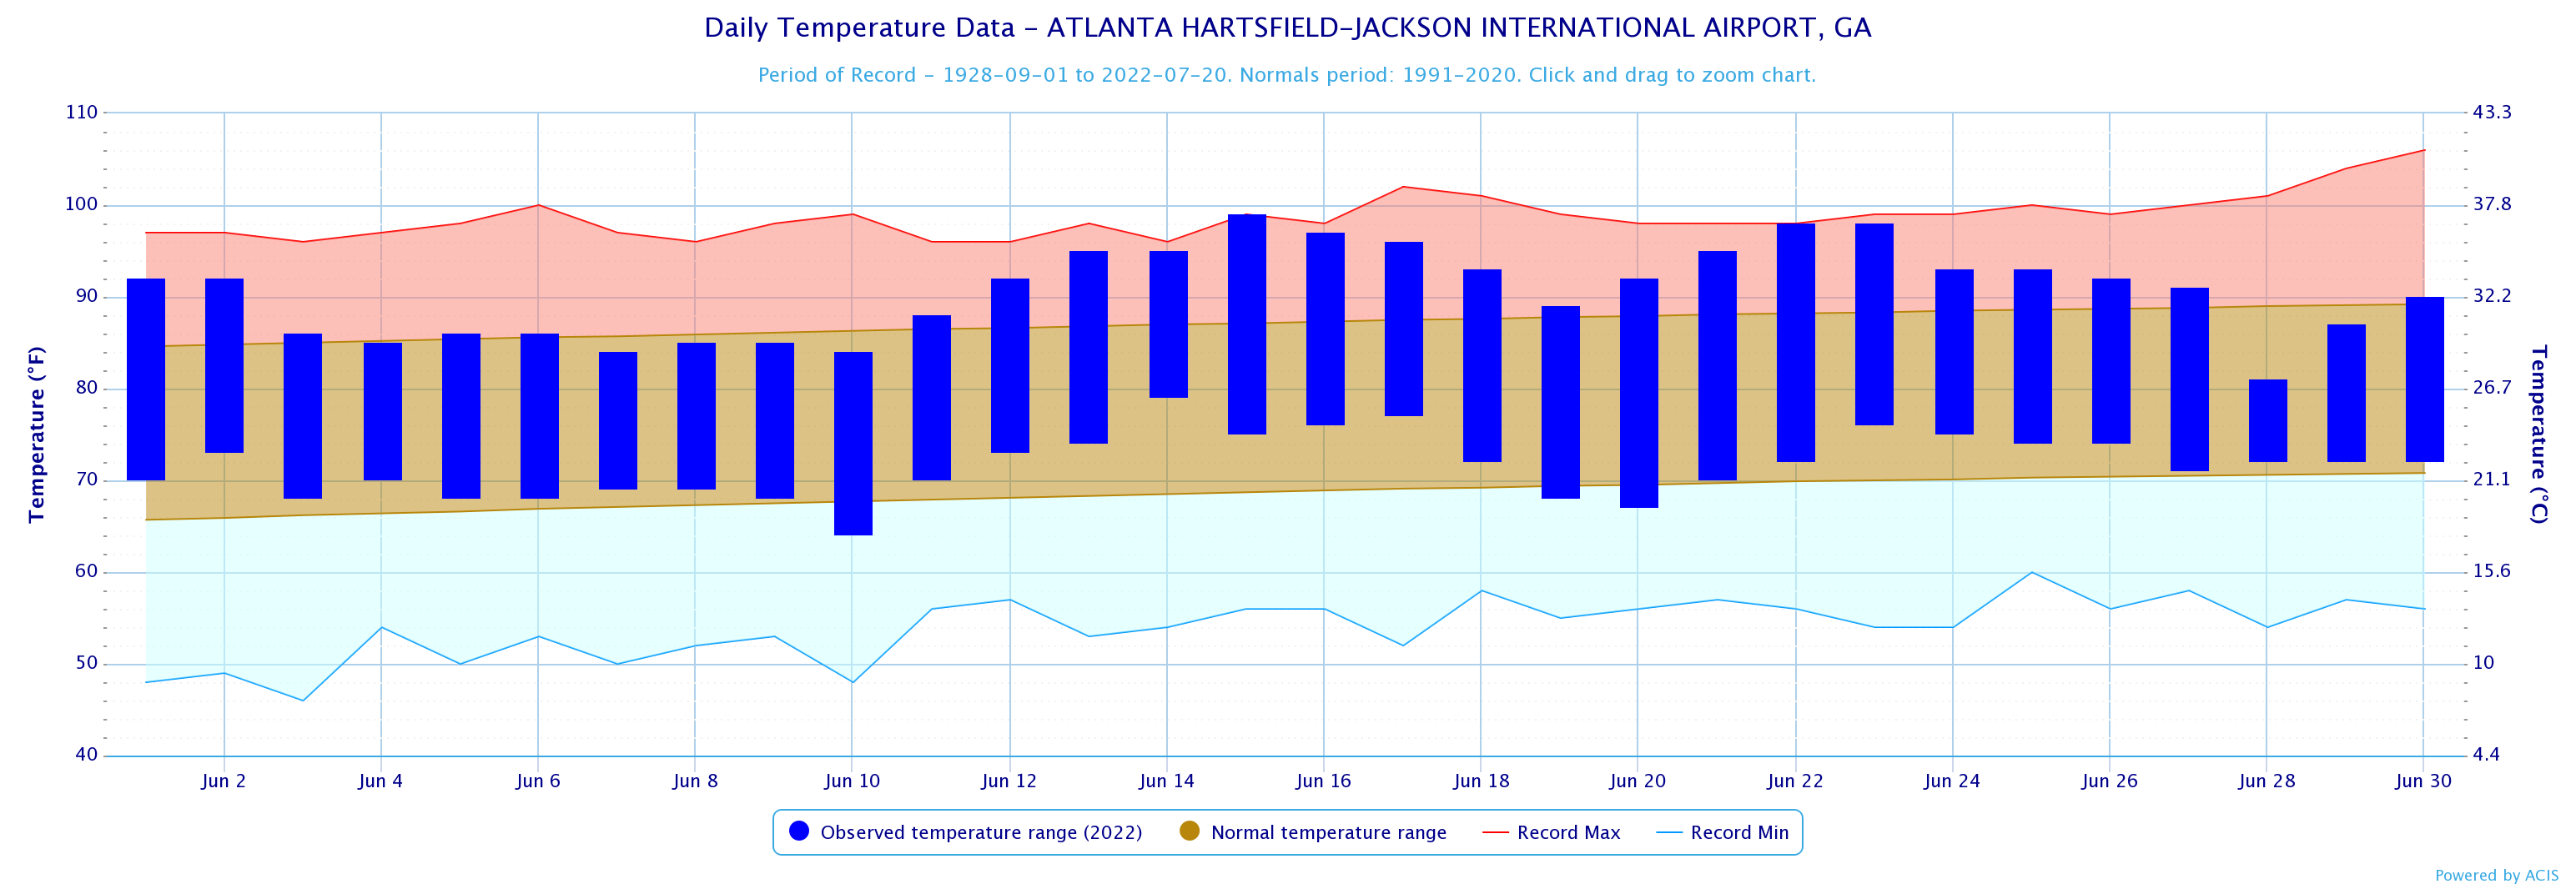
Atlanta
99
6/15
64
6/10
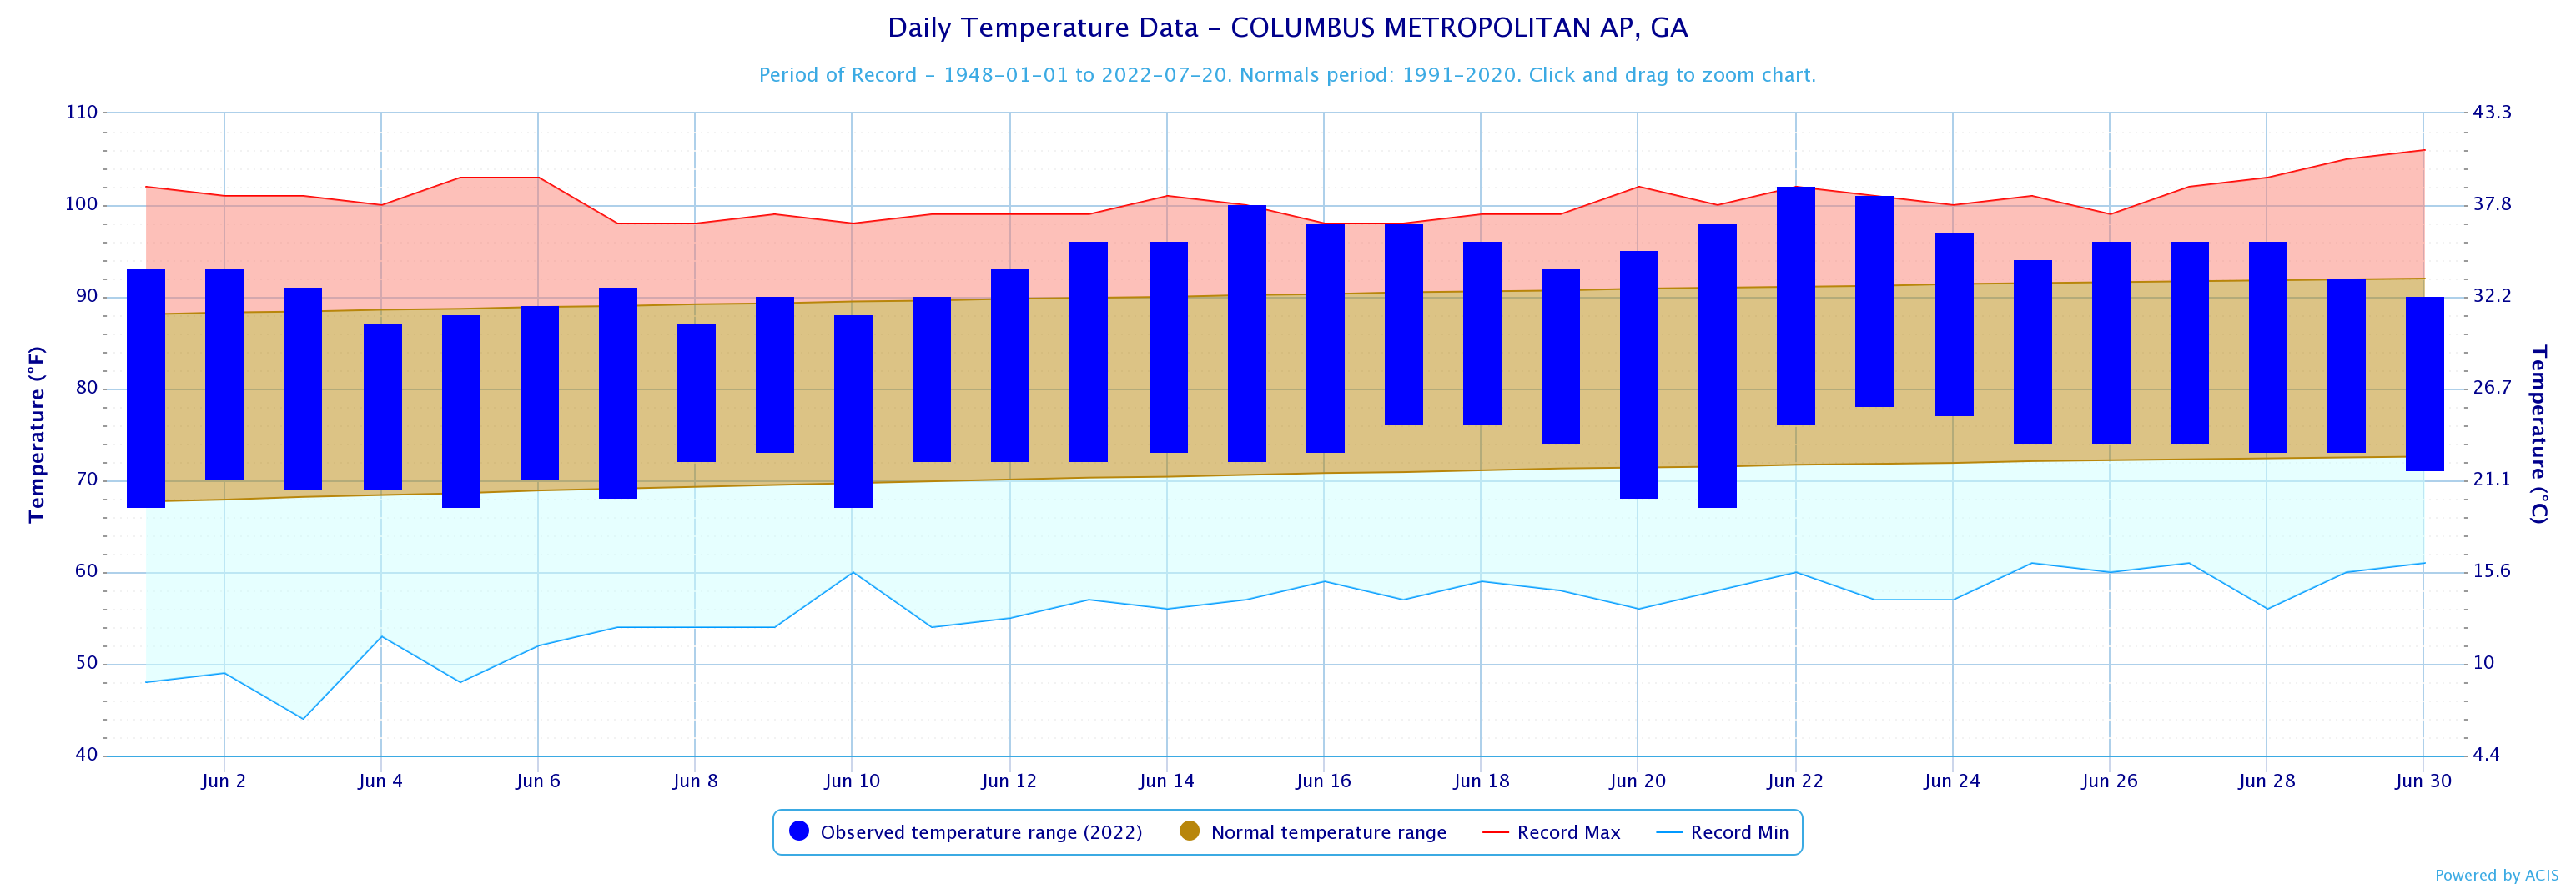
Columbus
102
6/22
67
6/1, 5, 10, 21
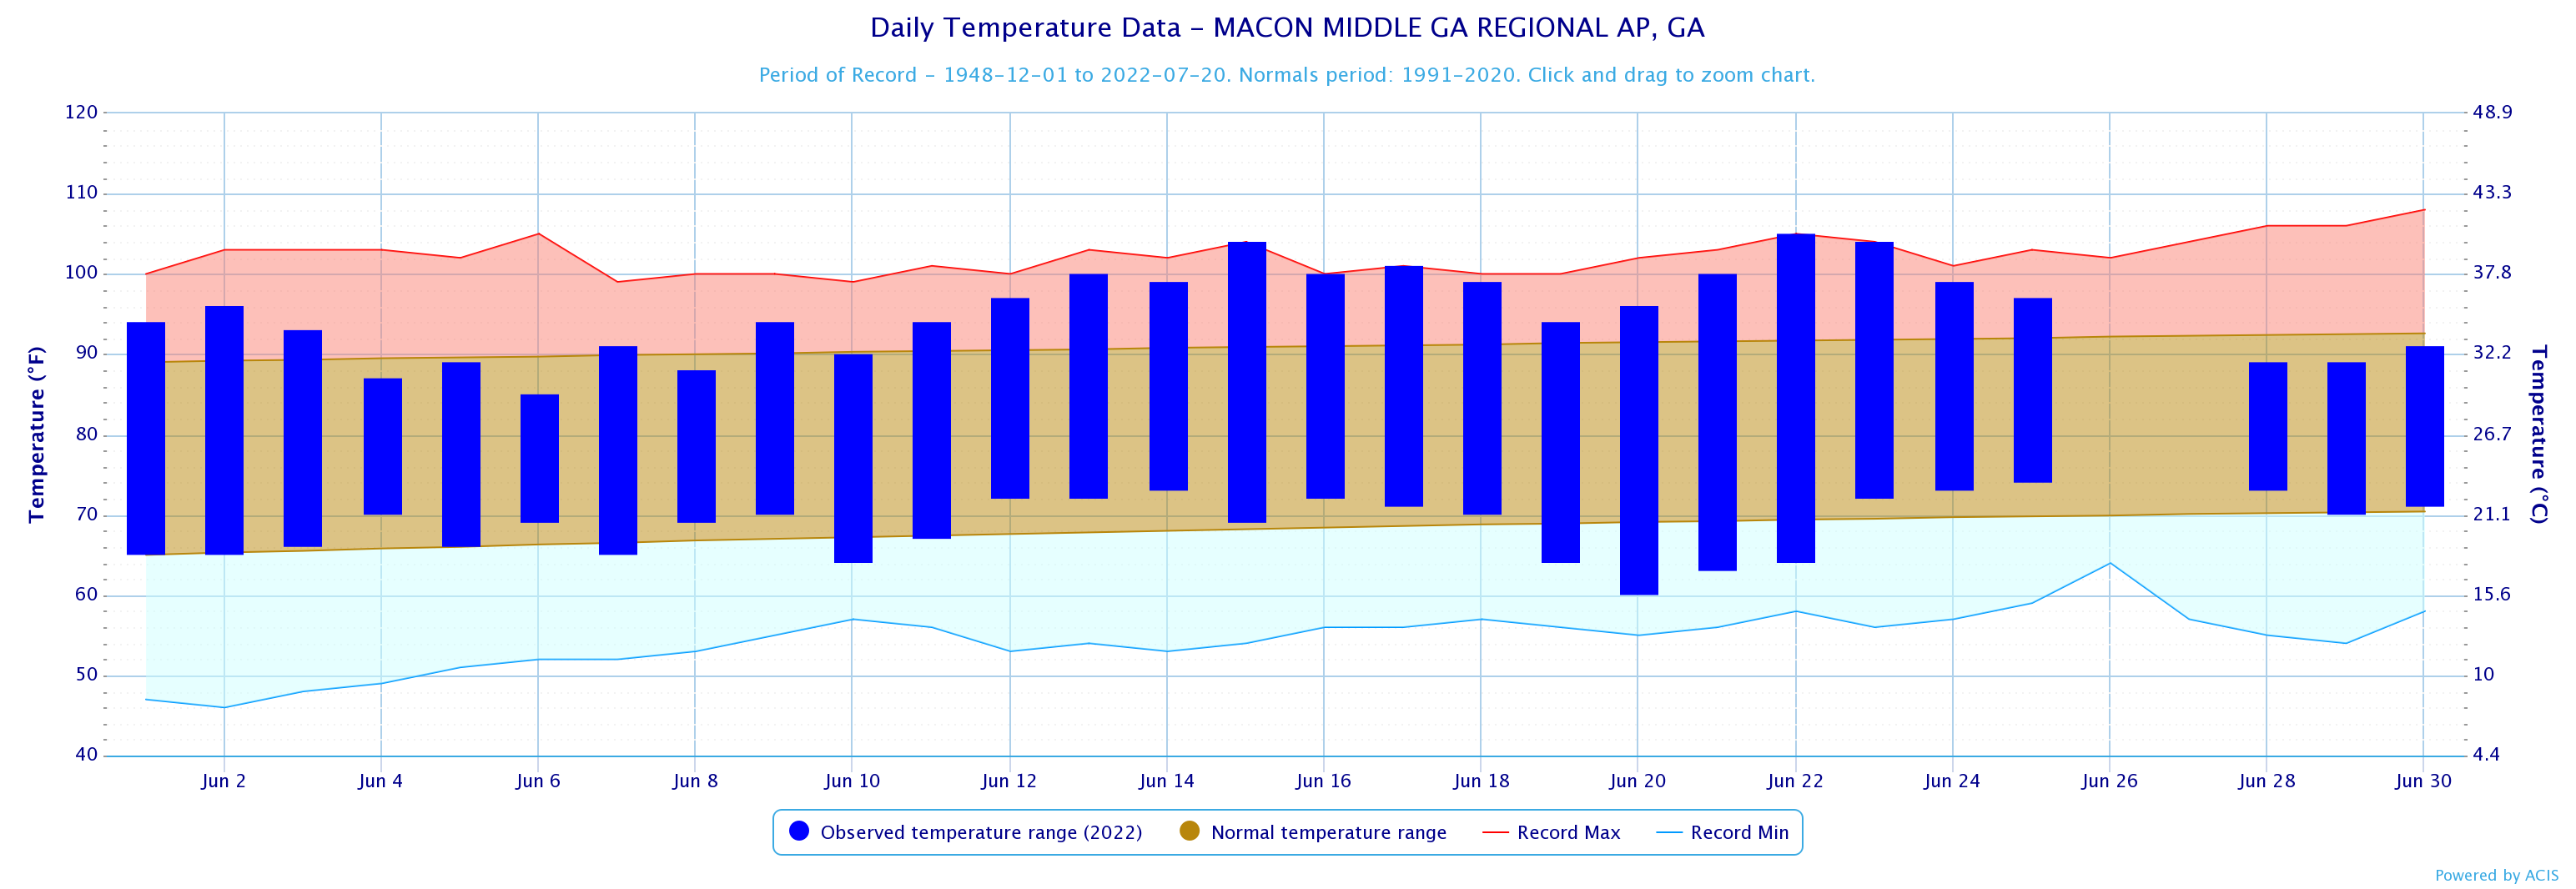
Macon
105
6/22
60
6/20
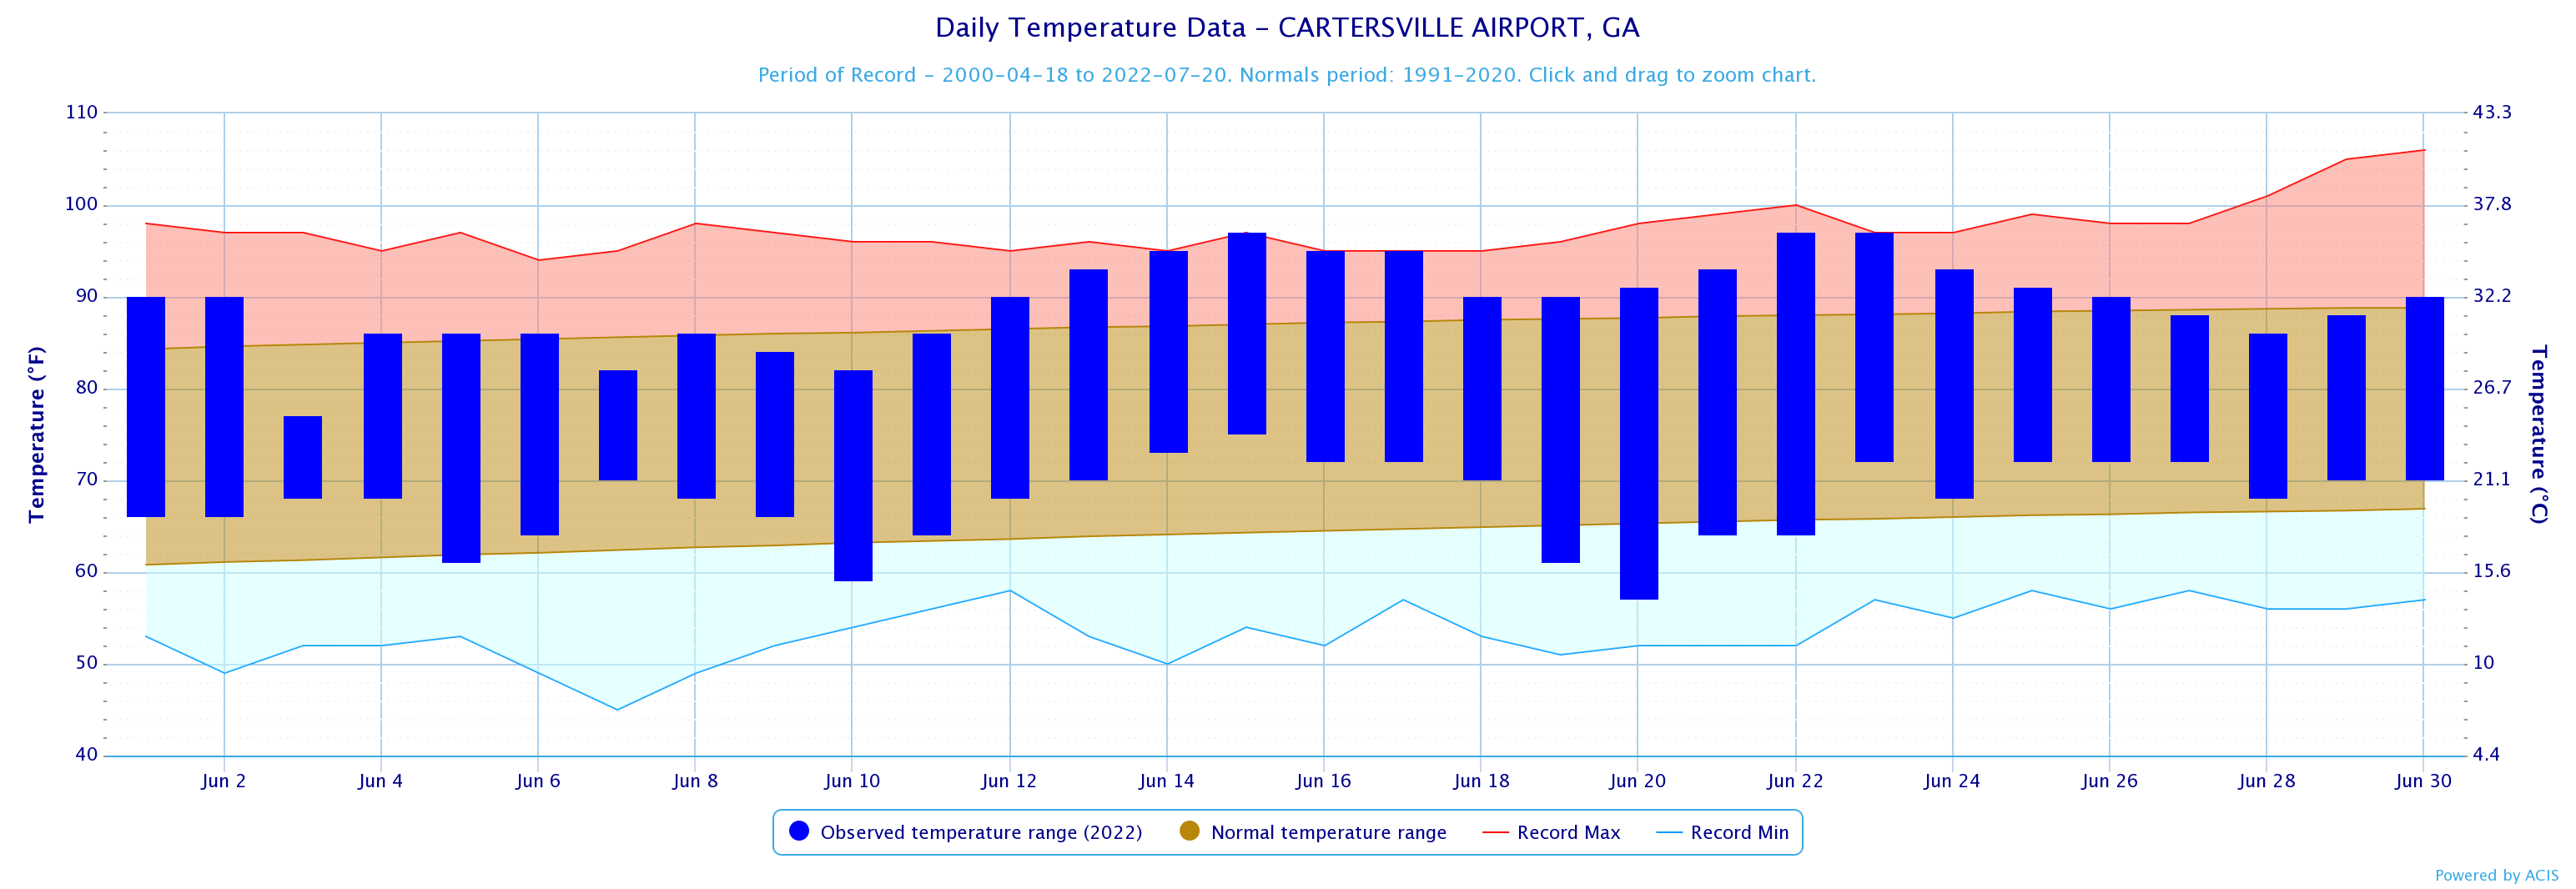
Cartersville
97
6/15, 22, 23
57
6/20
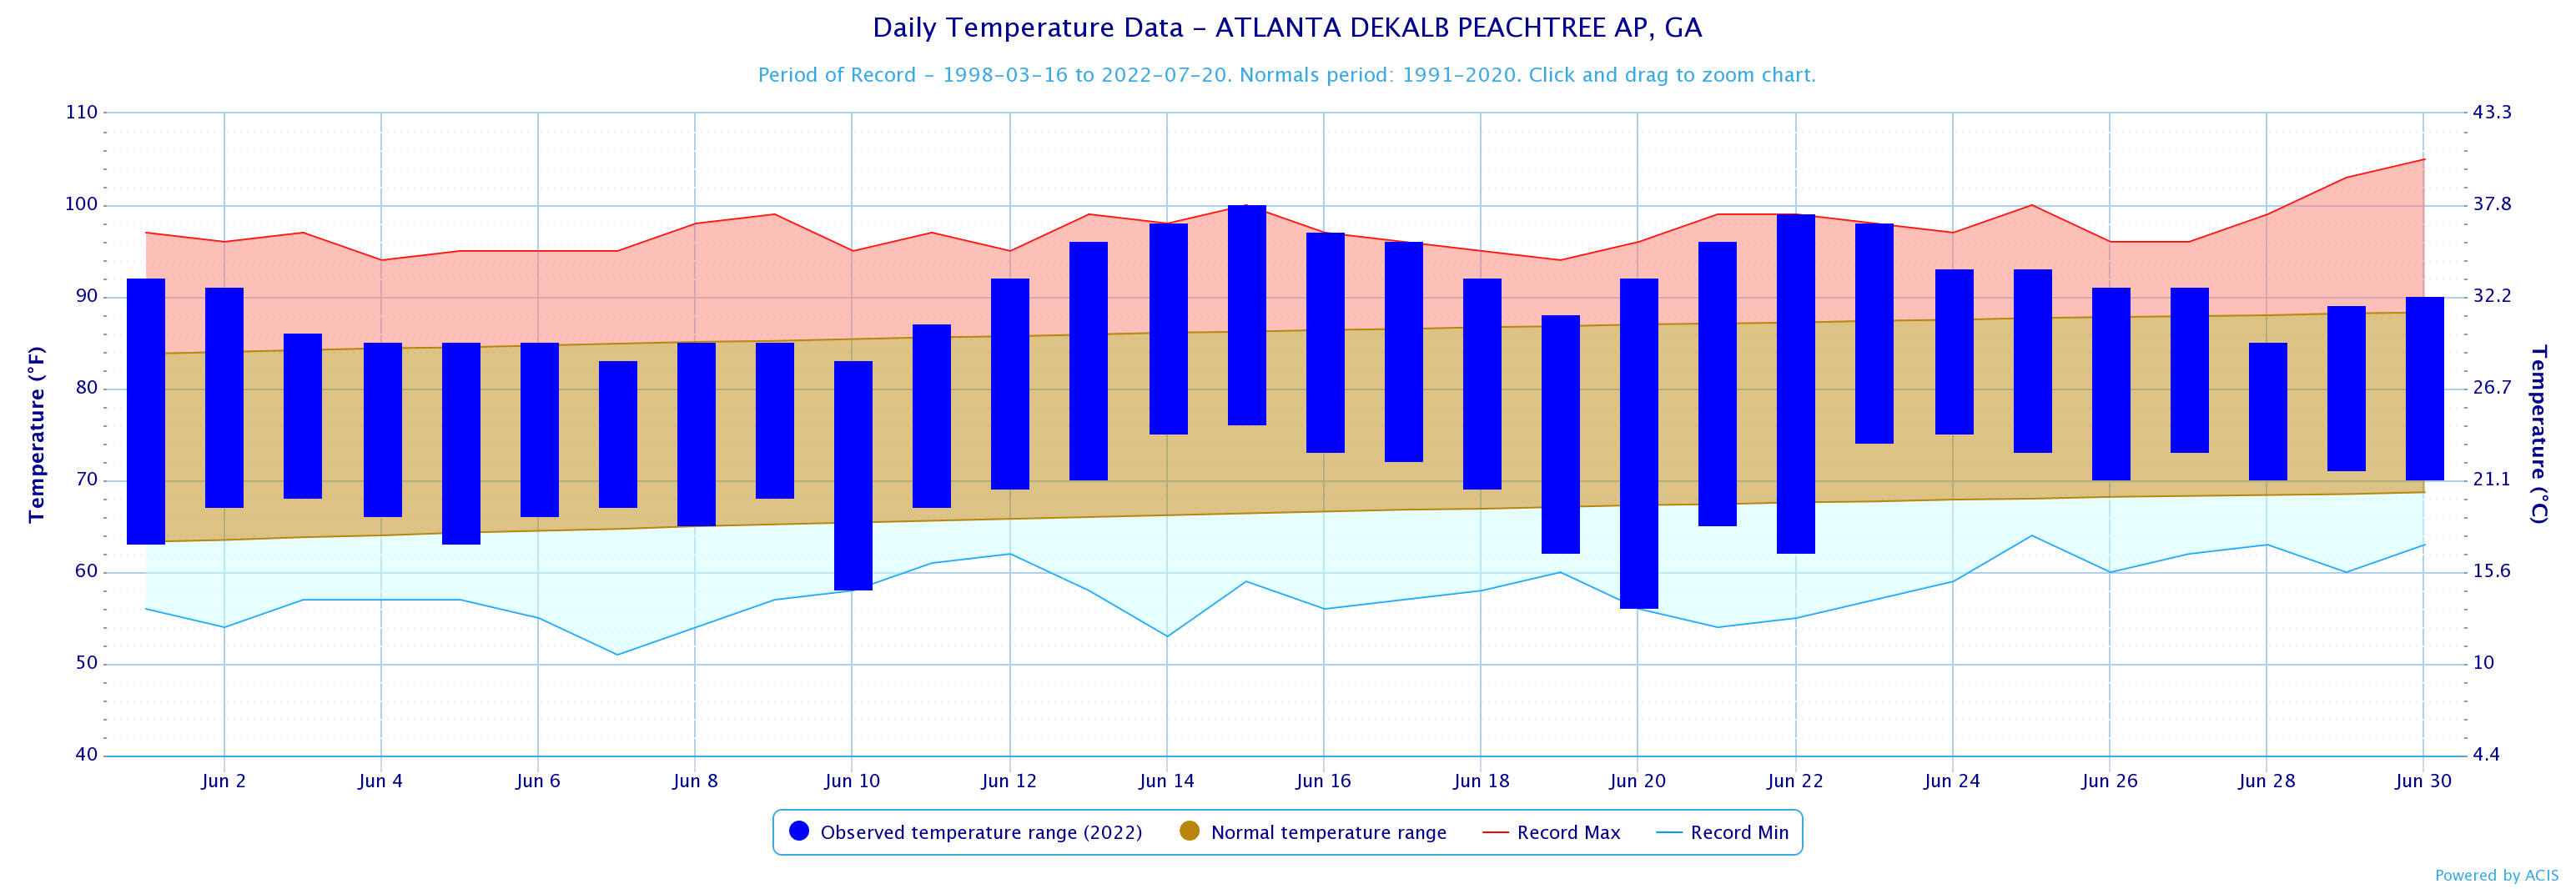
Dekalb Peachtree Arpt
100
6/15
57
6/20
Fulton Co Arpt
99
6/15
58
6/20
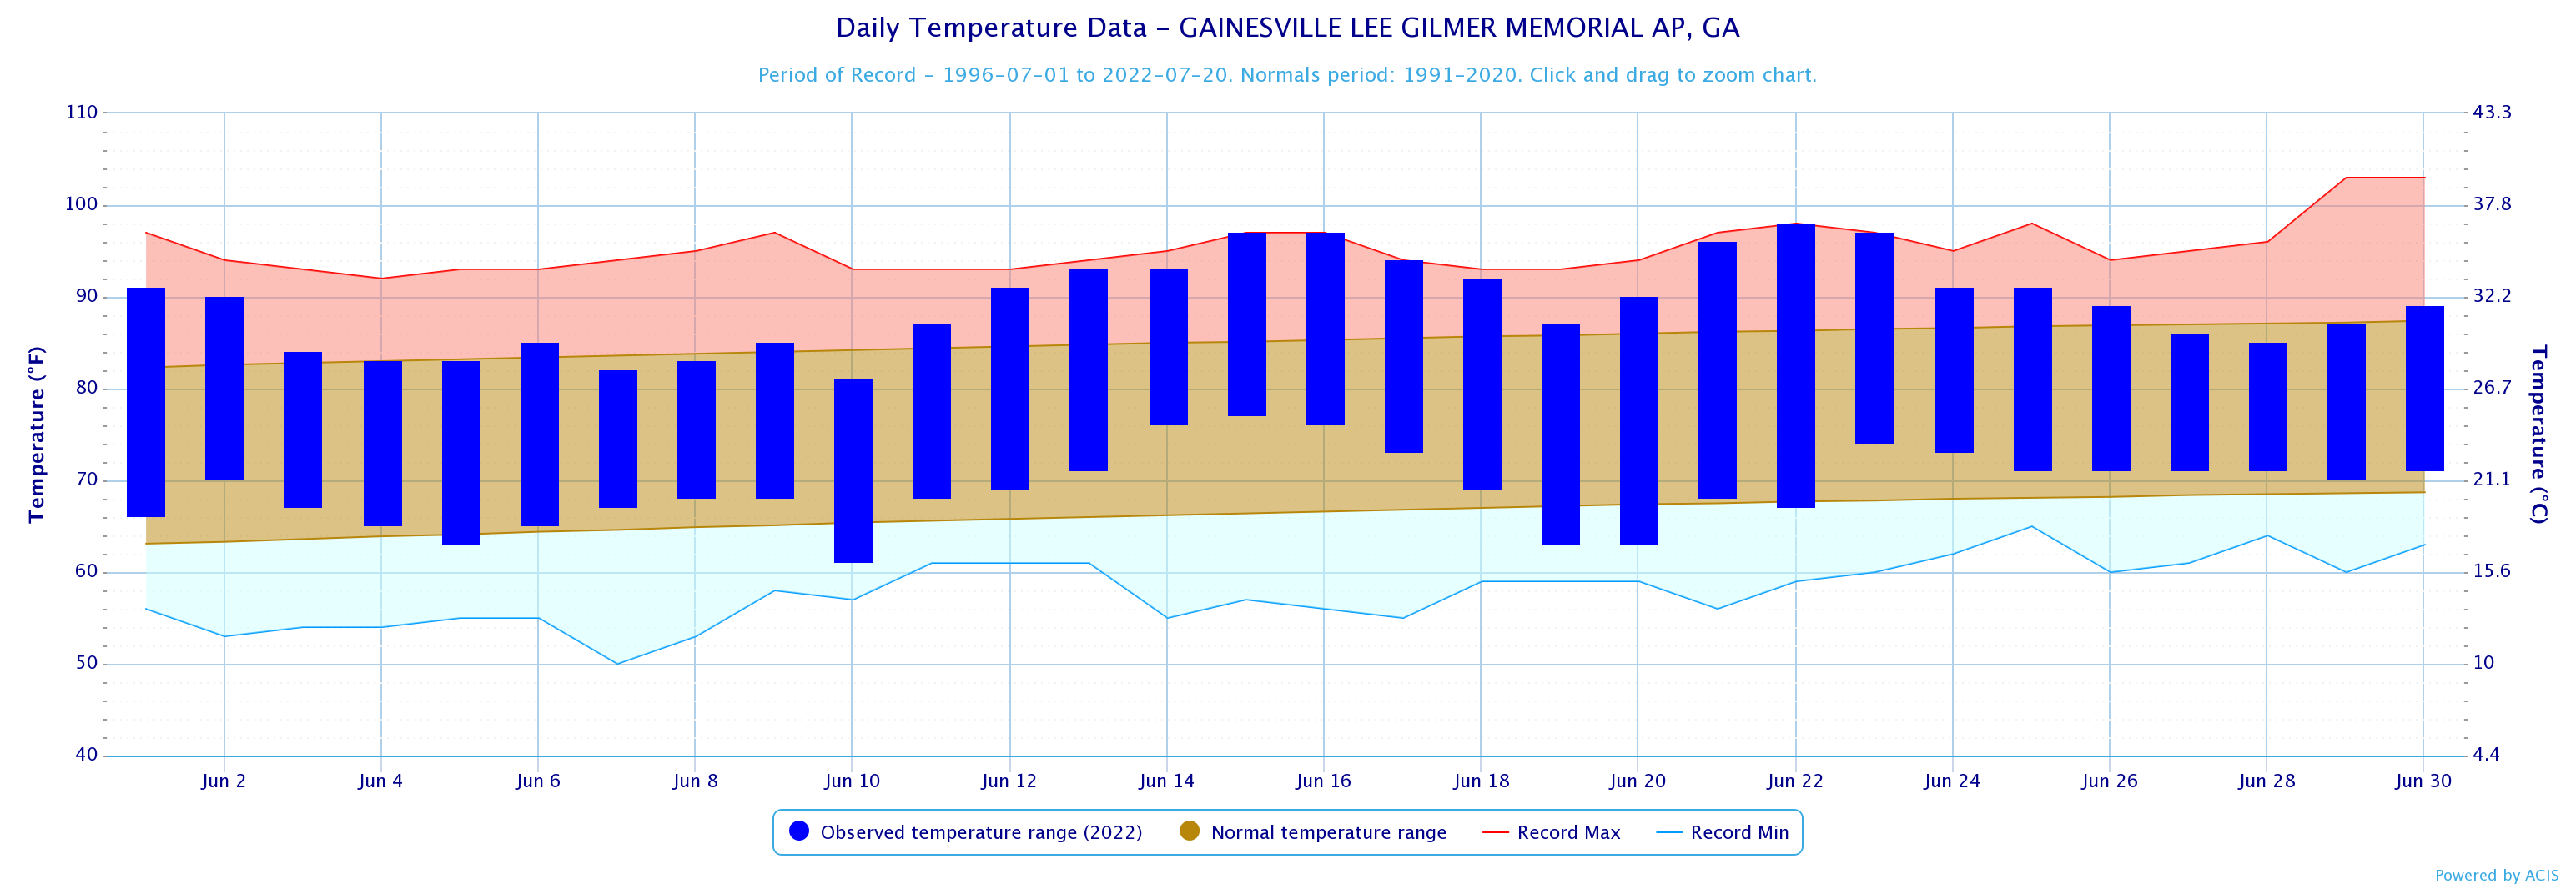
Gainesville
98
6/22
61
6/10
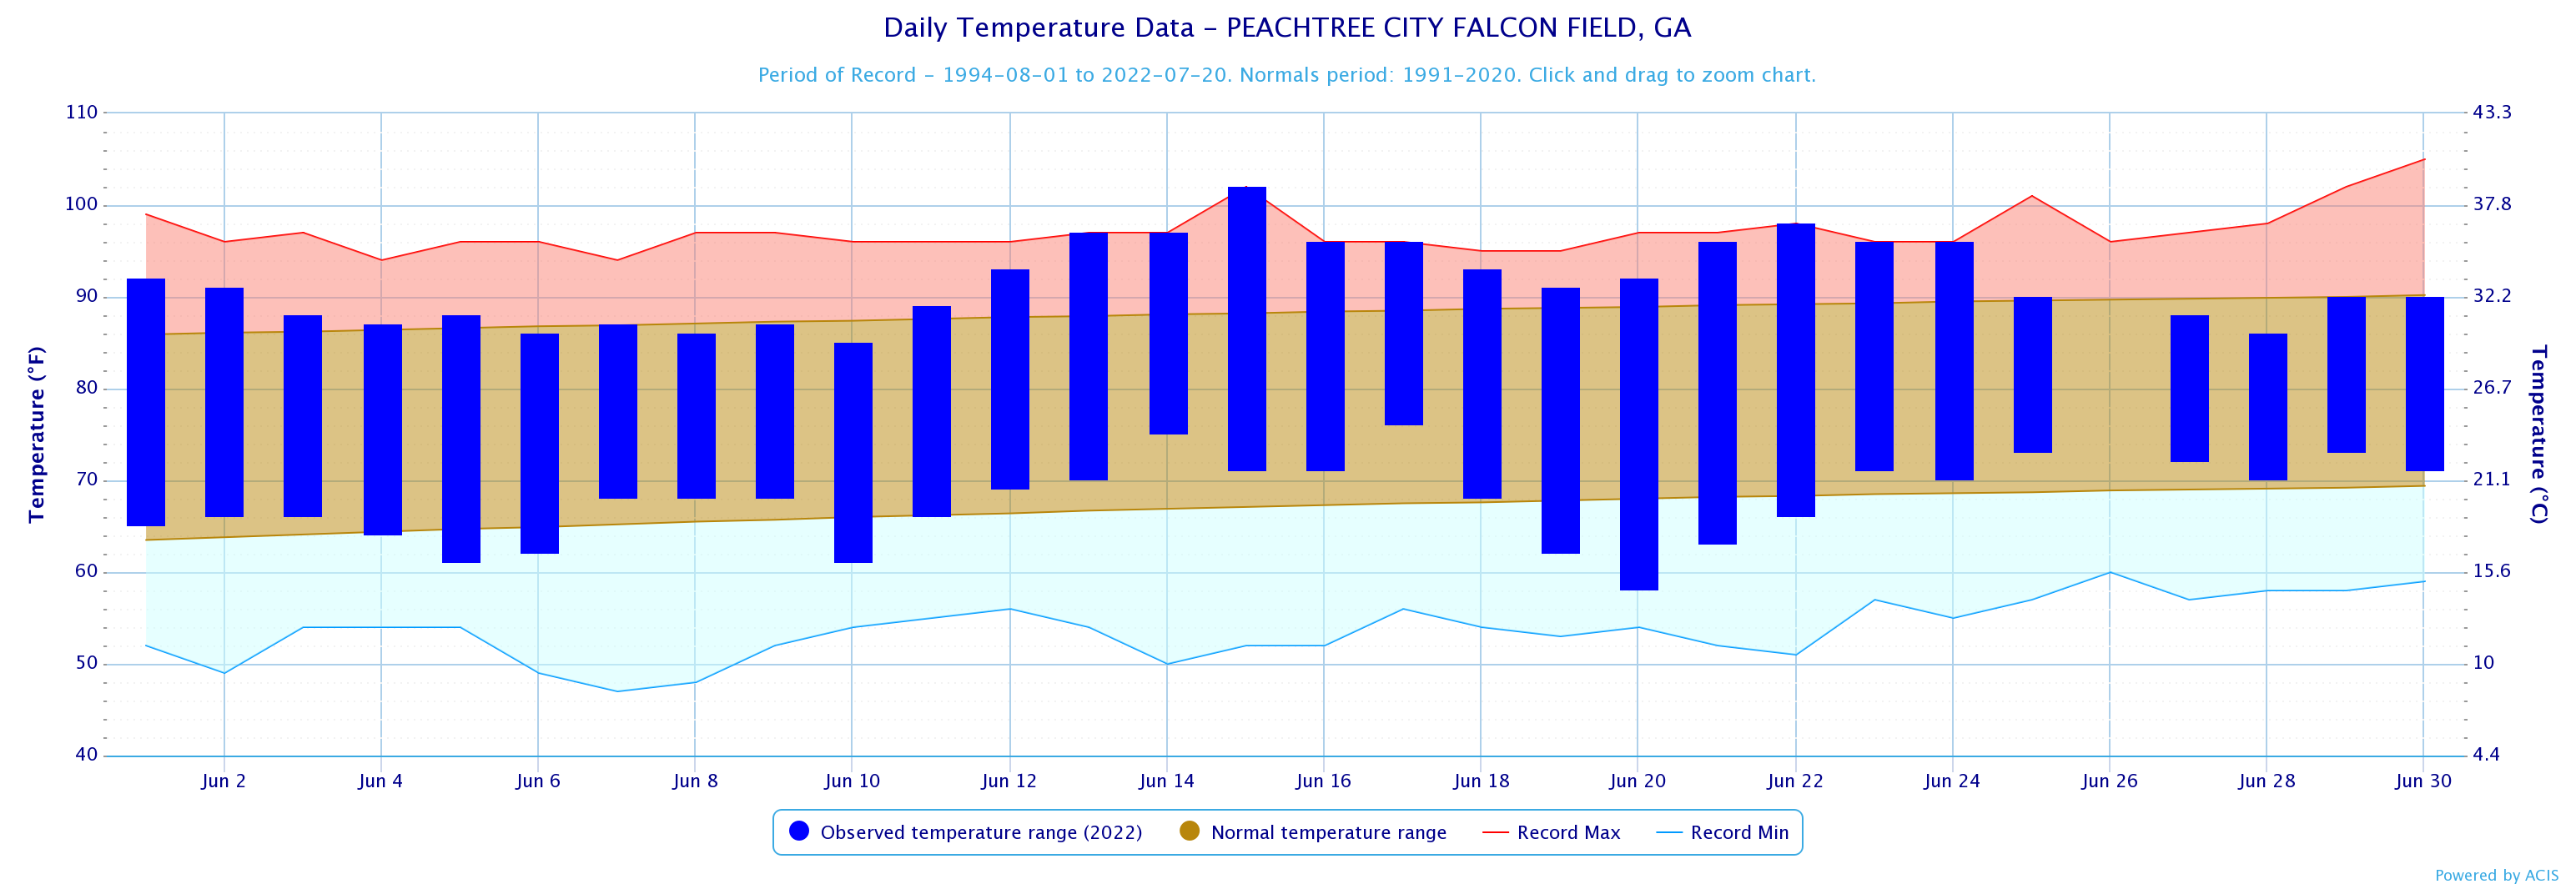
Peachtree City
102
6/15
58
6/20
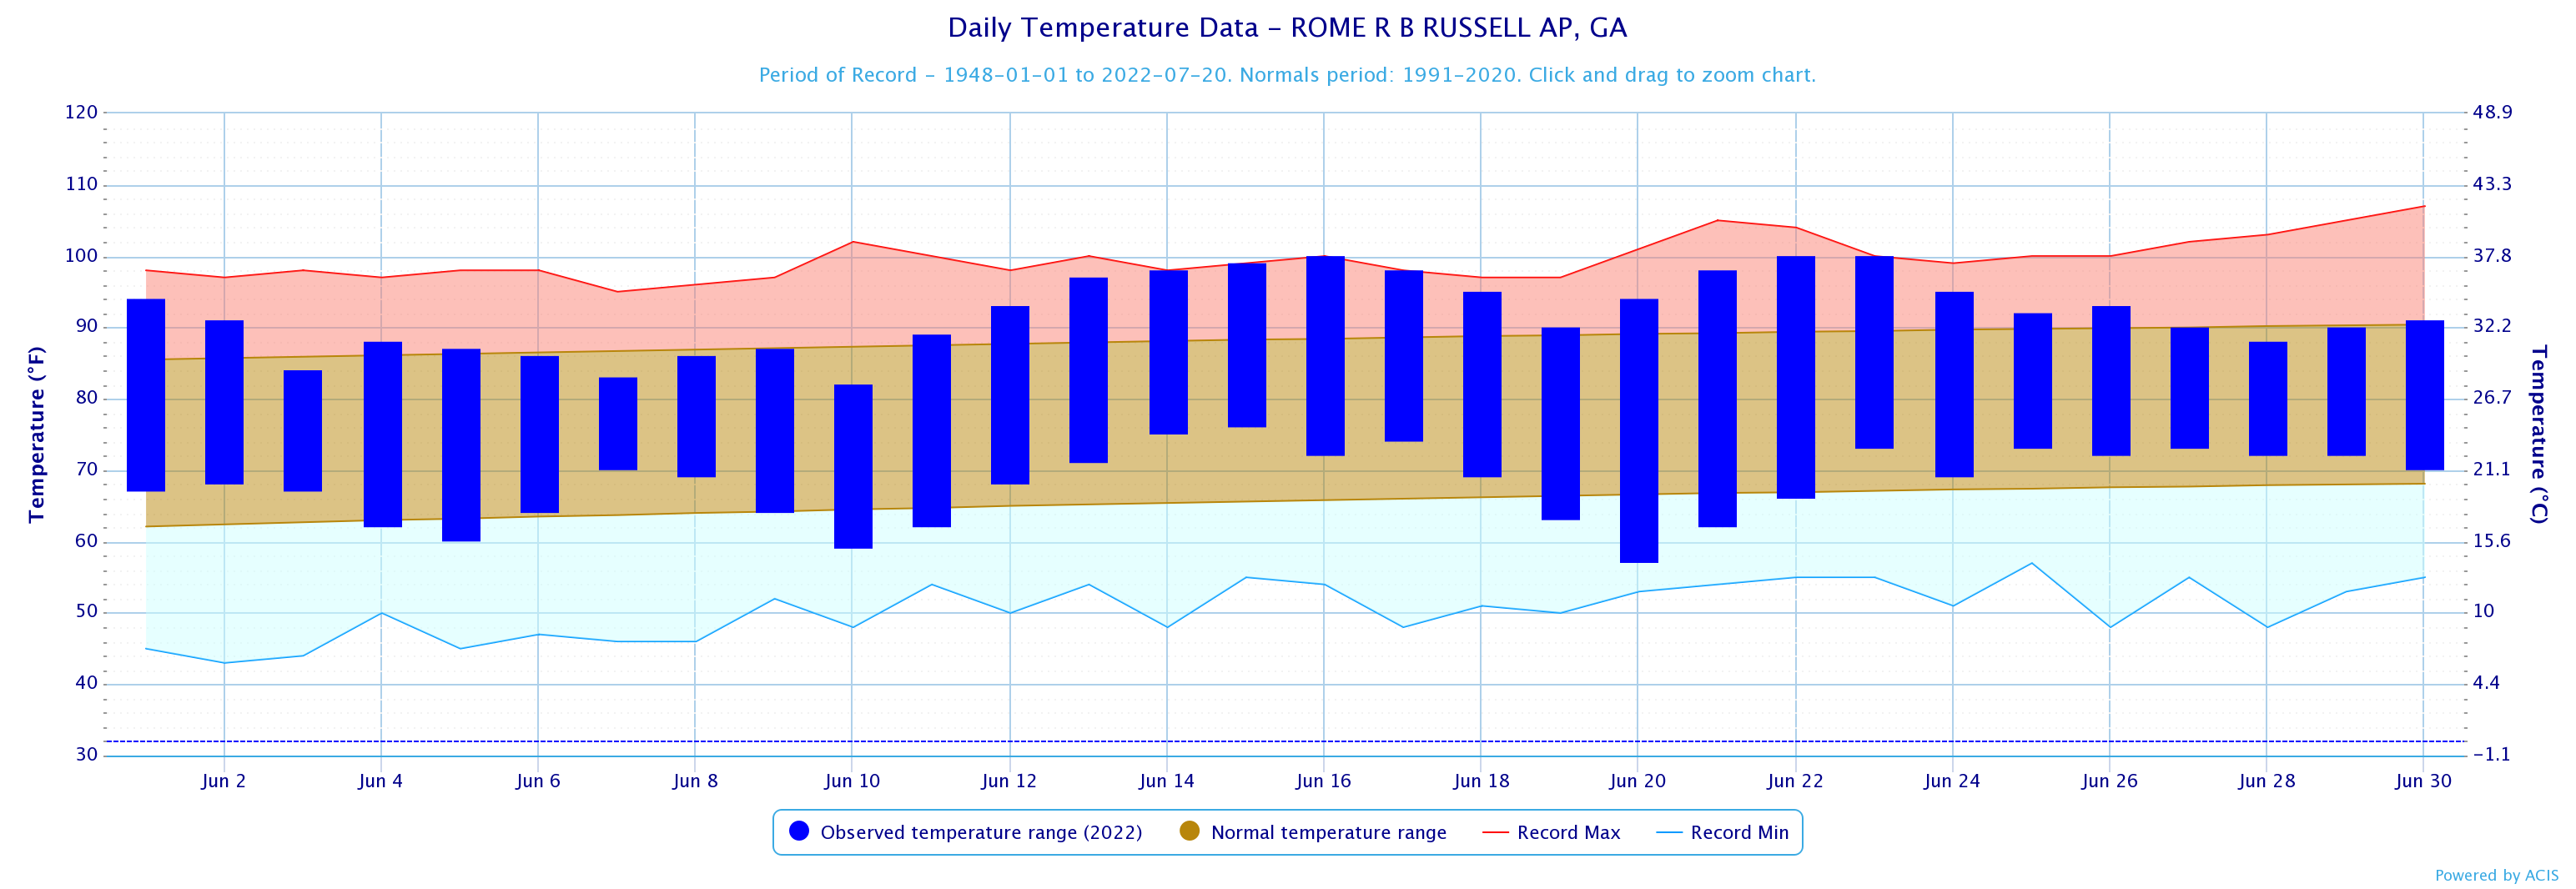
Rome
100
6/16, 22, 23
57
6/20
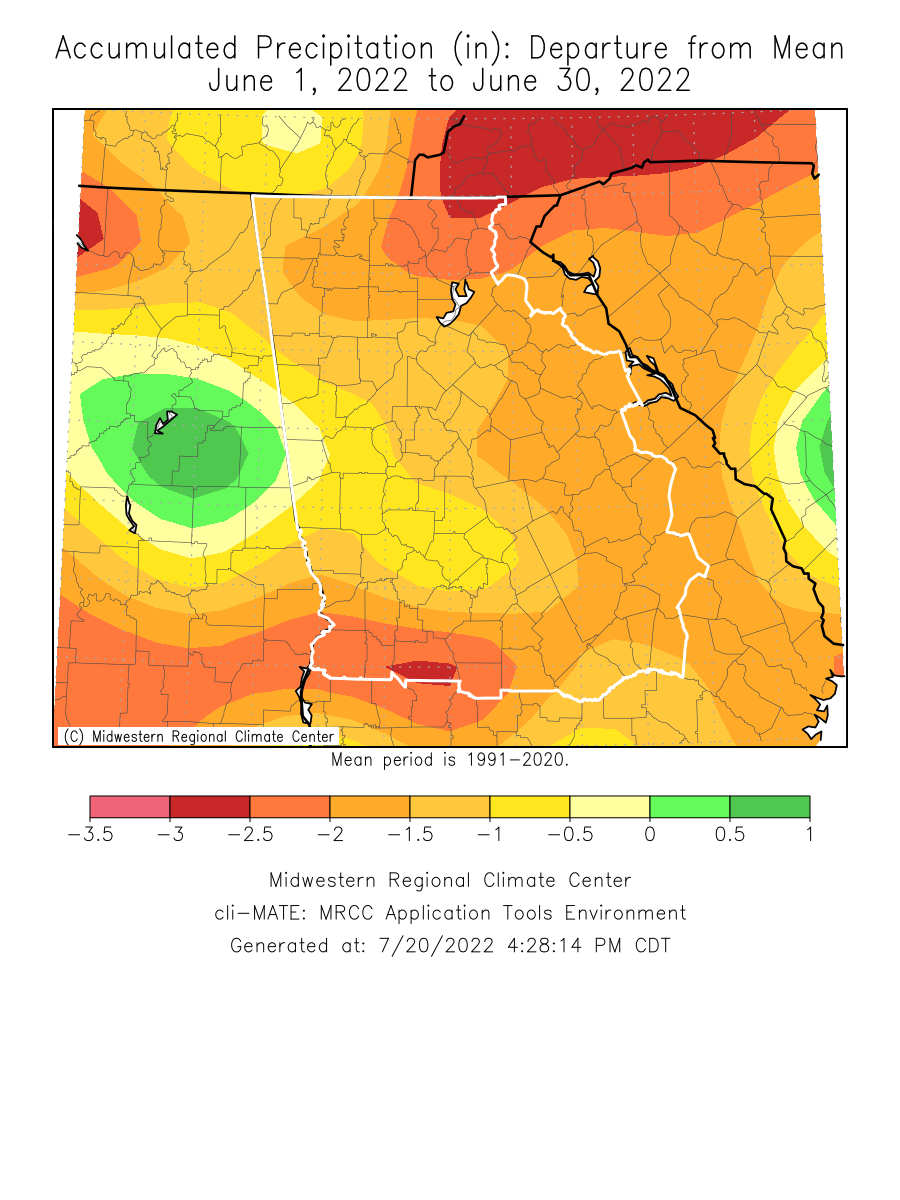
June 2022 Precipitation Climate Statistics
Average Precipitation
From Normal)
2.01
4.14
-2.13
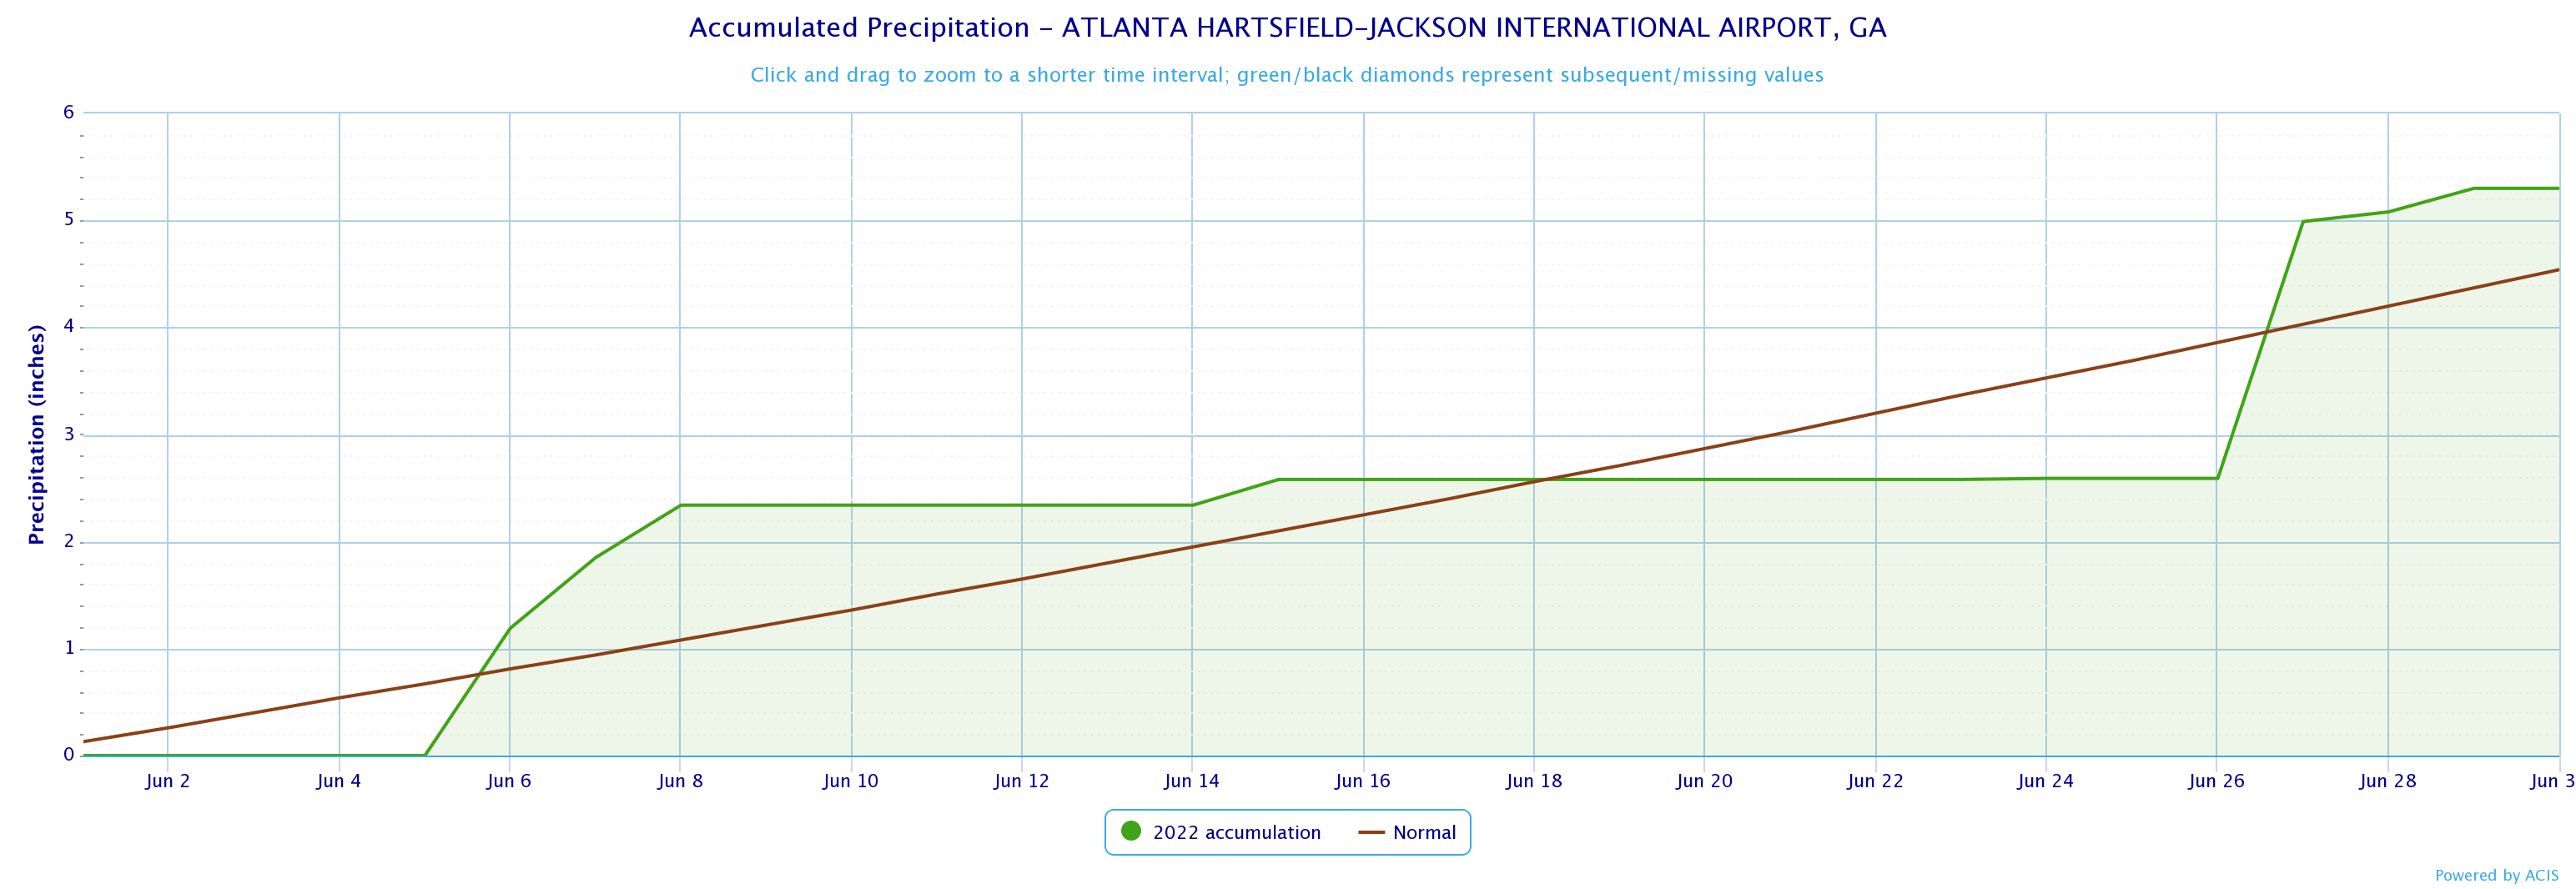
5.30
4.00
1.30
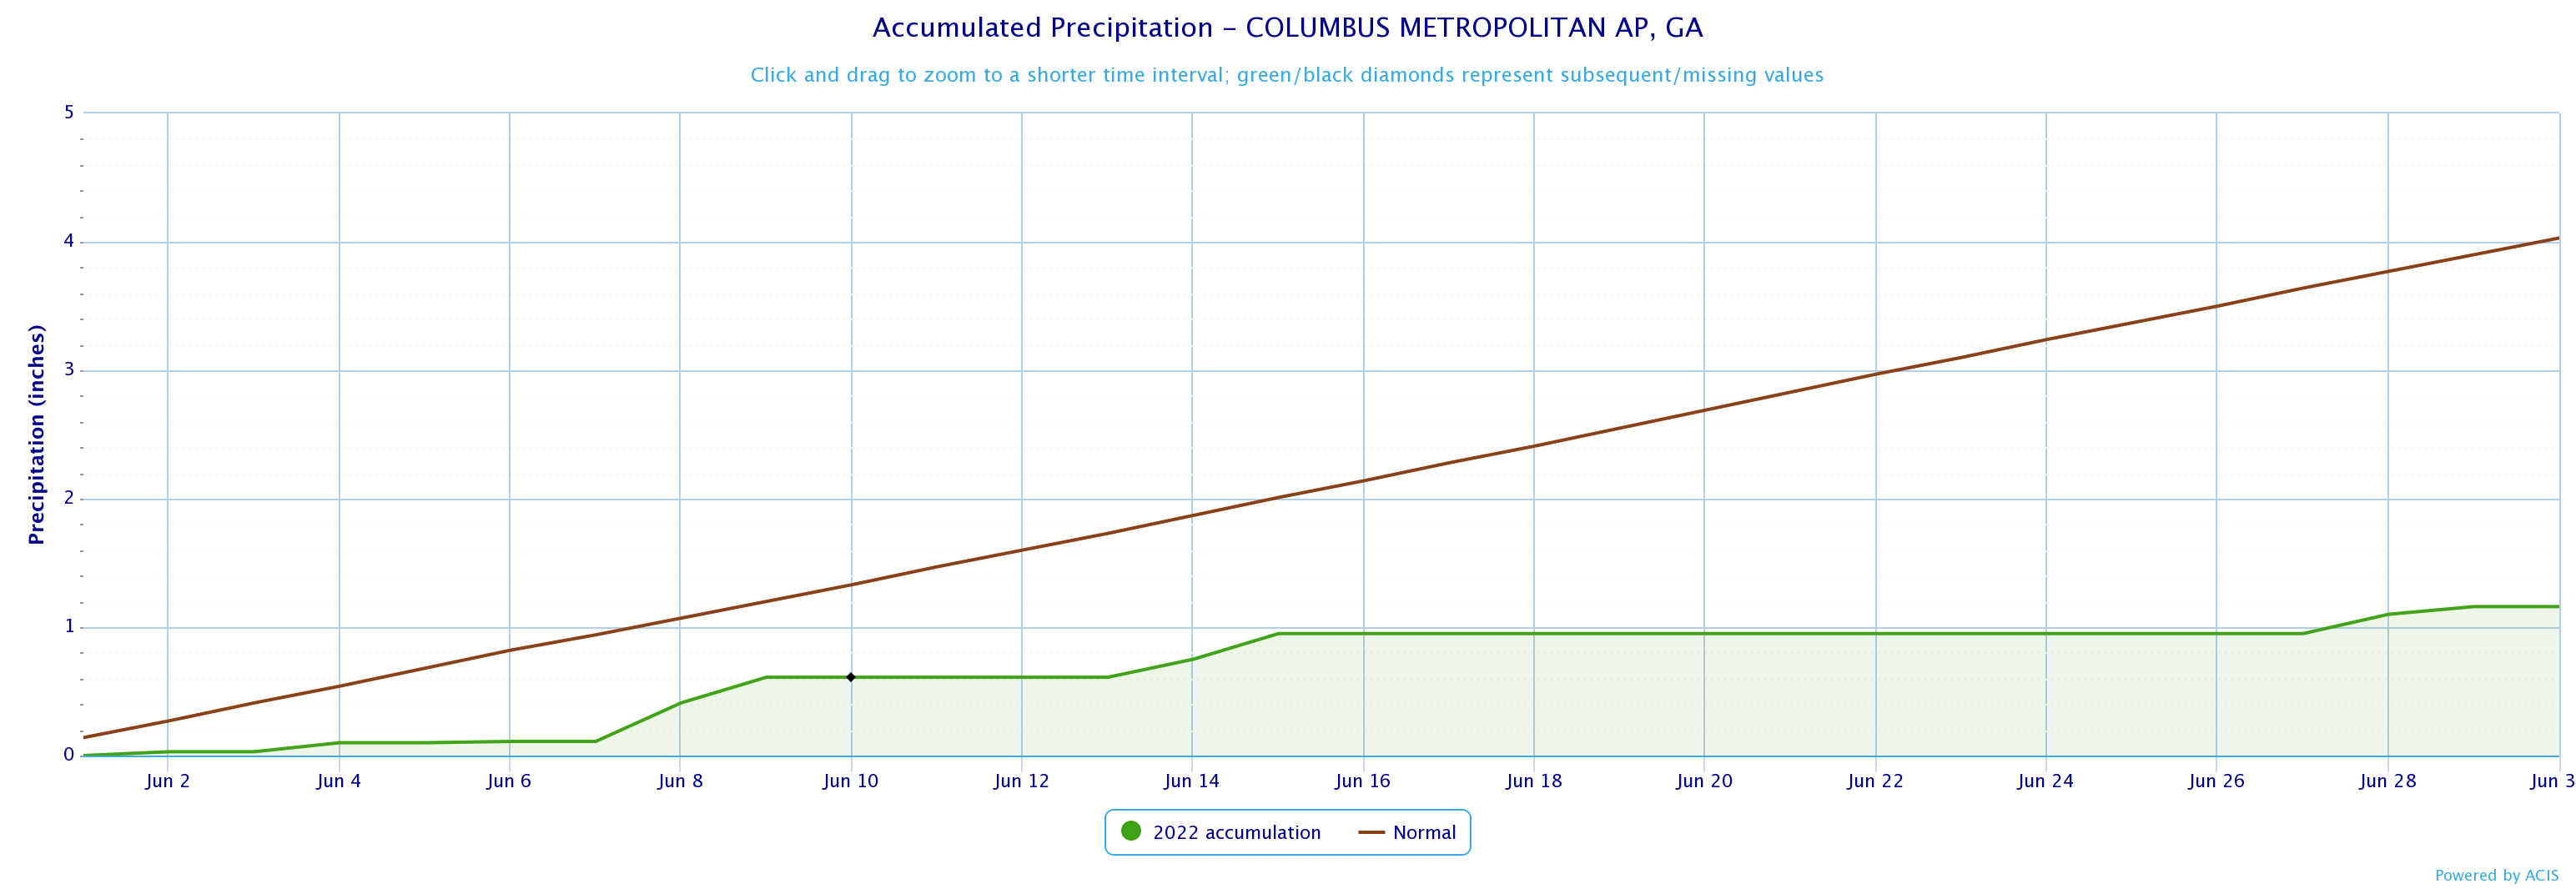
1.16
3.92
-2.76
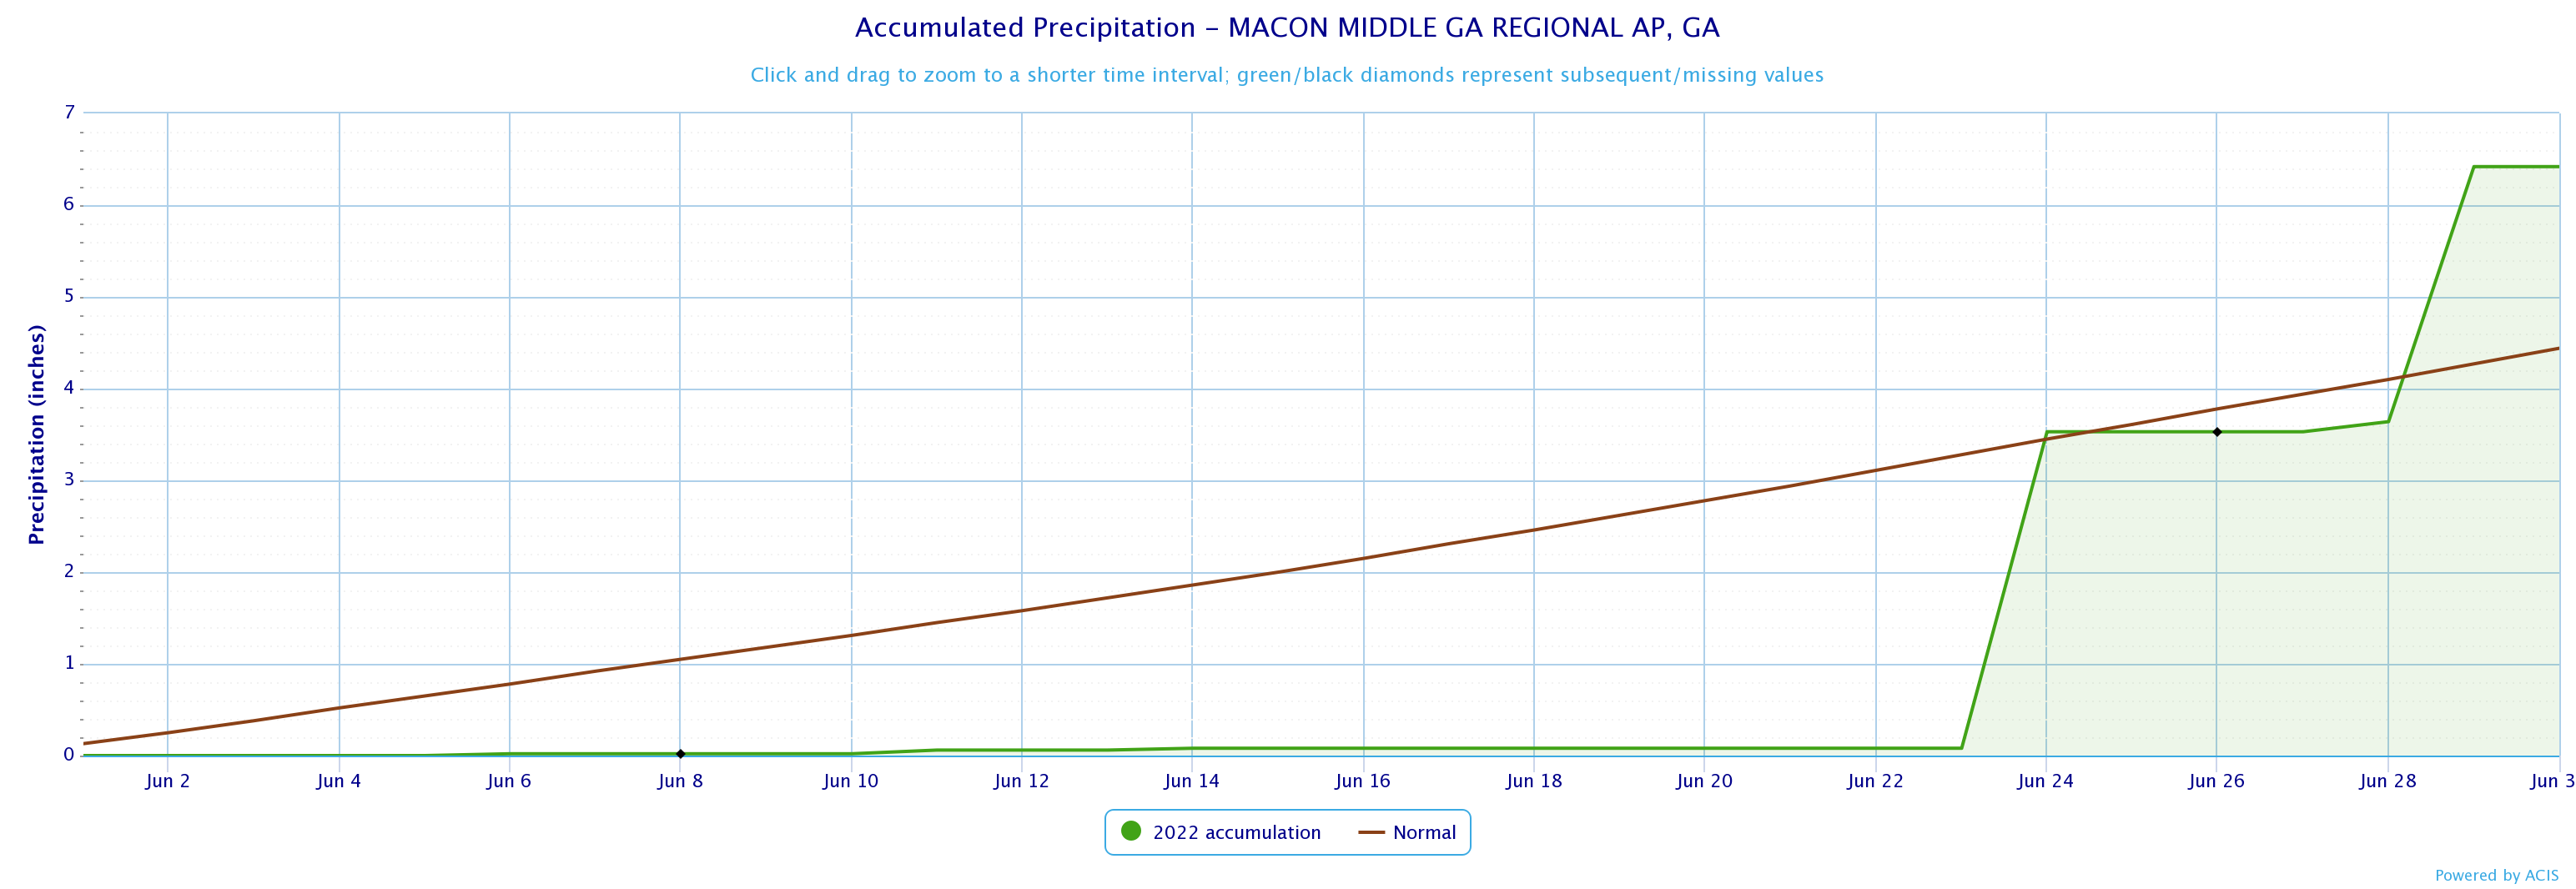
6.42
4.02
2.40
2.19
3.74
-0.31
1.16
4.49
-3.33
5.13
3.81
1.32
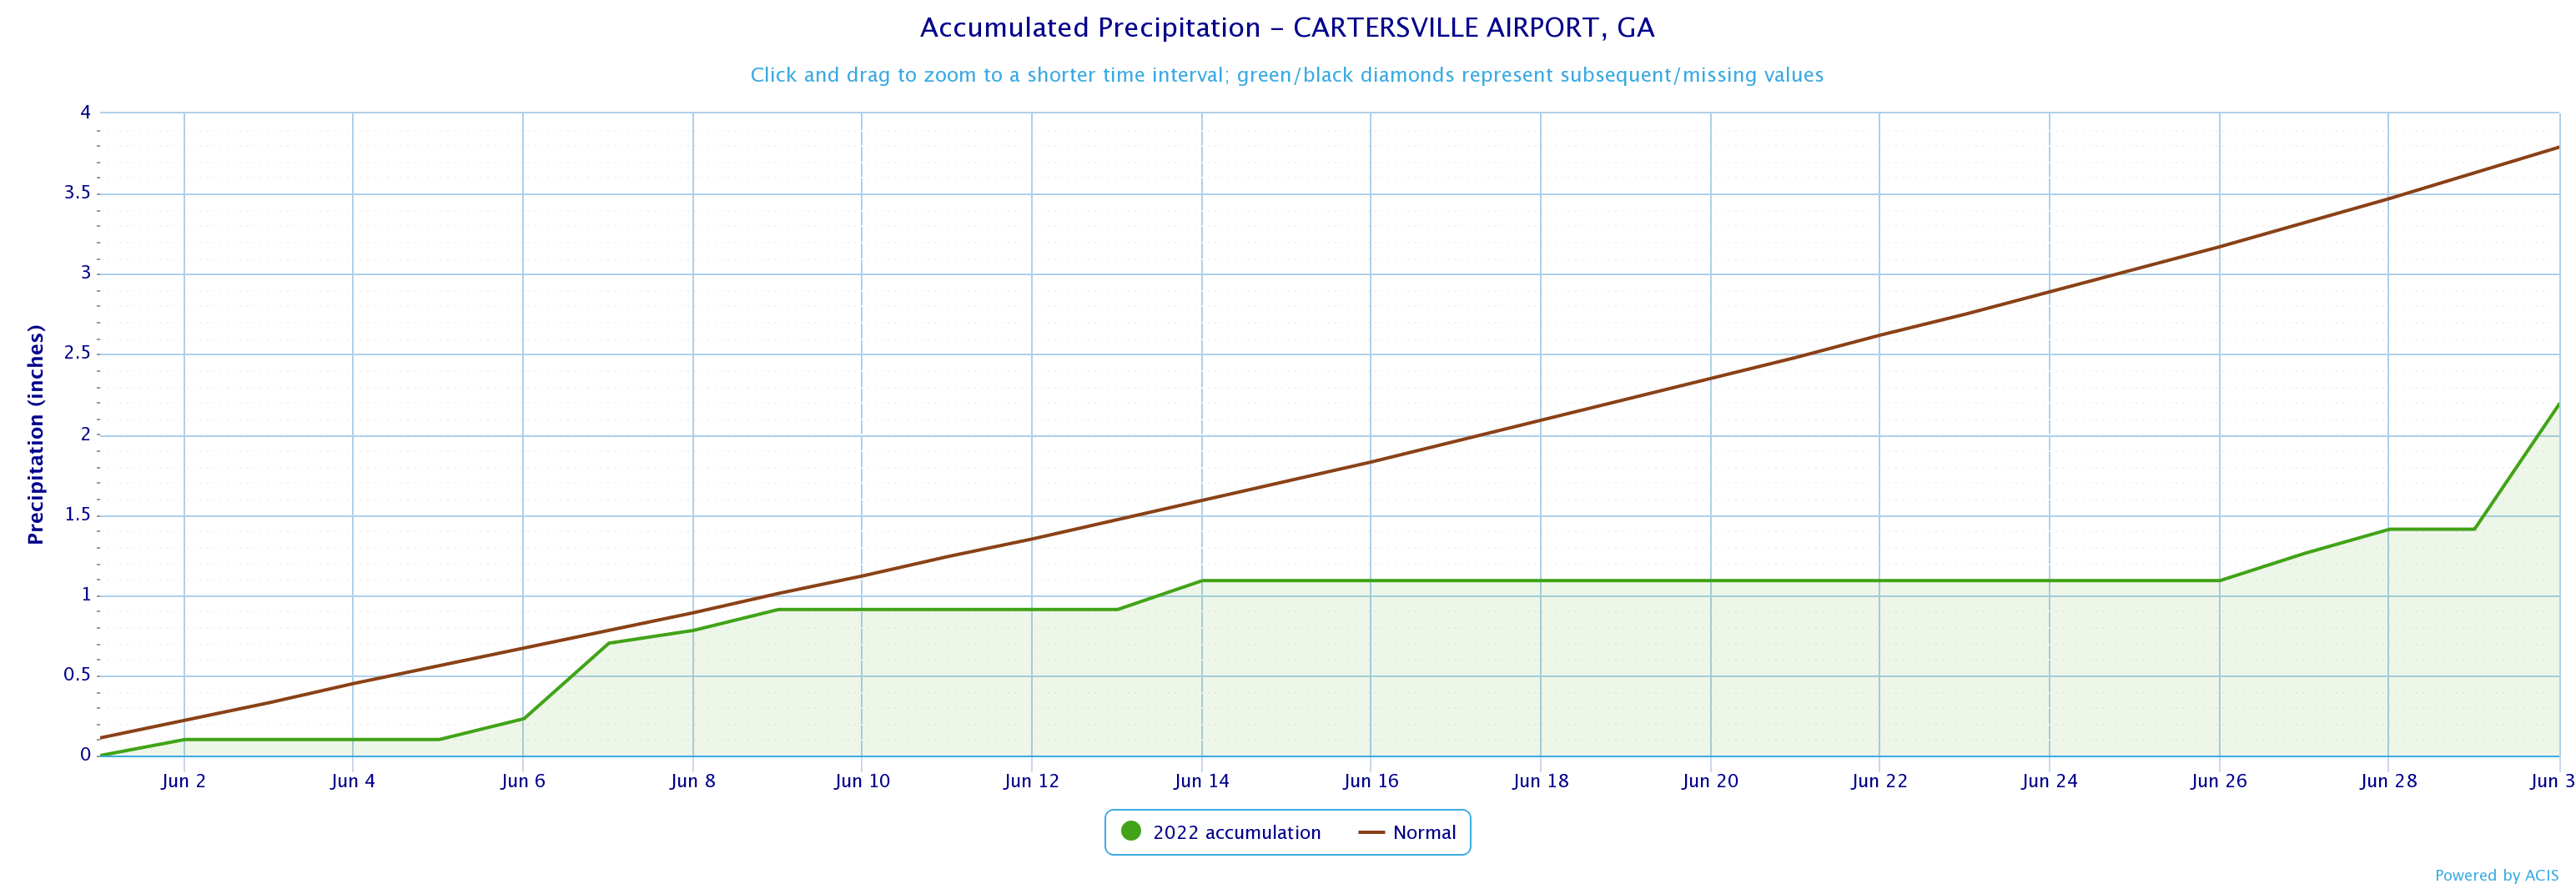
1.44
4.15
1.44
4.71
4.24
0.47
1.35
3.64
-2.29
June 2022 Precipitation Climate Statistics
Athens
1.32
6/8
Atlanta
2.40
6/26
Columbus
0.30
6/8
Macon
3.45
6/24
Cartersville
0.78
6/30
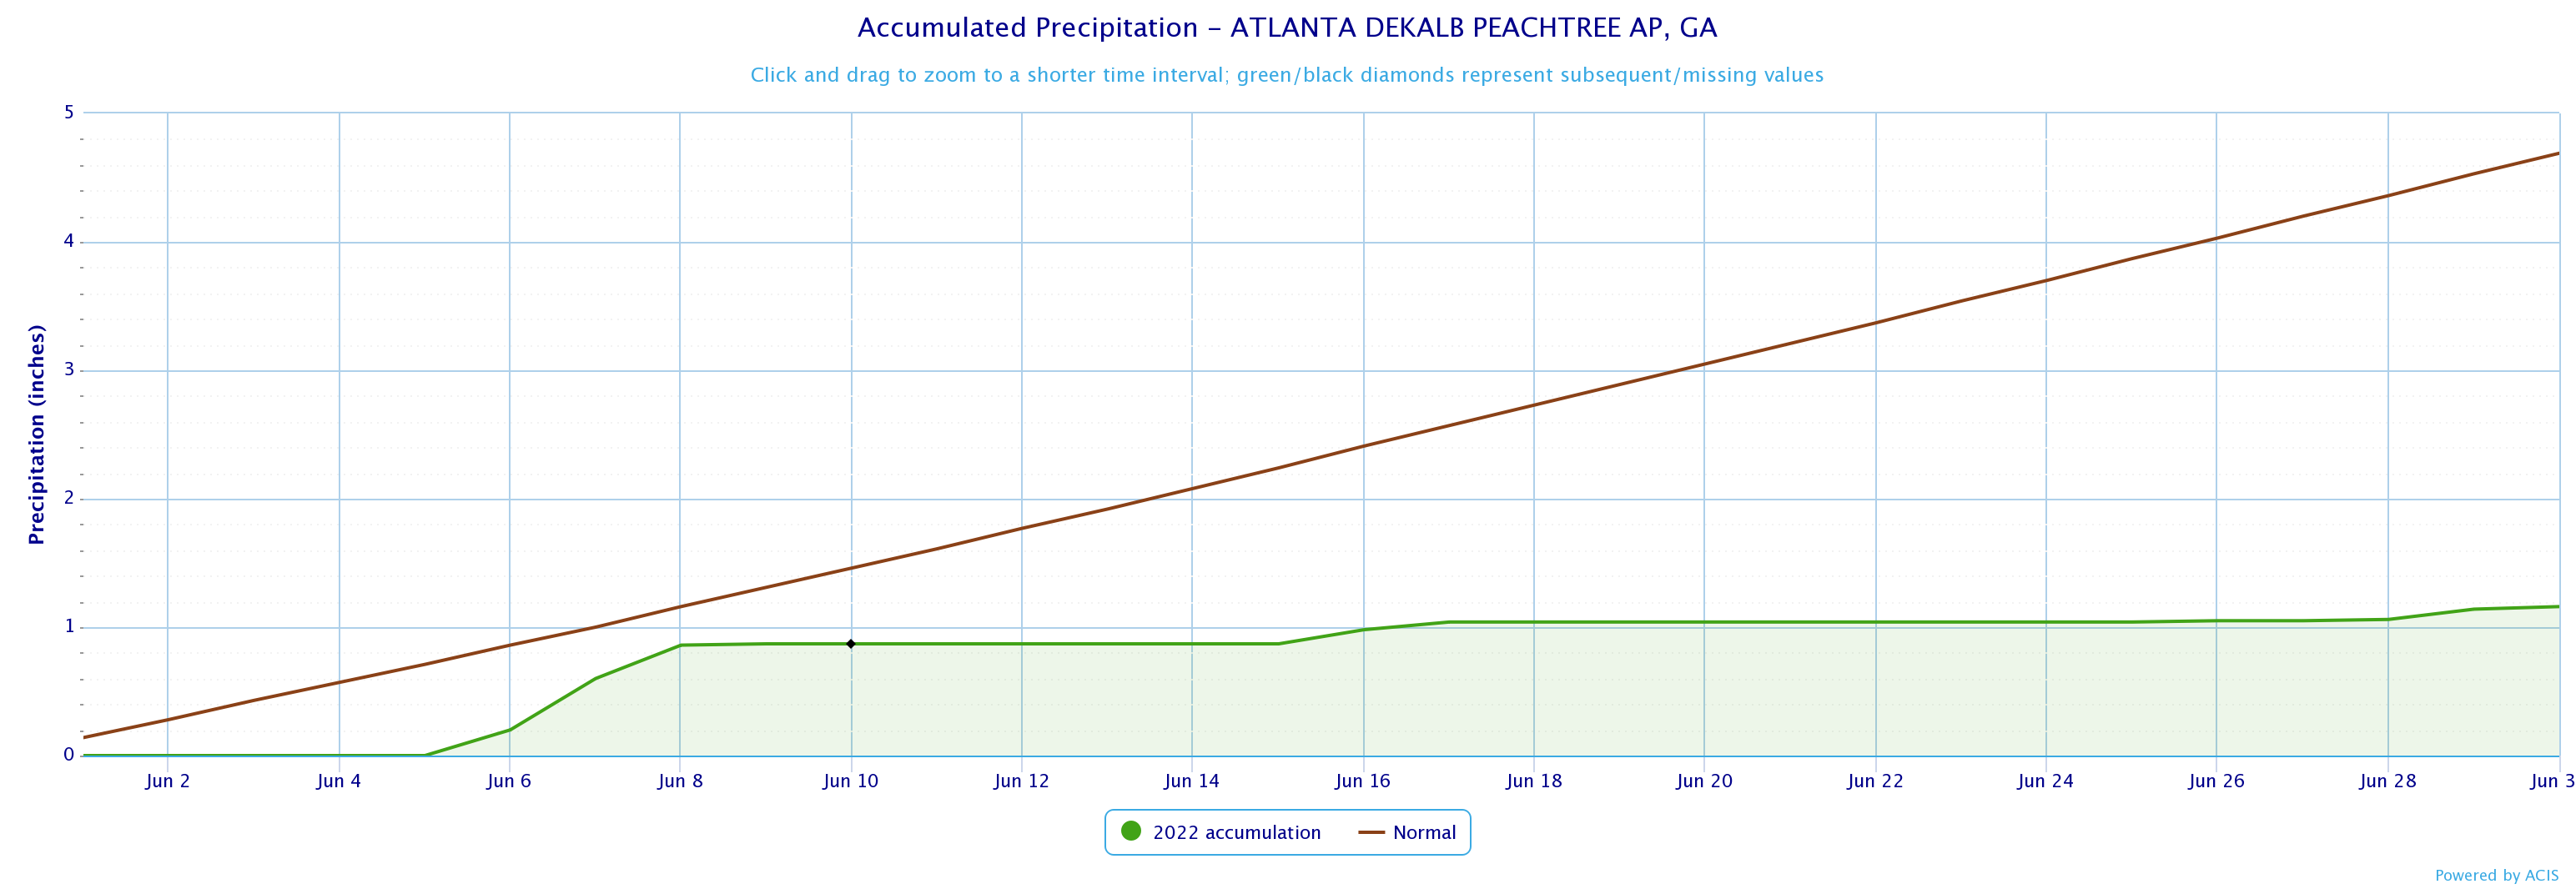
Dekalb Peachtree Arpt
0.40
6/7
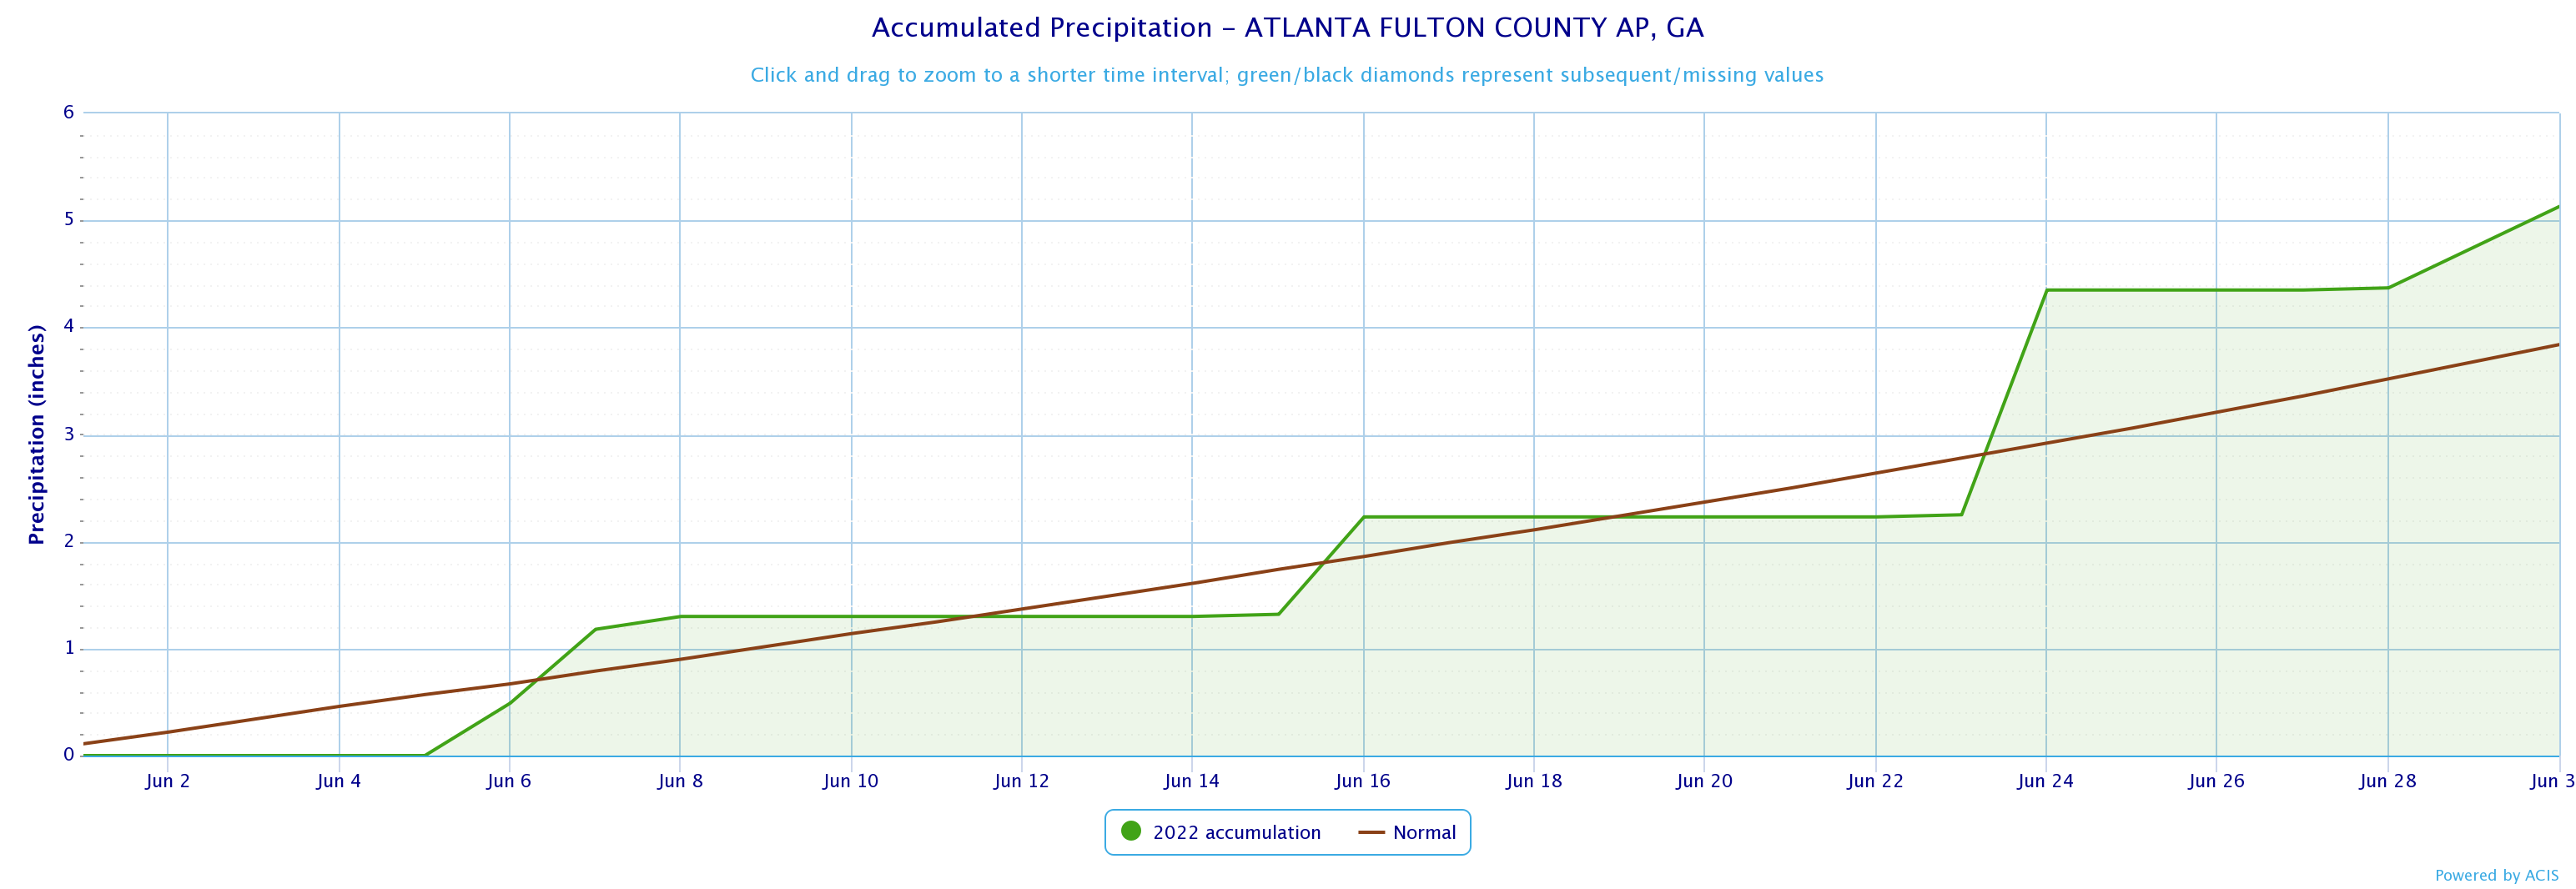
Fulton Co Arpt
2.10
6/24
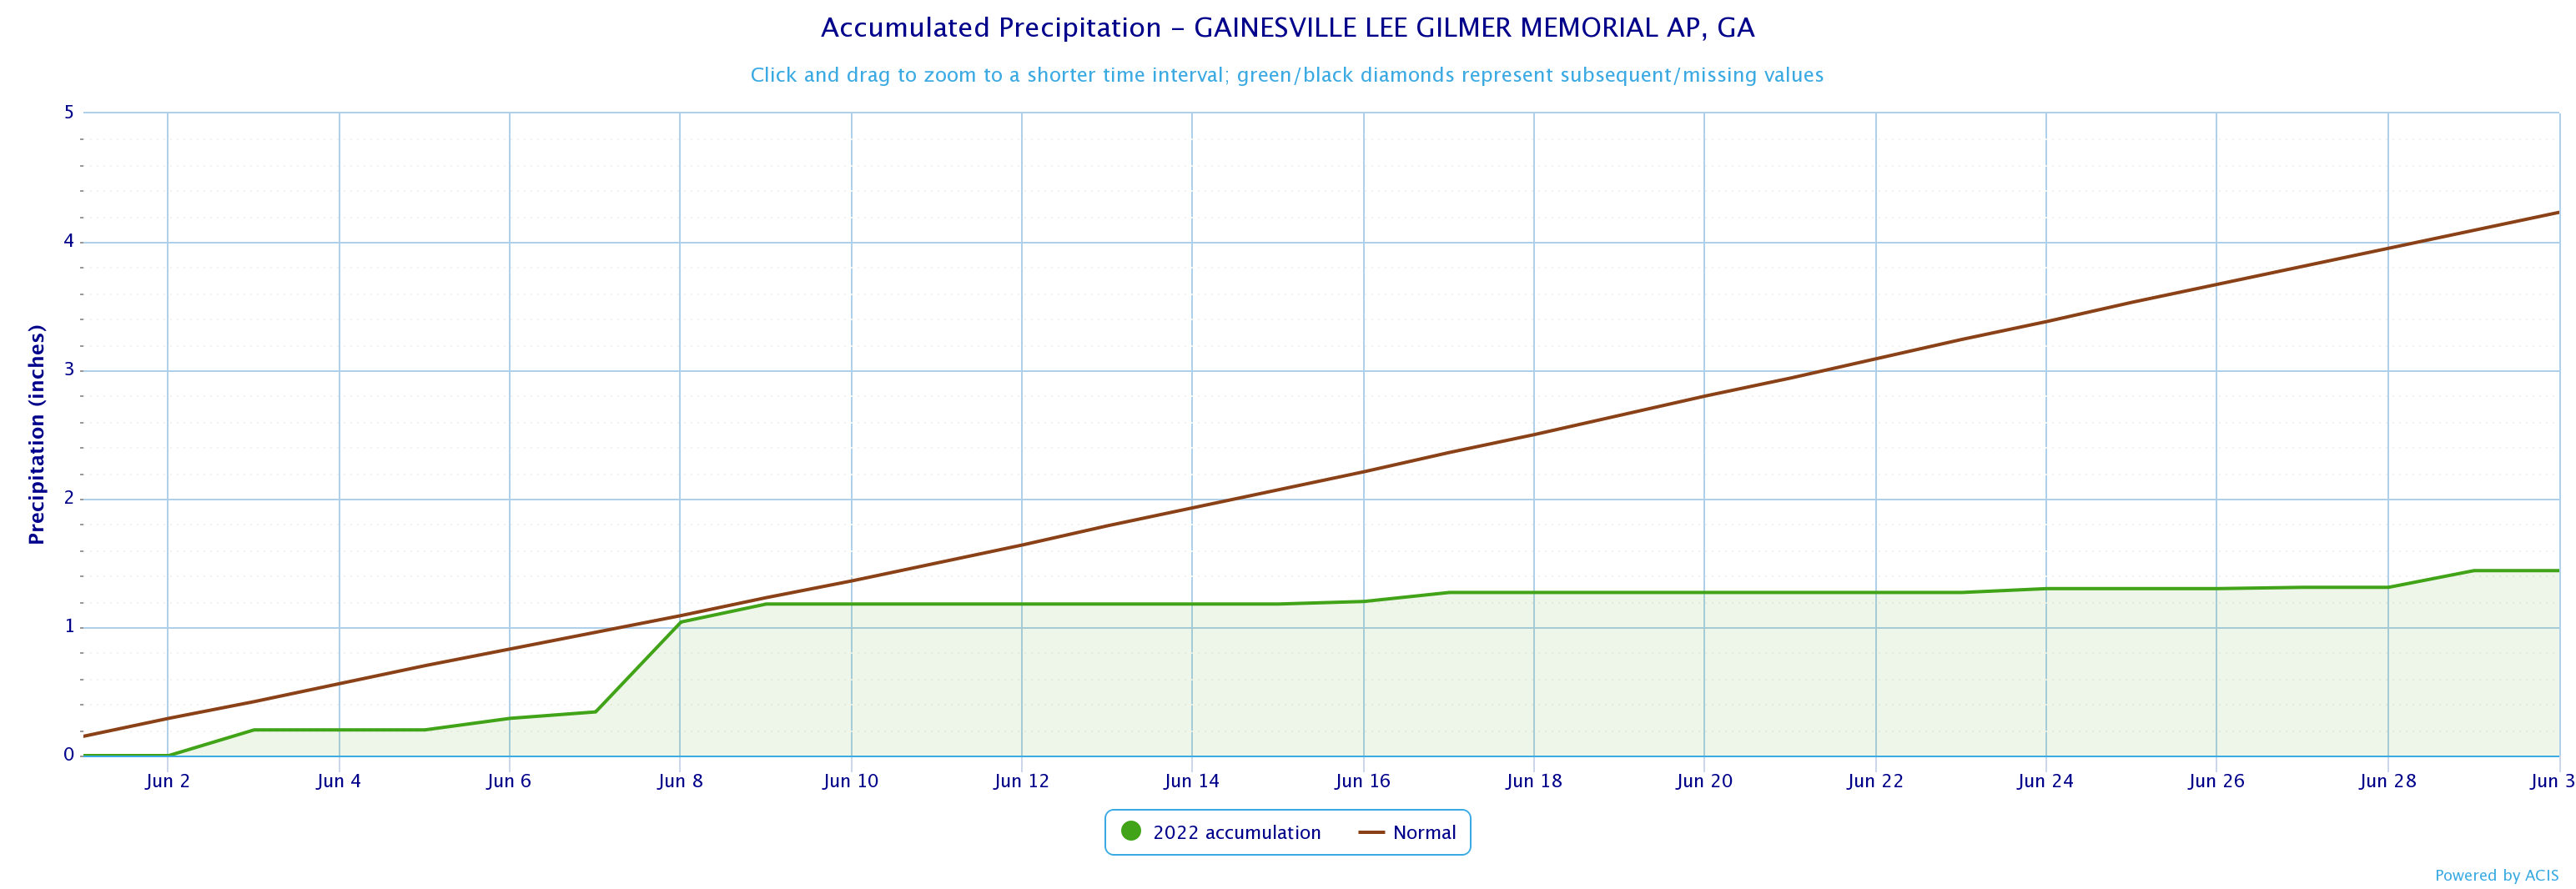
Gainesville
0.70
6/8
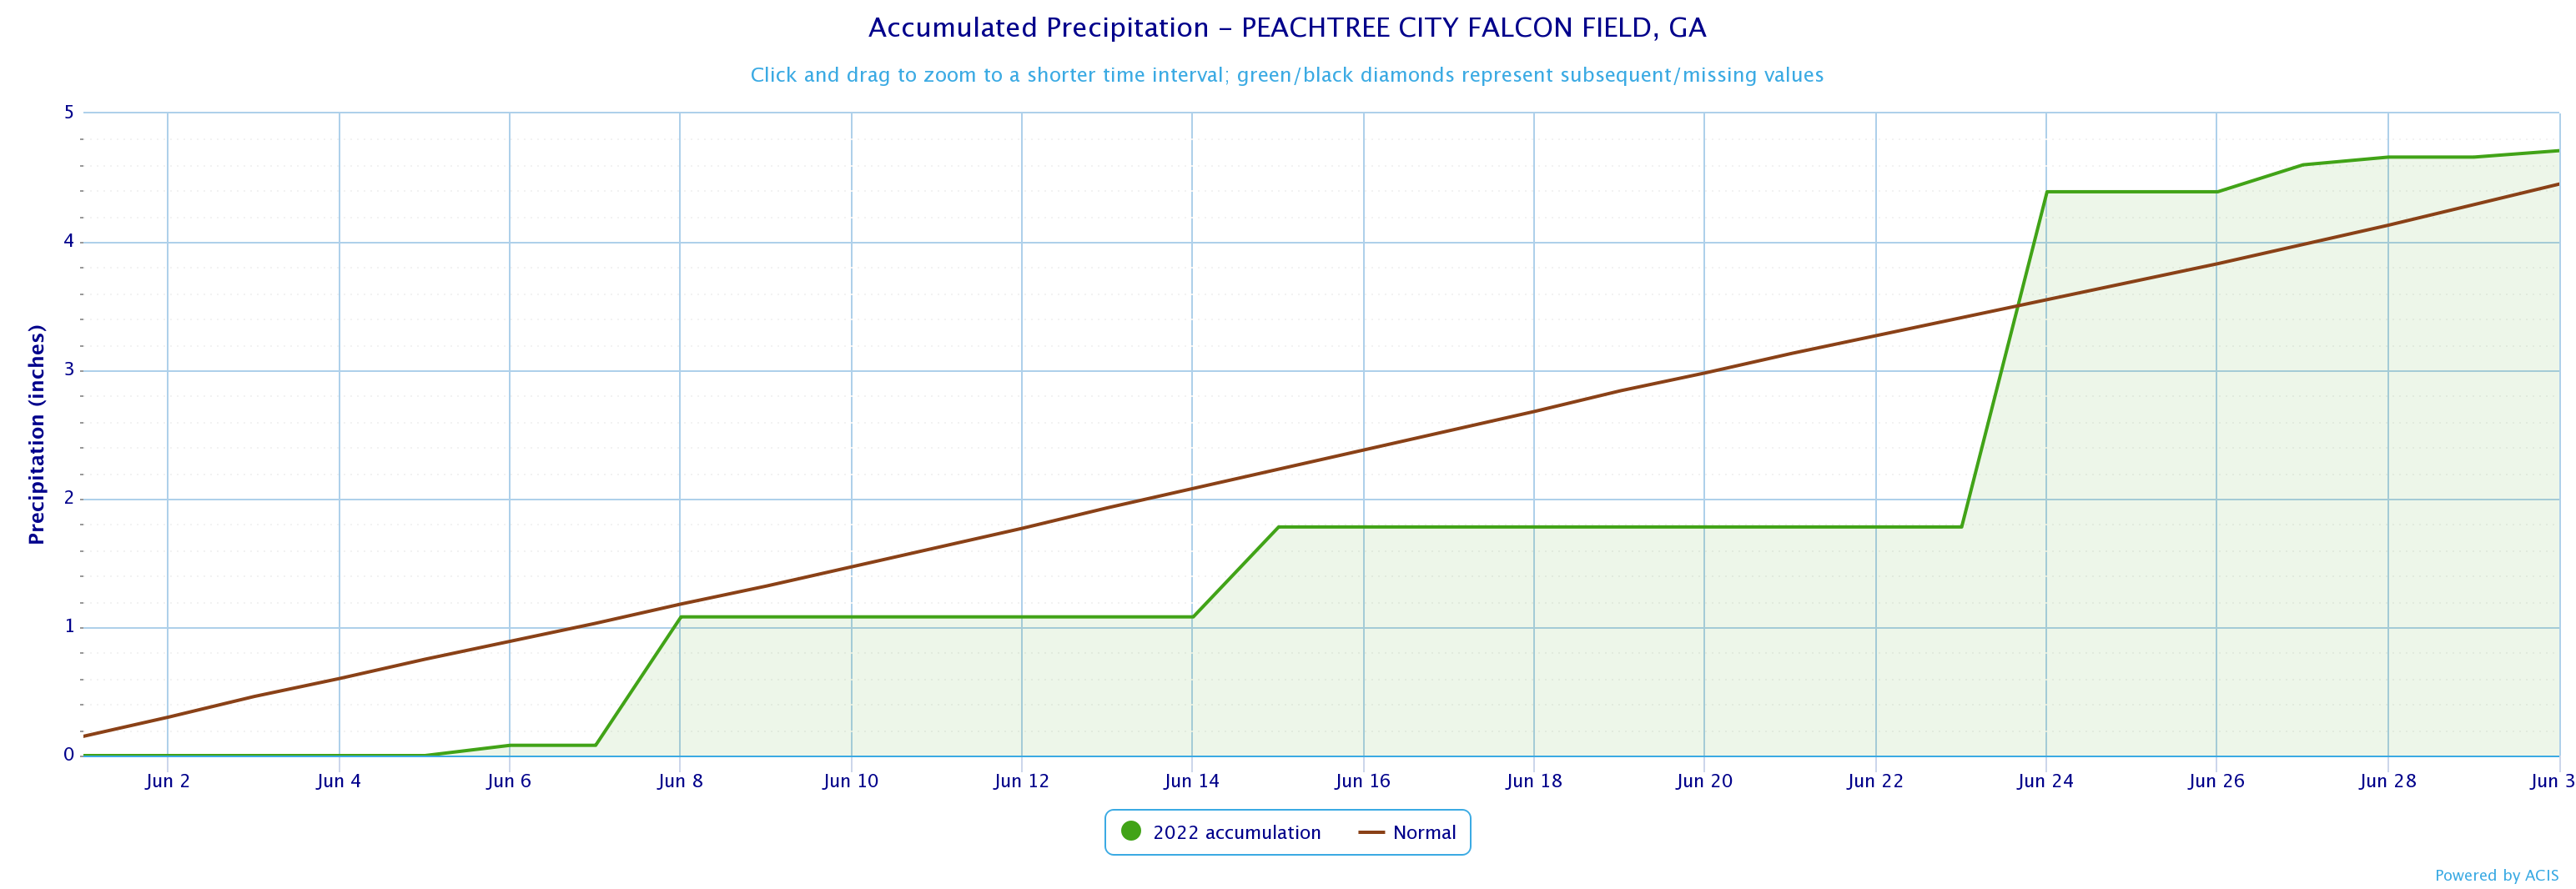
Peachtree City
2.61
6/24
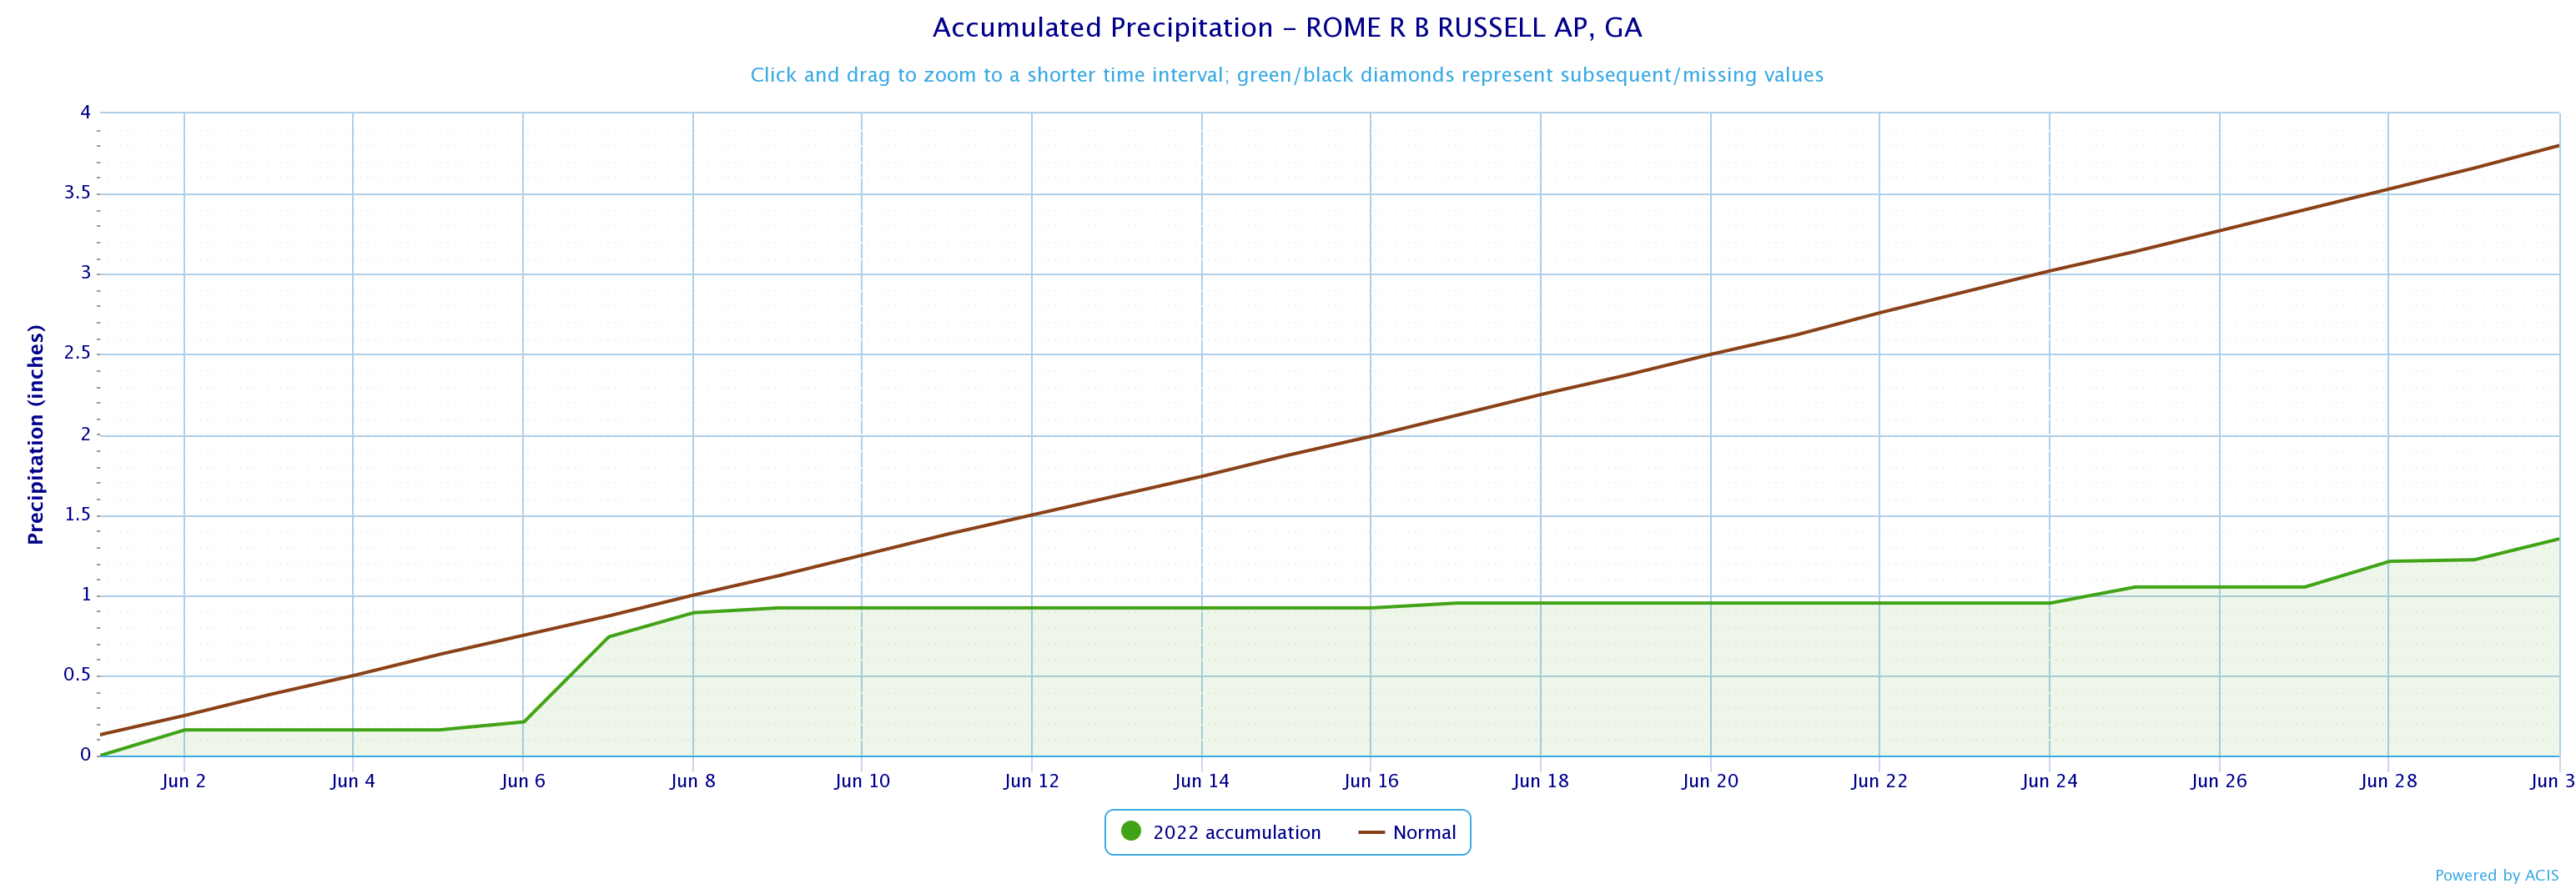
Rome
0.53
6/7
Click the links below to explore the temperature and precipitation data across north and central Georgia for the month of June 2022.
Temperature Maps
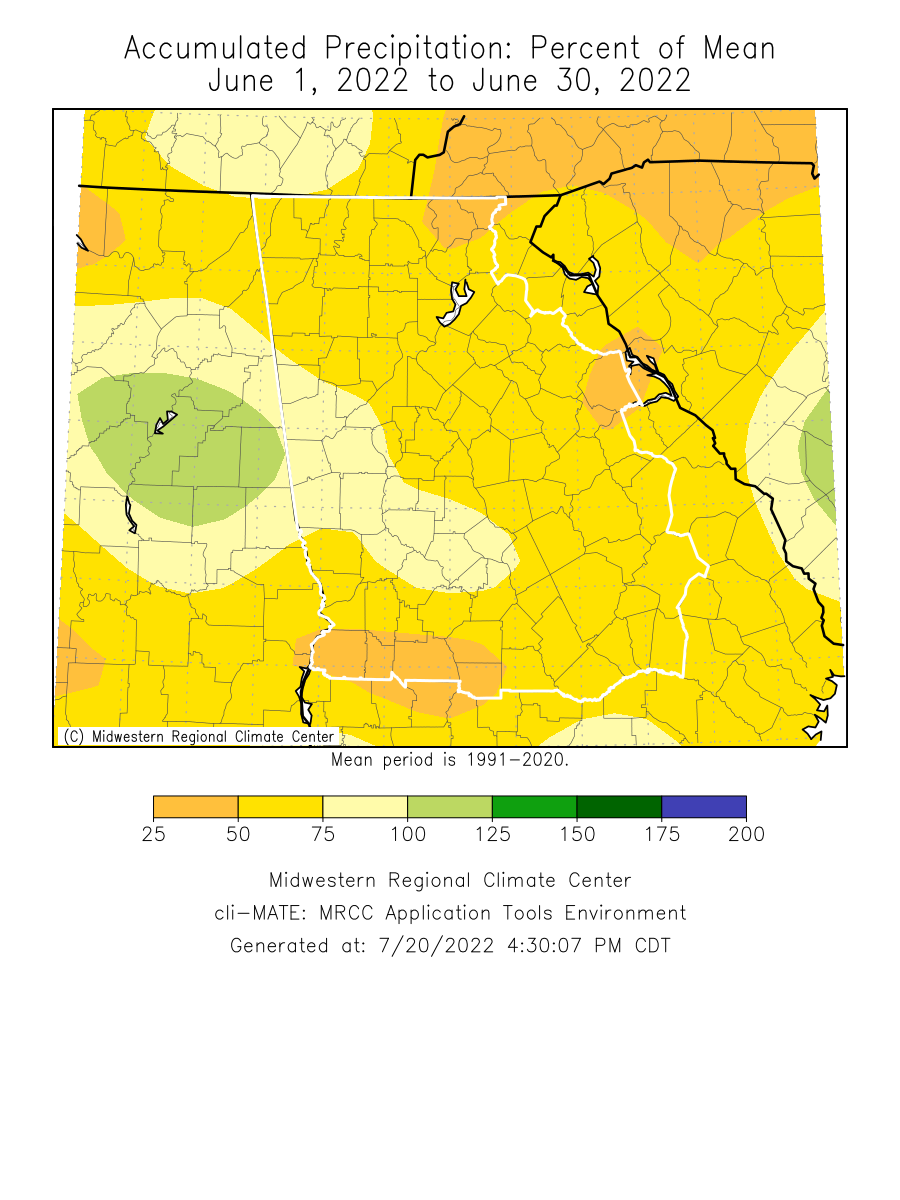
Precipitation Maps
Temperature Graphs
Precipitation Graphs

Temperature and precipitation records at our 4 main climate sites are located below.
June 2022 Climate Records
Date
Type
Location
Records set over a 24 hour period
6/28
Daily Rainfall
Atlanta
2.40 Inches of rain fell over 24 hours. This breaks the old record of 2.28 inches set in 1982.
June 2022 Climate Records
Date
Type
Location
Records set over a 24 hour period
6/15
Max T
Atlanta
Atlanta reached a high MAX temperature of 99°F. This breaks the old record of 96°F set in 1943.
6/15
Max T
Macon
Macon reached a high MAX temperature of 103°F. This breaks the old record of 100°F set in 1925.
6/16
Max T
Macon
Macon reached a high MAX temperature of 100°F. This breaks the old record of 99°F set in 1920.
6/22
Max T
Macon
Macon reached a high MAX temperature of 105°F. This breaks the old record of 101°F set in 1925.
6/23
Max T
Macon
Macon reached a high MAX temperature of 104°F. This breaks the old record of 101°F set in 1940.
Larger events that occurred across north and central Georgia this past June can be found here.


The July climate outlook is below.
July Outlook