| Previous Month | Next Month |
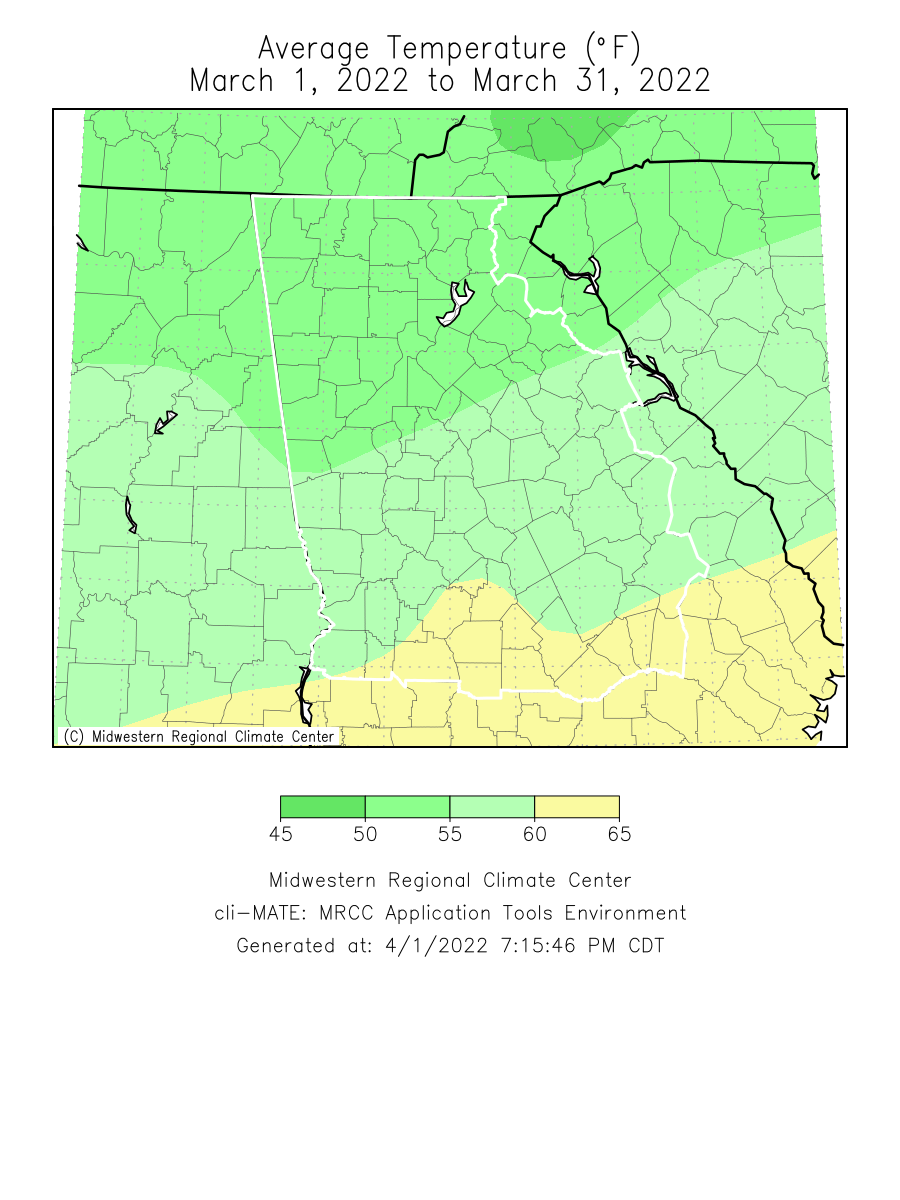
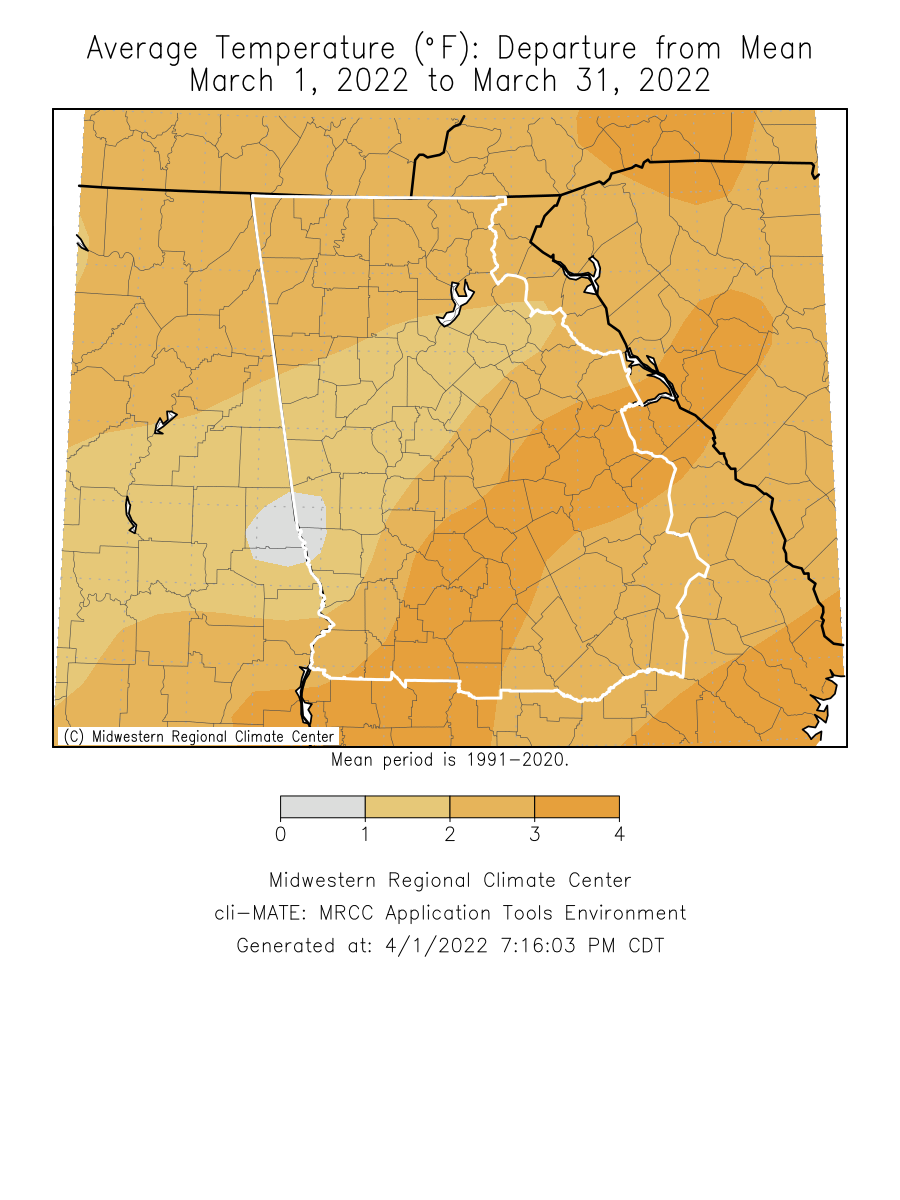
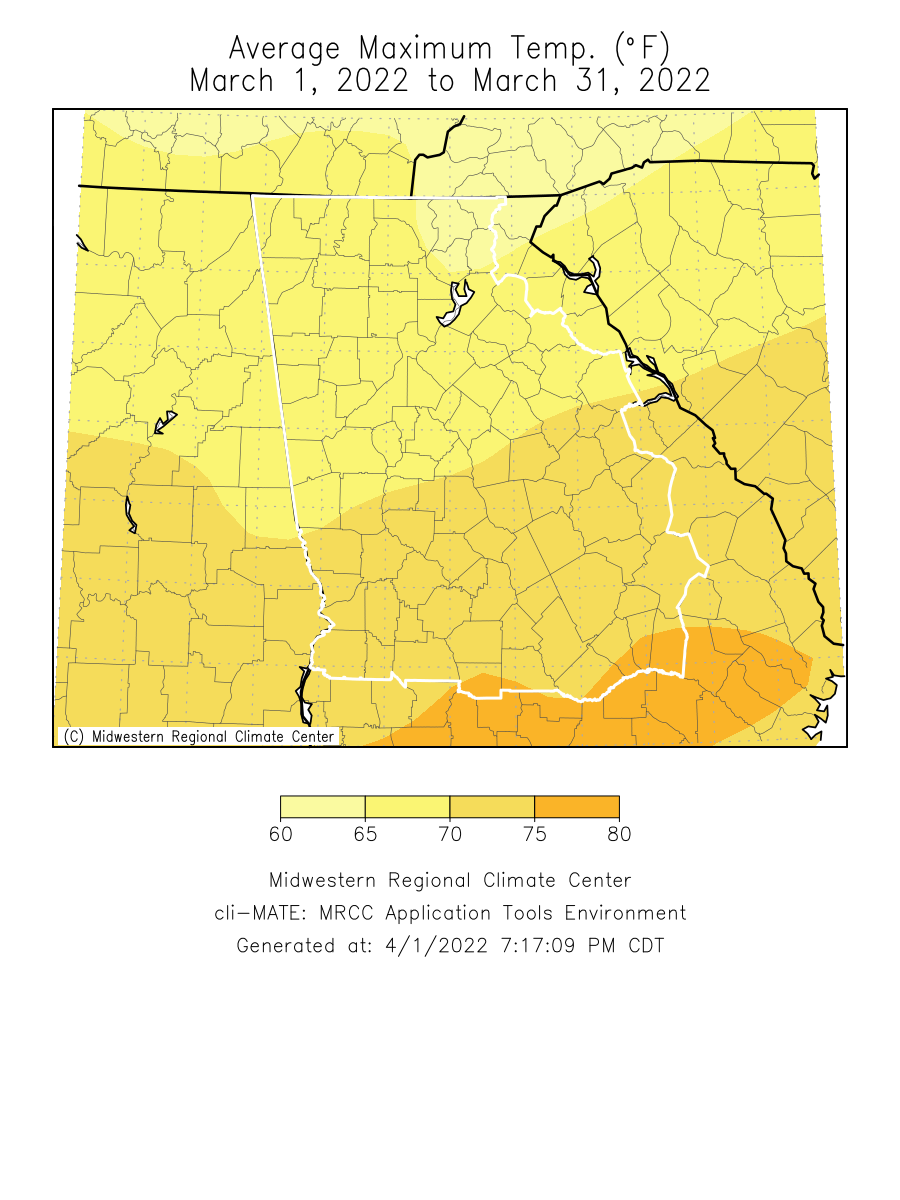
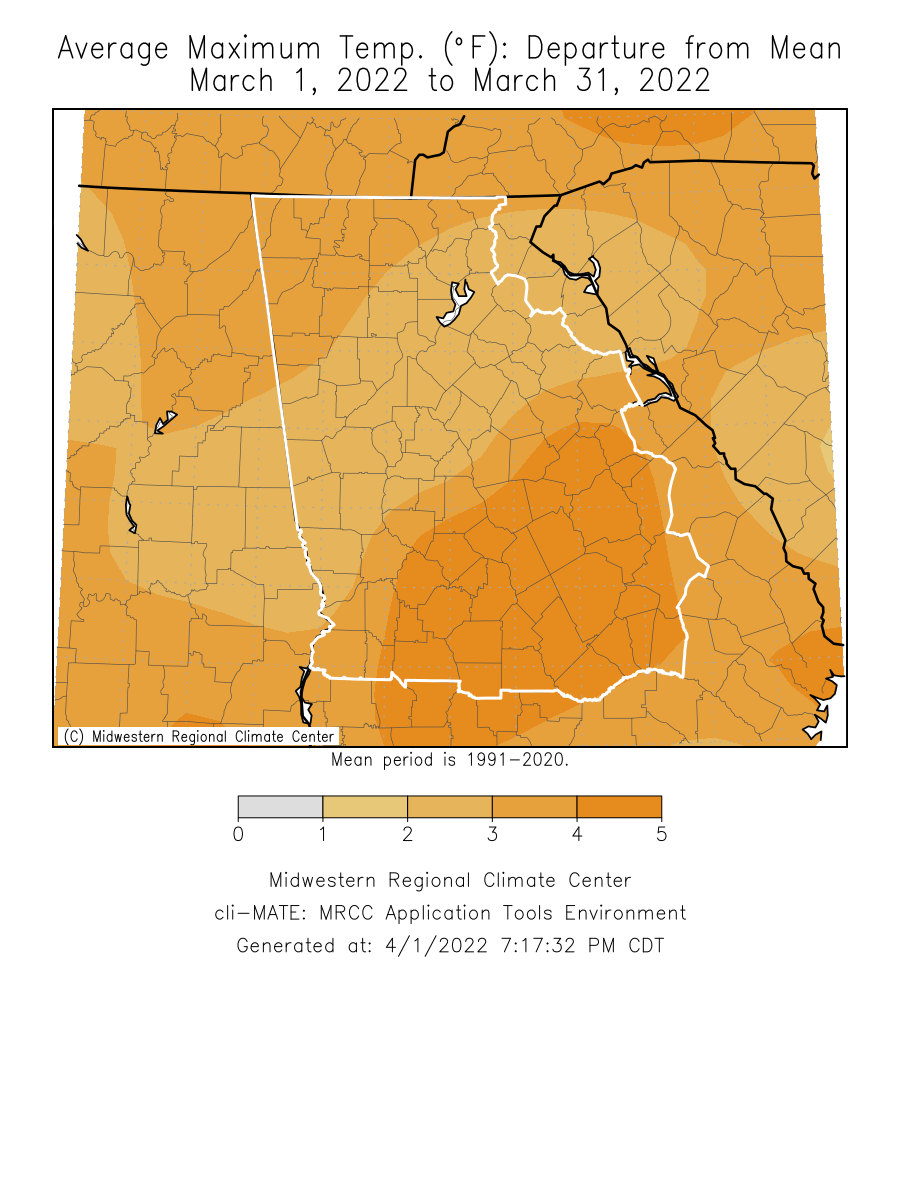
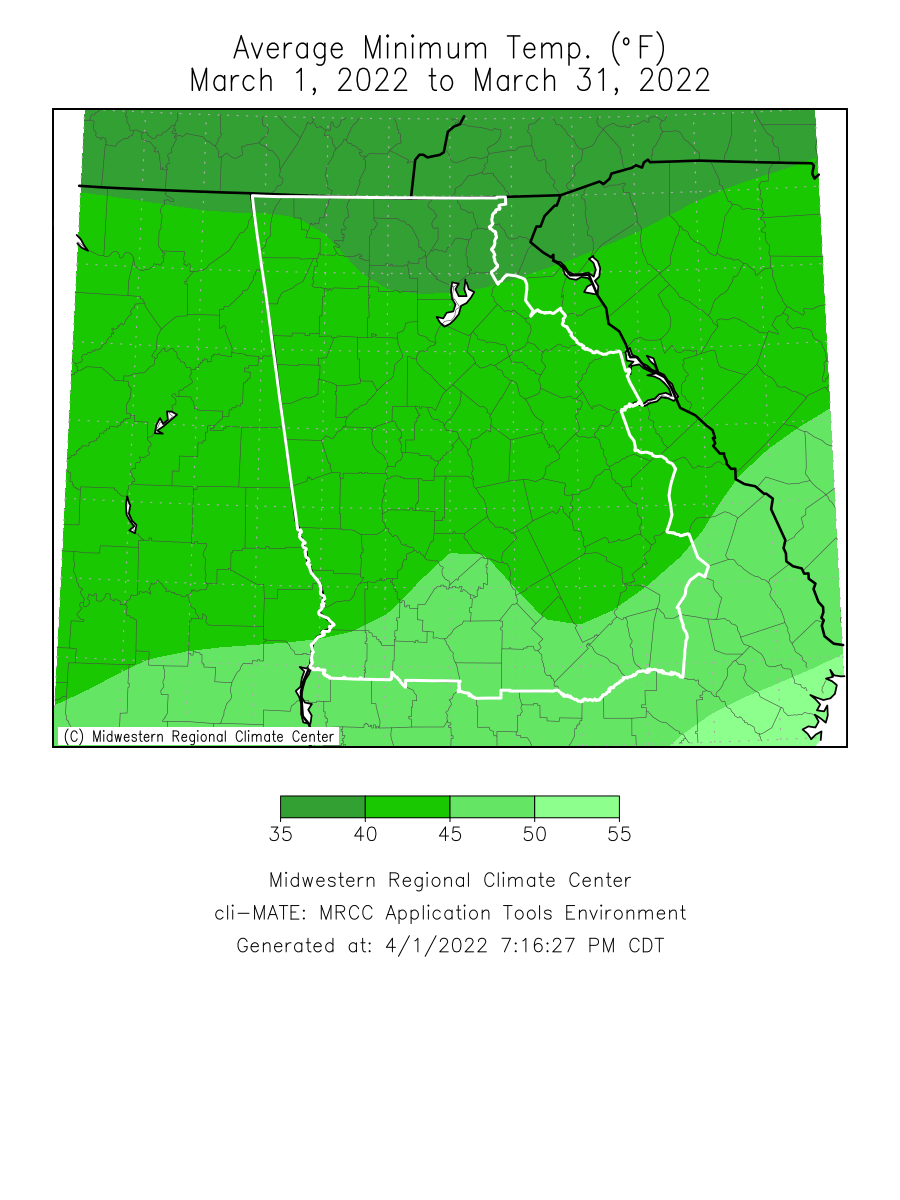
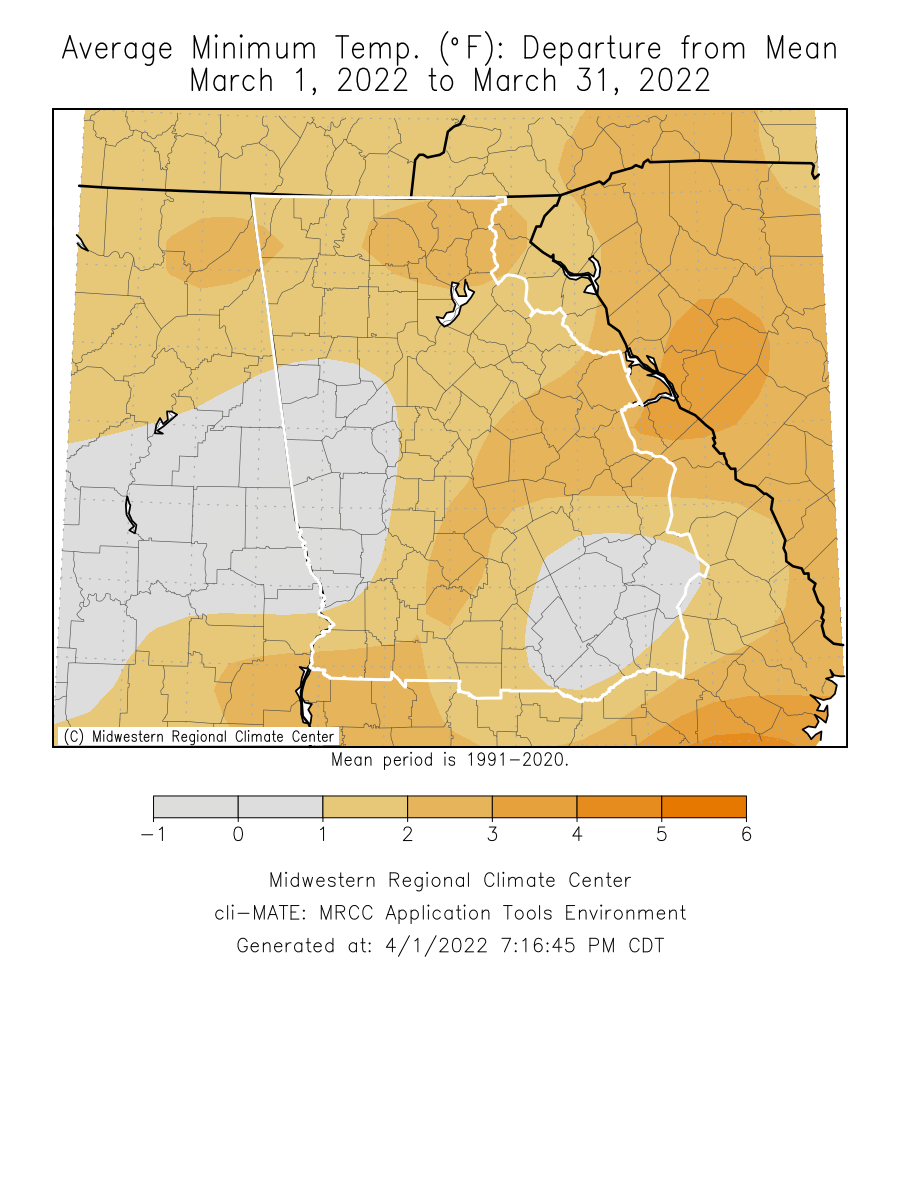
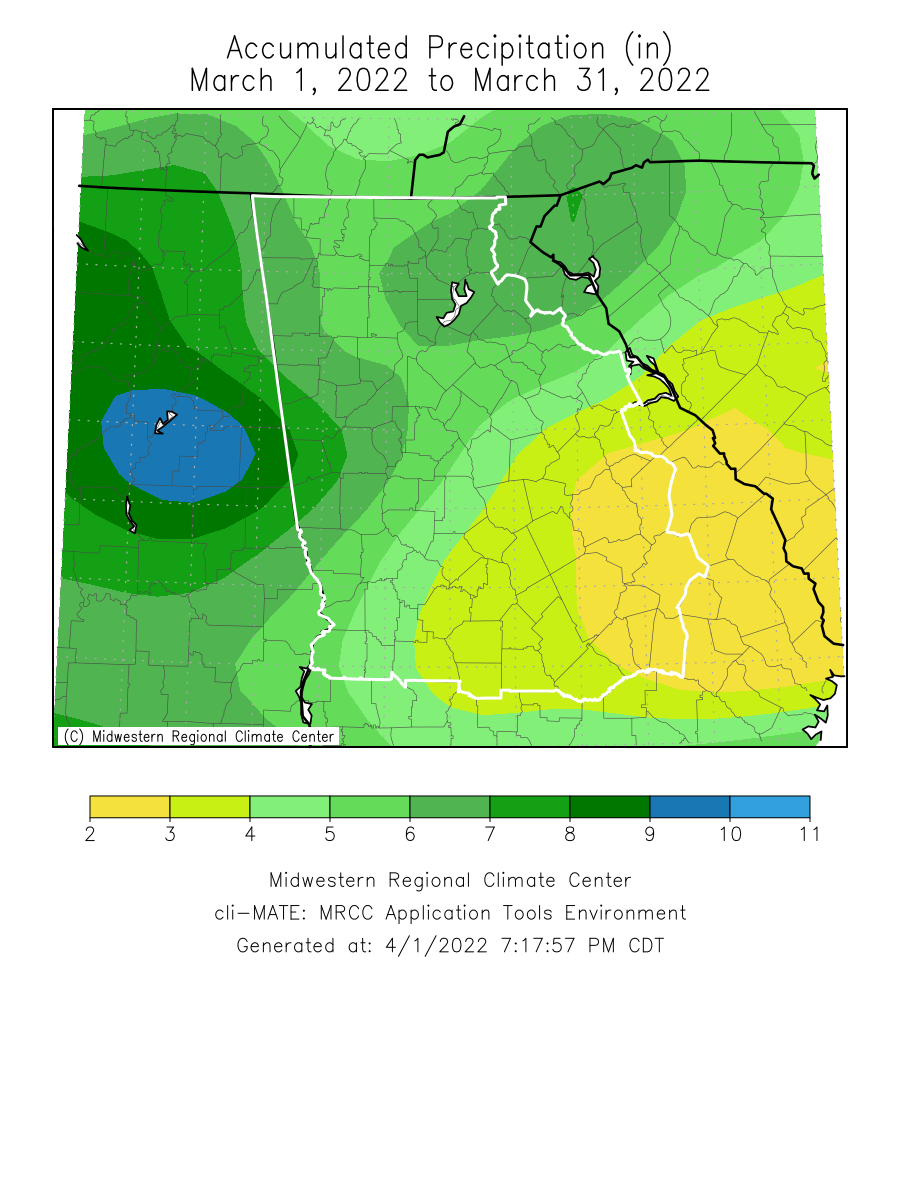
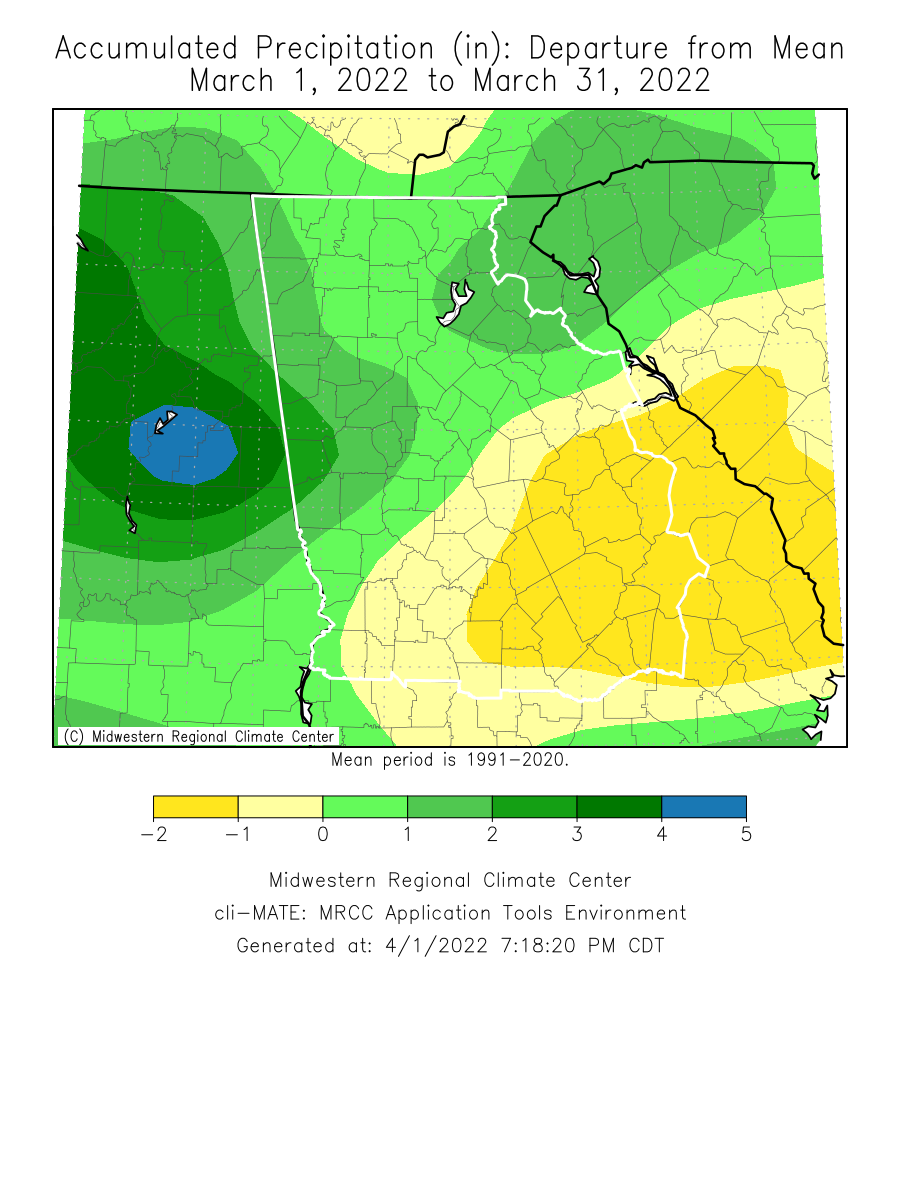
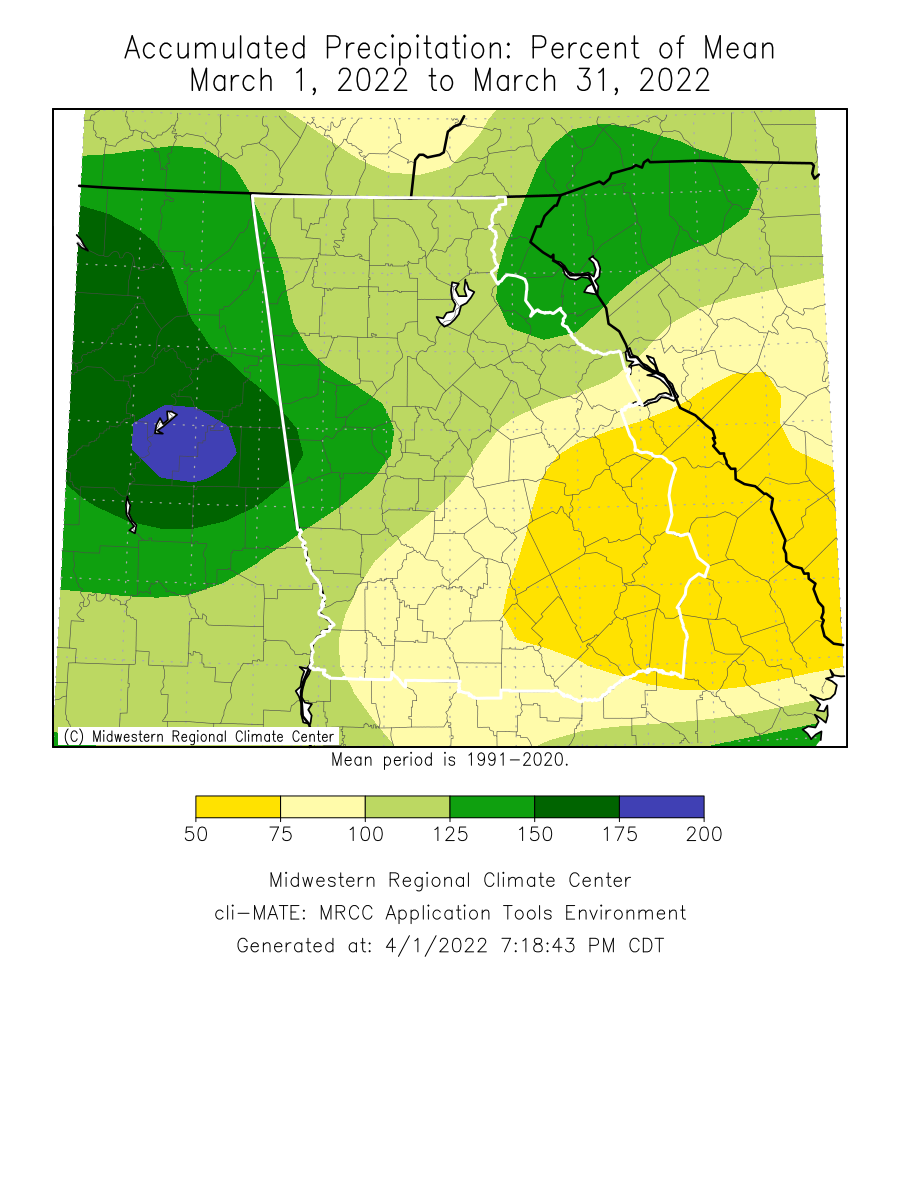
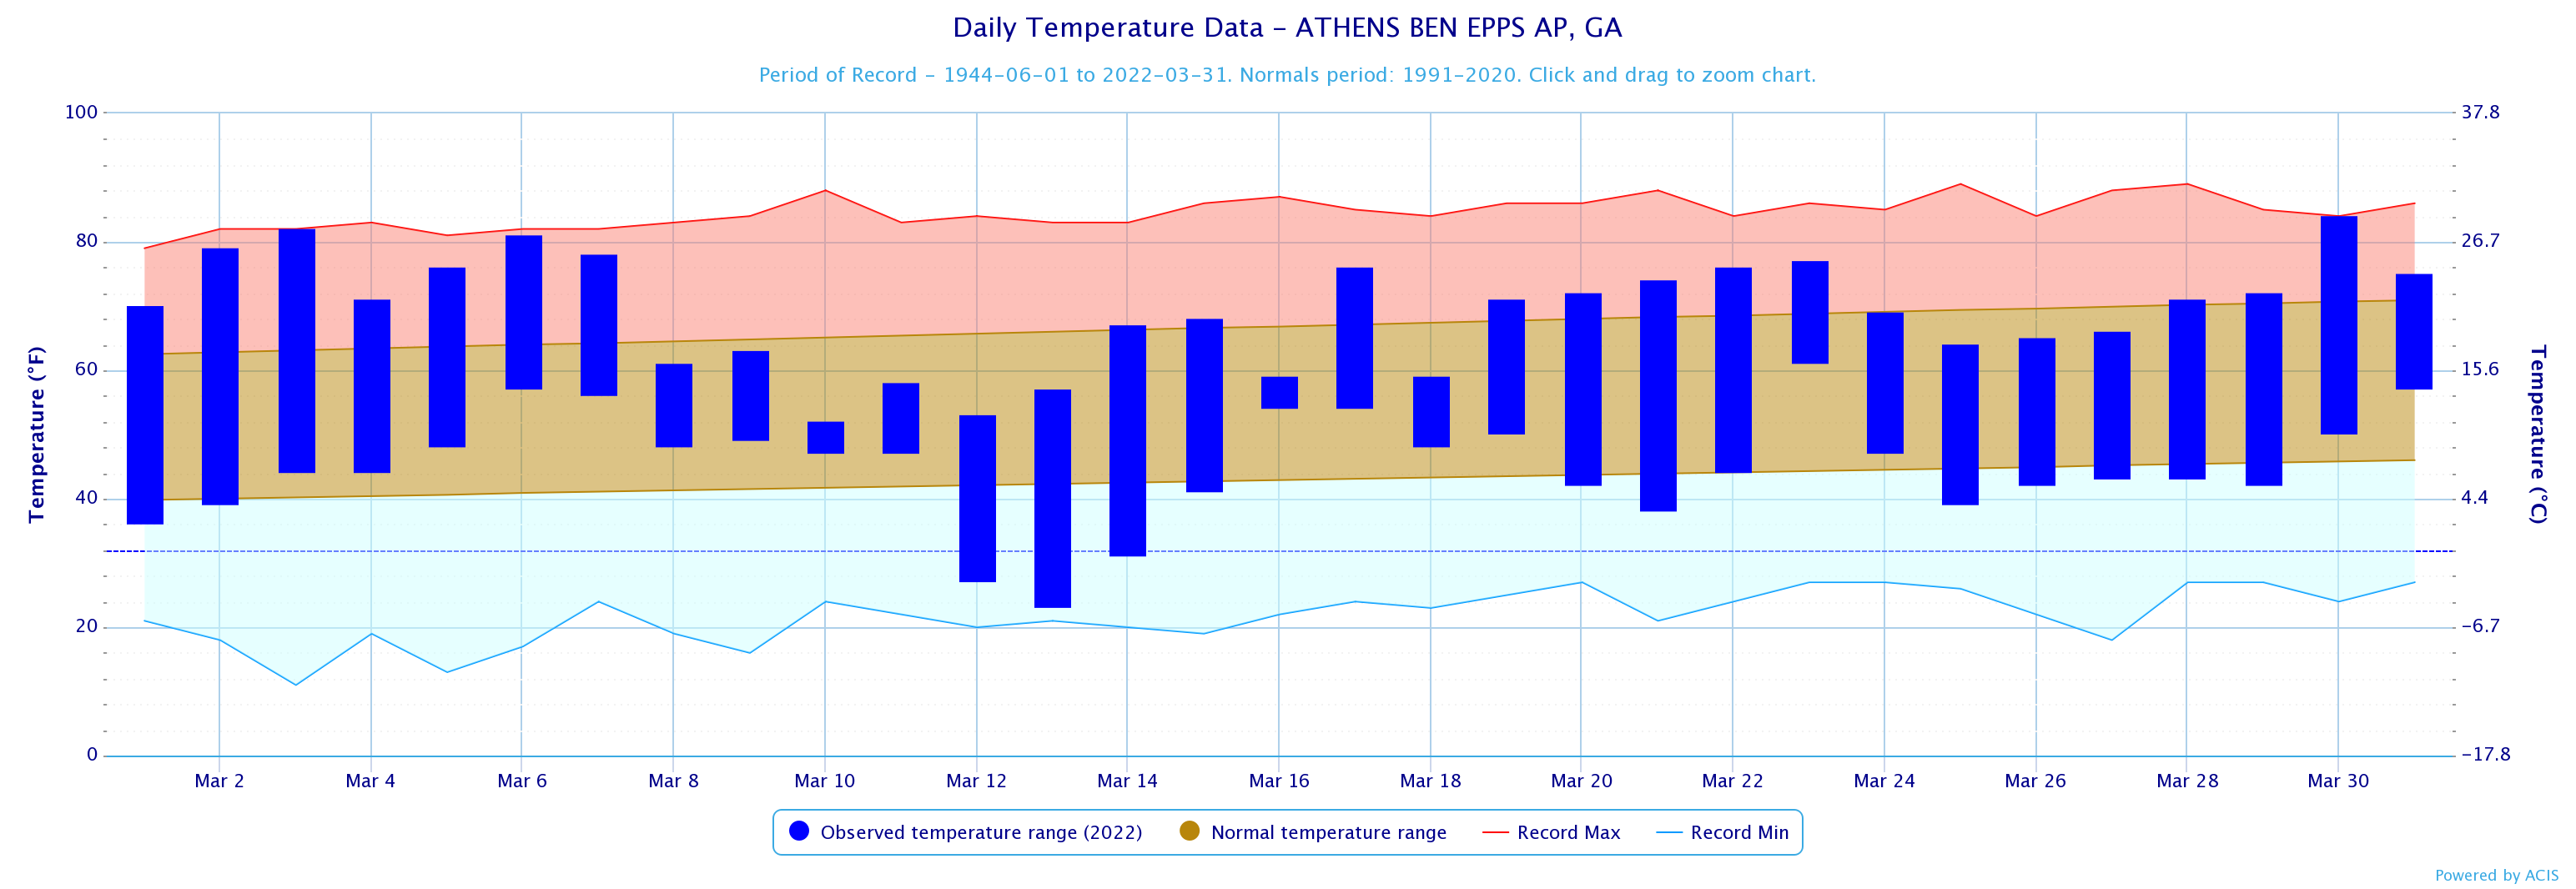
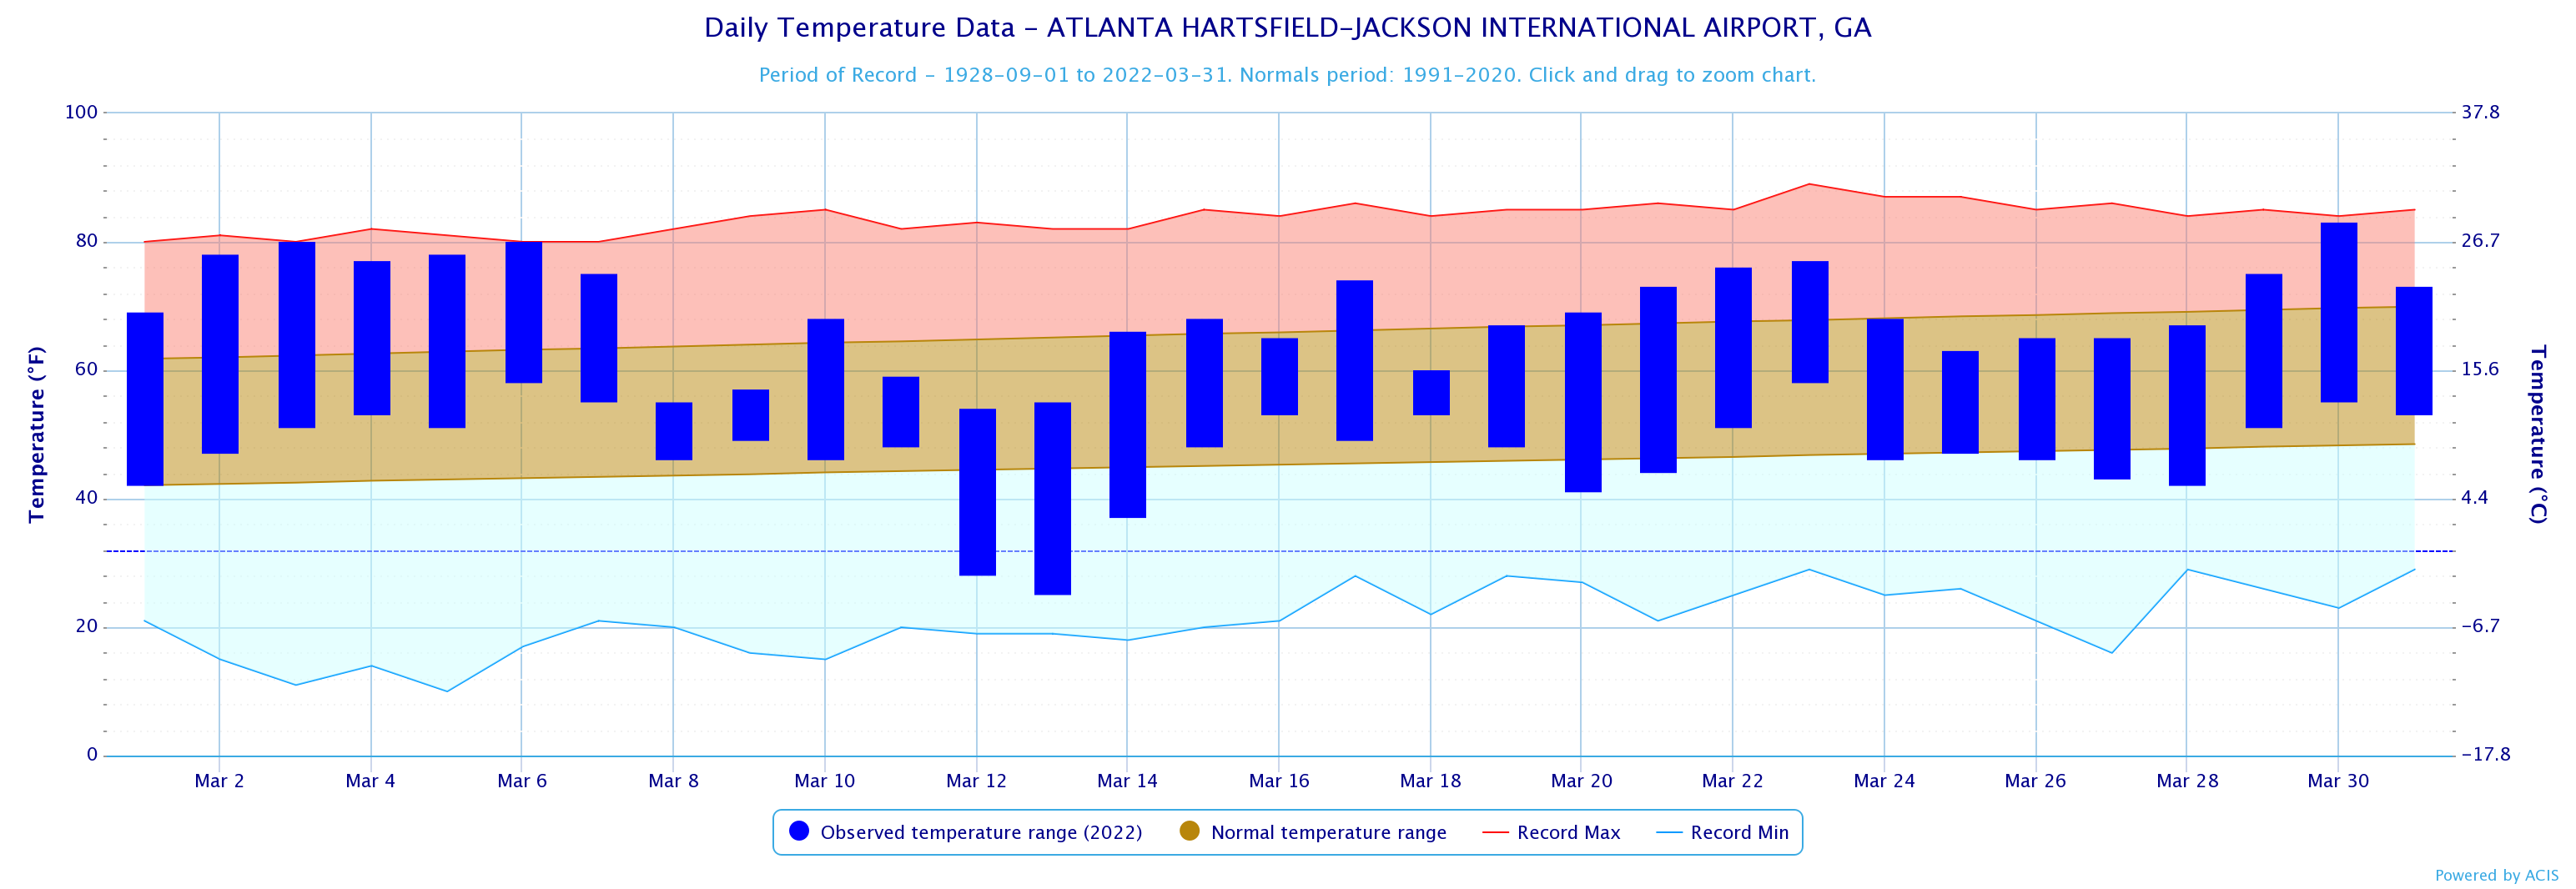
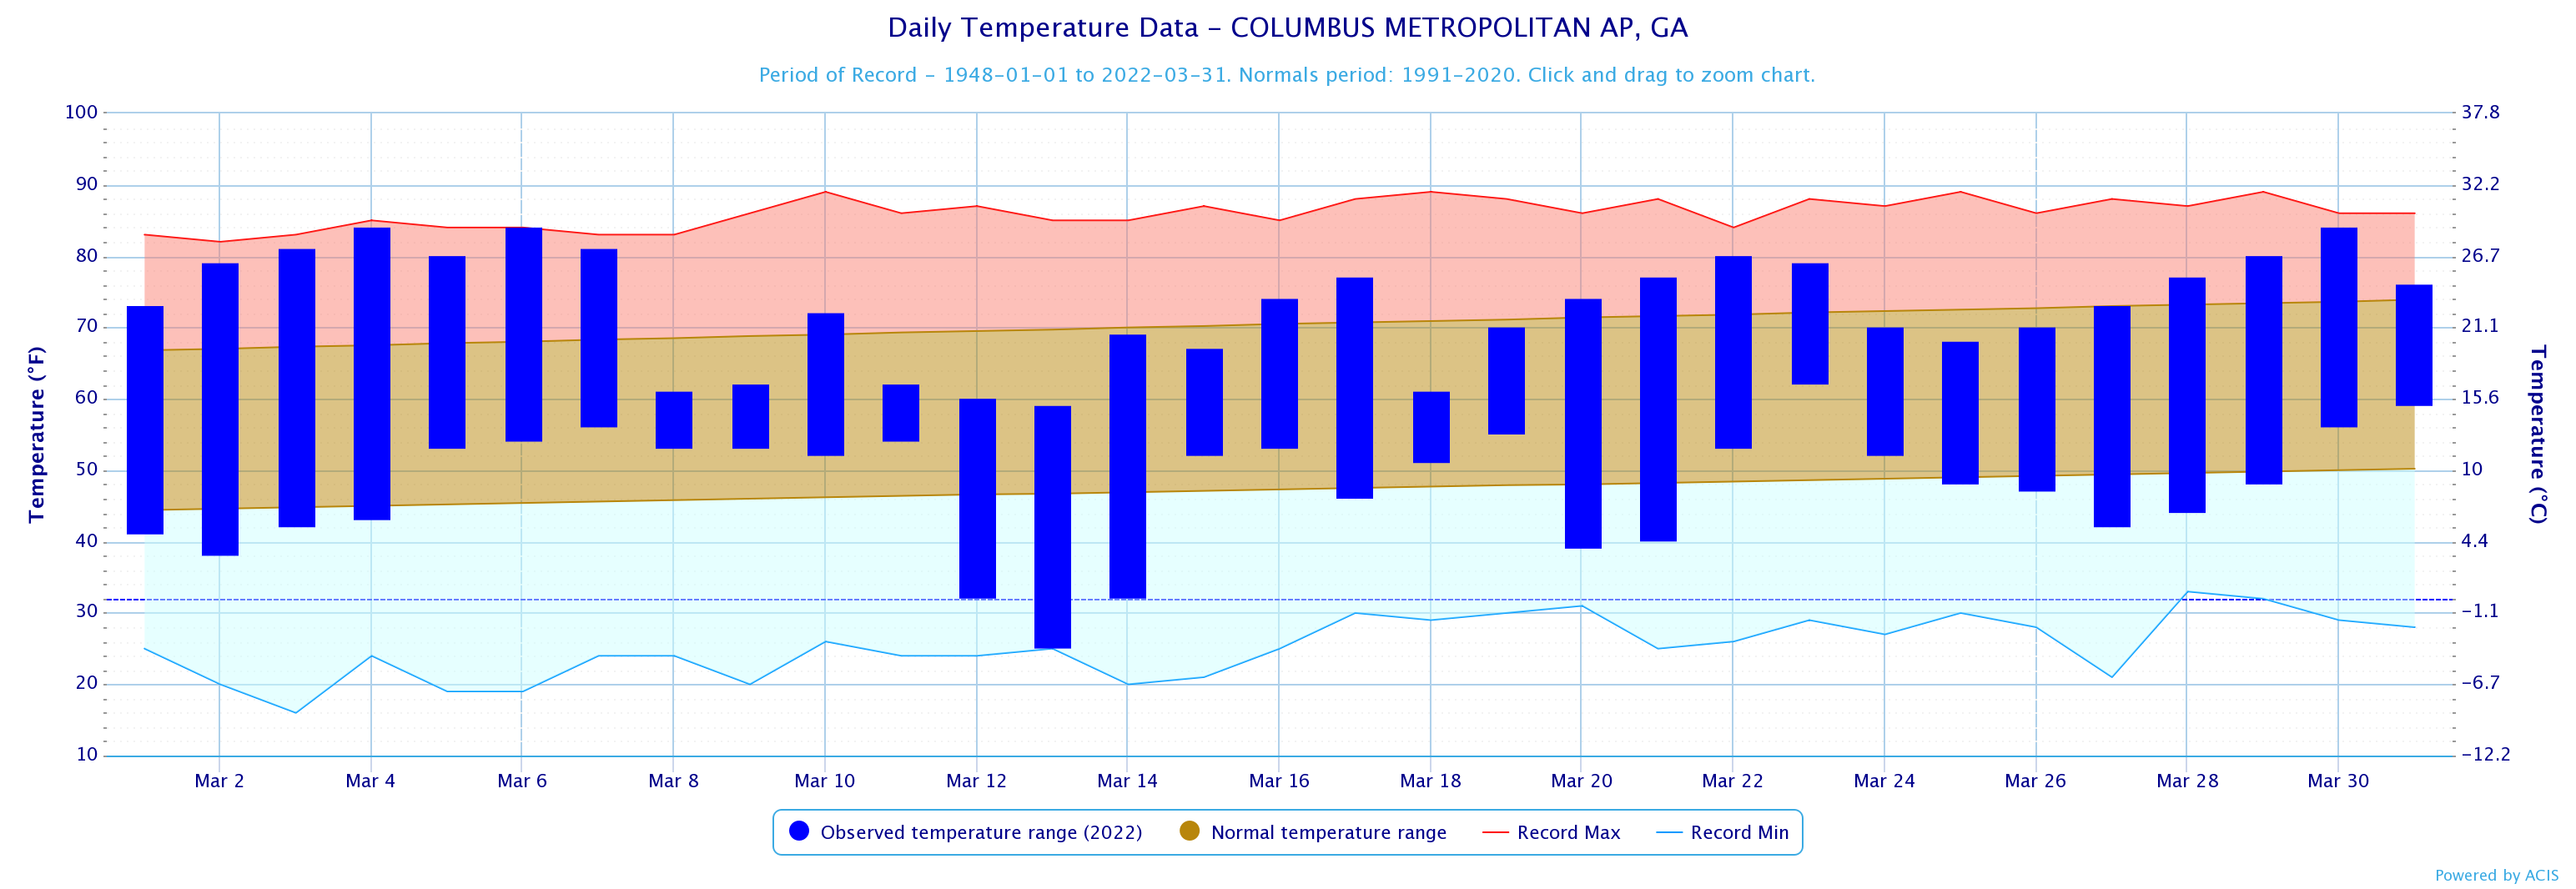
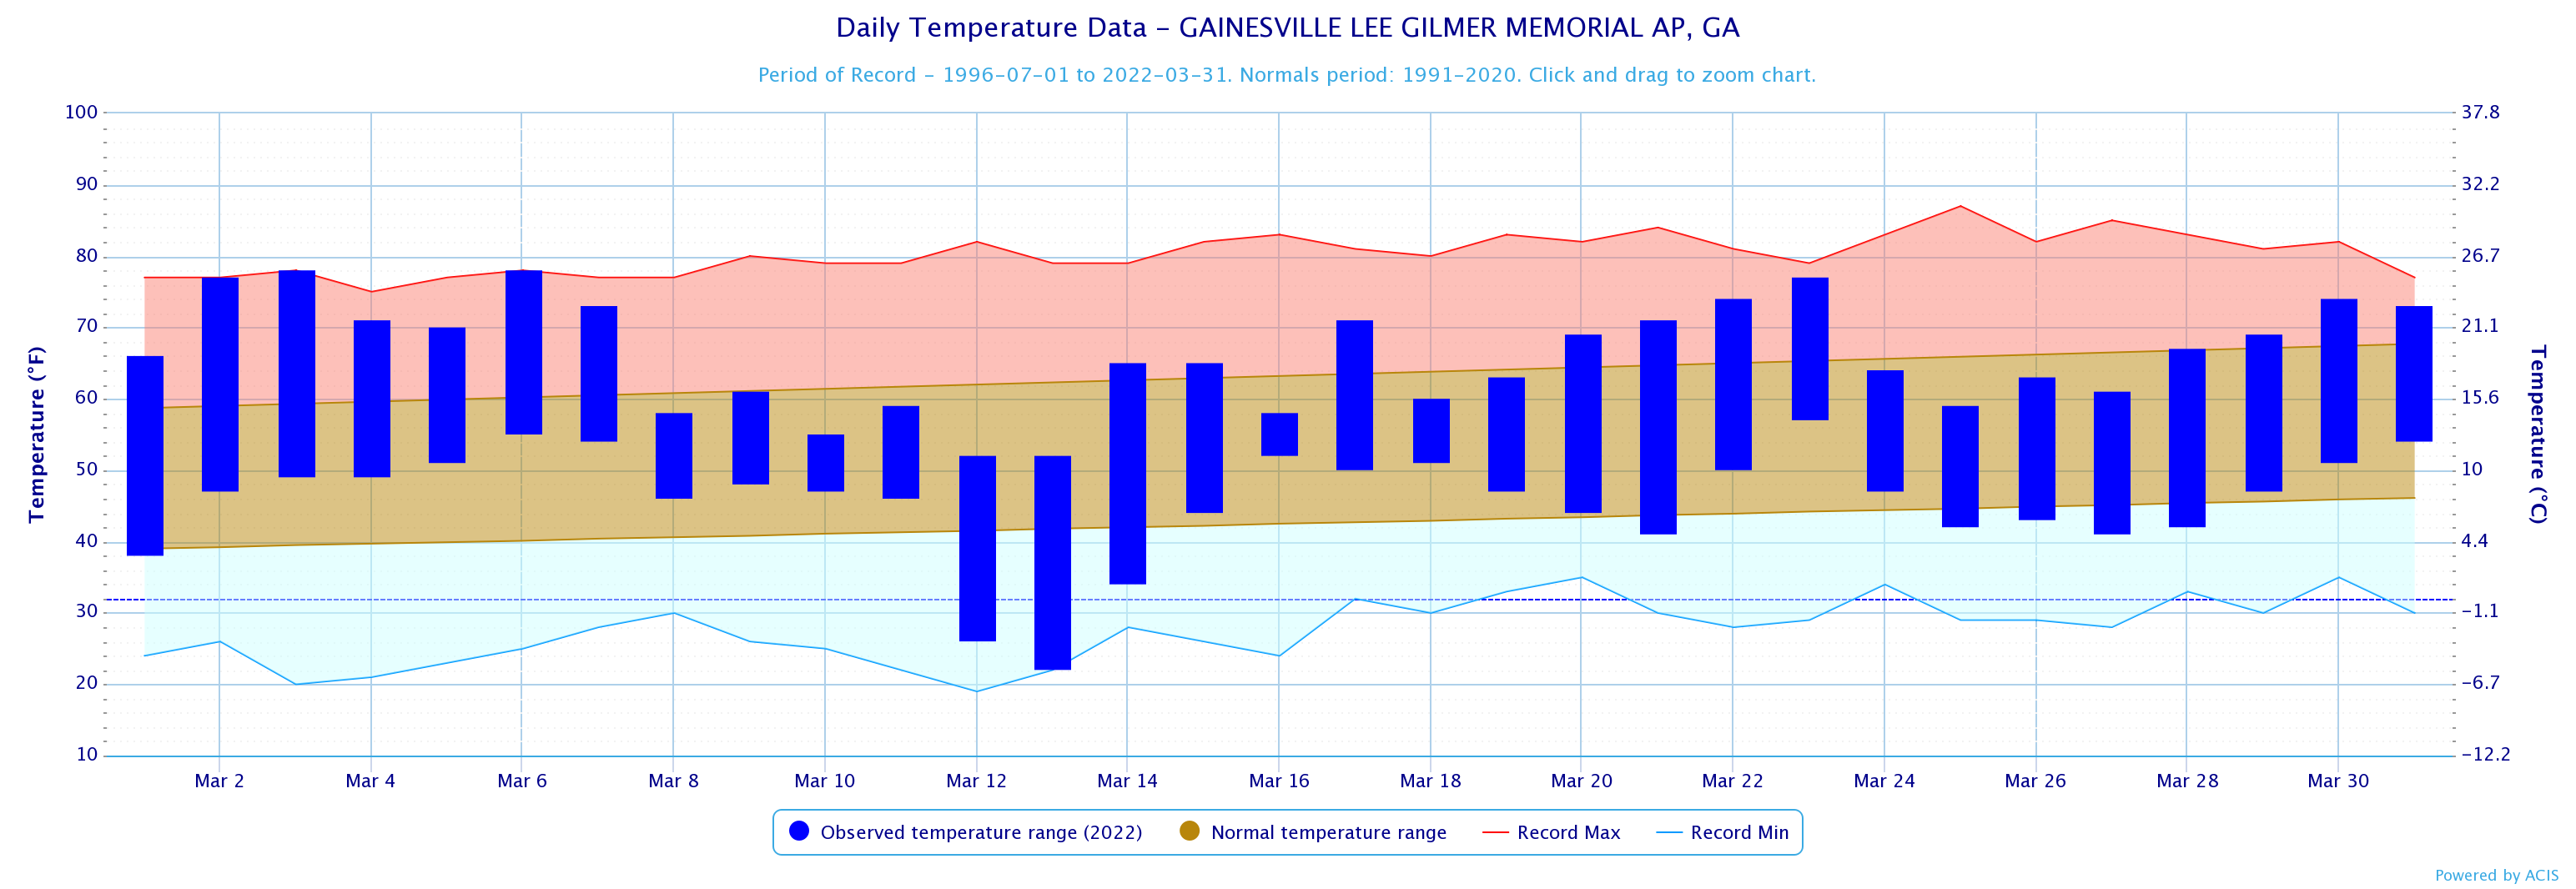
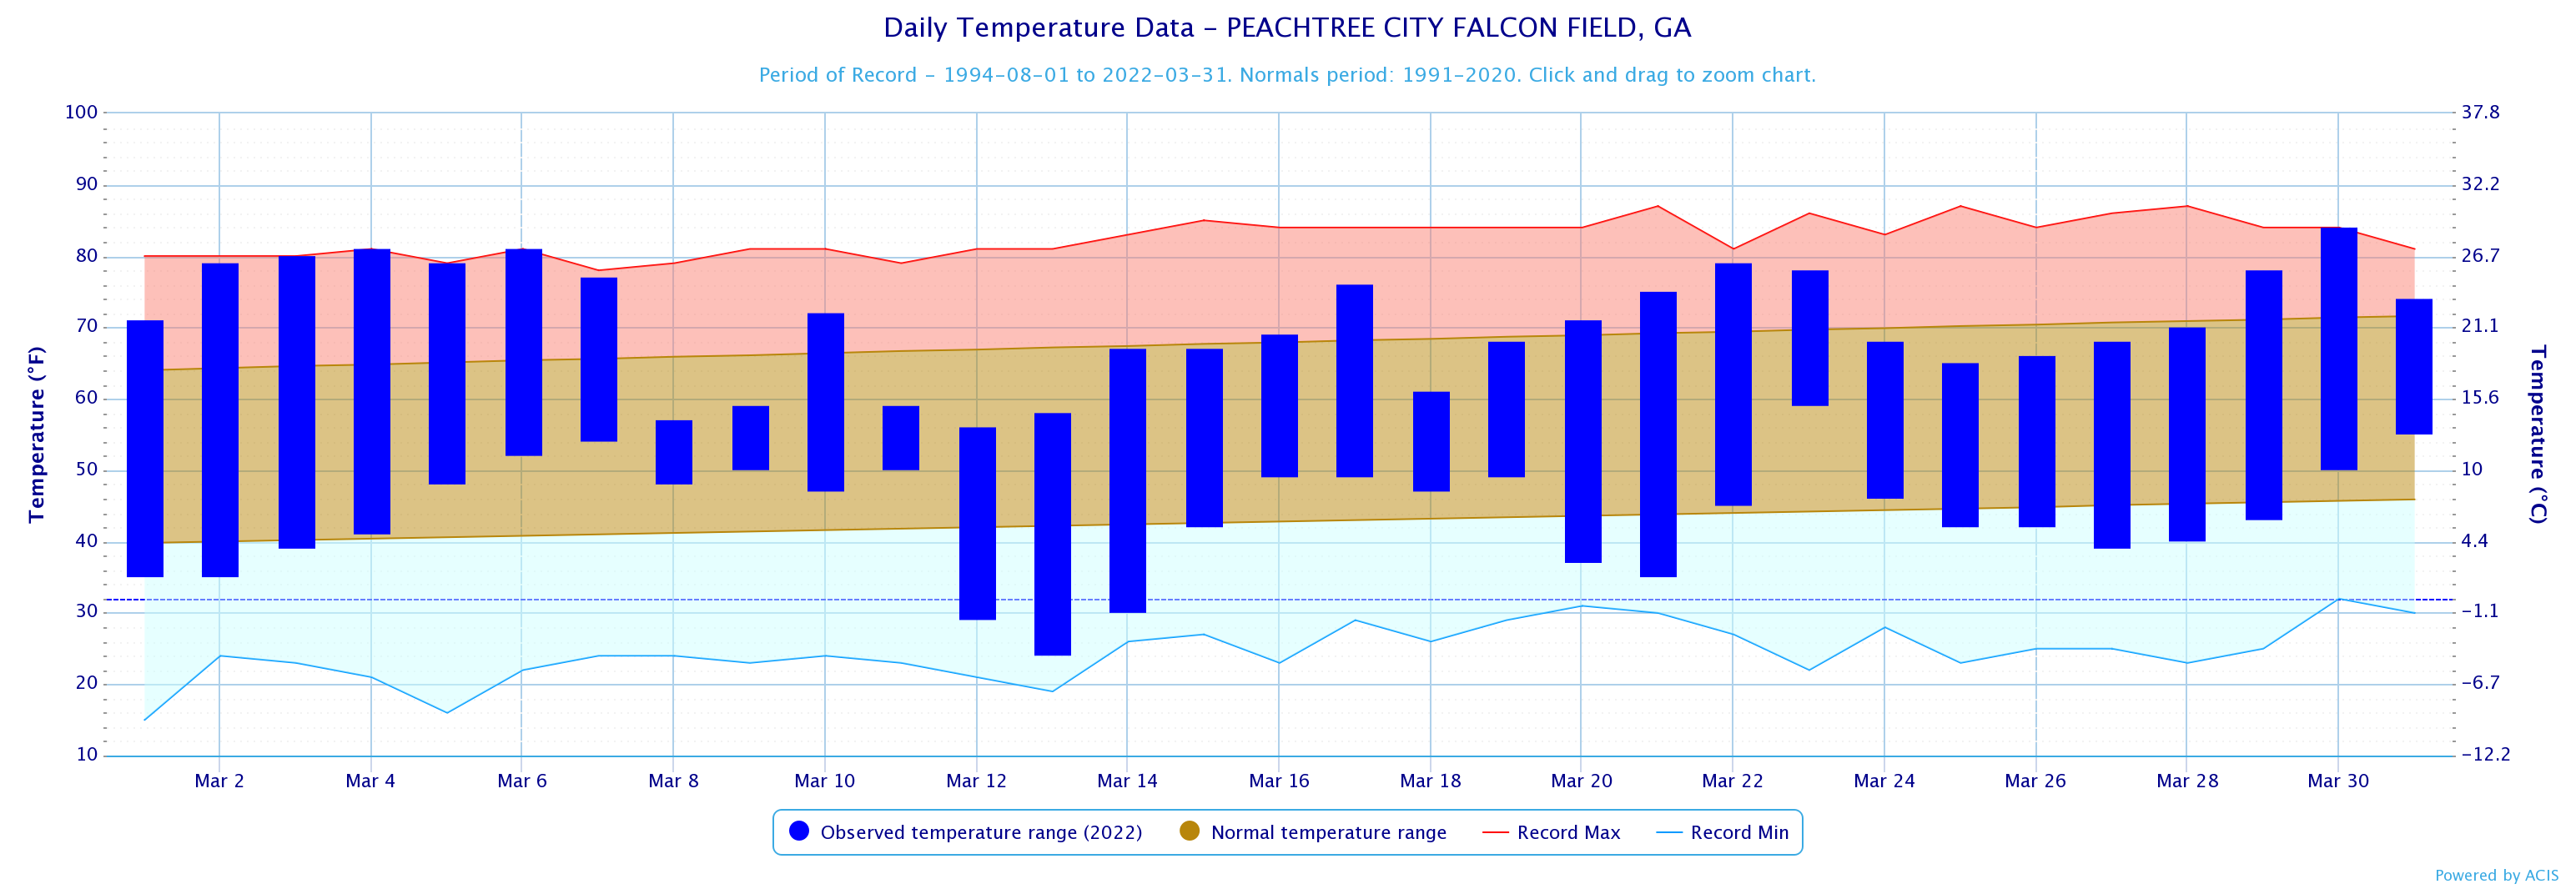
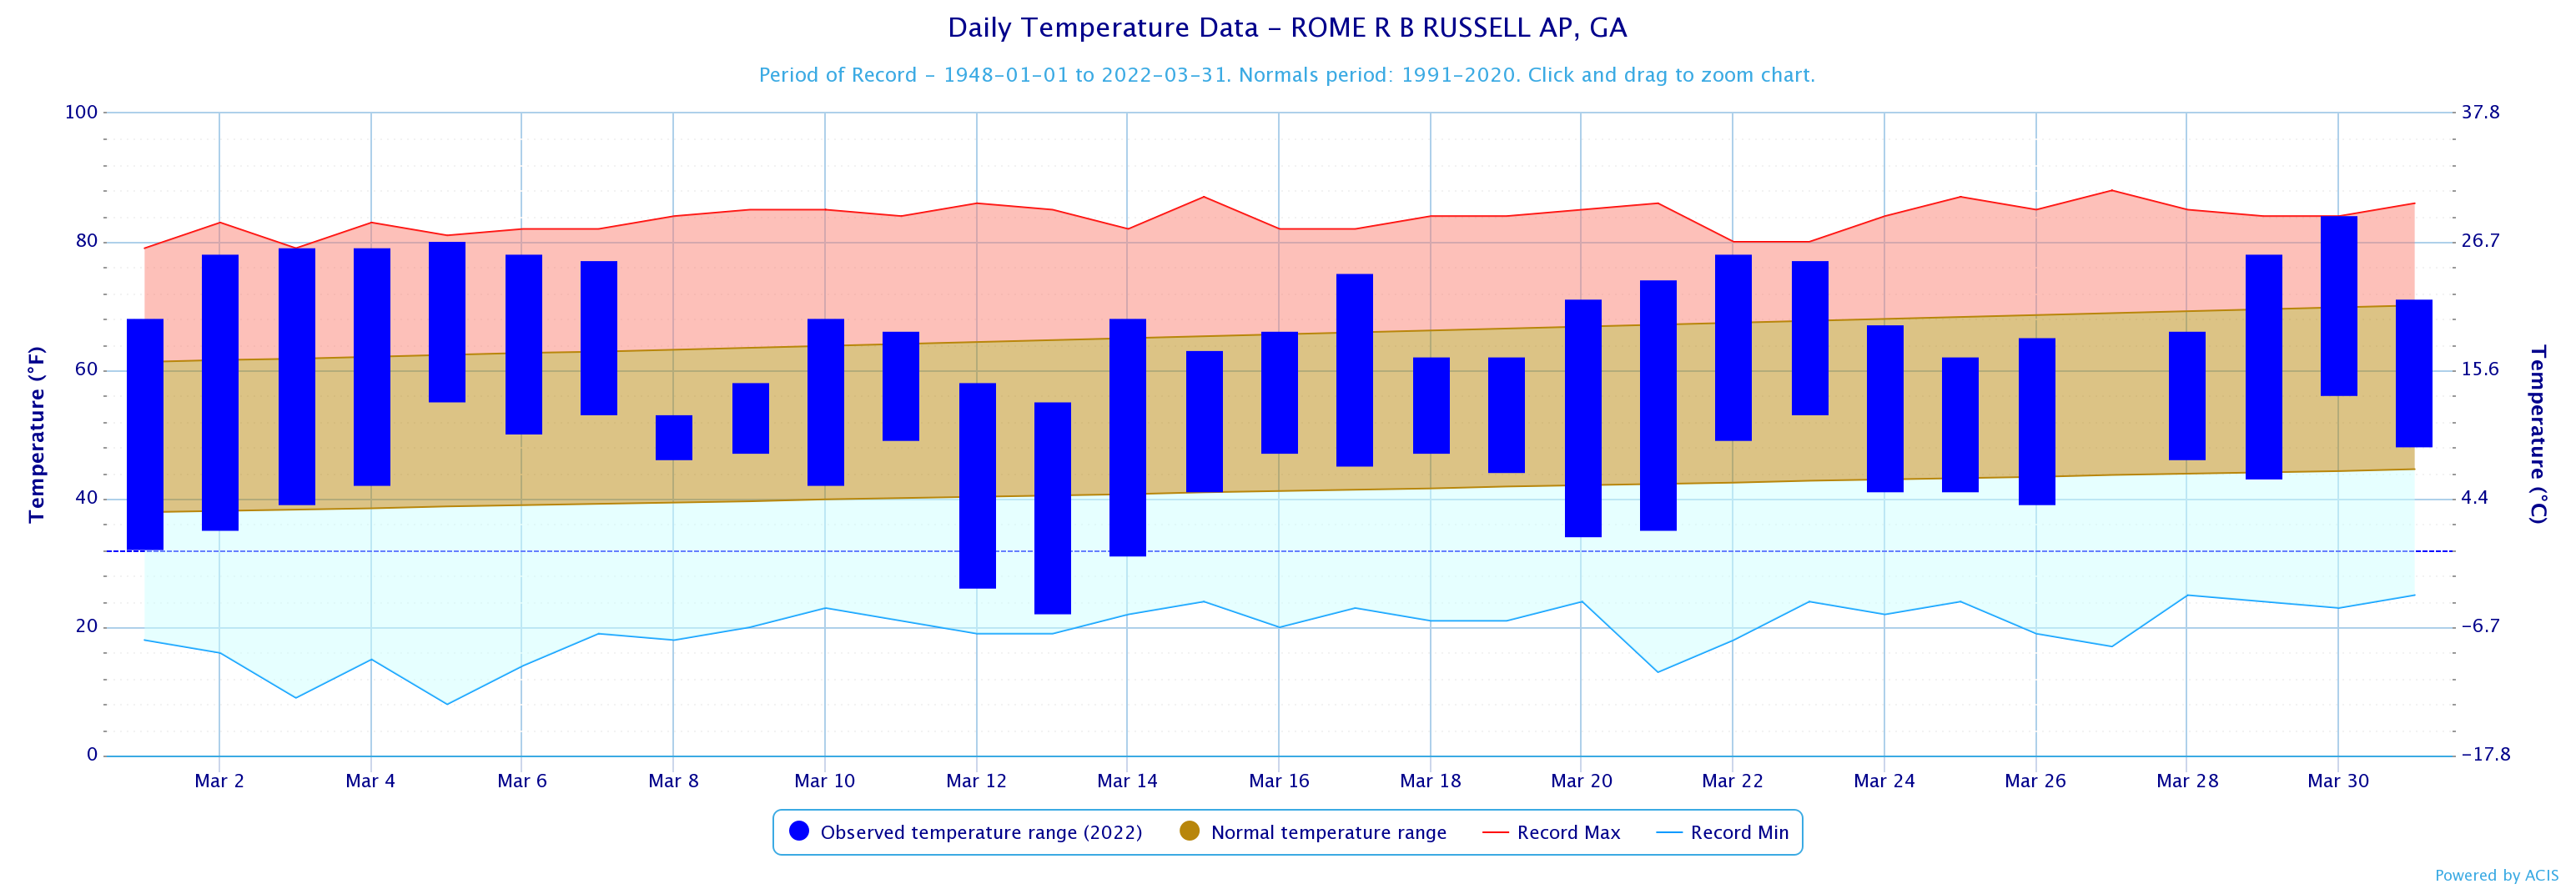
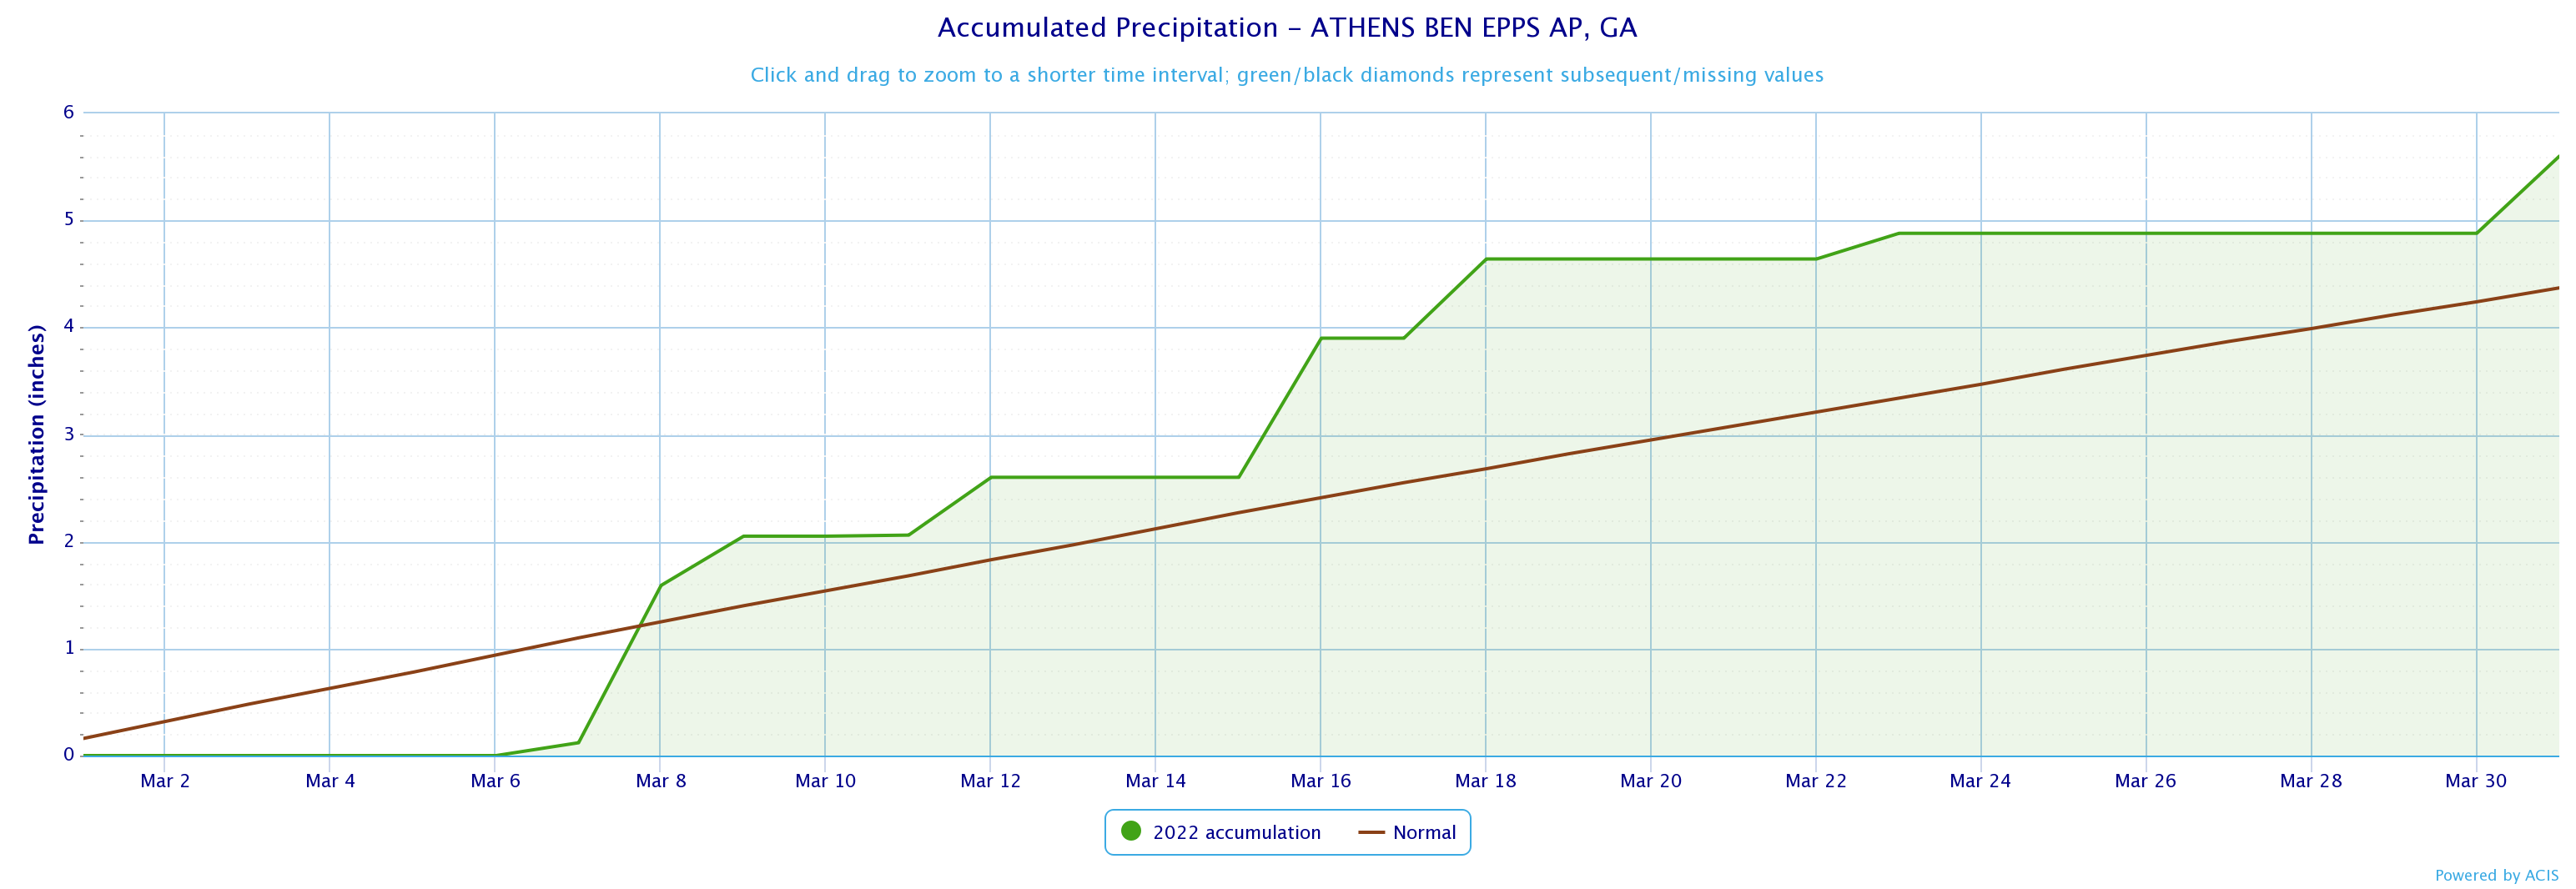
Temperatures through the month of March were 2 to 3 degrees above normal. Precipitation through the month of March was around 1 inch above normal.
|
March 2022 Climate Averages
|
|||
|
Climate Site
|
March Temp (°F)
|
Average Temp
|
Departure from normal
|
|
50.7
|
48.6
|
2.1
|
|
|
58.1
|
55.6
|
2.5
|
|
|
60.3
|
58.9
|
1.4
|
|
|
60.2
|
57.7
|
2.5
|
|
|
55.7
|
52.5
|
3.2
|
|
|
55.2
|
53.3
|
1.9
|
|
|
56.3
|
54.4
|
1.9
|
|
|
55.9
|
52.9
|
3.0
|
|
|
57.2
|
55.3
|
1.9
|
|
|
56.1
|
53.4
|
2.7
|
|
|
March 2022 Temperature Climate Statistics
|
||||
|
Climate Site |
Maximum Temperature |
Max T Date |
Minimum Temperature
|
Min T Date
|
|
Athens
|
84
|
3/30
|
23
|
3/13
|
|
Atlanta
|
83
|
3/30
|
25
|
3/13
|
|
Columbus
|
84
|
3/30
|
25*
|
3/13
|
|
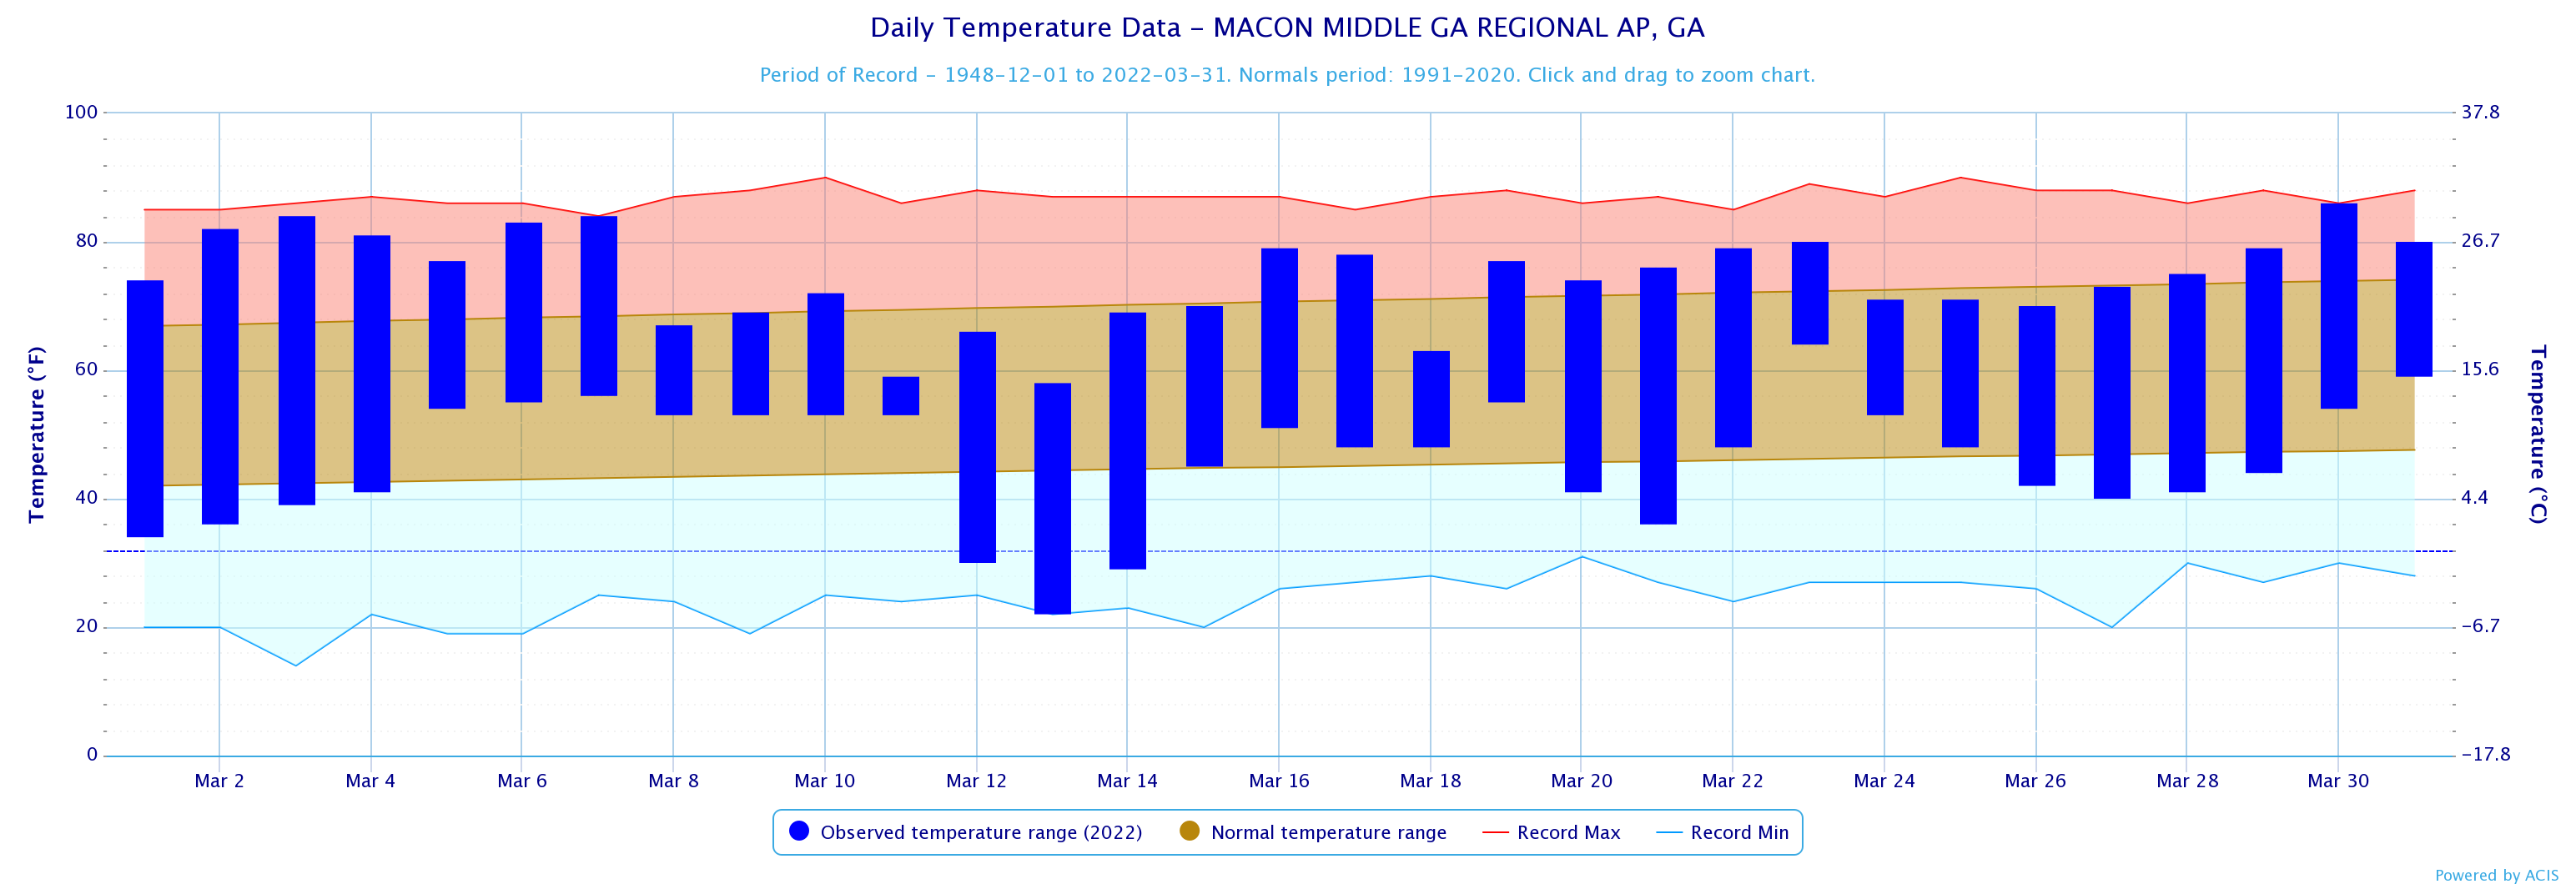
Macon
|
86
|
3/30
|
22*
|
3/13
|
|
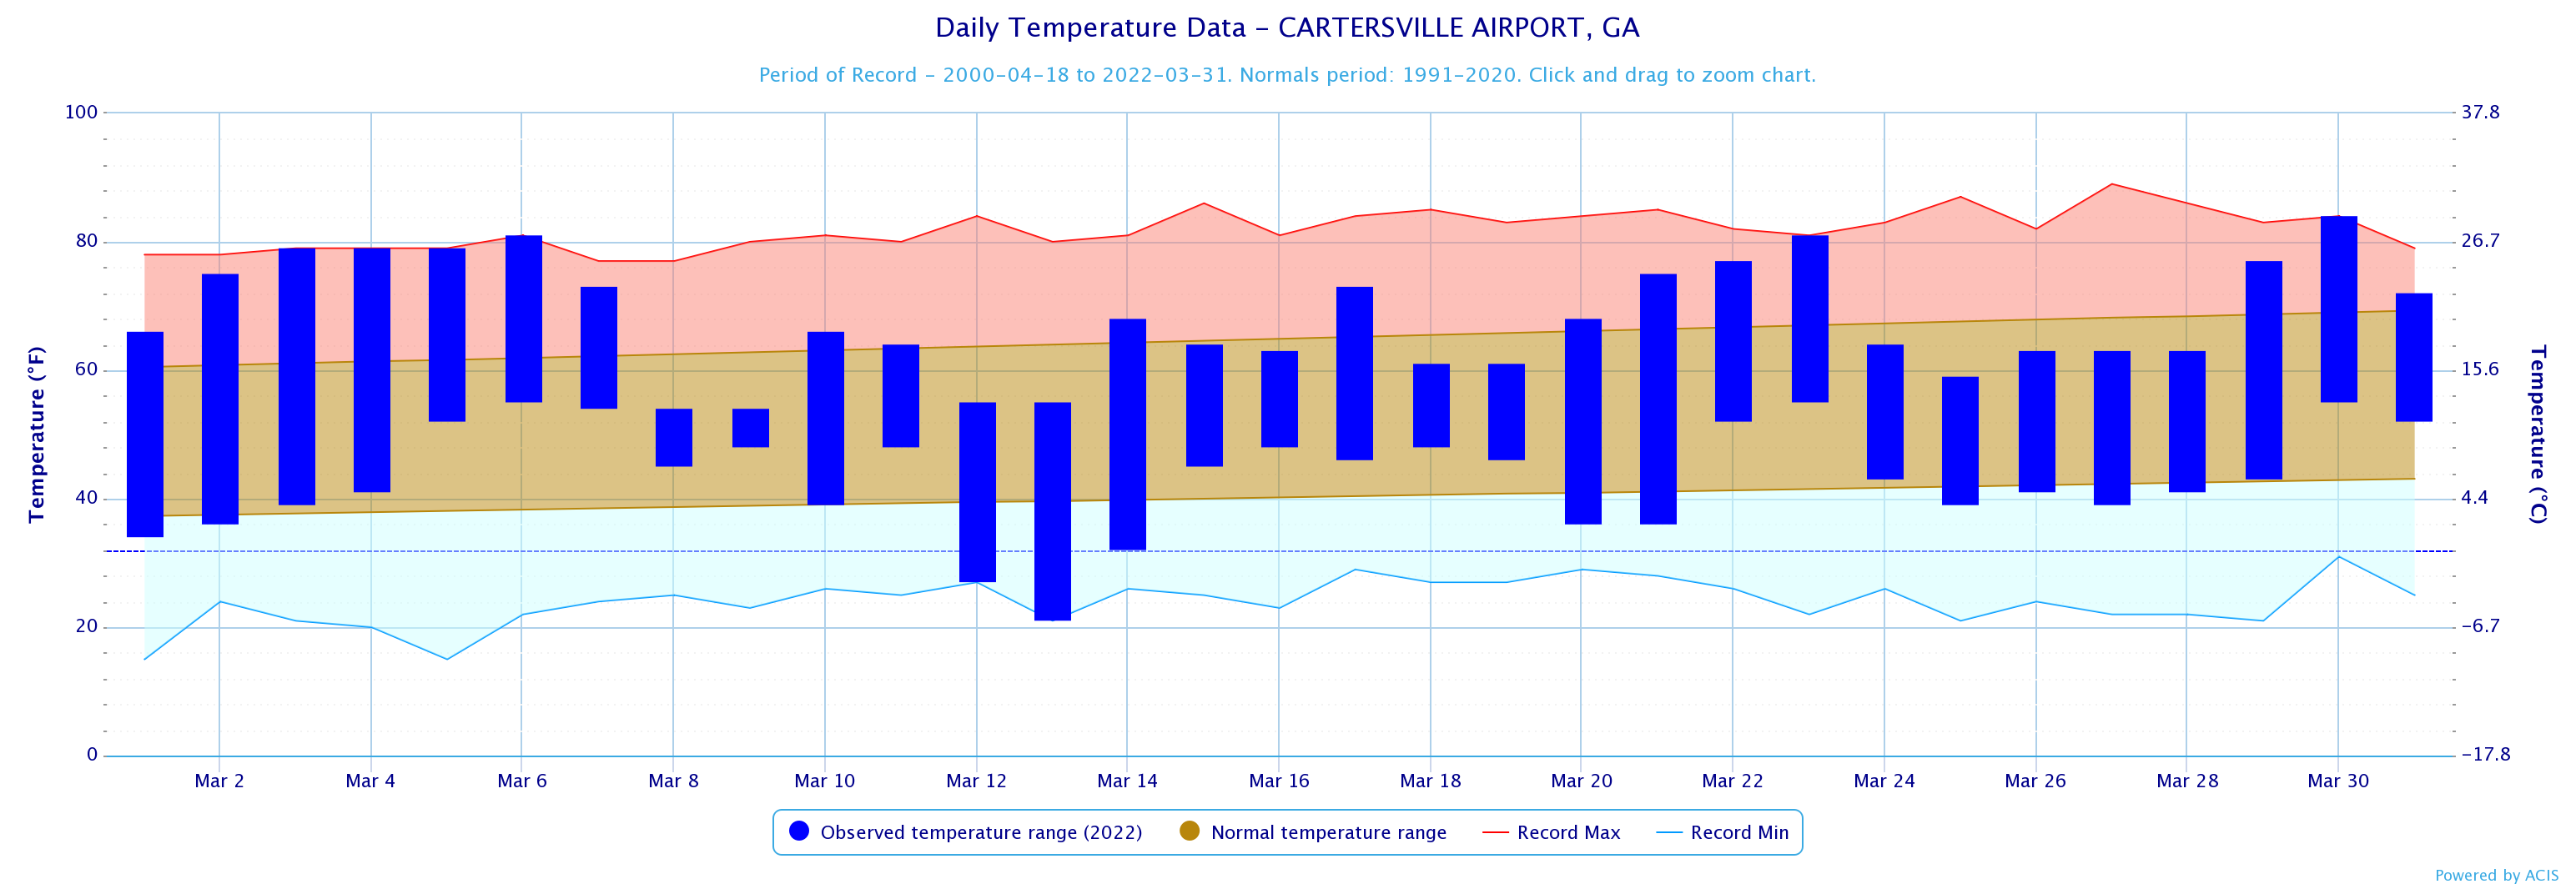
Cartersville
|
84
|
3/30
|
21
|
3/13
|
|
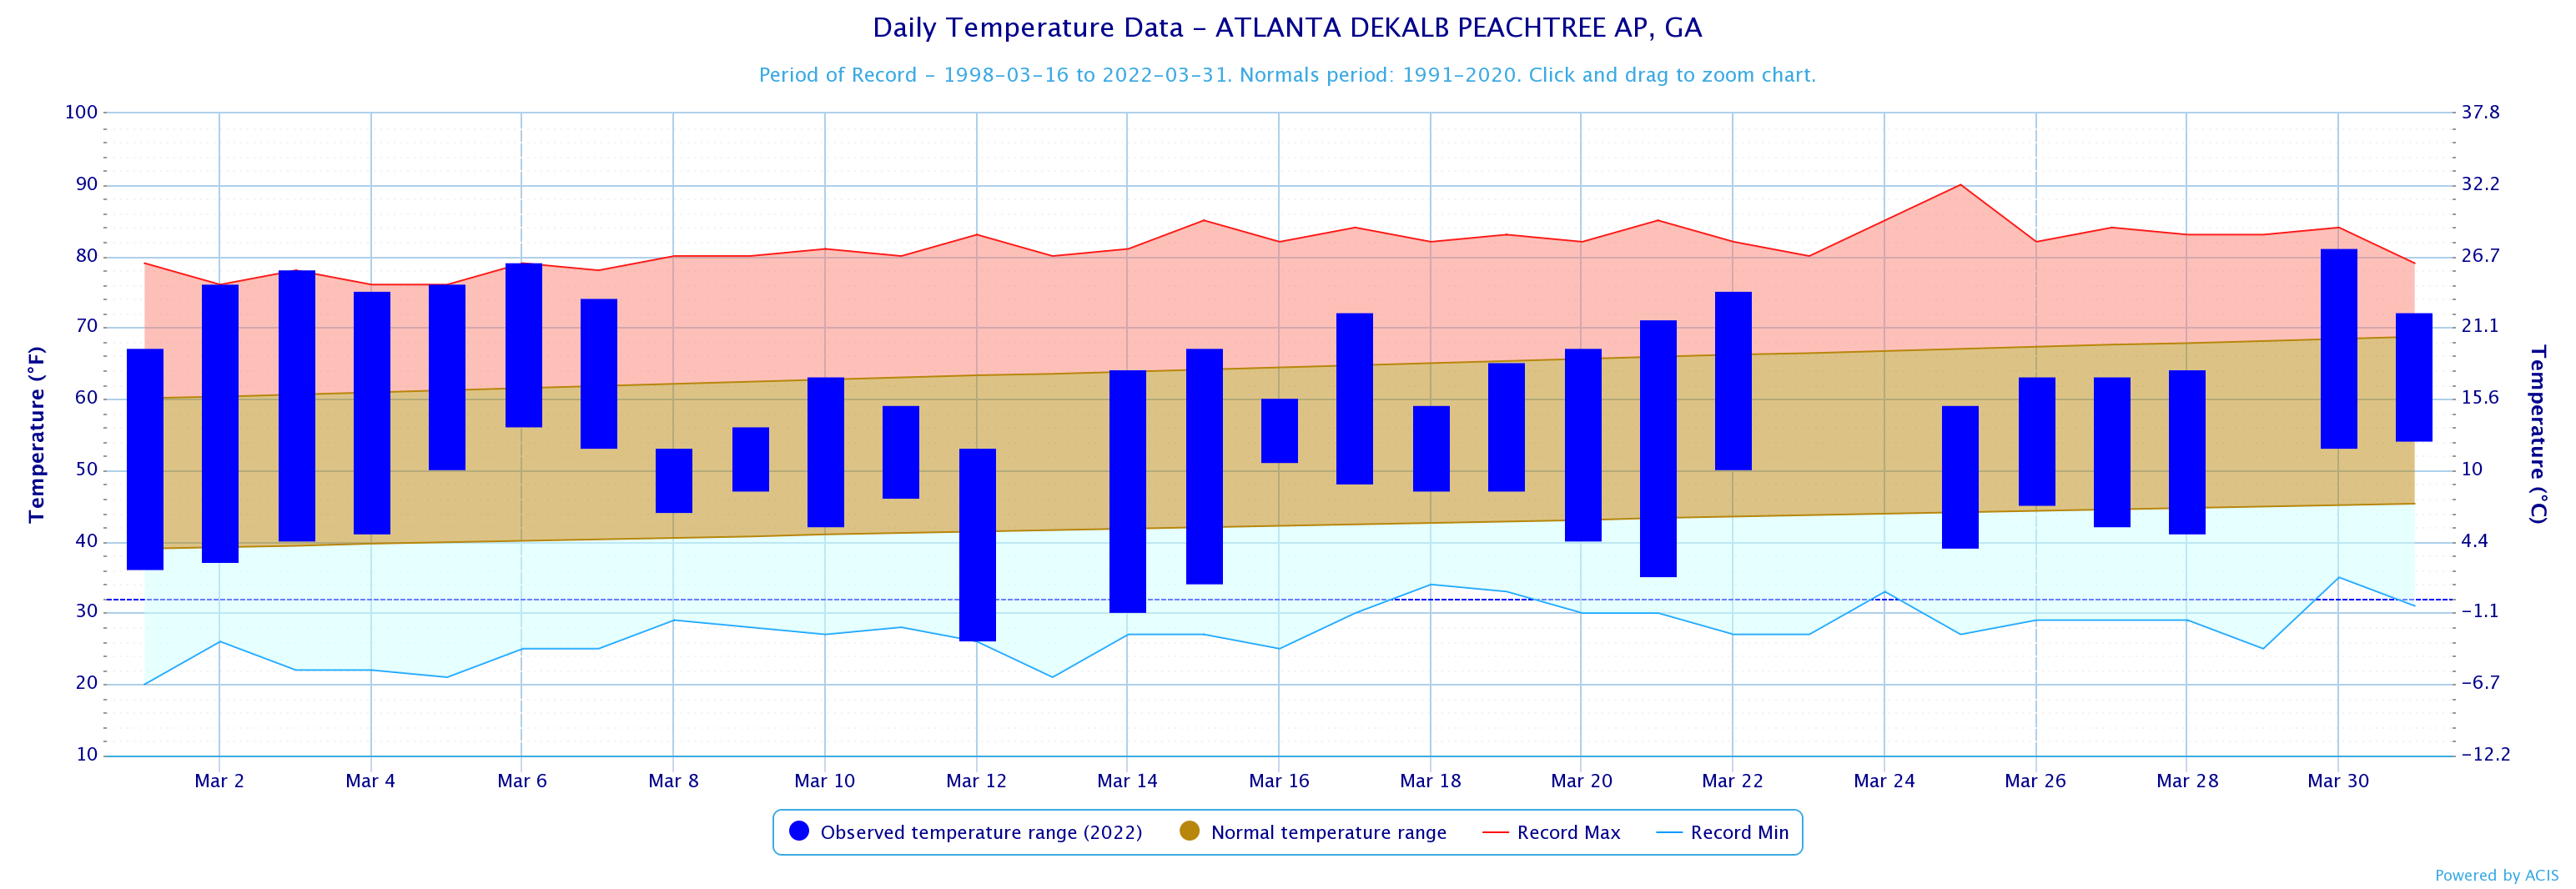
Dekalb Peachtree Arpt
|
81
|
3/30
|
21
|
3/13
|
|
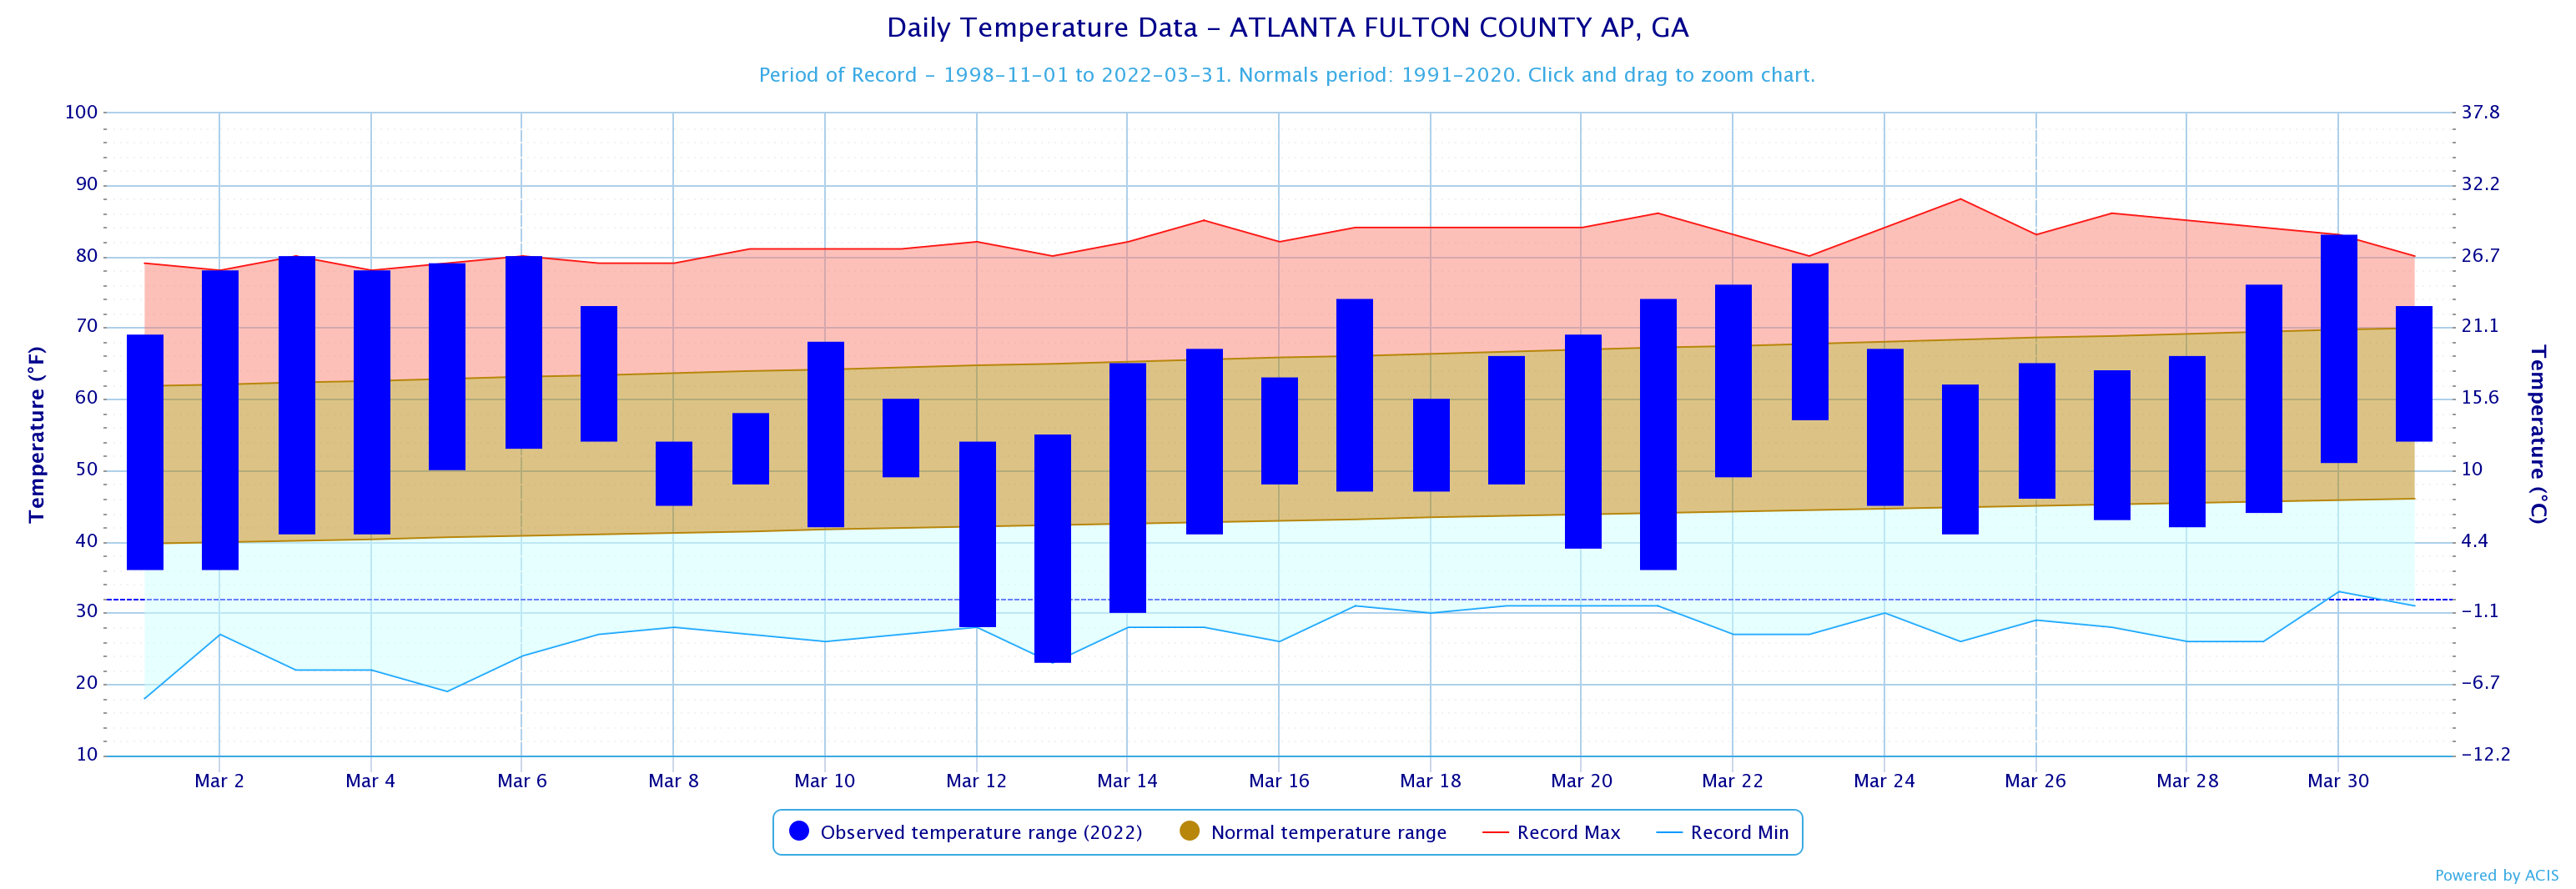
Fulton Co Arpt
|
83
|
3/30
|
23
|
3/13
|
|
Gainesville
|
78
|
3/30
|
22
|
3/13
|
|
Peachtree City
|
84
|
3/30
|
24
|
3/13
|
|
Rome
|
84
|
3/30
|
22
|
3/13
|
*Indicates a daily record was set
|
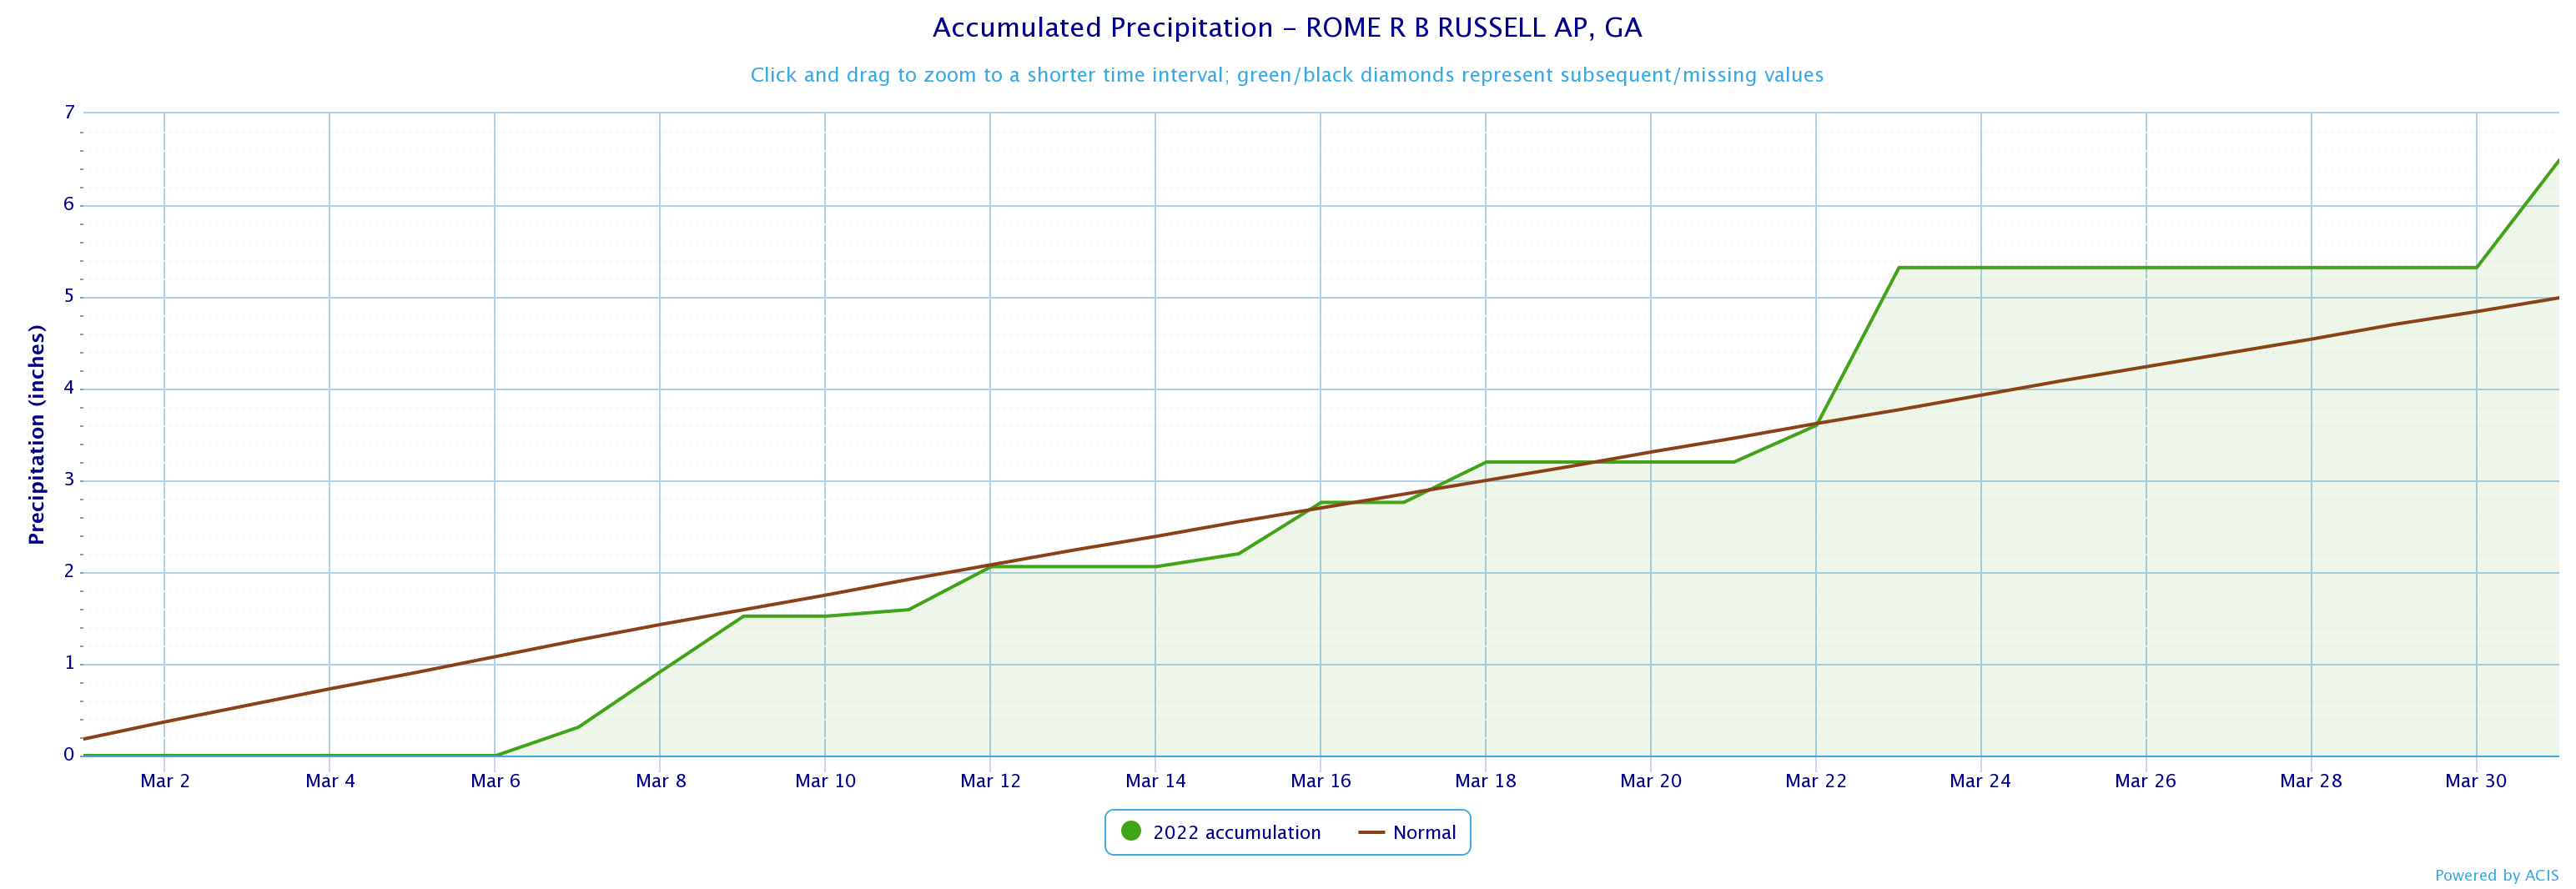
March 2022 Precipitation Climate Statistics
|
|||
|
Climate Site |
Total Precipitation |
Average Precipitation
|
DFN (Departure From Normal)
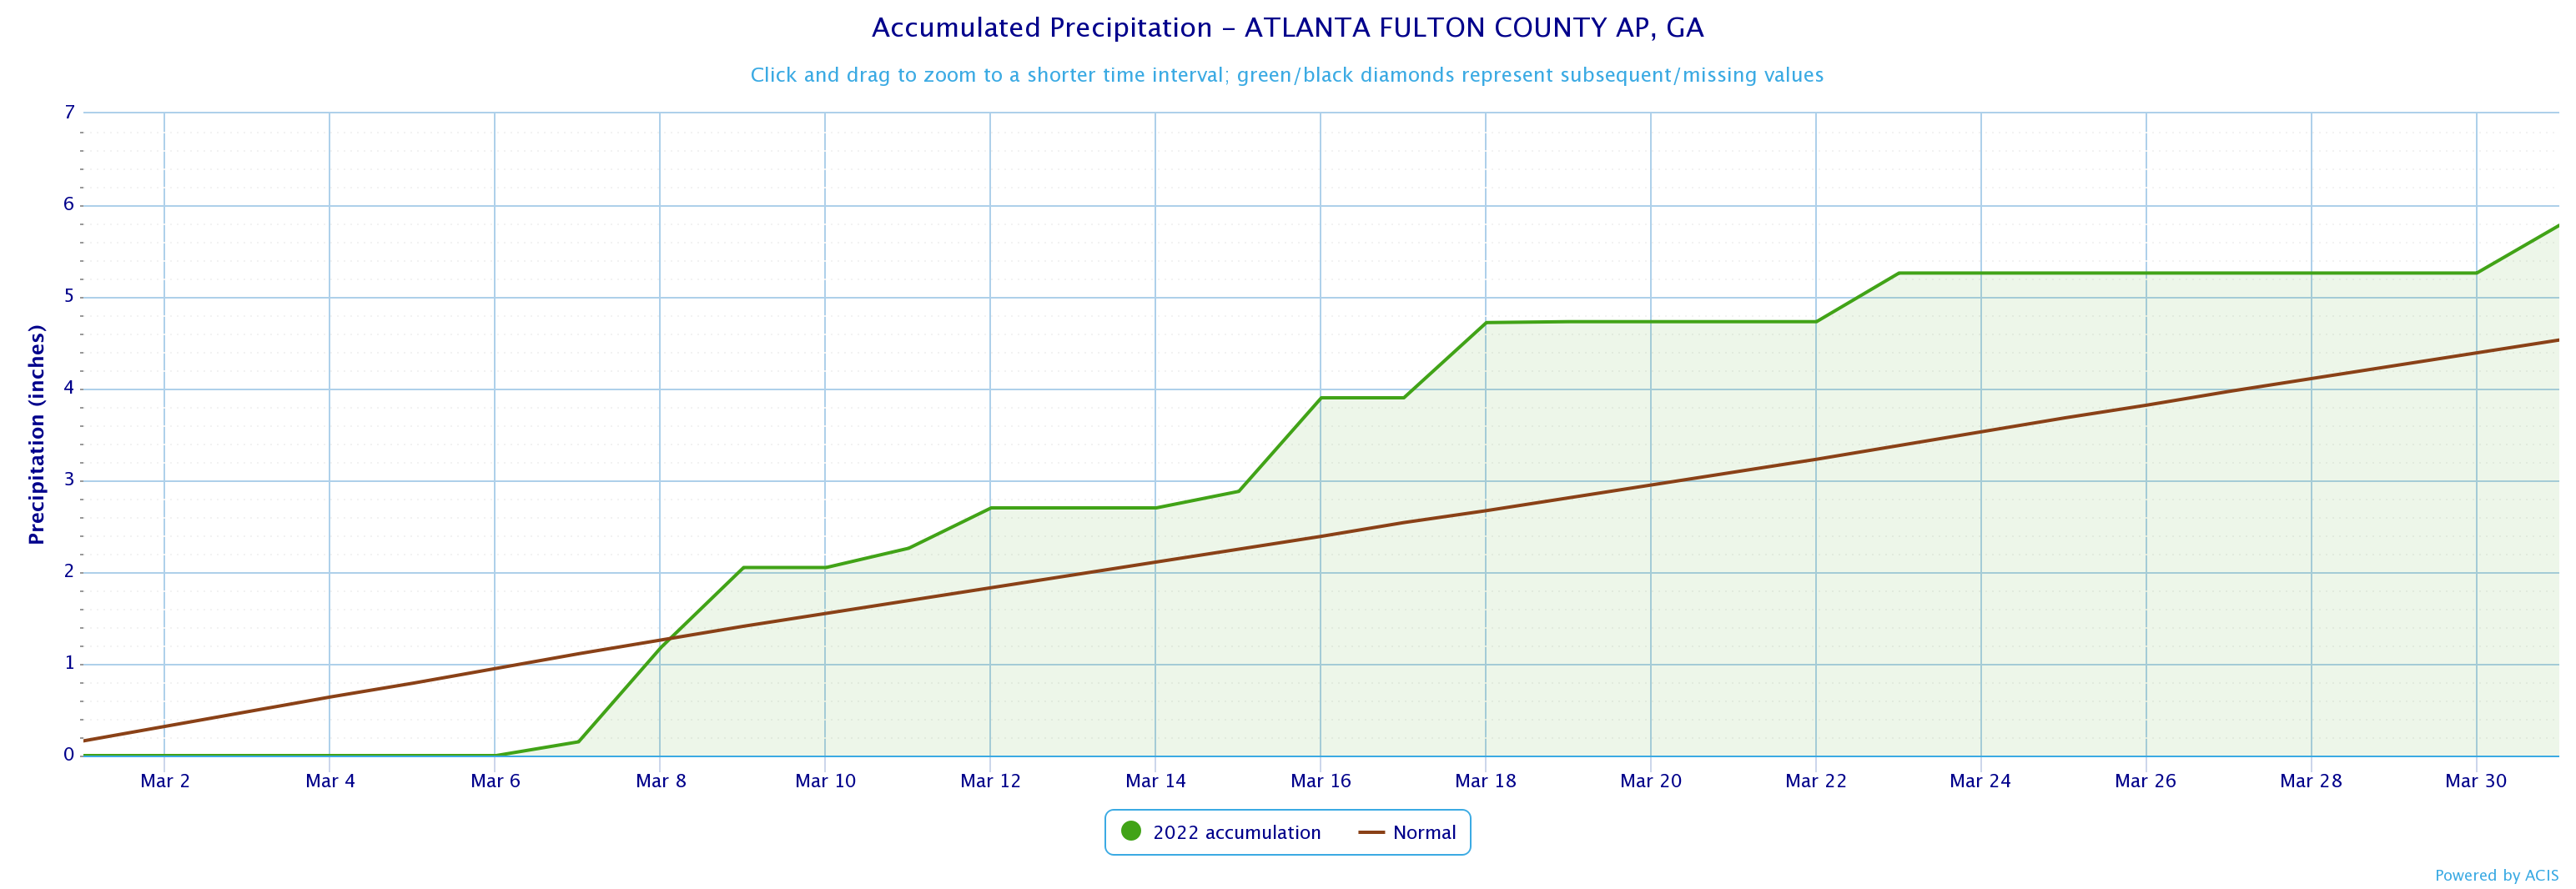
|
|
5.60
|
4.37
|
1.23
|
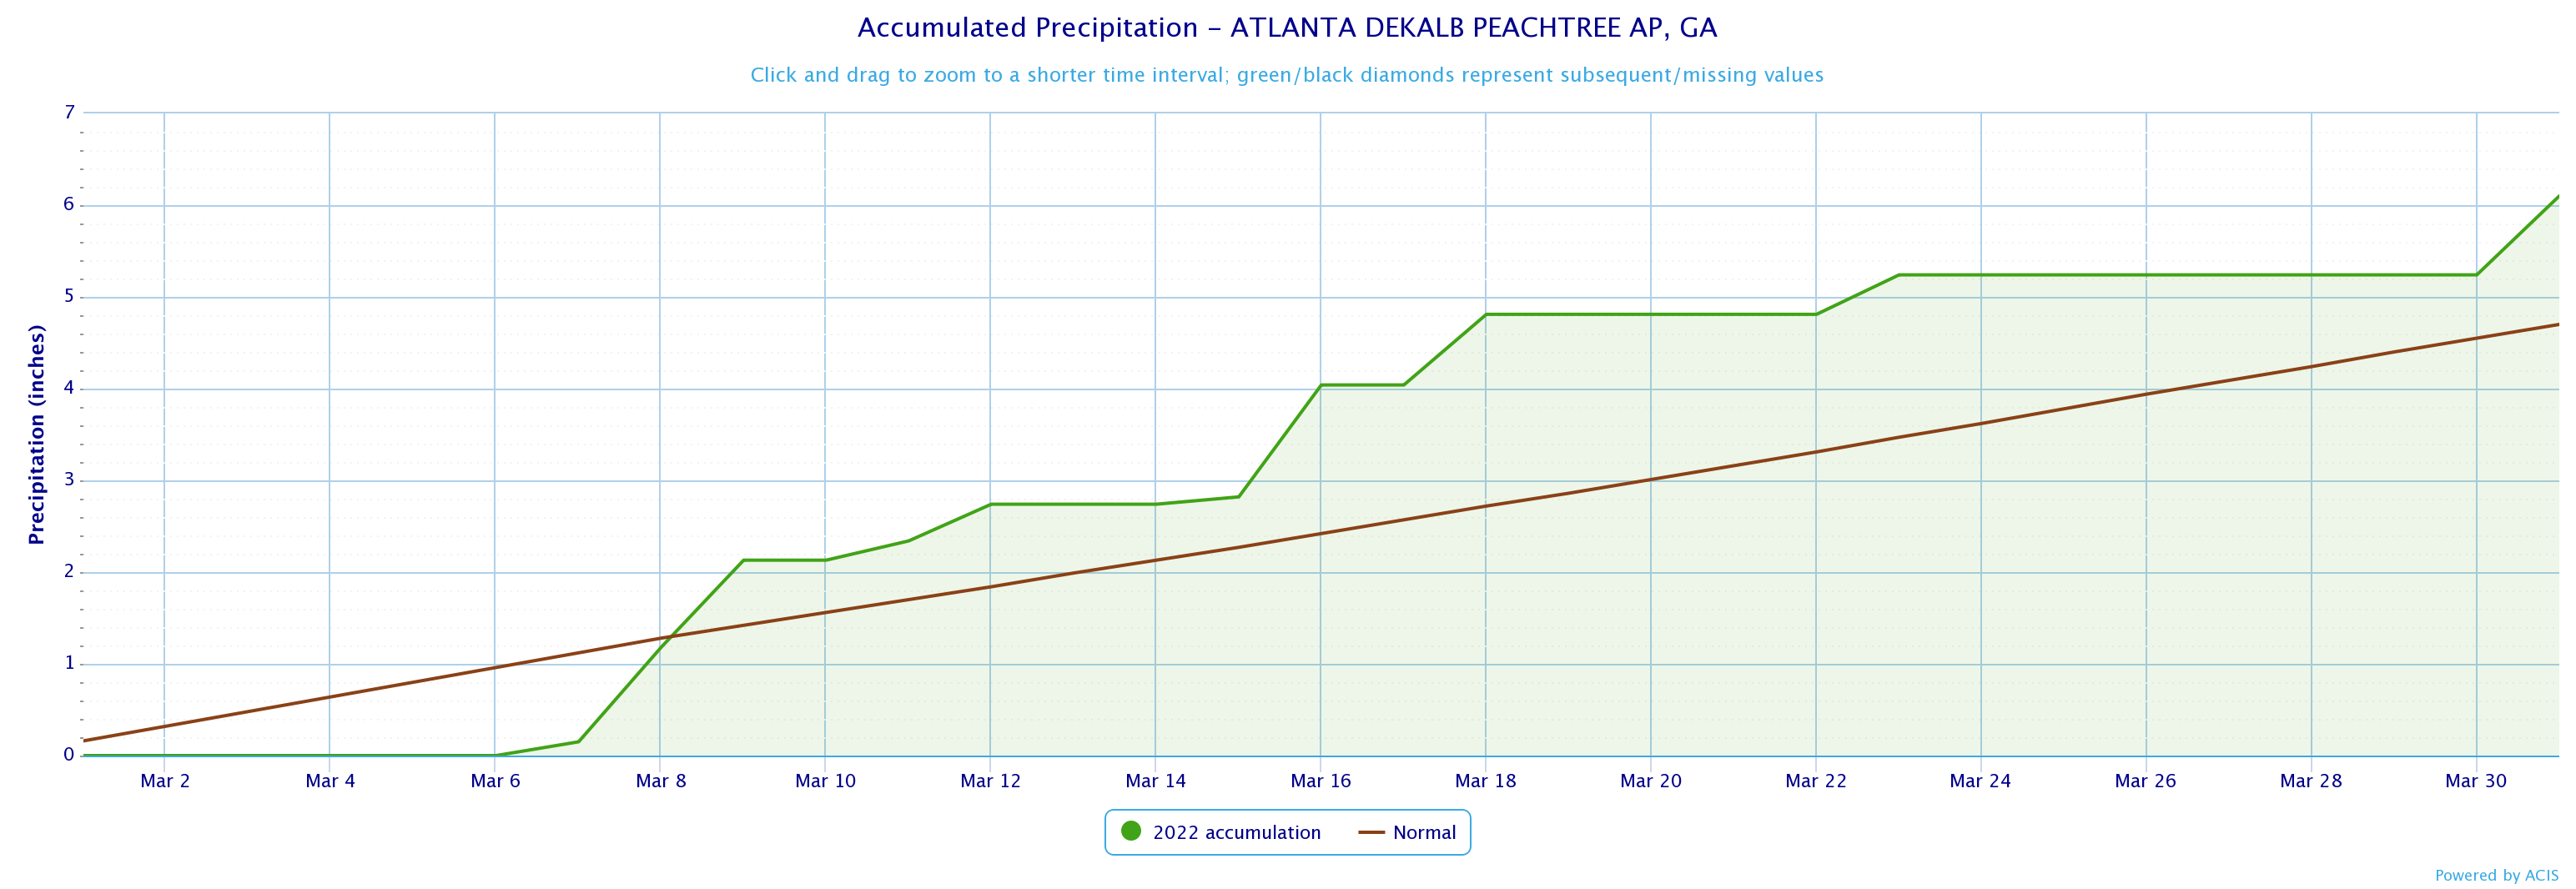
|
|
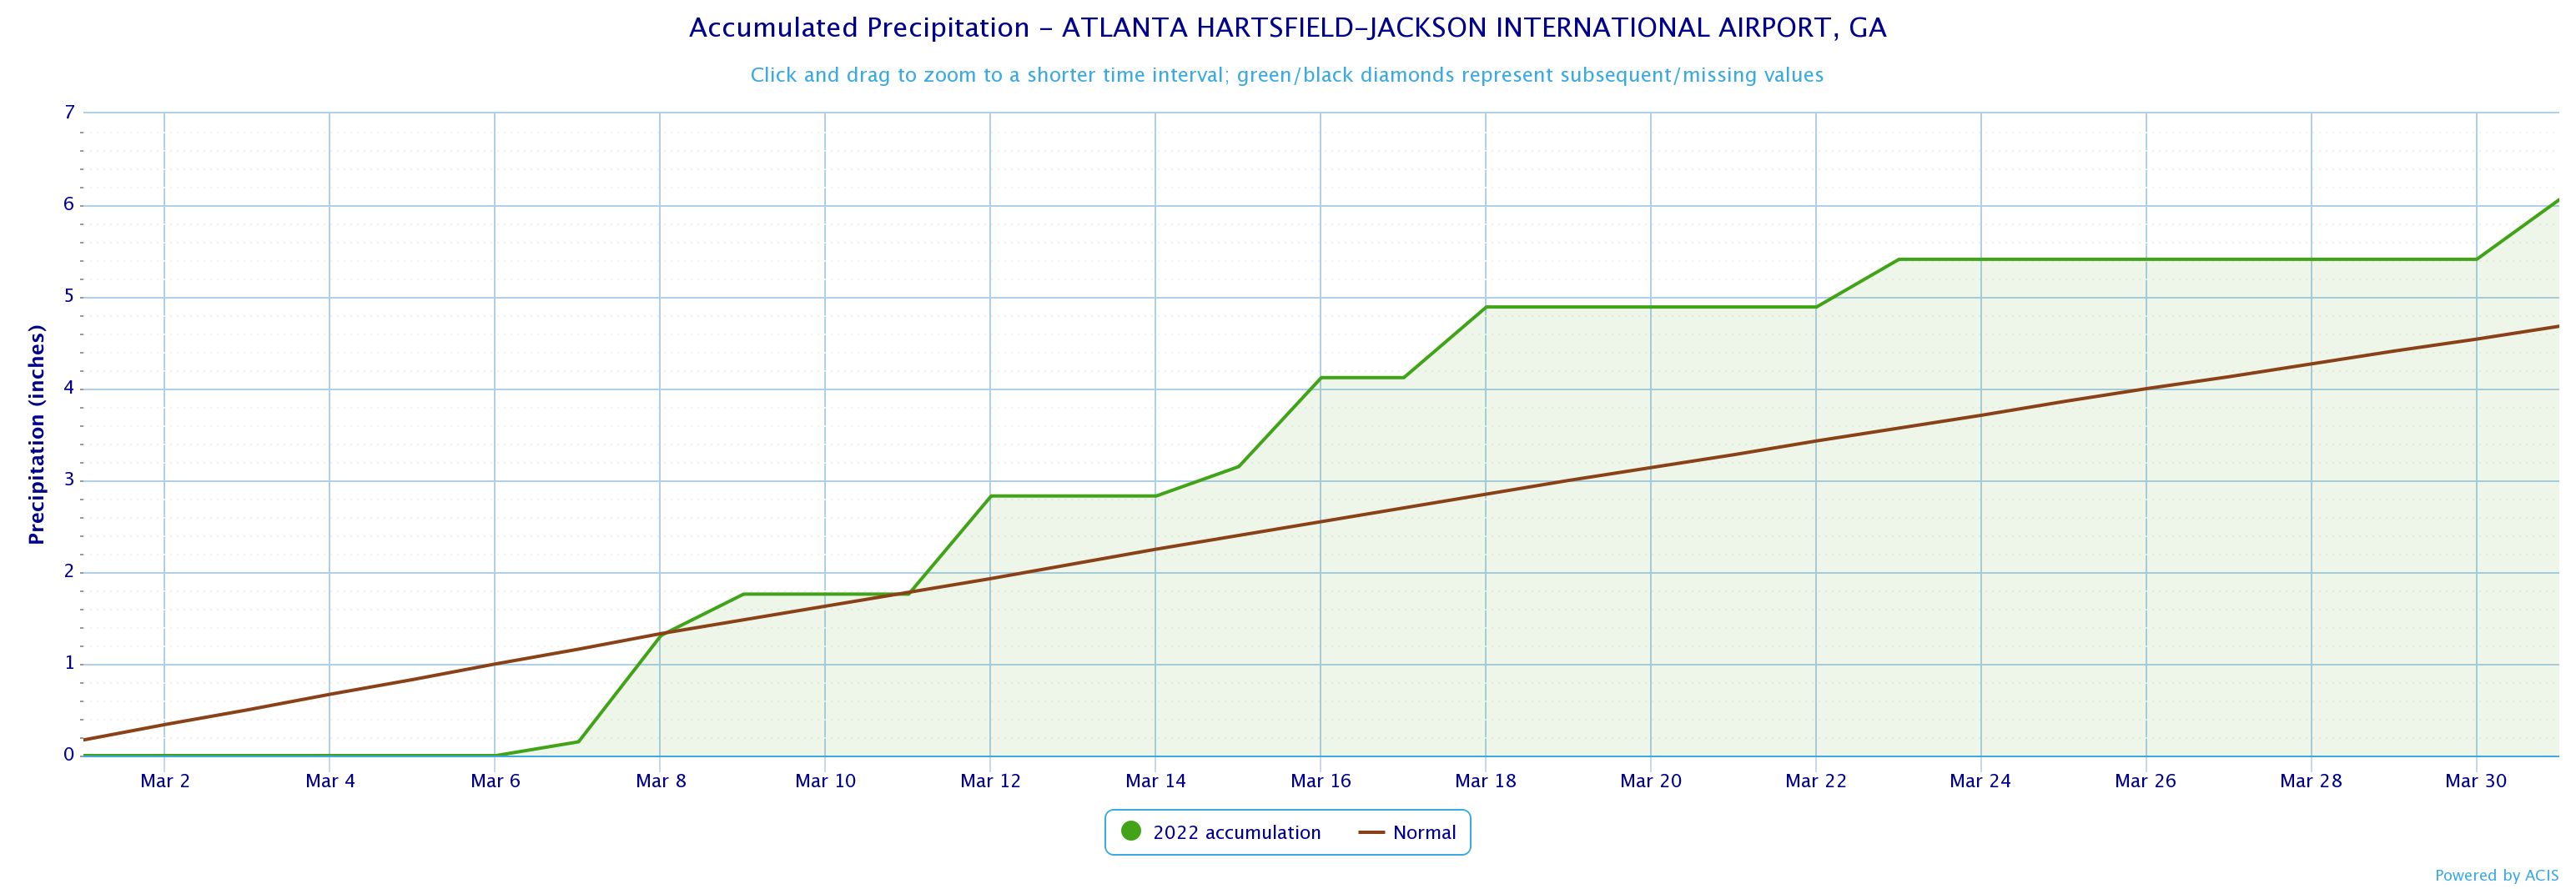
6.06
|
4.68
|
1.38
|
|
|
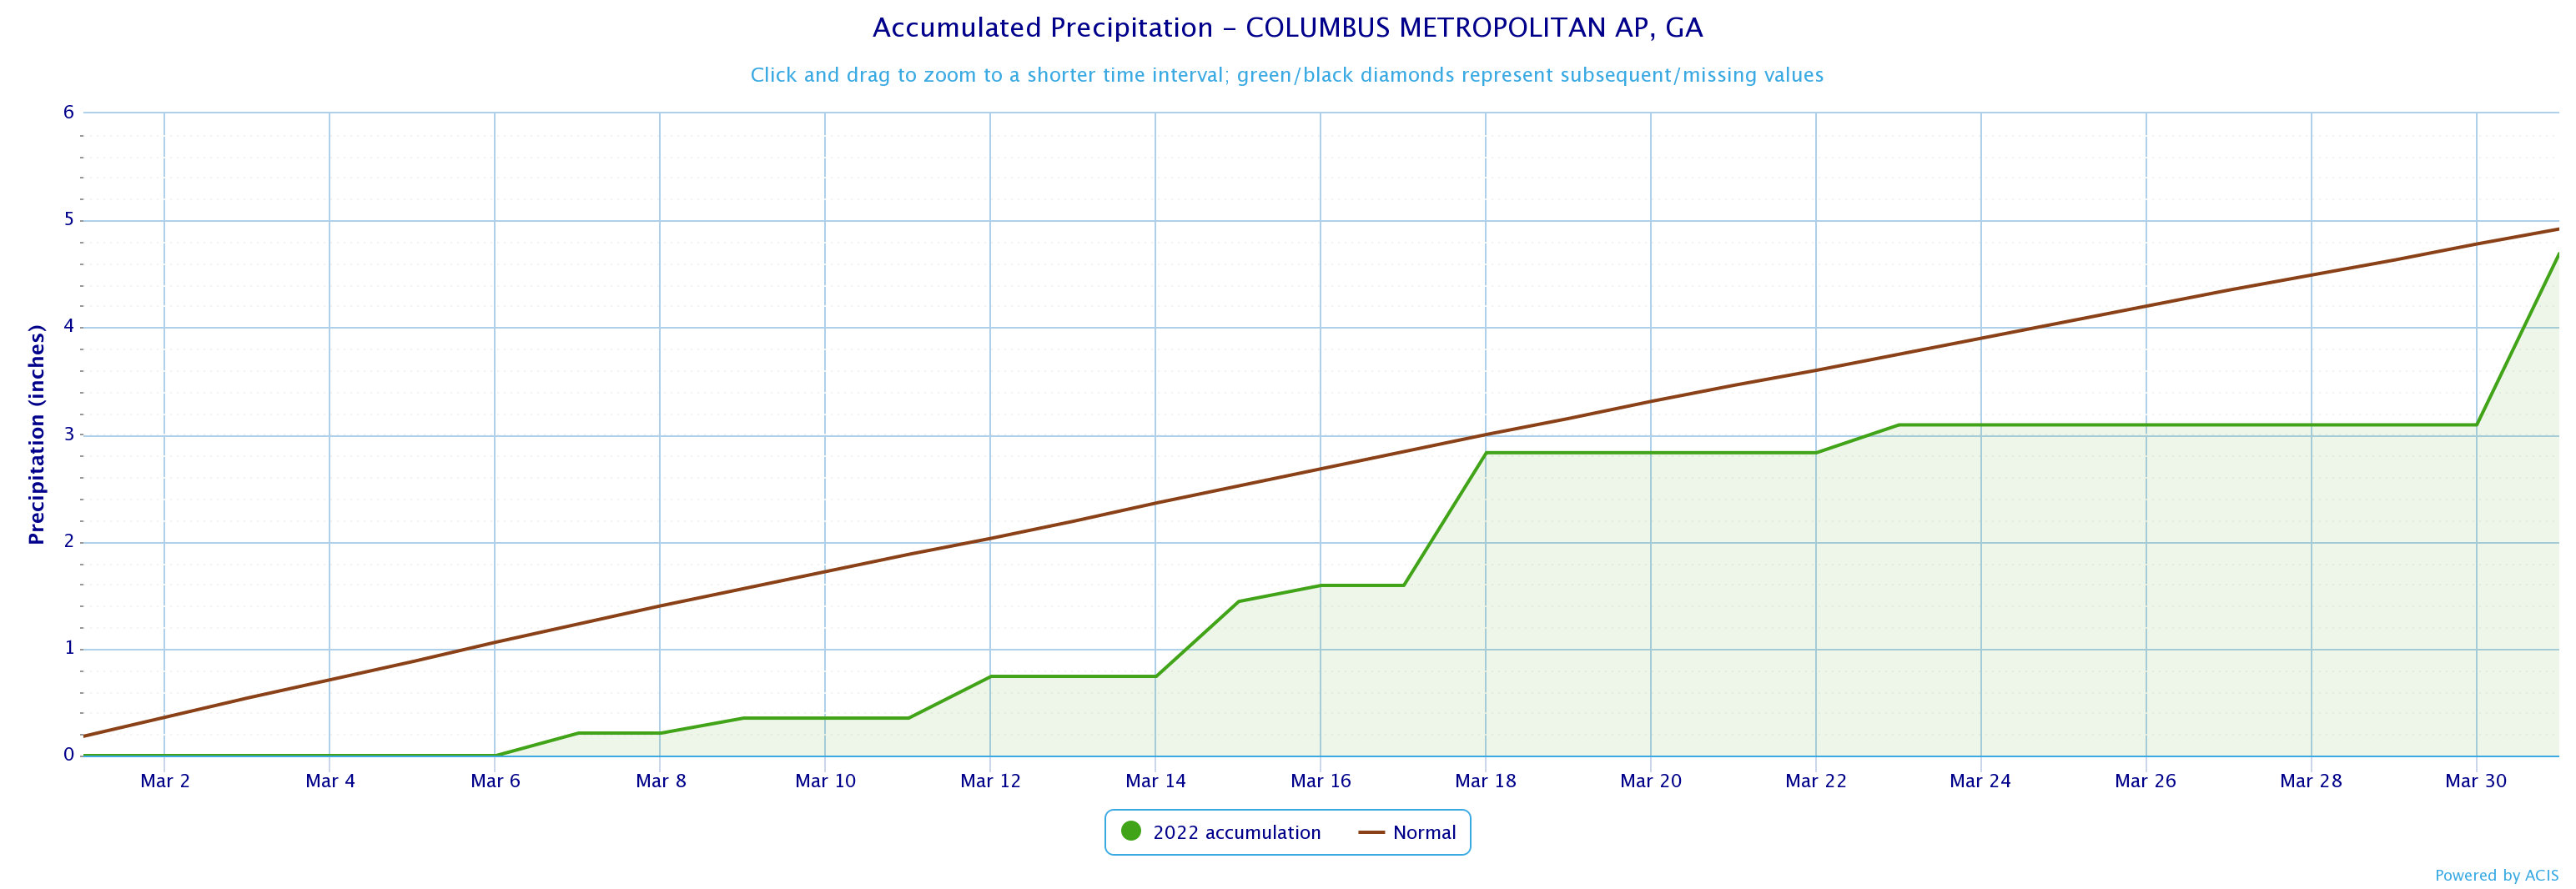
4.69
|
4.92
|
-0.23
|
|
|
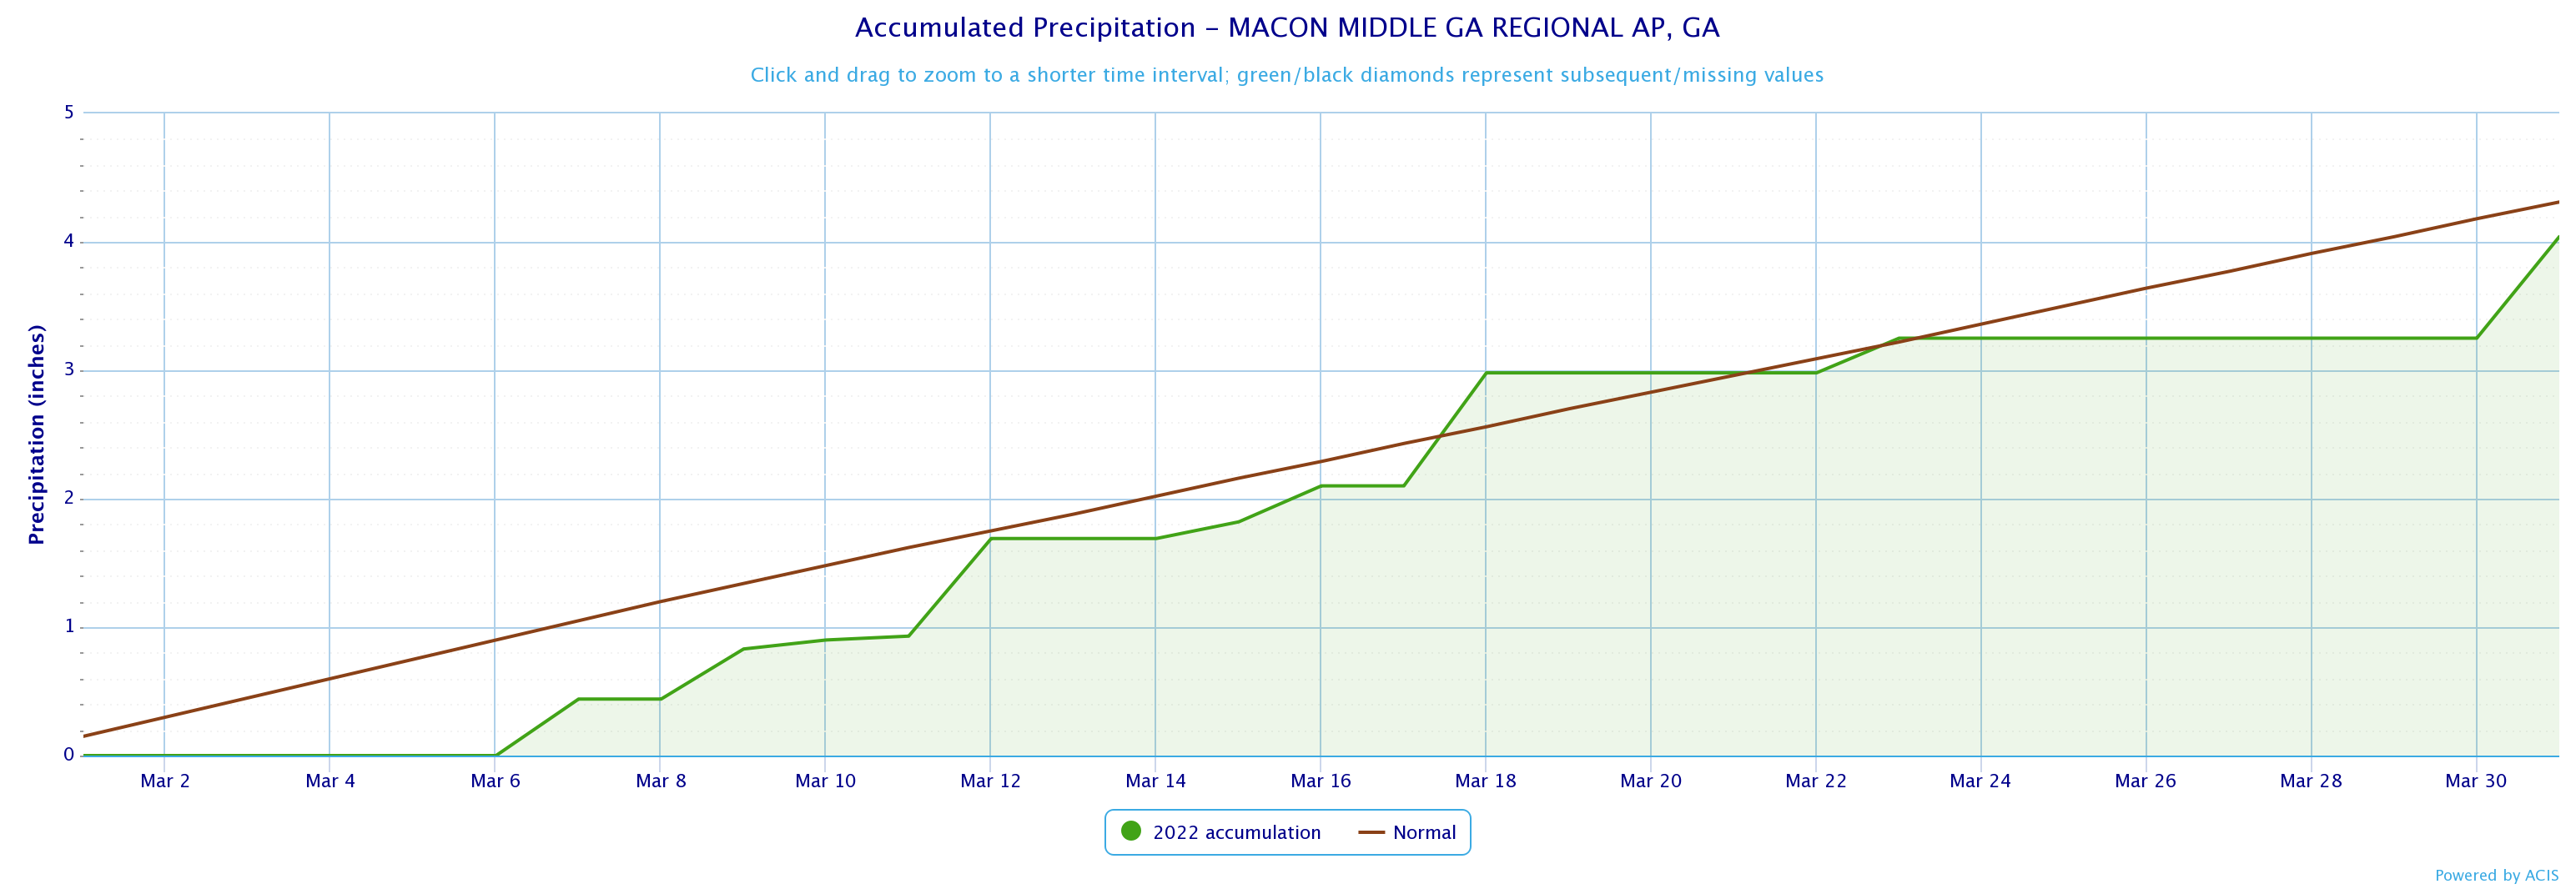
4.04
|
4.31
|
-0.27
|
|
|
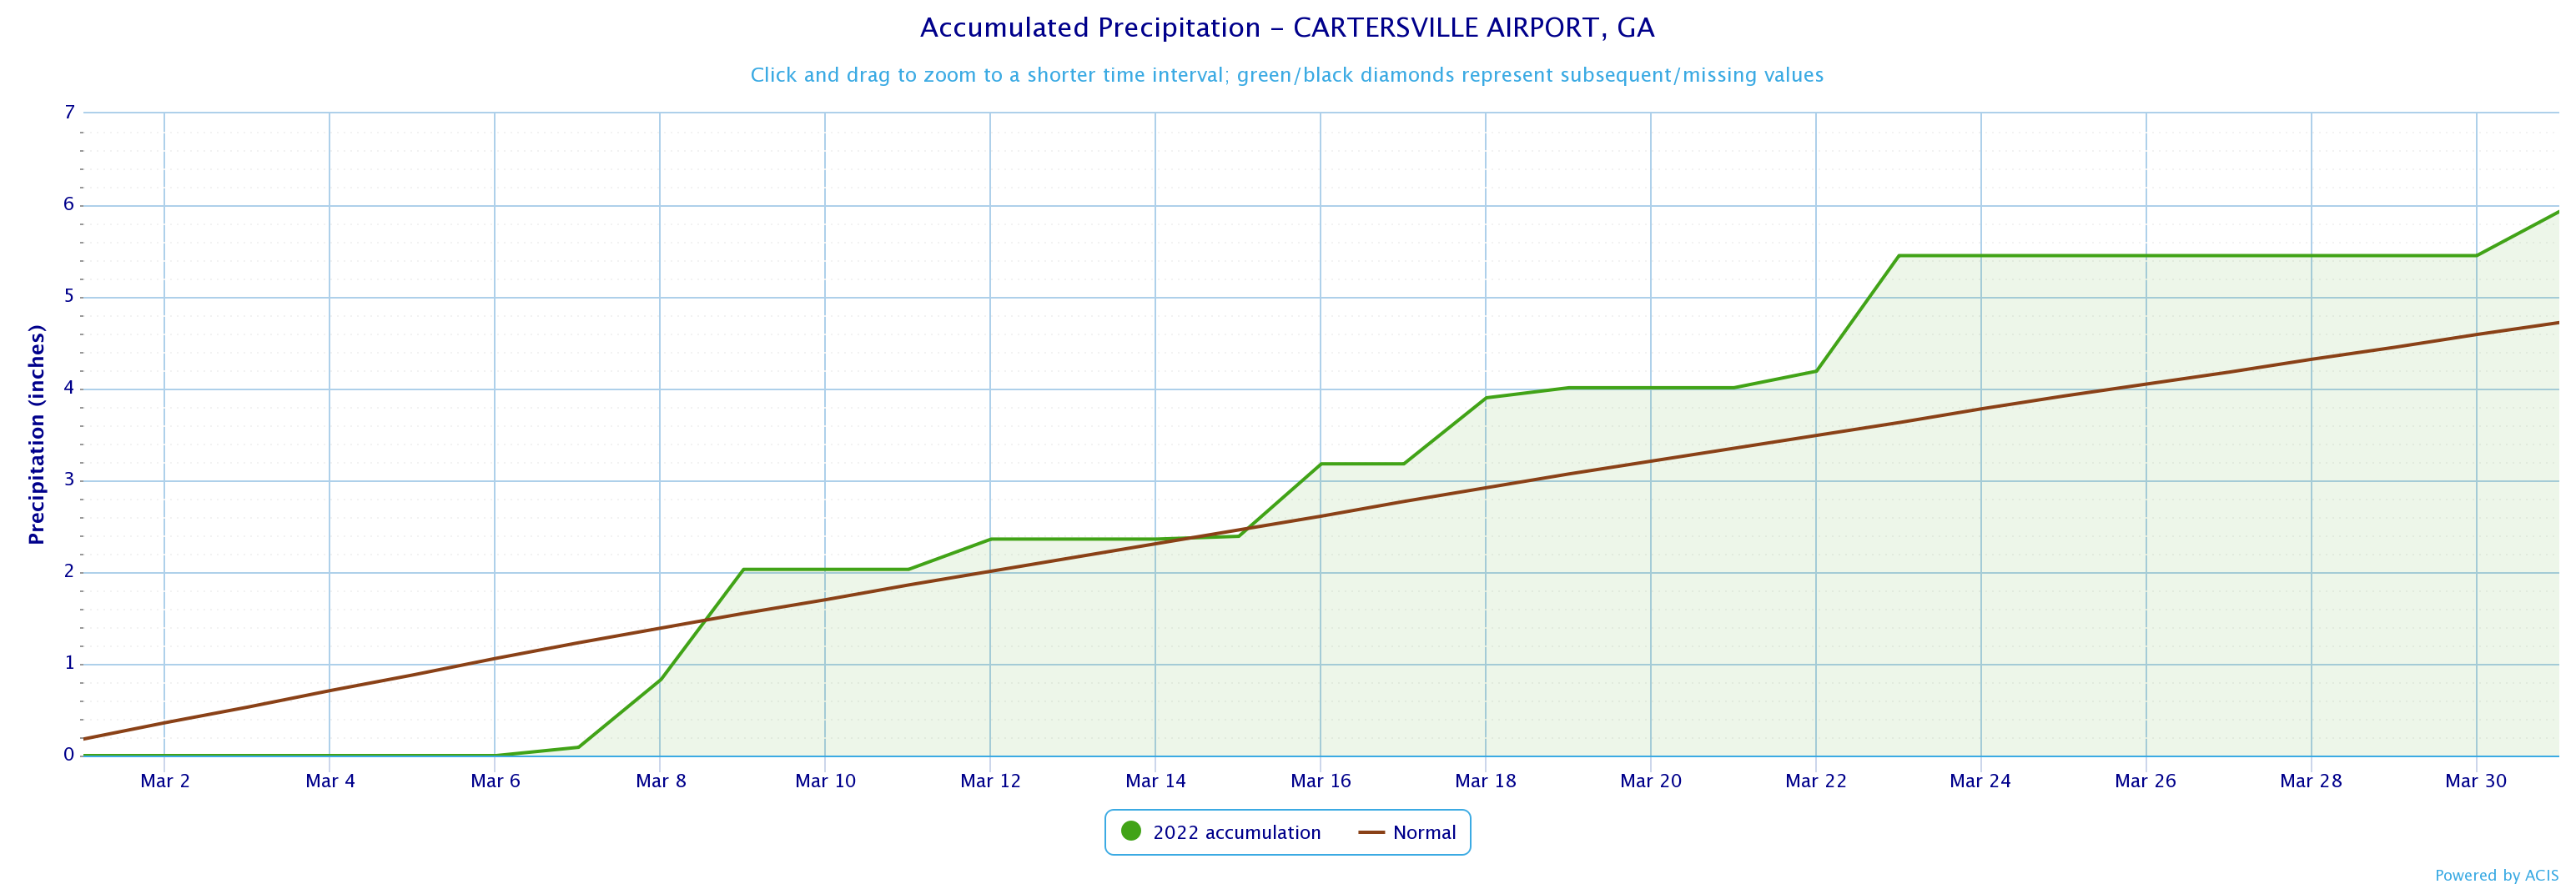
5.93
|
4.72
|
1.21
|
|
|
6.10
|
4.70
|
1.40
|
|
|
5.76
|
4.53
|
1.21
|
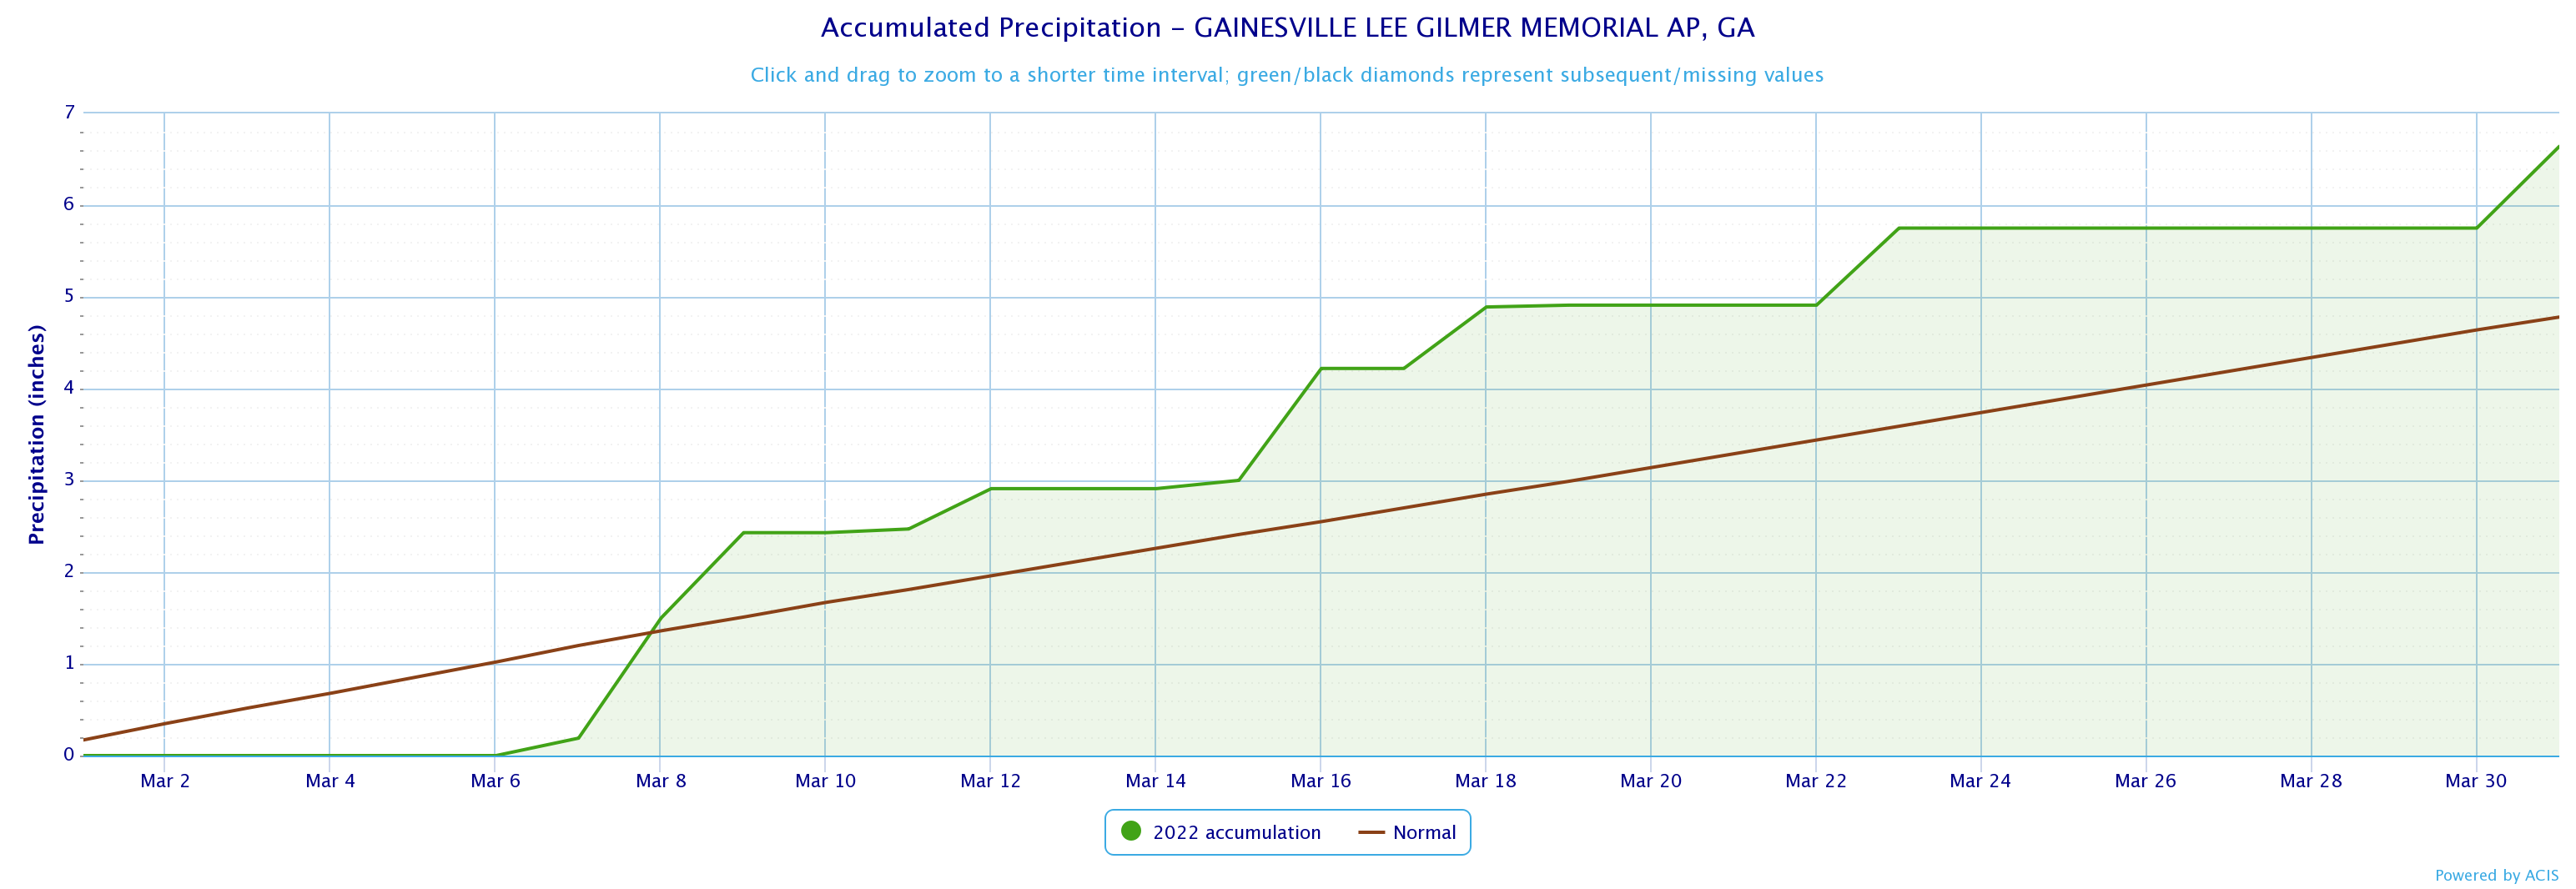
|
|
6.64
|
4.78
|
1.86
|
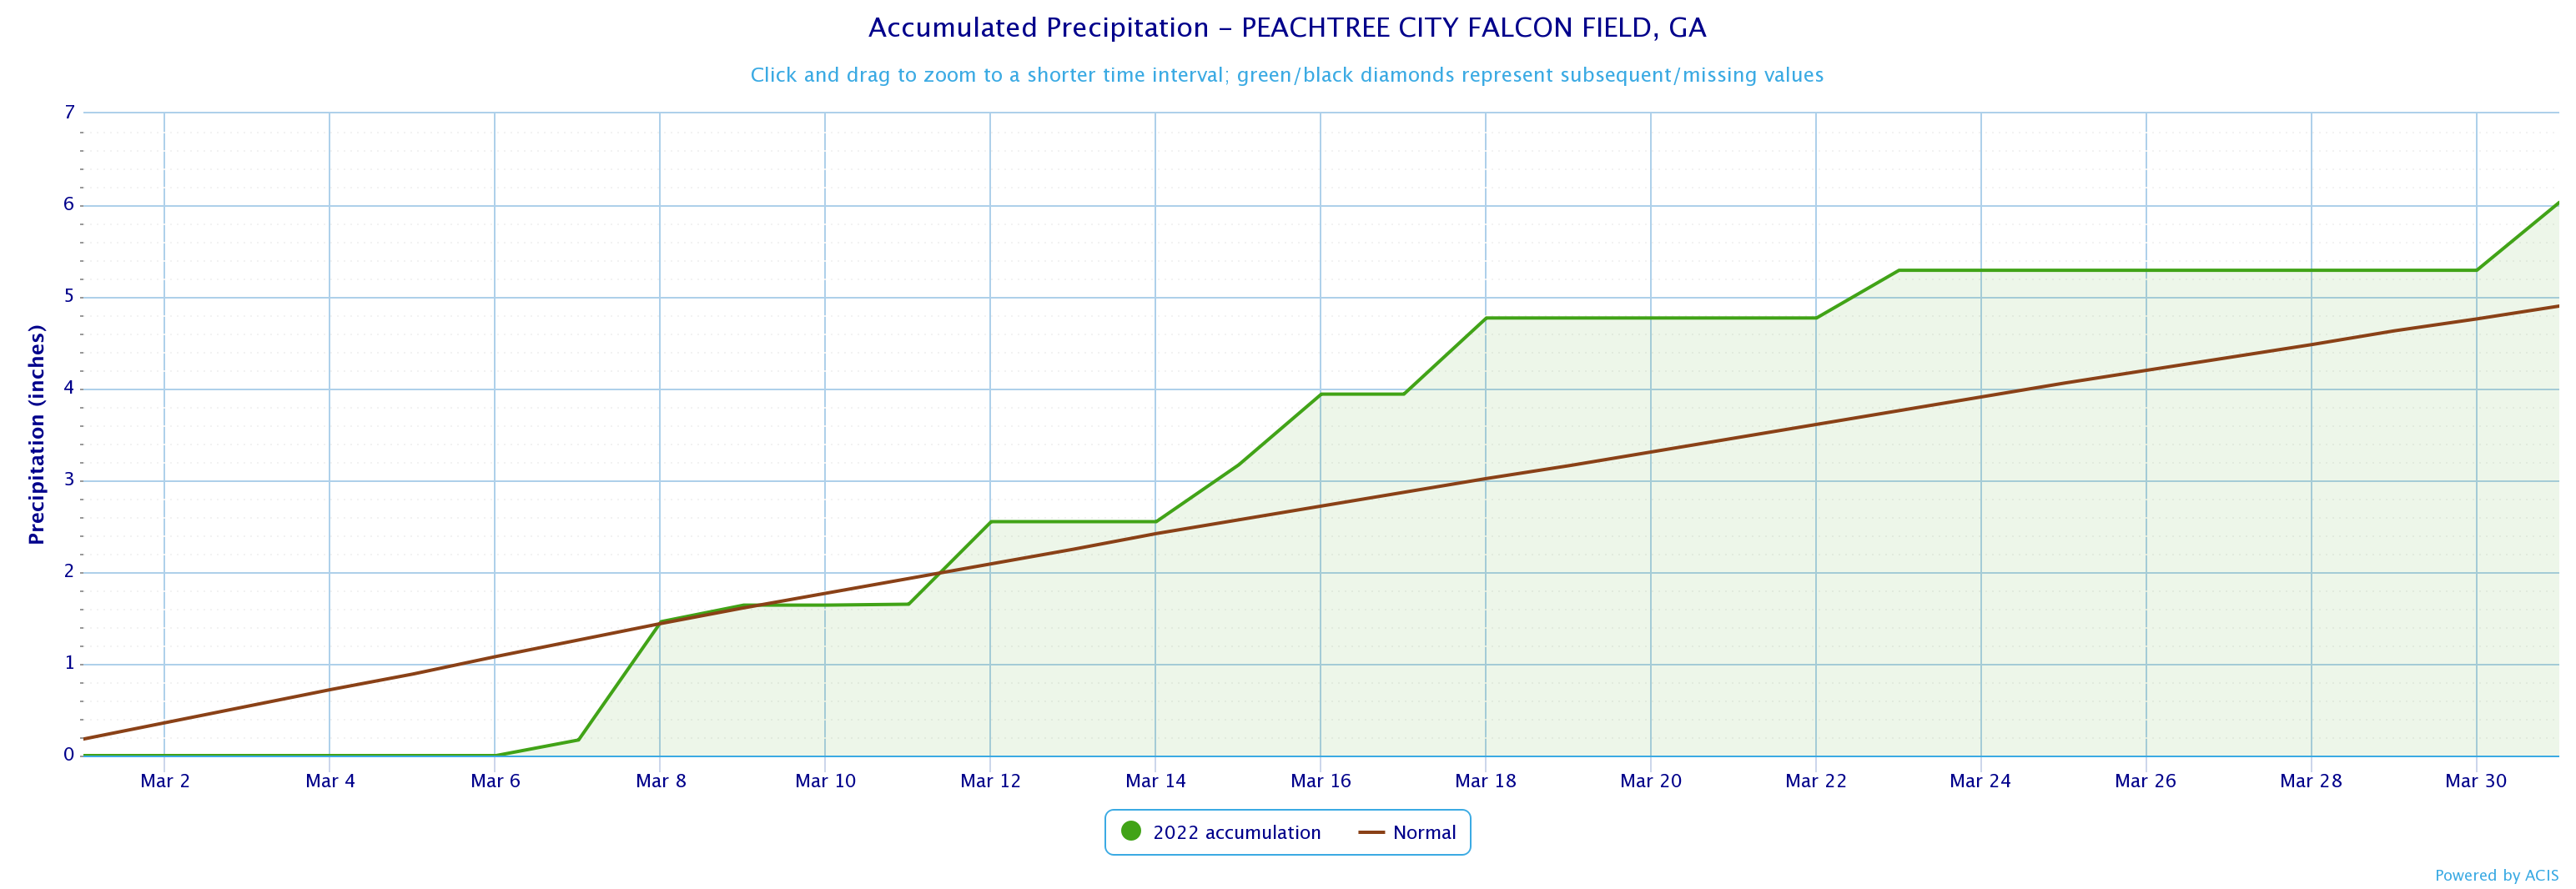
|
|
6.03
|
4.90
|
1.13
|
|
|
6.49
|
4.99
|
1.50
|
|
|
March 2022 Precipitation Climate Statistics
|
||||
|
Climate Site |
Maximum Daily Precip (in inches) |
Max P Date |
||
|
Athens
|
1.93
|
3/9
|
||
|
Atlanta
|
1.61
|
3/9
|
||
|
Columbus
|
1.60
|
3/31
|
||
|
Macon
|
0.88
|
3/18
|
||
|
Cartersville
|
1.26
|
3/23
|
||
|
Dekalb Peachtree Arpt
|
1.98
|
3/9
|
||
|
Fulton Co Arpt
|
1.90
|
3/9
|
||
|
Gainesville
|
2.24
|
3/9
|
||
|
Peachtree City
|
1.47
|
3/9
|
||
|
Rome
|
2.22
|
3/23
|
||
Data prepared by NWS Peachtree City/Atlanta
| Temperature Maps | Precipitation Maps |
| Temperature Graphs | Precipitation Graphs |
|
March 2022 Climate Records
|
|||
|
An all time record high of 80°F was set at ATL on 3/6. This breaks the old record of 79°F set in 1945
|
|||
|
An all time record low of 25°F was set at CSG on 3/13. This breaks the old record of 26°F set in 1969
|
|||
|
An all time record low of 22°F was set at MCN on 3/13. This breaks the old record of 23°F set in 1998
|
March 2021 Warnings and Local Storm Reports
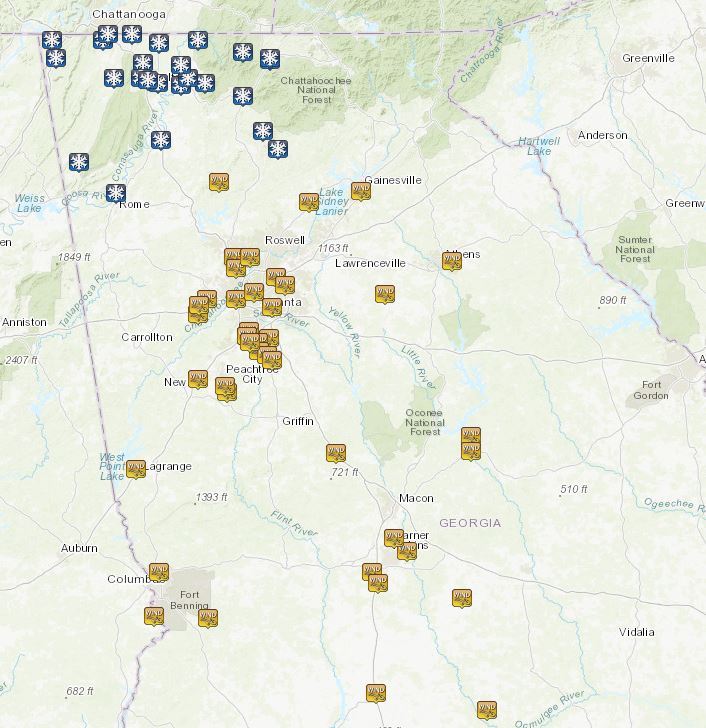
March 12th: A Wind Advisory was issued for the CWA on March 12th out ahead of an approaching cold front. A number of trees were reported down due to high winds, some of which exceeded 40 mph. As the cold front came through, a number of NW Georgia counties reported snow, including the Atlanta Airport which reported a trace amount of snow.
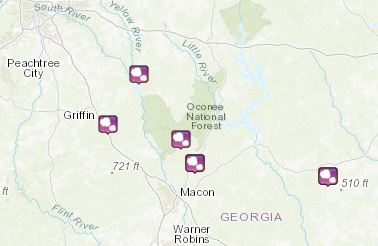
March 16th: A surge of warm air and an approaching front led to a number of thunderstorms across north and central Georgia. A few storms out in front of the approaching cold front became severe in and around the Oconee National Forest area. These storms produced quarter sized hail and gusty winds.
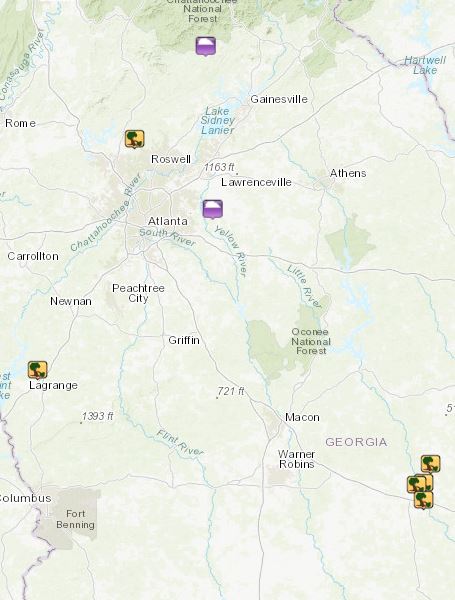
March 19th: A line of storms moved through the area out ahead of a cold front. While instability across the CWA was extremely limited due to dry conditions that had been in place for a few days, a few elevated storms knocked down trees and power lines.
Based on the Climate Prediction Center's outlook for April, North Georgia has a 33% to 40% chance for above normal temperatures while central Georgia has a 40% to 50% chance for above normal temperatures. For precipitation, far northern Georgia has a 33% to 40% chance of above normal precipitation. Central Georgia has an equal chance for above or below normal precipitation.
 |
 |
Data prepared by NWS Peachtree City/Atlanta.

