
A significant heat wave is underway for the Intermountain West, Northern Plains, and Upper Great Lakes, peaking in intensity through midweek and lingering across parts of the Northern Plains and Midwest until this weekend. In southwest Texas, excessive rainfall may bring a risk for potentially life-threatening flash and arroyo flooding through Thursday. Read More >
|
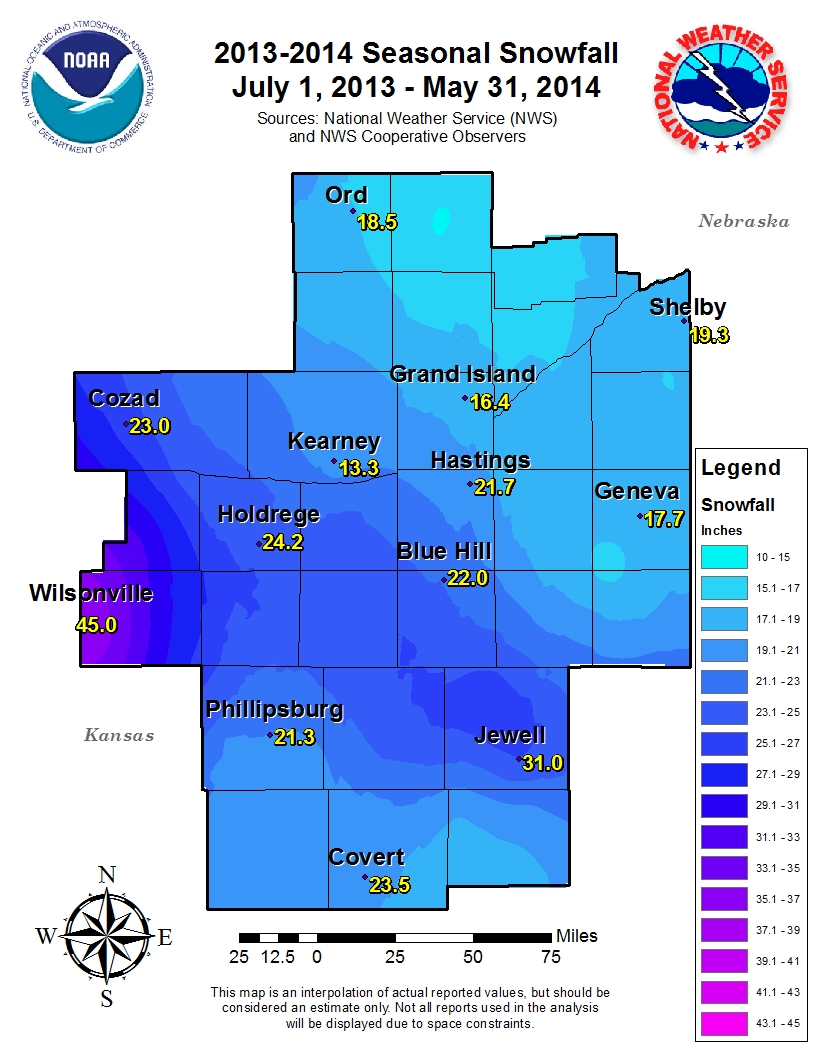
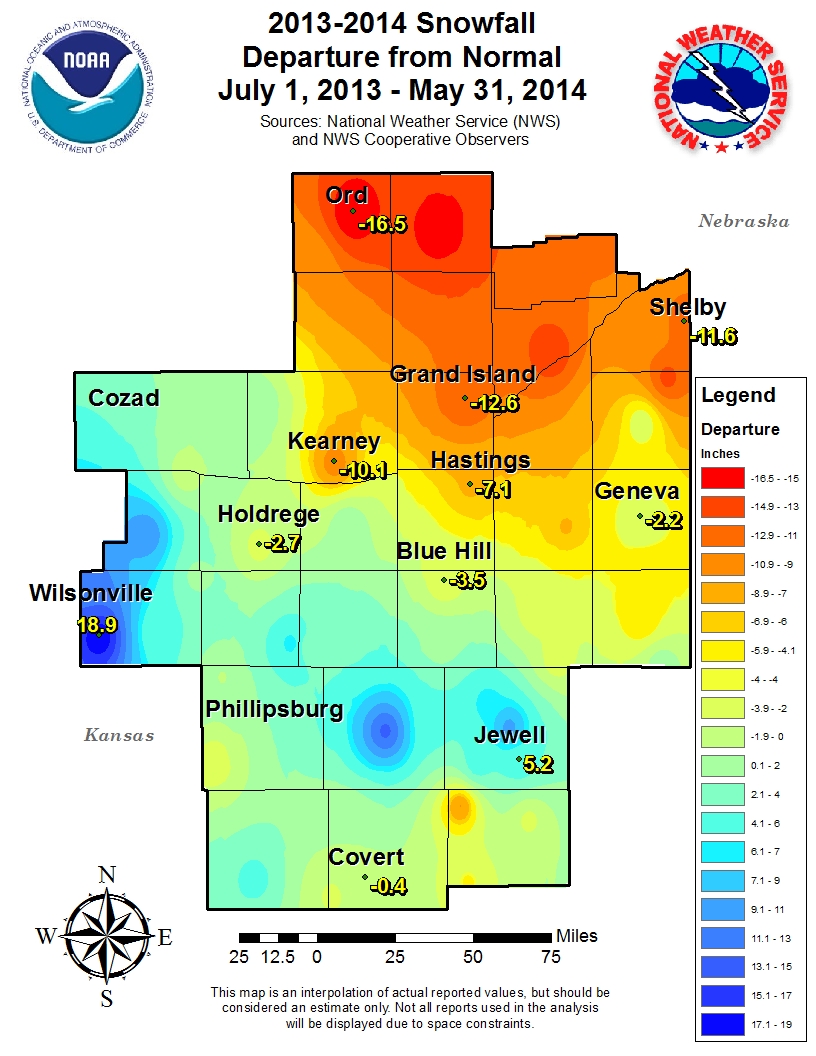
In general, the 2013-2014 snowfall season was highlighted/defined by the following points:
|
Click on image for larger version.
 |
 |
|
2013-14 Seasonal Snowfall |
2013-14 Snowfall Departure From Normal |
|
Station
|
Sep
|
Oct
|
Nov
|
Dec
|
Jan
|
Feb
|
Mar
|
Apr
|
May
|
Season
|
|
Alton 2SW
|
0.0 | 0.0 | Trace | 4.0 | 4.0 | 8.0 | 2.0 | Trace | 0.0 | 18.0 |
|
Beloit
|
0.0 | 0.0 | 0.0 | 1.4 | 3.0 | 9.5 | 1.0 | 0.0 | 0.0 | 14.9 |
|
Burr Oak 1N
|
0.0 | 0.0 | 0.1 | 8.2 | 5.4 | 12.2 | 2.5 | 1.2 | 0.0 | 29.6 |
|
Cawker City
|
0.0 | 0.0 | Trace | 2.0 | 0.5 | 7.7 | 1.0 | Trace | 0.0 | 11.2 |
|
Covert Rural
|
0.0 | 0.0 | 0.0 | 5.0 | 3.5 | 13.5 | 1.5 | 0.0 | 0.0 | 23.5 |
|
Glen Elder Lake
|
0.0 | 0.0 | 0.0 | 1.0 | 2.7 | 5.5 | MSG | 0.0 | 0.0 | MSG |
|
Hunter
|
0.0 | 0.0 | 0.1 | 2.0 | 1.0 | 10.4 | 1.0 | Trace | 0.0 | 14.5 |
|
Ionia
|
0.0 | 0.0 | Trace | 5.9 | 4.1 | 10.2 | 2.4 | Trace | 0.0 | 22.6 |
|
Jewell
|
0.0 | 0.0 | Trace | 7.0 | 4.9 | 11.9 | 5.6 | 1.6 | 0.0 | 31.0 |
|
Kirwin Dam
|
0.0 | 0.0 | Trace | 2.8 | 6.0 | 5.2 | 1.8 | 0.0 | 0.0 | 15.8 |
|
Lebanon
|
0.0 | 0.0 | Trace | 7.2 | 5.3 | 15.2 | 0.5 | Trace | 0.0 | 28.2 |
|
Logan
|
0.0 | 0.0 | 0.0 | 4.0 | 4.0 | 5.0 | 2.0 | Trace | 0.0 | 15.0 |
| Long Island 1 N | 0.0 | 0.0 | 0.0 | 7.5 | 6.0 | 9.5 | 2.0 | 0.0 | 0.0 | 25.0 |
|
Lovewell Dam
|
0.0 | 0.0 | 0.0 | 3.0 | 4.8 | 4.4 | MSG | 0.0 | 0.0 | MSG |
|
Mankato
|
0.0 | 0.0 | Trace | 8.0 | 7.0 | 14.9 | 3.5 | Trace | 0.0 | 33.4 |
|
Natoma
|
0.0 | 0.1 | 1.0 | 3.7 | 3.2 | 8.7 | 0.8 | Trace | 0.0 | 17.5 |
| Phillipsburg | 0.0 | 0.0 | 0.0 | 6.8 | 5.0 | 7.7 | 1.8 | Trace | 0.0 | 21.3 |
|
Plainville 4 WNW
|
0.0 | 0.0 | Trace | 3.5 | 3.0 | 14.0 | 1.1 | 1.3 | 0.0 | 22.9 |
| Smith Center | 0.0 | 0.0 | Trace | 5.3 | 6.9 | 14.8 | 2.4 | 0.7 | 0.0 | 30.1 |
|
Webster Dam
|
0.0 | 0.1 | 0.0 | 4.0 | 3.5 | 7.5 | MSG | 0.0 | 0.0 | MSG |
WINTER 2013-2014 SOUTH CENTRAL NEBRASKA
COOPERATIVE OBSERVER SNOWFALL
* The highest reported amount under each month indicated in BLUE, the lowest amount in RED.
| Station | Sep |
Oct
|
Nov
|
Dec
|
Jan
|
Feb
|
Mar
|
Apr
|
May
|
Season
|
| Arcadia | 0.0 | 0.0 | 3.0 | Trace | 3.8 | 5.5 | 2.0 | 2.0 | 0.0 | 16.3 |
| Aurora 4N | 0.0 | 0.0 | 0.4 | 4.9 | 2.3 | 5.9 | 0.4 | 5.1 | 0.0 | 19.0 |
| Beaver City | 0.0 | 0.0 | Trace | 6.5 | 4.0 | 12.0 | 4.0 | 3.0 | 0.0 | 29.5 |
| Belgrade | 0.0 | 0.0 | 0.5 | 1.5 | 1.9 | 3.8 | 2.7 | 5.0 | 0.0 | 15.4 |
| Blue Hill 4SW | 0.0 | 0.0 | Trace | 5.5 | 2.6 | 7.3 | 3.6 | 3.0 | 0.0 | 22.0 |
| Bradshaw | 0.0 | 0.0 | 0.5 | 7.5 | 3.8 | 6.7 | 2.3 | 2.4 | 0.0 | 23.2 |
| Bruning | 0.0 | 0.0 | 0.0 | 7.0 | 4.0 | 5.5 | Trace | Trace | 0.0 | 16.5 |
| Cambridge | 0.0 | 0.0 | 0.4 | 6.5 | 3.5 | 14.6 | 10.9 | 3.3 | 0.0 | 39.2 |
| Lexington 6SSE (Canaday) | 0.0 | 0.0 | Trace | 1.0 | 4.5 | 7.3 | 3.5 | 3.0 | 0.0 | 19.3 |
|
Central City
|
0.0 | 0.0 | 0.2 | 1.3 | 2.1 | 5.9 | 1.1 | 2.3 | 0.0 | 12.9 |
|
Clay Center 6ESE
|
0.0 | 0.0 | Trace | 7.2 | 2.9 | 5.9 | 0.2 | 0.6 | 0.0 | 16.8 |
|
Clay Center
|
0.0 | 0.0 | Trace | 8.0 | 2.2 | 4.3 | 0.5 | 2.0 | 0.0 | 17.0 |
|
Cozad
|
0.0 | 0.0 | Trace | 1.4 | 2.6 | 9.0 | 8.0 | 2.0 | 0.0 | 23.0 |
|
Edison
|
0.0 | 0.0 | 0.5 | 6.3 | 3.0 | 13.4 | 3.0 | 1.0 | 0.0 | 27.2 |
|
Elwood 8S
|
0.0 | 0.0 | Trace | 5.5 | 5.5 | 13.5 | 6.5 | 4.0 | 0.0 | 35.0 |
| Franklin | 0.0 | 0.0 | 0.0 | 7.2 | 3.0 | 10.0 | 3.0 | Trace | 0.0 | 23.2 |
|
Fullerton
|
0.0 | 0.0 | 2.0 | MSG | MSG | MSG | MSG | MSG | 0.0 | MSG |
|
Geneva
|
0.0 | 0.0 | 0.0 | 5.0 | 4.0 | 5.7 | 0.0 | 3.0 | 0.0 | 17.7 |
|
Genoa 2W
|
0.0 | 0.0 | 0.1 | 1.8 | 1.9 | 5.7 | 1.8 | 7.0 | 0.0 | 18.3 |
|
Gothenburg
|
0.0 | 0.0 | MSG | MSG | MSG | MSG | MSG | MSG | MSG | MSG |
|
Grand Island
|
0.0 | 0.0 | 0.2 | 2.2 | 4.5 | 6.6 | 1.2 | 1.7 | 0.0 | 16.4 |
|
Greeley
|
0.0 | 0.0 | 2.0 | 0.5 | 0.8 | 3.6 | 1.0 | 2.5 | 0.0 | 10.4 |
|
Gresham 3W
|
0.0 | 0.0 | 0.0 | 4.5 | 2.0 | 4.1 | Trace | 0.5 | 0.0 | 11.1 |
|
Harlan County Lake
|
0.0 | 0.0 | Trace | 9.0 | 2.0 | 10.5 | 1.0 | 0.5 | 0.0 | 23.0 |
|
Hastings NWS
|
0.0 | 0.0 | 0.4 | 5.0 | 5.4 | 7.5 | 1.2 | 2.2 | 0.0 | 21.7 |
|
Hebron
|
0.0 | 0.0 | 0.3 | 7.1 | 2.4 | 6.7 | 0.6 | 1.0 | 0.0 | 18.1 |
|
Holdrege
|
0.0 | 0.0 | Trace | 6.5 | 2.8 | 7.5 | 2.4 | 5.0 | 0.0 | 24.2 |
|
Hubbell
|
0.0 | 0.0 | 0.0 | 5.0 | 3.0 | 14.0 | 3.5 | Trace | 0.0 | 25.5 |
|
Kearney Airport
|
0.0 | 0.0 | Trace | 2.7 | 2.8 | 5.8 | 1.3 | 0.7 | 0.0 | 13.3 |
|
Miller
|
0.0 | 0.0 | 0.8 | 1.7 | 3.5 | 8.5 | 3.7 | 5.5 | 0.0 | 23.7 |
|
Minden
|
0.0 | 0.0 | Trace | 7.5 | 5.2 | 9.2 | 3.9 | 2.0 | 0.0 | 27.8 |
|
Naponee
|
0.0 | 0.0 | Trace | 8.0 | 2.1 | 10.5 | 2.2 | 1.2 | 0.0 | 24.0 |
|
Nelson
|
0.0 | 0.0 | Trace | 6.5 | 3.3 | 8.2 | 1.8 | 0.5 | 0.0 | 20.3 |
|
Ord
|
0.0 | 0.0 | 3.5 | 0.5 | 2.5 | 5.5 | 4.0 | 2.5 | 0.0 | 18.5 |
|
Osceola
|
0.0 | 0.0 | 0.5 | 2.6 | 1.7 | 7.0 | 2.0 | 5.0 | 0.0 | 18.8 |
|
Oxford 6NNW
|
0.0 | 0.0 | 0.5 | 6.3 | 4.5 | 9.6 | 4.1 | 2.3 | 0.0 | 27.3 |
|
Polk
|
0.0 | 0.0 | Trace | 4.0 | MSG | 5.0 | 1.0 | 3.0 | 0.0 | MSG |
|
Ravenna
|
0.0 | 0.0 | 1.0 | 1.0 | 4.0 | 5.4 | 3.8 | 6.2 | 0.0 | 21.4 |
|
Red Cloud
|
0.0 | 0.0 | 0.0 | 7.5 | 1.0 | 11.5 | 0.5 | Trace | 0.0 | 20.5 |
|
St. Paul
|
0.0 | 0.0 | Trace | 1.2 | 2.4 | 5.8 | 2.4 | 6.1 | 0.0 | 17.9 |
|
Shelby 3NE
|
0.0 | 0.0 | 0.4 | 3.2 | 1.3 | 7.6 | 3.1 | 3.7 | 0.0 | 19.3 |
|
Shickley 4S
|
0.0 | 0.0 | Trace | 5.0 | 1.5 | 4.0 | Trace | Trace | 0.0 | 10.5 |
|
Superior 4E
|
0.0 | 0.0 | 0.1 | 6.3 | 2.9 | 8.3 | 2.1 | 0.5 | 0.0 | 20.2 |
|
Upland 2NE
|
0.0 | 0.0 | Trace | 8.5 | 5.0 | 10.0 | 4.0 | Trace | 0.0 | 27.5 |
|
Wilsonville
|
0.0 | 0.0 | MSG | 10.0 | 3.5 | 16.0 | 9.5 | 6.0 | 0.0 | 45.0 |
|
Wolbach
|
0.0 | 0.0 | 0.3 | 0.8 | 1.5 | 5.3 | 2.4 | 7.4 | 0.0 | 17.7 |
|
York 3N
|
0.0 | 0.0 | Trace | 7.6 | 2.6 | 6.8 | 2.3 | 2.0 | 0.0 | 21.3 |
MSG...All or part of data for the month/season is either missing or considered unrepresentative
(*Please Note: All climate data presented here are preliminary and have not undergone final quality control by the National Climatic Data Center (NCDC). Therefore, these data are subject to revision. Final and certified climate data can be accessed at: WWW.NCDC.NOAA.GOV)

