
Widespread, life-threatening considerable flash flooding is expected in south-central Texas through at least Friday. Catastrophic river flooding and rapid rises on small streams, arroyos, and typically dry washes are expected in the Texas Hill Country. Wildfire smoke is impacting air quality across much of the Great Lakes region into the Northeast U.S. with Air Quality Alerts in effect. Read More >
Overview:
|
Brief Recap of Feb. 2017: More than anything else, February will be remembered for WELL-ABOVE NORMAL TEMPERATURES across the entire area, with most places averaging 6-9° above normal. For most of the area, it was a "Top-10 Warmest" February, including the 6th and 4th-warmest on record at Grand Island and Hastings, respectively. Both Grand Island and Hastings set records for the most February days reaching 70+ degrees (six days) and also for the warmest two-week February stretch (from the 10th-23rd).
(BE SURE TO CLICK THE VARIOUS TABS BELOW FOR A VARIETY OF FEB. 2017 CLIMATE INFORMATION!) |
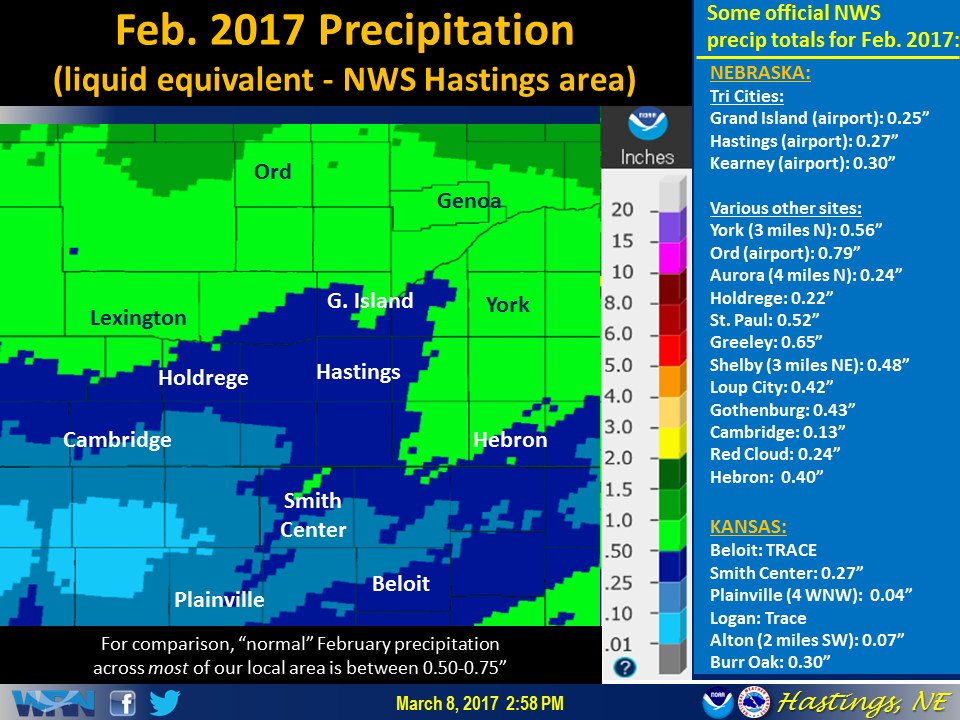 This graphic features a precipitation map for Feb. 2017, along with a partial listing of totals from official NWS stations. (Click image to enlarge) |
Grand Island & Hastings Details (Including 12-Month History):
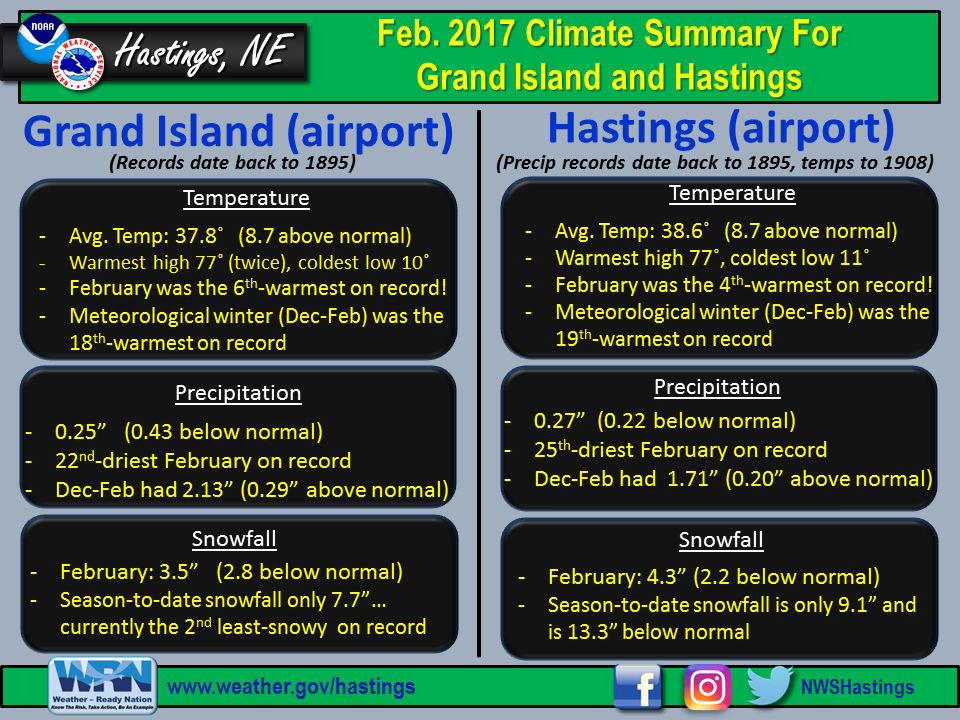 |
| Detailed Feb. 2017 info for Grand Island/Hastings (Click to enlarge) |
 |
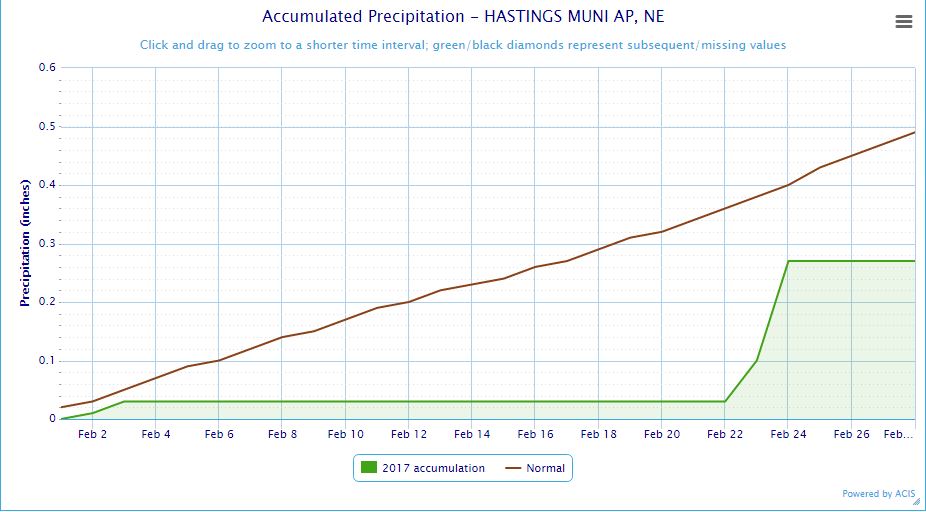 |
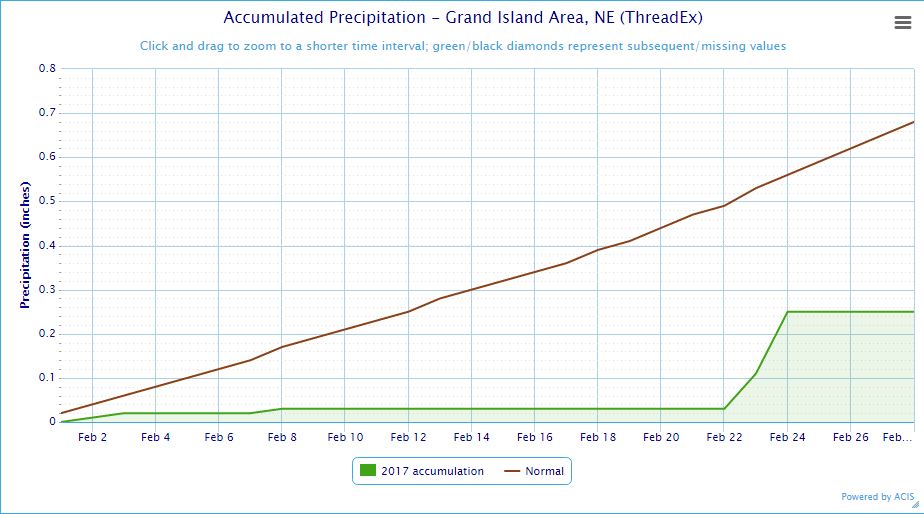
| Grand Island Precipitation Summary: The green line indicates cumulative observed precipitation for February 2017.The brown line indicates "normal" February precipitation based on 30-year data from 1981-2010. (click to enlarge) | Hastings Precipitation Summary: The green line indicates cumulative observed precipitation for February 2017. The brown line indicates "normal" February precipitation based on 30-year data from 1981-2010. (click to enlarge) |
| Grand Island (Regional Airport) - March 2016 - February 2017 | ||||||||||||
| Mar. | Apr. | May | June | July | Aug. | Sep. | Oct. | Nov. | Dec. | Jan. | Feb. | |
| Average High (F) | 59.6 | 64.4 | 71.9 | 89.6 | 87.0 | 84.4 | 78.8 | 70.7 | 57.3 | 37.3 | 34.6 | 50.8 |
| Average Low (F) | 32.0 | 40.4 | 48.5 | 63.2 | 65.1 | 62.7 | 55.0 | 42.6 | 32.7 | 14.5 | 17.9 | 24.8 |
| Average Temperature (F) | 45.8 | 52.4 | 60.2 | 76.4 | 76.0 | 73.5 | 66.9 | 56.7 | 45.0 | 25.9 | 26.3 | 37.8 |
| Departure From Normal | +6.4 | +1.8 | -1.0 | +5.1 | -0.2 | -0.5 | +1.8 | +4.5 | +6.9 | -0.8 | +1.2 | +8.7 |
| Precipitation (in) | 0.61 | 5.05 | 6.84 | 0.05 | 4.10 | 0.57 | 2.53 | 0.12 | 1.37 | 0.81 | 1.07 | 0.25 |
| Departure From Normal | -1.19 | +2.52 | +2.43 | -4.25 | +0.70 | -2.55 | +0.30 | -1.74 | +0.20 | +0.18 | +0.54 | -0.43 |
| Snowfall (in) | 2.6 | 0.0 | 0.0 | 0.0 | 0.0 | 0.0 | 0.0 | 0.0 | 0.4 | 1.4 | 2.4 | 3.5 |
| Departure From Normal | -2.8 | -1.5 | 0.0 | 0.0 | 0.0 | 0.0 | -0.1 | -1.0 | -2.7 | -3.7 | -4.1 | -2.8 |
| Hastings (Municipal Airport) - March 2016 - February 2017 | ||||||||||||
| Mar. | Apr. | May | June | July | Aug. | Sep. | Oct. | Nov. | Dec. | Jan. | Feb. | |
| Average High (F) | 60.0 | 64.6 | 71.0 | 89.1 | 87.7 | 84.9 | 78.6 | 71.3 | 57.4 | 37.7 | 35.7 | 51.4 |
| Average Low (F) | 32.7 | 41.0 | 48.9 | 64.0 | 66.0 | 63.4 | 56.1 | 44.0 | 34.2 | 15.6 | 19.4 | 25.8 |
| Average Temperature (F) | 46.3 | 52.8 | 59.9 | 76.5 | 76.9 | 74.1 | 67.3 | 57.6 | 45.8 | 26.6 | 27.6 | 38.6 |
| Departure From Normal (F) | +6.4 | +2.1 | -1.4 | +4.7 | -0.2 | -0.2 | +1.7 | +5.0 | +7.1 | -1.0 | +1.6 | +8.7 |
| Precipitation (in) | 0.54 | 5.69 | 3.68 | 0.75 | 2.22 | 1.77 | 1.80 | 0.22 | 1.46 | 0.61 | 0.83 | 0.27 |
| Departure From Normal (in) | -1.25 | +3.13 | -0.89 | -3.05 | -1.52 | -1.53 | -0.76 | -1.77 | +0.17 | 0.00 | +0.42 | -0.22 |
| Snowfall (in) | 2.1 | 0.0 | 0.0 | 0.0 | 0.0 | 0.0 | 0.0 | 0.0 | 0.1 | 1.0 | 3.7 | 4.3 |
| Departure From Normal (in) | -3.1 | -1.2 | 0.0 | 0.0 | 0.0 | 0.0 | -0.2 | -1.0 | -2.5 | -5.1 | -2.3 | -2.2 |
Kearney - 12 Month Climate History:
All data here is from the official NWS observer at Kearney airport, with 24-hour observations taken around 7 a.m. ** PLEASE NOTE: This official Kearney data differs somewhat from the unofficial data presented by the automated airport system (KEAR) **
| Kearney Airport (Coop Observer) - March 2016 - February 2017 | ||||||||||||
| Mar. | Apr. | May | June | July | Aug. | Sep. | Oct. | Nov. | Dec. | Jan. | Feb. | |
| Average High (F) | 59.5 | 63.2 | 69.5 | 87.4 | 86.4 | 84.3 | 79.3 | 70.8 | 58.6 | 37.8 | 36.9 | 50.0 |
| Average Low (F) | 27.4 | 39.5 | 46.6 | 61.7 | 63.4 | 61.8 | 53.0 | 40.8 | 33.4 | 14.8 | 19.5 | 24.1 |
| Average Temperature (F) | 43.5 | 51.4 | 58.1 | 74.6 | 74.9 | 73.1 | 66.2 | 55.8 | 46.0 | 26.3 | 28.2 | 37.1 |
| Departure From Normal (F) | +5.8 | +2.7 | +1.4 | +4.8 | +0.2 | +0.5 | +2.7 | +4.9 | +9.0 | +0.4 | +3.6 | +9.0 |
| Precipitation (in) | 0.56 | 8.39 | 2.30 | 0.61 | 3.38 | 1.47 | 1.20 | 0.12 | 1.56 | 0.90 | 0.90 | 0.30 |
| Departure From Normal (in) | -1.23 | +6.16 | -1.88 | -3.32 | +0.10 | -1.61 | -0.87 | -1.92 | +0.54 | +0.33 | +0.41 | -0.25 |
| Snowfall (in) | 3.0 | 0.0 | 0.0 | 0.0 | 0.0 | 0.0 | 0.0 | 0.0 | 0.2 | 1.0 | 4.5 | 5.2 |
| Departure From Normal (in) | -1.6 | -1.8 | 0.0 | 0.0 | 0.0 | 0.0 | -0.2 | -0.7 | -2.9 | -2.5 | +0.1 | +0.1 |
Ord - 12 Month Climate History:
Winter precipitation totals often include NWS Cooperative Observer data due to the automated airport equipment under-measuring snowfall liquid equivalent.
| Ord (Evelyn Sharp Field Airport) - March 2016 - February 2017 | ||||||||||||
| Mar. | April | May | June | July | Aug. | Sep. | Oct. | Nov. | Dec. | Jan. | Feb. | |
| Average High (F) | 58.5 | 61.7 | 71.1 | 86.8 | 85.2 | 83.6 | 77.2 | 70.3 | 56.7 | 37.6 | 34.1 | 48.4 |
| Average Low (F) | 27.0 | 38.7 | 45.7 | MSG | 62.3 | 60.4 | MSG | 37.4 | 28.1 | 9.3 | 14.2 | 19.8 |
| Average Temperature (F) | 42.7 | 50.2 | 58.4 | MSG | 73.8 | 72.0 | MSG | 53.8 | 42.4 | 23.5 | 24.1 | 34.1 |
| Departure From Normal (F) | +5.0 | +1.4 | -0.9 | MSG | -0.6 | -1.0 | MSG | +4.2 | +6.1 | -1.4 | -0.5 | +6.3 |
| Precipitation (in) | 1.35 | 8.99 | 5.05 | 3.52 | 6.66 | 0.44 | 1.70 | 0.09 | 1.26 | 0.41 | 1.15 | 0.79 |
| Departure From Normal (in) | -0.10 | +6.40 | +1.24 | -0.60 | +3.69 | -2.72 | -0.74 | -1.84 | +0.19 | -0.18 | +0.78 | +0.35 |
| Snowfall (in) | 8.0 | Trace | 0.0 | 0.0 | 0.0 | 0.0 | 0.0 | 0.0 | 3.0 | 2.7 | 11.9 | 10.4 |
| Departure From Normal (in) | +2.1 | -2.5 | 0.0 | 0.0 | 0.0 | 0.0 | 0.0 | -1.1 | -2.3 | -4.7 | +5.1 | +4.4 |
Smith Center, KS - 12 Month Climate History:
All data is from the official NWS observer, with 24-hour observations taken around 7 a.m. As a result, data may vary slightly from true "Calendar Day" totals.
| Smith Center KS (NWS Coop Observer) - March 2016 - February 2017 | ||||||||||||
| Mar. | April | May | June | July | Aug. | Sep. | Oct. | Nov. | Dec. | Jan. | Feb. | |
| Average High (F) | 63.1 | 67.3 | 72.7 | 91.7 | 90.5 | 86.5 | 81.3 | 73.9 | 61.0 | 38.7 | 39.0 | 53.4 |
| Average Low (F) | 30.1 | 39.3 | 48.6 | 63.0 | 66.1 | 62.8 | 55.6 | 43.5 | 32.9 | 14.2 | 18.5 | 24.2 |
| Average Temperature (F) | 46.6 | 53.3 | 60.7 | 77.4 | 78.3 | 74.7 | 68.5 | 58.7 | 47.0 | 26.5 | 28.7 | 38.8 |
| Departure From Normal (F) | +5.0 | +0.8 | -3.7 | +3.4 | -1.4 | -2.5 | +0.3 | +3.9 | +6.6 | -2.3 | +1.0 | +6.8 |
| Precipitation (in) | 0.22 | 5.40 | 4.38 | 3.11 | 6.07 | 5.13 | 5.07 | 0.09 | 0.99 | 0.56 | 1.46 | 0.27 |
| Departure From Normal (in) | -1.65 | +3.13 | +0.46 | -0.50 | +2.20 | +1.83 | +3.03 | -1.79 | -0.23 | -0.10 | +0.97 | -0.31 |
| Snowfall (in) | 0.5 | 0.0 | 0.0 | 0.0 | 0.0 | 0.0 | 0.0 | 0.0 | 0.0 | 3.1 | 1.1 | 1.8 |
| Departure From Normal (in) | -1.9 | -0.6 | 0.0 | 0.0 | 0.0 | 0.0 | -0.2 | -0.4 | -1.8 | -0.1 | -2.6 | -2.3 |
Area Temperature & Precipitation Departure From Normal Maps:
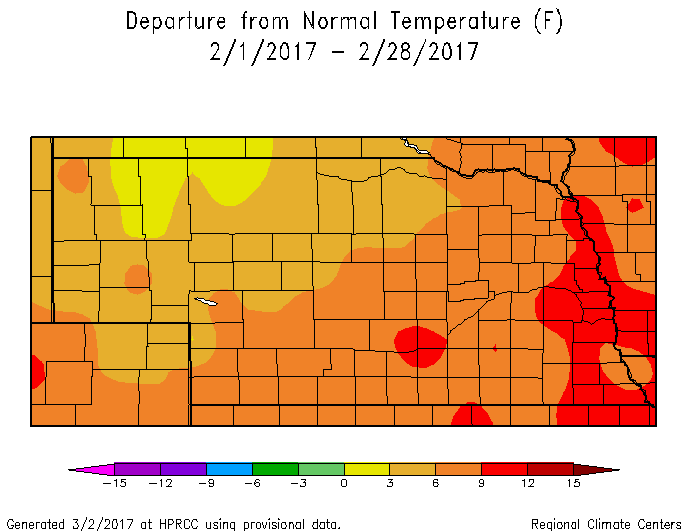
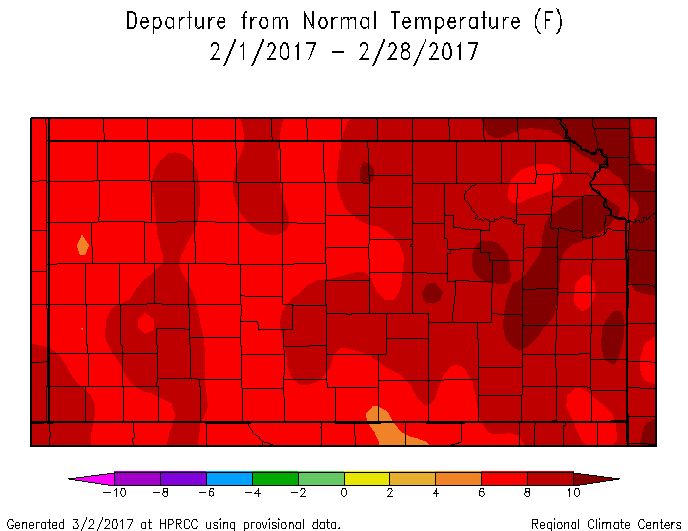
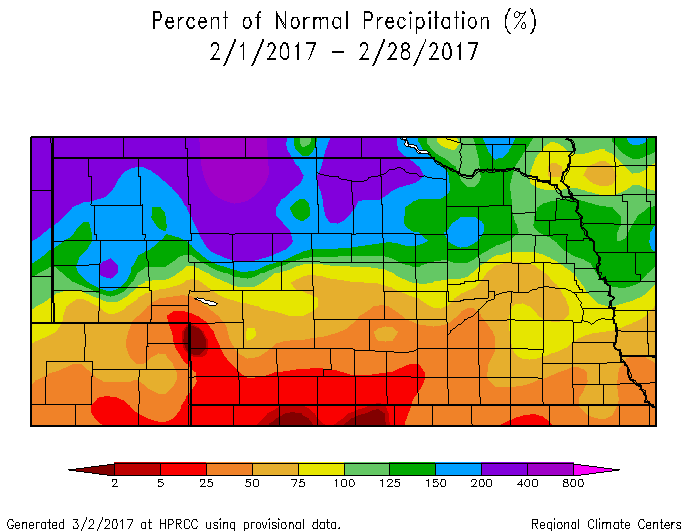
These images depict Feb. 2017 monthly temperature departure from normal & precipitation percent-of-normal for both Nebraska & Kansas. Images are courtesy of the High Plains Regional Climate Center (HPRCC). Click images to enlarge.
 |
 |
 |
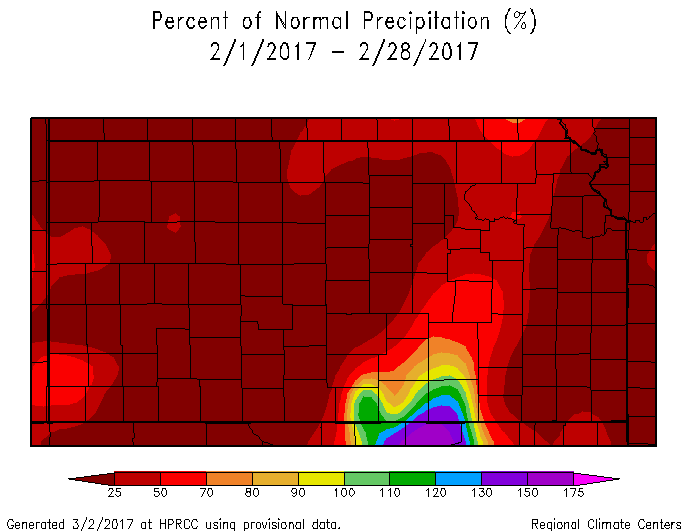 |
| Departure from Normal Temperature - NE (left) & KS (right) | Percent of Normal Precipitation - NE (left) & KS (right) | ||
Drought:
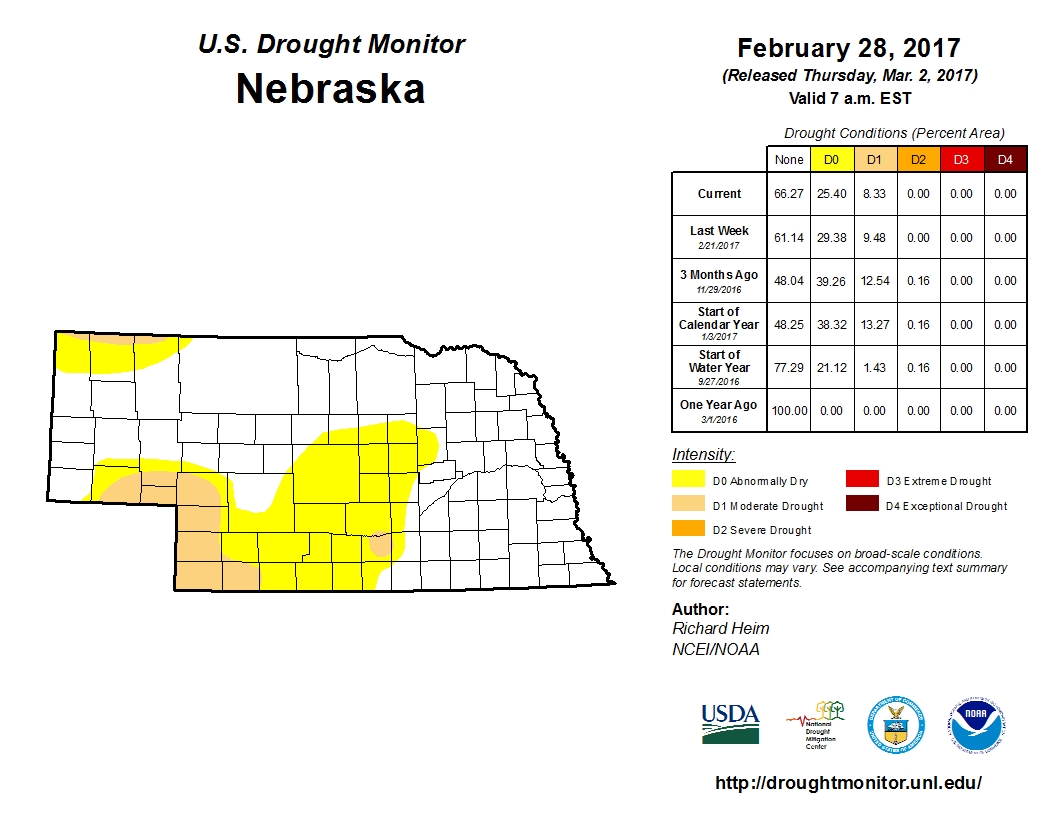
The following drought images, current as of Feb. 28, 2017, are courtesy of the U.S. Drought Monitor
Brief summary of changes during Feb. 2017 for the NWS Hastings coverage area:
Despite solidly below-normal precipitation across much of the local area during February, there was essentially no change whatsoever in drought categories across South Central Nebraska and North Central Kansas. This means that a little more than half of the local area remains in Abnormally Dry (D0), with a small area of Moderate Drought (D1) hanging on primarily within Kearney County (largely a holdover from the very dry conditions during summer 2016).
 |
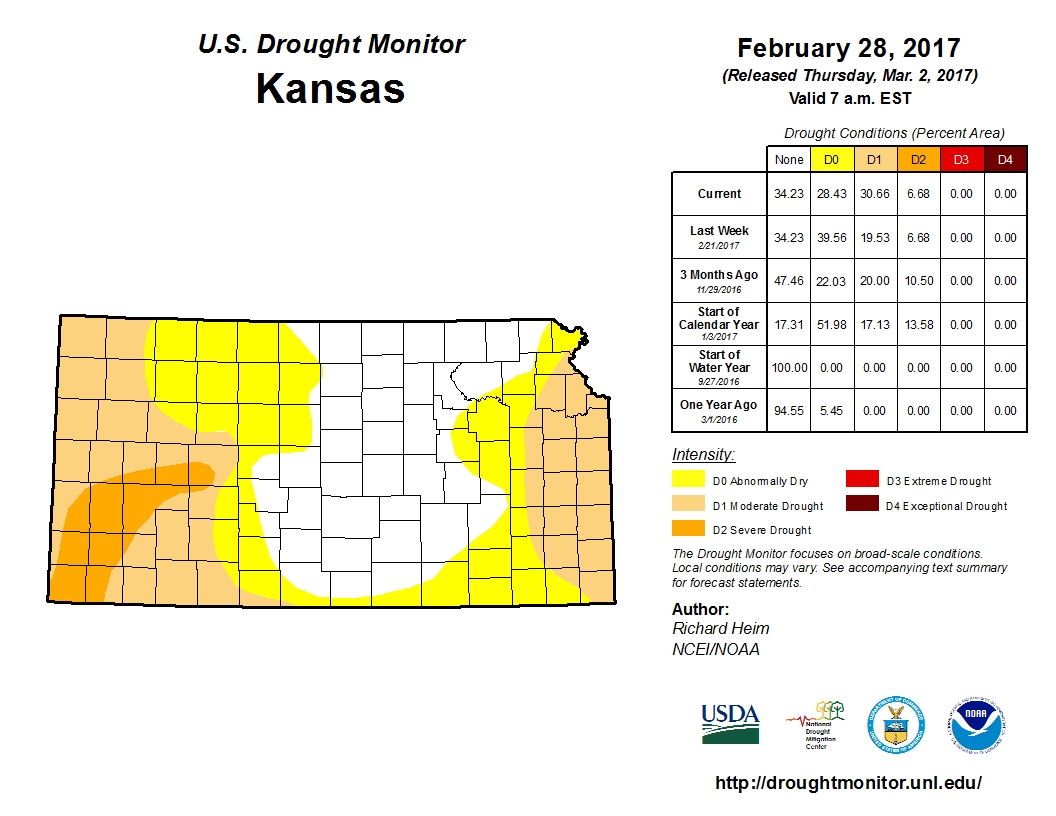 |
| Drought Monitor for Nebraska (left) & Kansas (right). Valid as of February 28, 2017 (click to enlarge) | |
Monthly Extremes for the NWS Hastings Coverage Area:
...A FEW OF THE WARMEST HIGH TEMPERATURES DURING FEBRUARY 2017...
(all data from NWS cooperative observers and occurred on the 21st)
83 degrees...Beaver City
82 degrees...Webster Dam KS
81 degrees...Cambridge - Edison
...A FEW OF THE COLDEST LOW TEMPERATURES DURING FEBRUARY 2017...
(all data from NWS cooperative observers or automated airport sites with the date in parentheses)
-6 degrees...2W Genoa (on the 9th)
-1 degrees...Ord airport (25th)
3 degrees...Gothenburg (25th) - Greeley (9th)
...A FEW OF THE HIGHEST MONTHLY PRECIPITATION TOTALS DURING FEBRUARY 2017...
(all data from NWS cooperative observers or automated airport sites, unless specified)
0.79"...Ord airport
0.65"...Greeley
0.56"...3N York
0.53"...4S Shickley
0.52"...St. Paul - Belgrade
...A FEW OF THE LOWEST MONTHLY PRECIPITATION TOTALS DURING FEBRUARY 2017...
(all data from NWS cooperative observers or automated airport sites, unless specified)
Trace...Beloit KS - Glen Elder Dam KS - Logan KS - Webster Dam KS
0.01"...Phillipsburg KS
0.02"...Natoma KS
0.03"...Covert KS - Harlan County Lake
0.04"...4WNW Plainville KS
...A FEW OF THE HIGHEST MONTHLY SNOWFALL TOTALS DURING FEBRUARY 2017...
(all data from NWS cooperative observers, unless specified)
10.4"...Ord
10.3"...Greeley
6.3"...Miller
6.0"...3NE Shelby and 6SSE Lexington (Canaday Plant)
5.8"...2W Genoa
 |
Media use of NWS Web News Stories is encouraged! Please acknowledge the NWS as the source of any news information accessed from this site. |
|

