Widespread life-threatening flash and urban flooding will continue to pose a significant threat to life and property in south-central Texas. Catastrophic fiver flooding, with rapid rises on small streams, arroyos, and typically dry washes, is expected. Monsoonal showers persist across the Great Basin and Southwest with greatest flash flooding in southern Arizona. Read More >
Republican River Flood of May 30, 1935
This website is dedicated to preserving the history of the Republican River Flood of 1935.
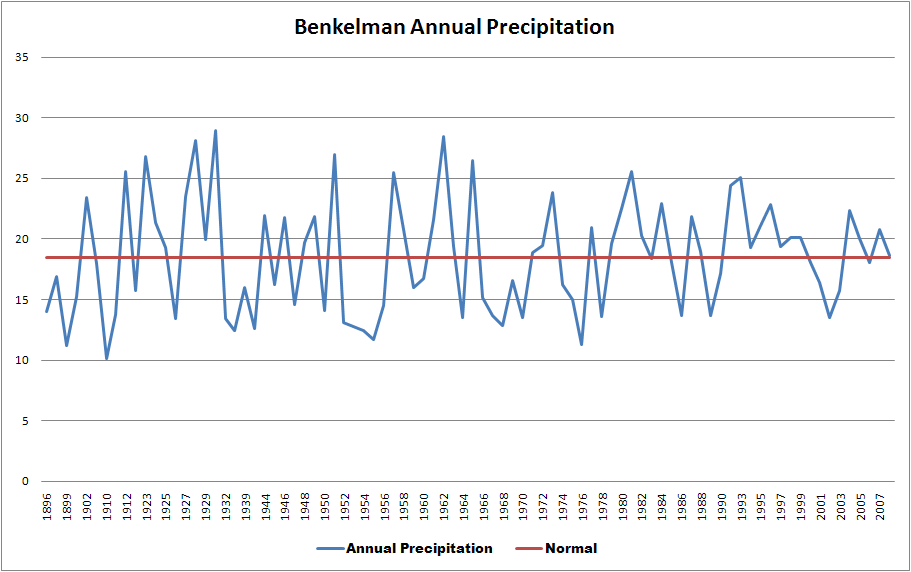
Note: There was a limited amount of weather data available to the meteorologist at the time of this flood. The surface observations were not as densely populated as today and the network of radiosondes (weather balloons) across the United States was not established until 1937. Antecedent Conditions - The 1930's brought drought across the High Plains of the United States. This decade, commonly known as the dust bowl era, was characterized by below normal rainfall and severe dust storms. The following line graph shows the annual rainfall plots at Benkelman, Nebraska. Note the prolonged period of below normal precipitation beginning after 1929. Further charts for other sites are available here.
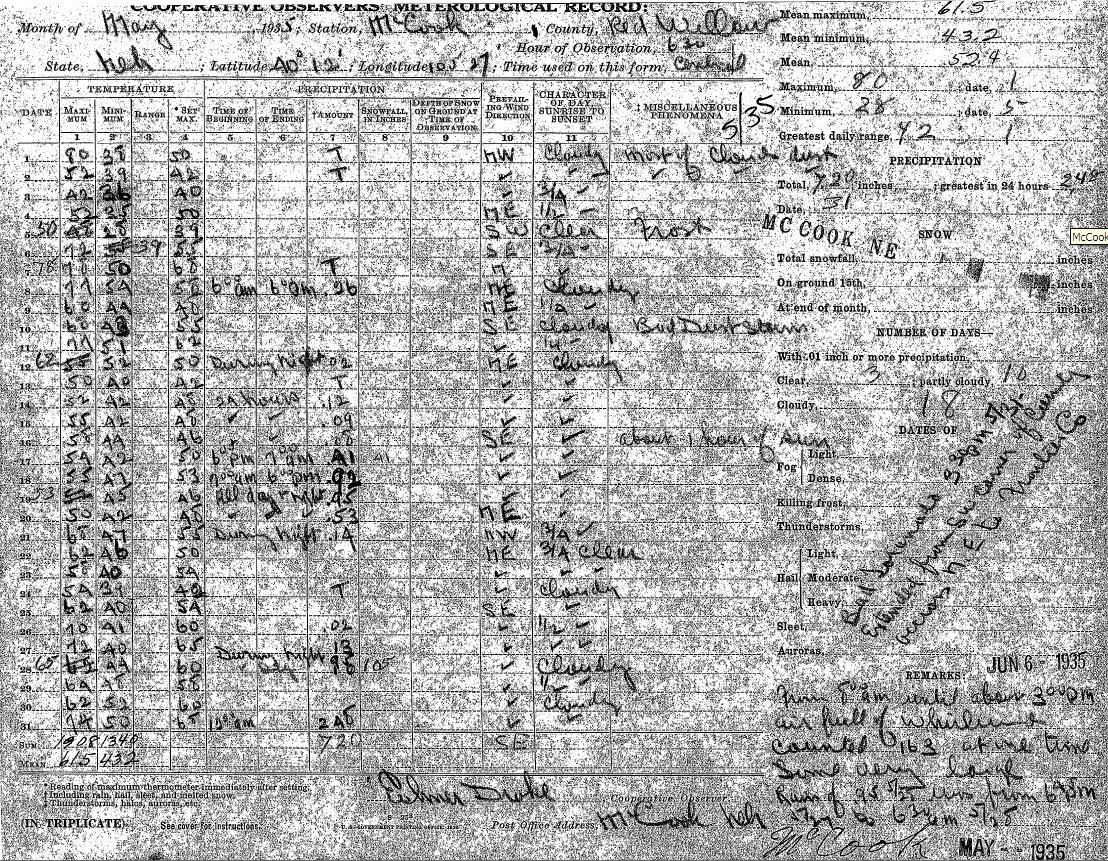
The mid part of May, 1935, however, was wet. Several thunderstorms moved across eastern Colorado and southwest Nebraska from May 10 through May 20. Over two inches of rain fell in that period from Wray, Colorado, to McCook, Nebraska. The following image is the hand written daily weather information from McCook for May, 1935. Further images of other weather logs are listed here.
|
What caused the flood?
"An unusually heavy storm of cloudburst intensity in eastern Colorado and western Nebraska during the night of May 30-31, 1935, which followed two periods of general rainfall over the Republican-Kansas River Basin earlier in the month, produced the greatest flood of record in the upper part of this basin and a flood nearly as great as any previously recorded on the lower part of the basin below Junction City, Kans." from Follansbee and Spiegel, 1937.
Upper Level Maps - The following maps were generated from the Physical Science Division of NOAA's Earth Sciences Research Laboratory through its 20th century reanalysis project. Details about how the maps were created with an admittedly limited data source are found here. Note that the data and conclusions presented here represent one possible scenario about what happened meteorologically during the 1935 Republican River flood. Although other possibilities exist, the following depict the best estimate of what occurred. It is, however, only an estimate.
|
Fig.1 - 500 mb Heights (May 30, 1935) |
Fig.2 - 500 mb Heights (May 31, 1935) |
|
Fig. 3 - 700 mb Heights (May 30, 1935) |
Fig. 4 - 700 mb Heights (May 31, 1935) |
|
Fig. 5 - 700 mb UVV (May 30, 1935) |
Fig. 6 - 700 mb UVV (May 31, 1935) |
|
Fig. 7 - Surface Based CAPE (May 30, 1935) |
Fig. 8 - Surface Based CAPE (May 31, 1935) |
|
Fig. 9 - Precipitable Water (May 30, 1935) |
Fig. 10 - Precipitable Water (May 31, 1935) |
Surface Maps The maps available at the time are shown below.
|
Fig. 11 - May 30, 1935 at 8 am E.S.T. |
Fig. 12 - May 31, 1935 at 8 am E.S.T. |
|
Fig. 13 - June 1, 1935 at 8 am E.S.T. |
Fig. 14 - June 2, 1935 at 8 am E.S.T. |
Meteorological Discussion - Based on the above maps, the mid-level synoptic pattern was dominated by a trough over the western United States on May 30 and May 31, 1935. As this system deepened, a ridge strengthened over the Great Plains. One can assume that various 500 mb short wave troughs advected in southwest flow from the Great Basin across the Rockies into the central part of the country. This is not an unusual occurrence in late May. The 700 mb map on May 31, 1935 (Fig. 4), depicts a short wave trough extending from northern Utah to southeast Colorado. Synoptic scale lift was produced by a combination of differential vorticity advection and warm air advection. Note moderate to strong upward vertical motion is implied across Colorado and Kansas on the 700 mb UVV charts on May 30, though it moves across Central Nebraska and central Kansas on May 31, 1935.
Figures 9 and 10 show that precipitable water values increased from .90 inches on May 30 to 1.25 inches on May 31, 1935. Even higher values occurred across southwest Kansas and the Oklahoma panhandle. Regardless, precipitable water values were approximately 180% of normal on May 31 across southwest Nebraska, eastern Colorado, and northwest Kansas.
Surface data - Figures 11 through 14 depict the surface pattern from May 30 through June 2, 1935. In response to the western United States trough, an area of low pressure moved across the four-corners region and emerged immediately east of the Rocky Mountains. The surface low rapidly deepen as it moved north, becoming located over the western Dakotas and south central Canada by the end of the time period. As the low deepened, warm moist, low level air was drawn northward out of Texas and Louisiana into the central High Plains. The northern edge of the warm moist air is denoted as a warm front in Figure 12. As the warm front advanced north underneath the southwest flow aloft, it is plausible that numerous thunderstorms developed along and north of the warm front. For such large rainfall amounts to have been produced over a small time frame, given the synoptic pattern, it is speculated that thunderstorms continually redeveloped over the same general location. It is also presumed the storms decreased in areal coverage and intensity with the passage of a cold front across the Republican River basin (Fig. 13).
Tornado in the McCook Area
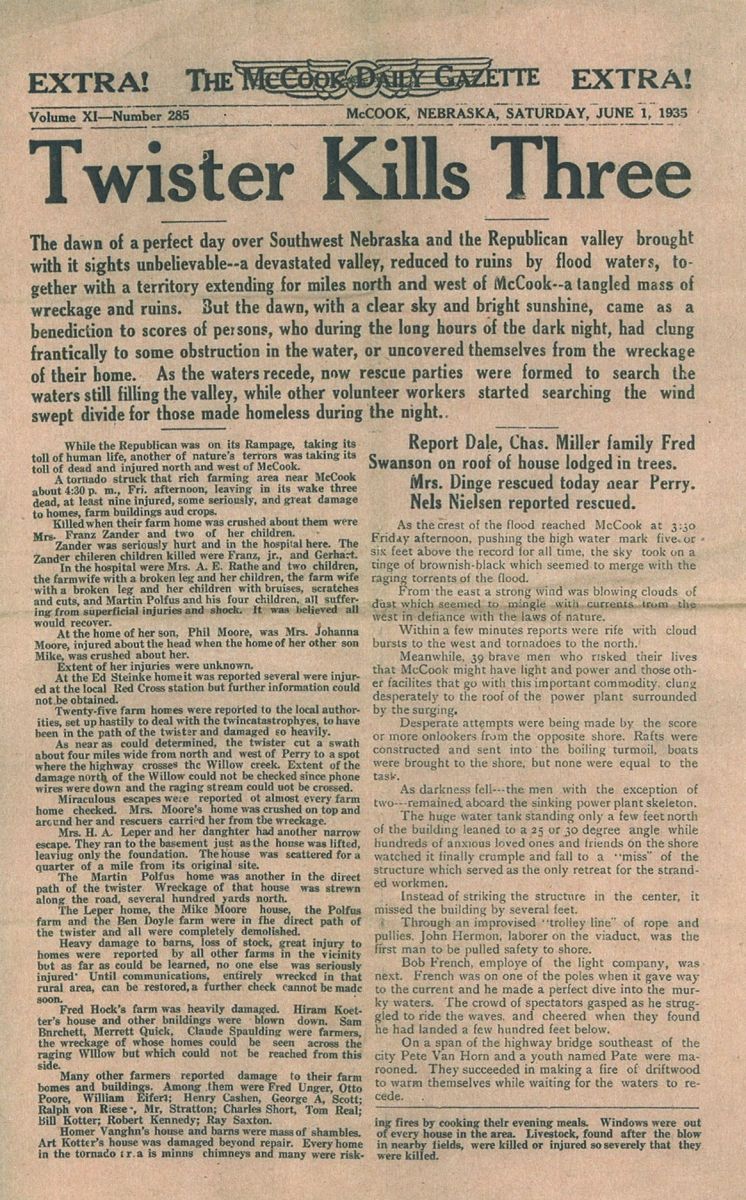
In addition to staging recovery efforts after the flood reached McCook, Nebraska, townspeople also coped with a tornado that moved across parts of southwest Nebraska. The crest of the flood reached McCook, Nebraska, around 1 PM CST on May 31, 1935. At approximately 4:30 PM that afternoon a tornado moved northwest of the community. This tornado was part of a minor outbreak that occurred over western Nebraska and northern Kansas. These tornadoes ranged from F2 to F4 on the Fujita scale.
|
May 31, 1935 Tornado Tracks |
May 31, 1935 Tornado Fatalities |
According to the McCook Tribune newspaper, the Republican Leader newspaper, and a summary by Thomas Grazulis (Grazulis, 1993), the tornado developed about four miles east of Culbertson, Nebraska, tracked northeast, and lifted about 10 miles south of Curtis, Nebraska. The storm produced five fatalities and 35 injuries.
|
|
Of the five fatalities, two were infants, one was a young child, and two were adults. Three of the fatalities occurred at the Franz Zander farmstead in Red Willow County about two miles north of Perry (Fidler, 2003). Mrs. Zander and her two children, aged one and three, were killed. A baby was killed near the same location. The final fatality occurred south of Curtis when a man, who had been working outdoors, was struck by flying debris as he ran toward a storm cellar.
|
|
Fourteen families in Hitchcock County reported damage that ranged from having roofs torn off to complete destruction with their farmsteads wiped clean of house, barn and outbuildings. Homes northwest of McCook were totally destroyed. According to Wilmot (1995) structures were also damaged in separate storms at Max and Parks.
A dust storm full of red dust, originating in Oklahoma, came through McCook at the peak of the flood. It is hard to imagine with all the water that a dust storm happened at the same time.

References
Fidler, Helen C. The Republican River Flood and Tornado of 1935. Imperial, NE: Self Published, 2004.
Grazulis, Thomas A. Significant Tornadoes 1680-1991. St. Johnsbury, VT: The Tornado Project of Environmental Films, 1993.
Wilmot, Marlene H. Bluff to Bluff. Greeley, CO: Wilmot Ventures, 1995.