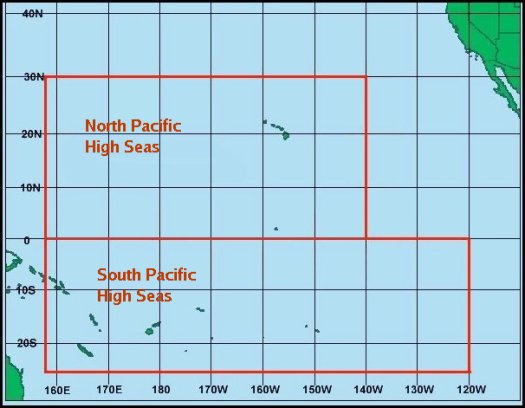
Effective February 17, 2026 the High Seas North Pacific forecast covers approximately 82,800 square miles from the equator to 30N from 140W to 180W.
For the South Pacific, please visit the Fiji Meteorological Service
The Marine Radiofax Charts for Station KVM-70 are now available via E-mail or FTP. Click here for more details on the charts available. For the help file on FTPMAIL click here.
|
Graphic Forecasts
for Hawaiian Islands and surrounding coastal waters |
|||||||||||||||||||||||||
| Pacific Streamline Analysis (130E-110W,30S-30N) |
|
||||||||||||||||||||||||
| North Pacific Surface Analysis (130E-110W,EQ-60N) From the Unified Surface Analysis |
|
||||||||||||||||||||||||
| Pacific Surface Forecast (130E-110W,30S-50N) |
|
||||||||||||||||||||||||
| Pacific Wind Wave Analysis and Forecasts |
|
||||||||||||||||||||||||
| Pacific Sea Surface Temperature Analysis satellite-derived (updated twice weekly) |
Symbols & Test Chart (gif) Symbols & Test Chart (TIF) |
||||||||||||||||||||||||

