The latest version of marine weather charts for broadcast by the U.S. Coast Guard are available from the National Weather Service Telecommunication Gateway on this server. The listed charts are in the G4 (T4) format and enveloped in TIFF for viewing, also available in GIF format. Satellite images are in JPEG format.
Reports from mariners of both poor AND good radio reception , as well as any other comments about weather broadcast services and forecast products are always greatly appreciated. Please be specific as possible noting your location, equipment/software used, date(s), time(s), frequency(s), mode (fax, voice, NAVTEX, etc.), signal strength, and problem observed (e.g. interference, noise, sync loss, echoes, etc), product name ( e.g. high seas text forecast for METAREA IV, if internet state link, etc. ). Send your comments to: Questions, Comments?.
SIZE and UPDATED... refer to .TIF version of files
Many of these charts are also broadcast from Pt. Reyes, CA and Kodiak, AK.
Condensed version of this page showing only the latest charts (no color charts available)
Printer Friendly Weather Briefing the Central Pacific showing the latest charts
Printer Friendly Weather Briefing for the Southeast Pacific showing the latest charts
Printer Friendly Weather Briefing for the North Pacific showing the latest charts
Radiofax Information
Worldwide Marine Radiofacsimile Broadcast Schedules (PDF)
These products also available via E-mail or FTP
Radiofacsimile User's Guide
Historic Weather and Satellite Data
| Wind/Wave Charts - Central Pacific | |||
|---|---|---|---|
| Wind/Wave Analysis VT00Z 30S-30N 120W-130E |  |
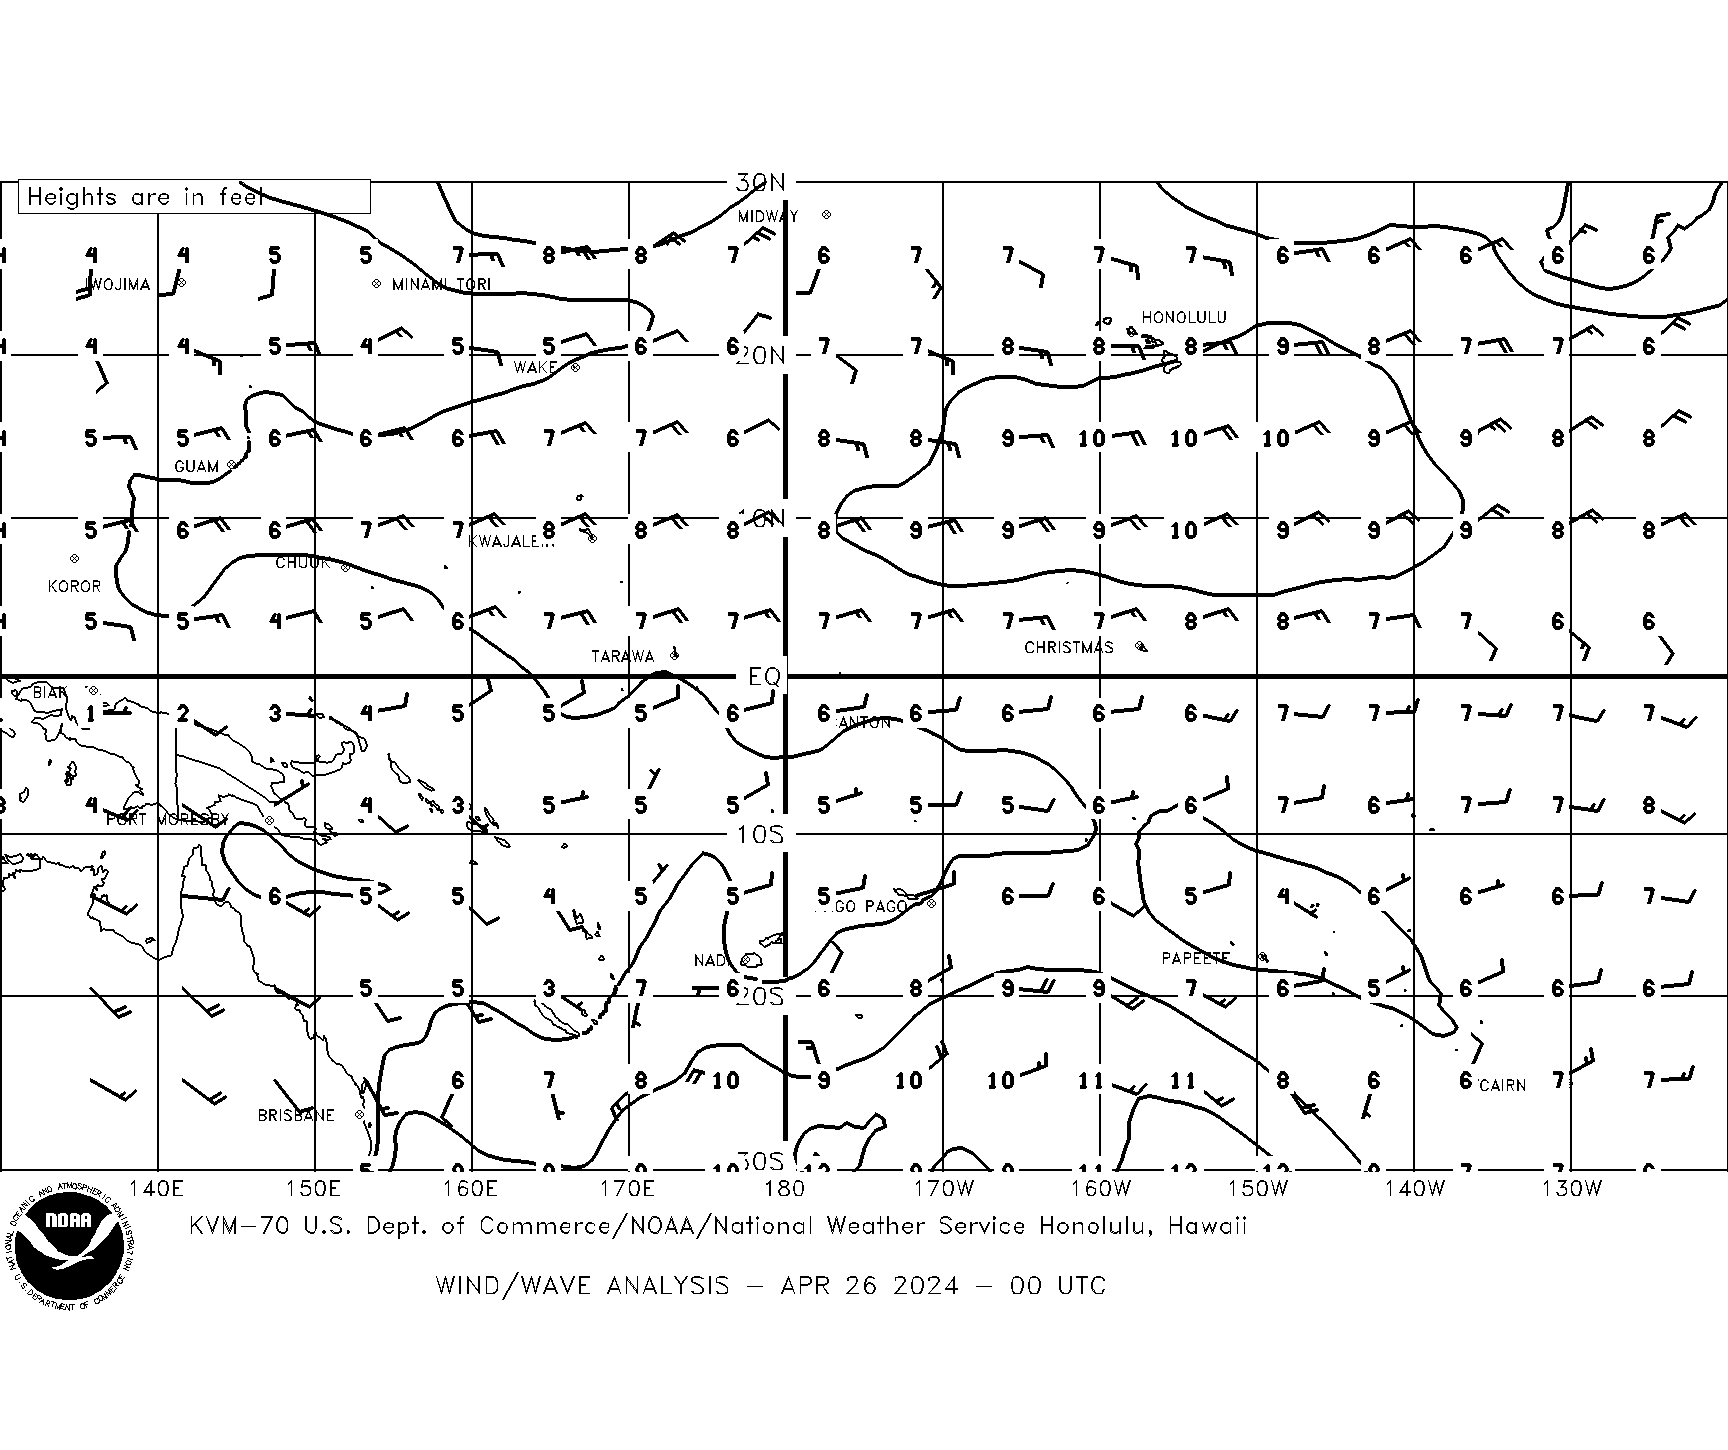 |
 |
| Wind/Wave Analysis VT12Z 30S-30N 120W-130E | |
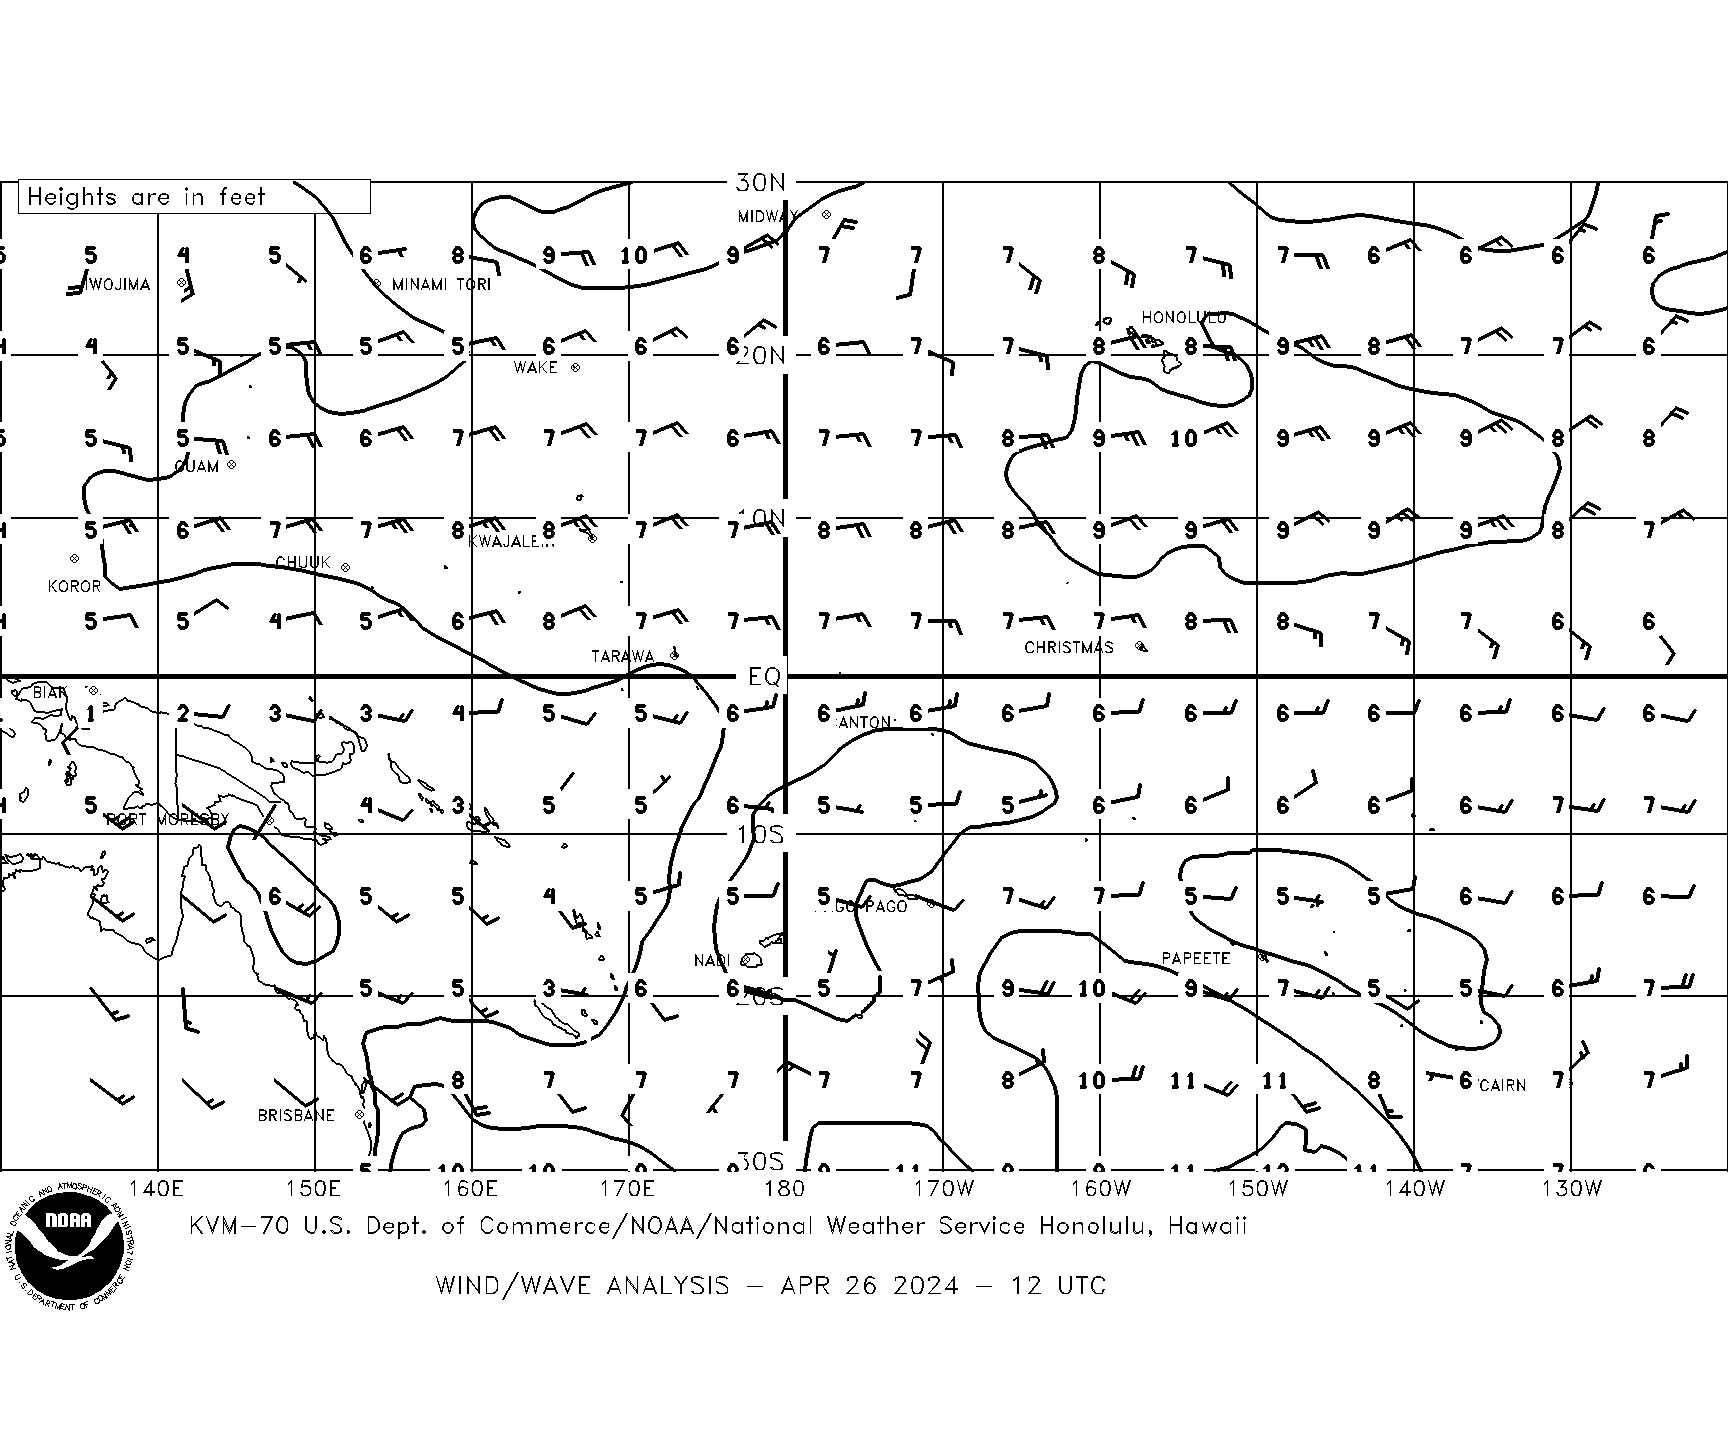 |
 |
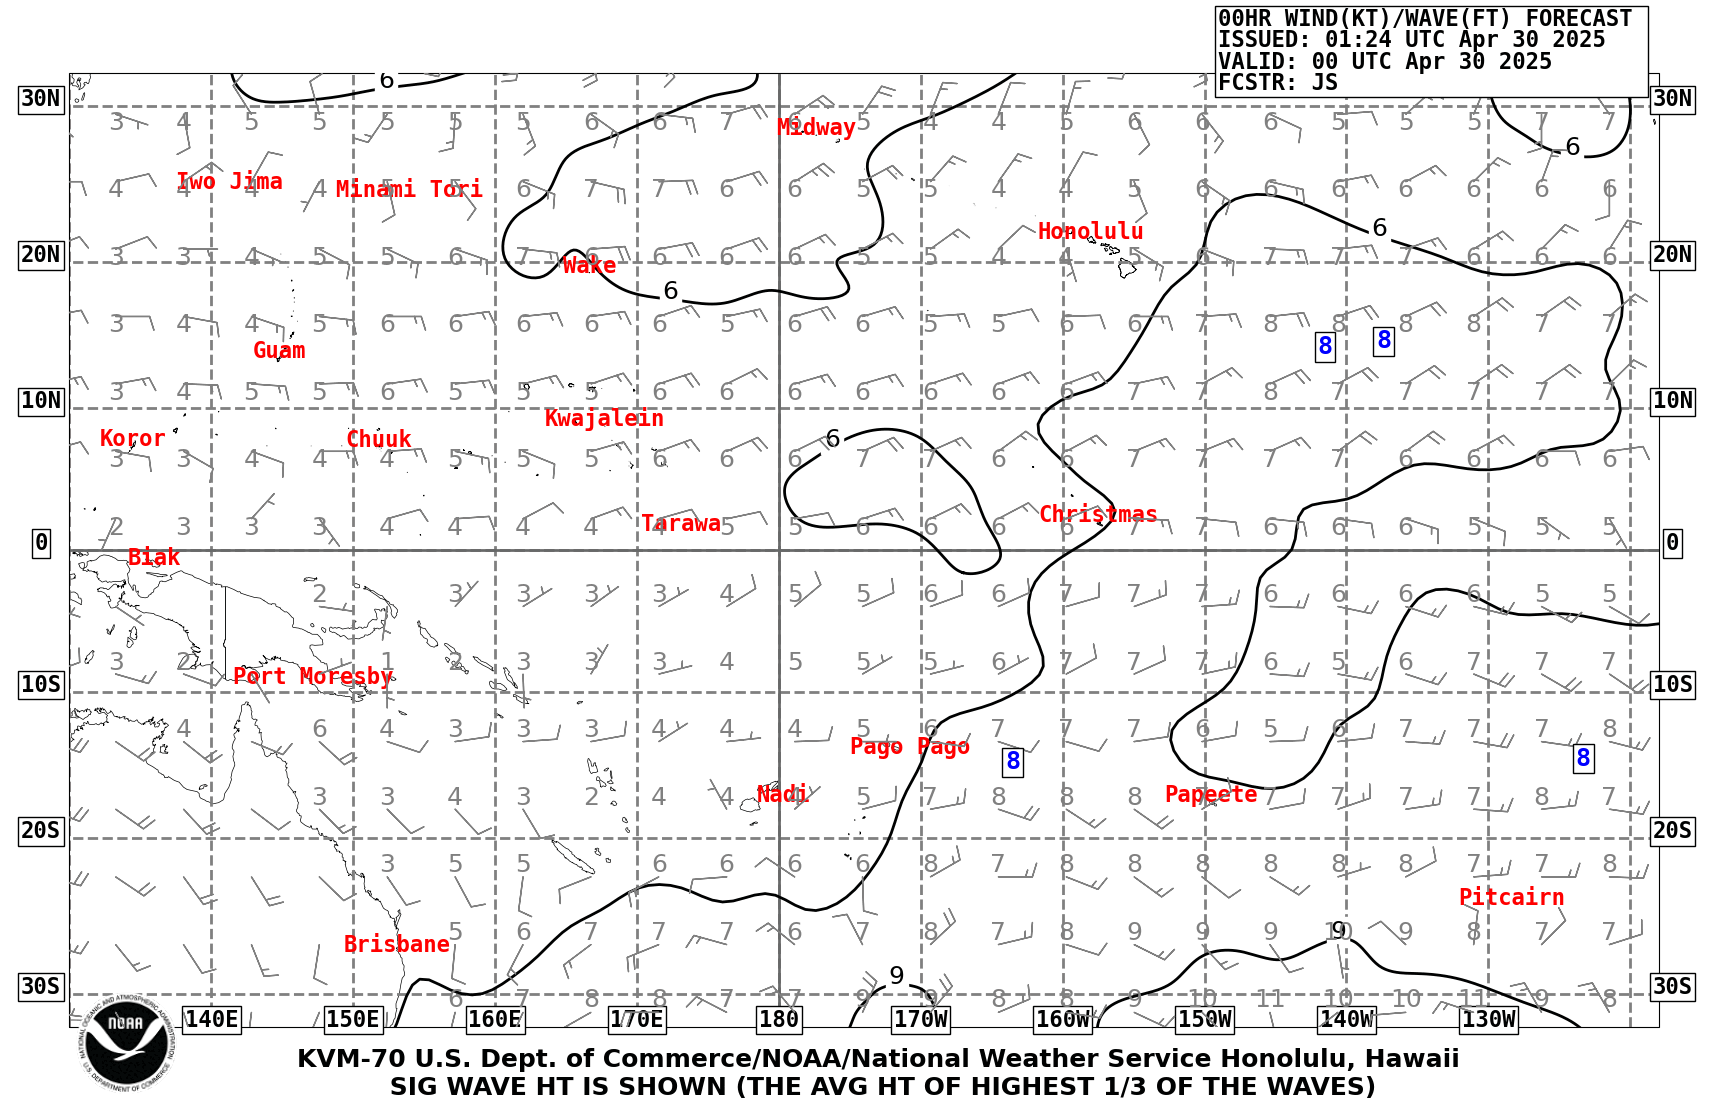
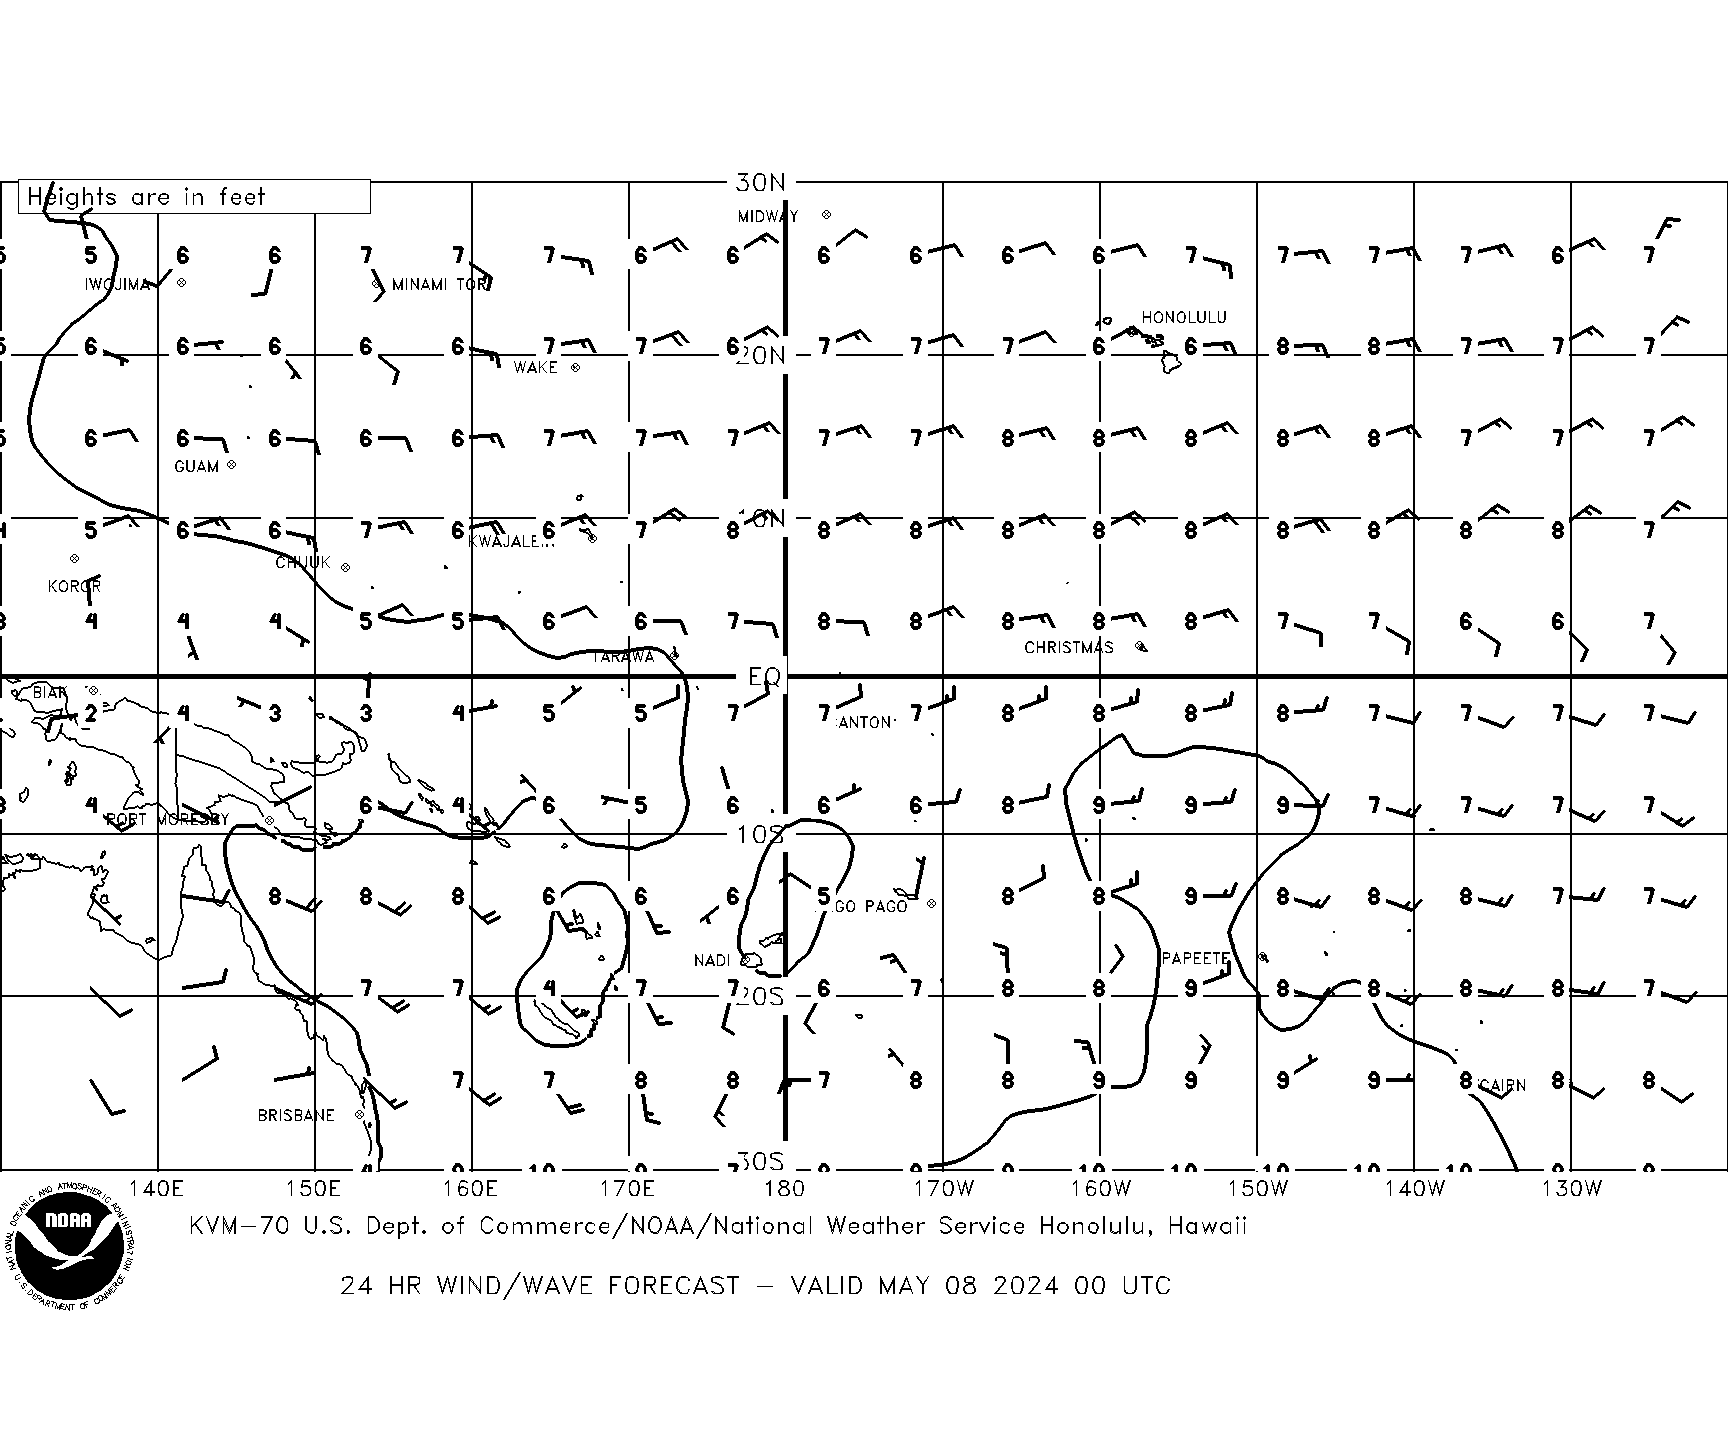
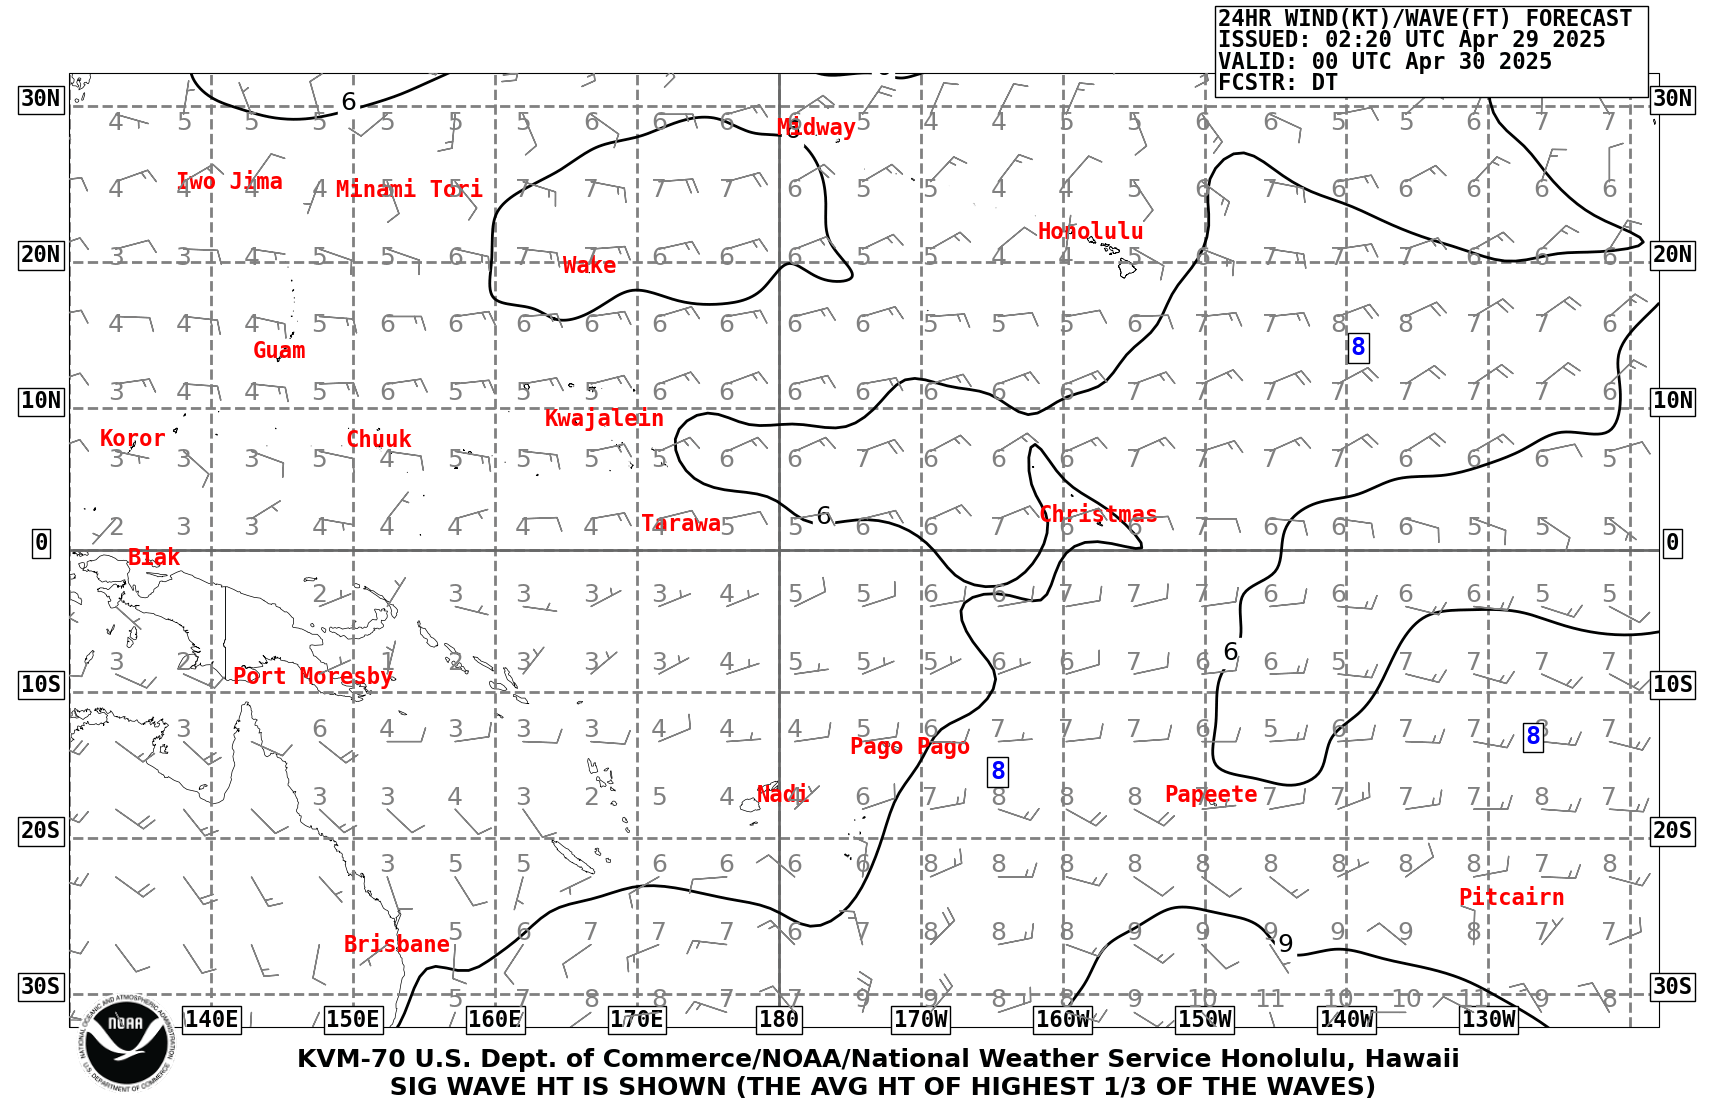
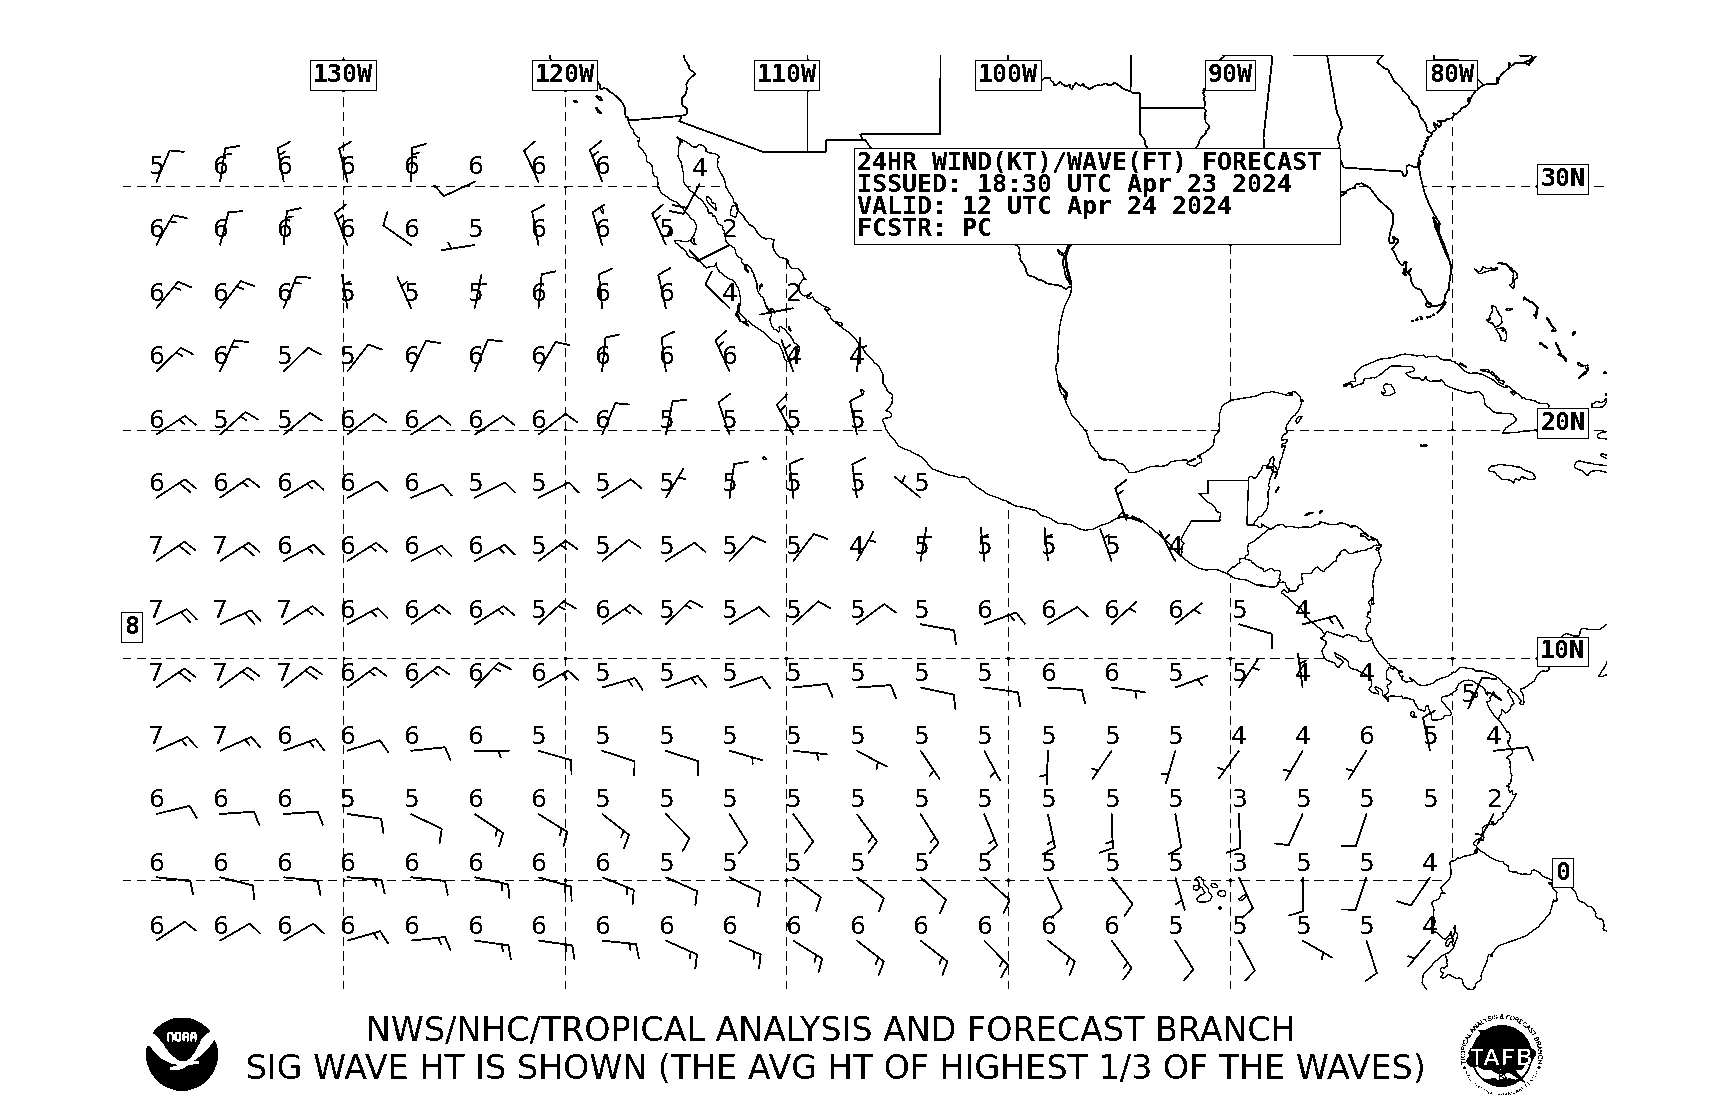
| 24 HR Wind/Wave Forecast VT00Z 30S-30N 120W-130E | |
 |
 |
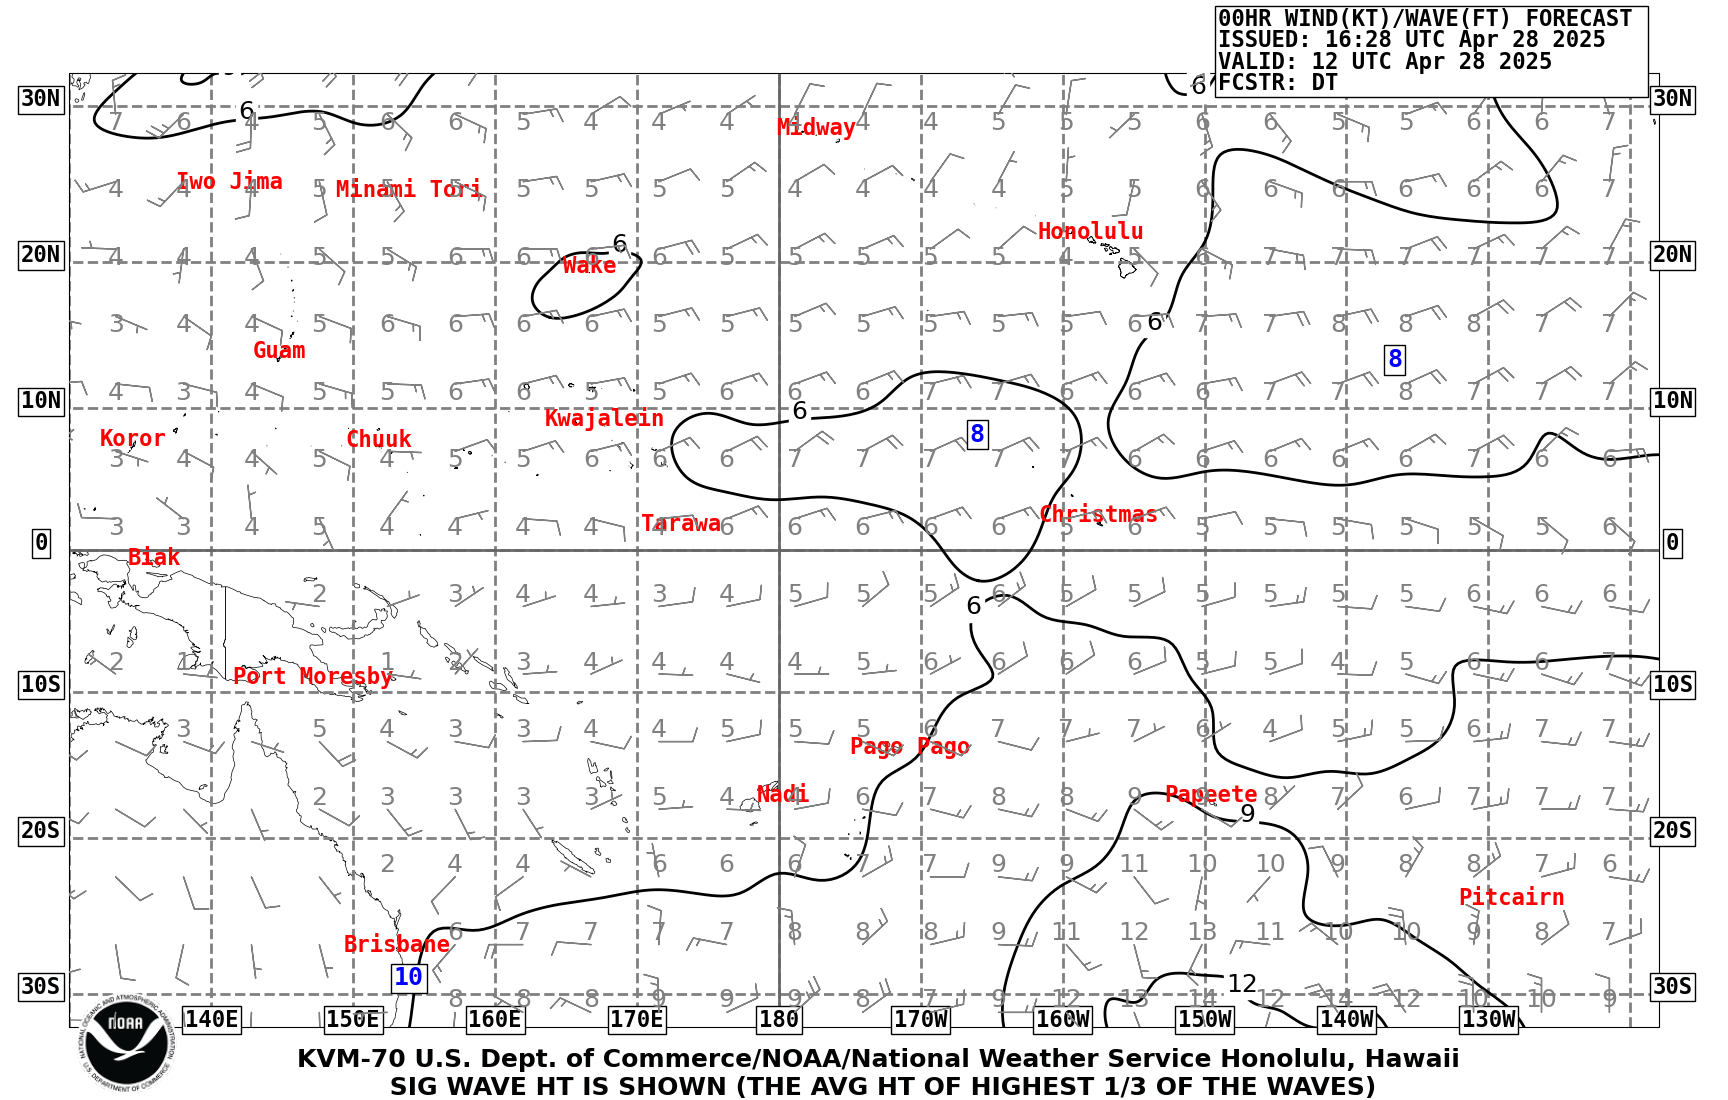
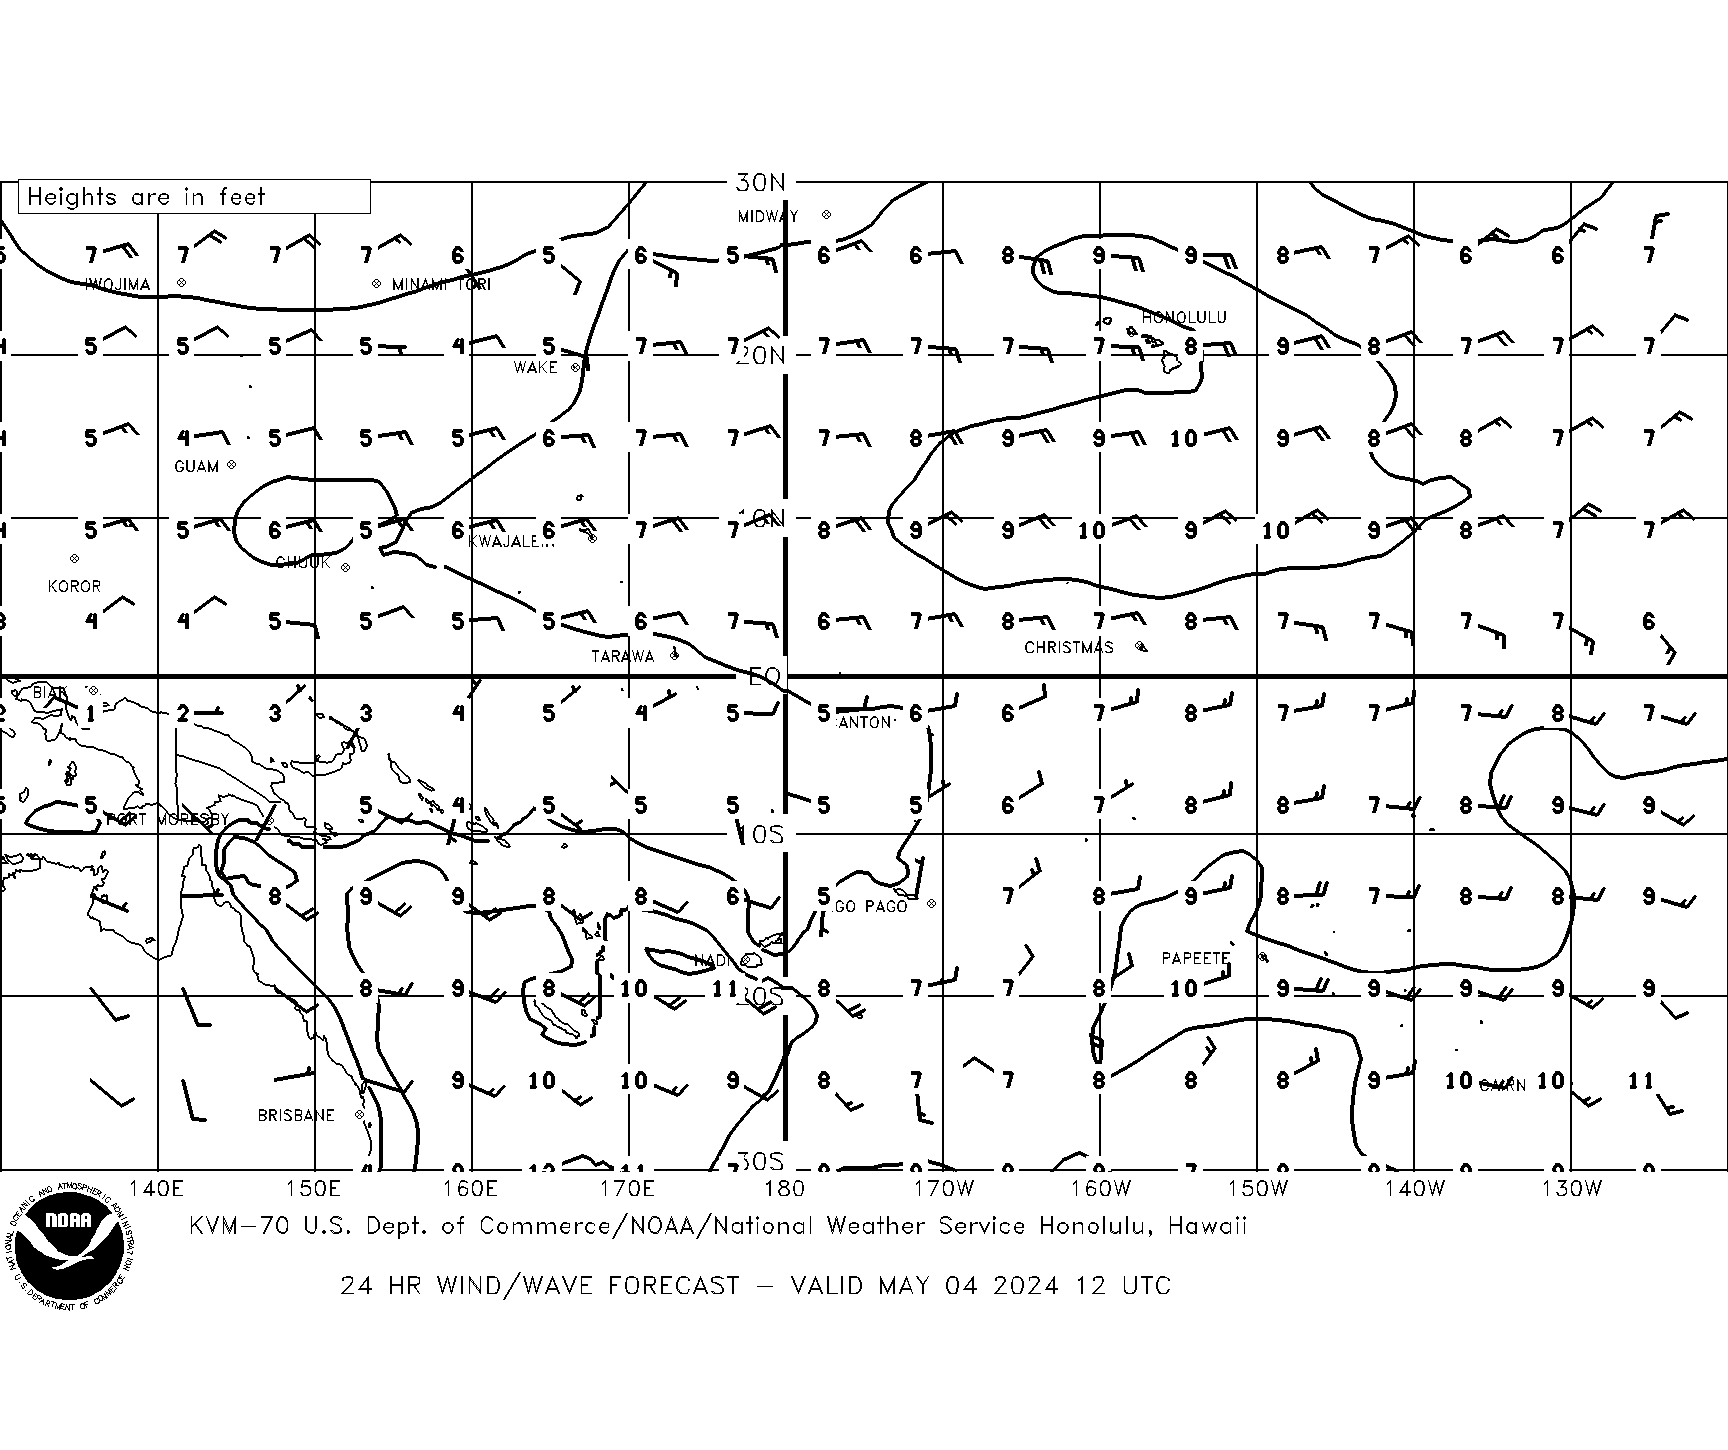
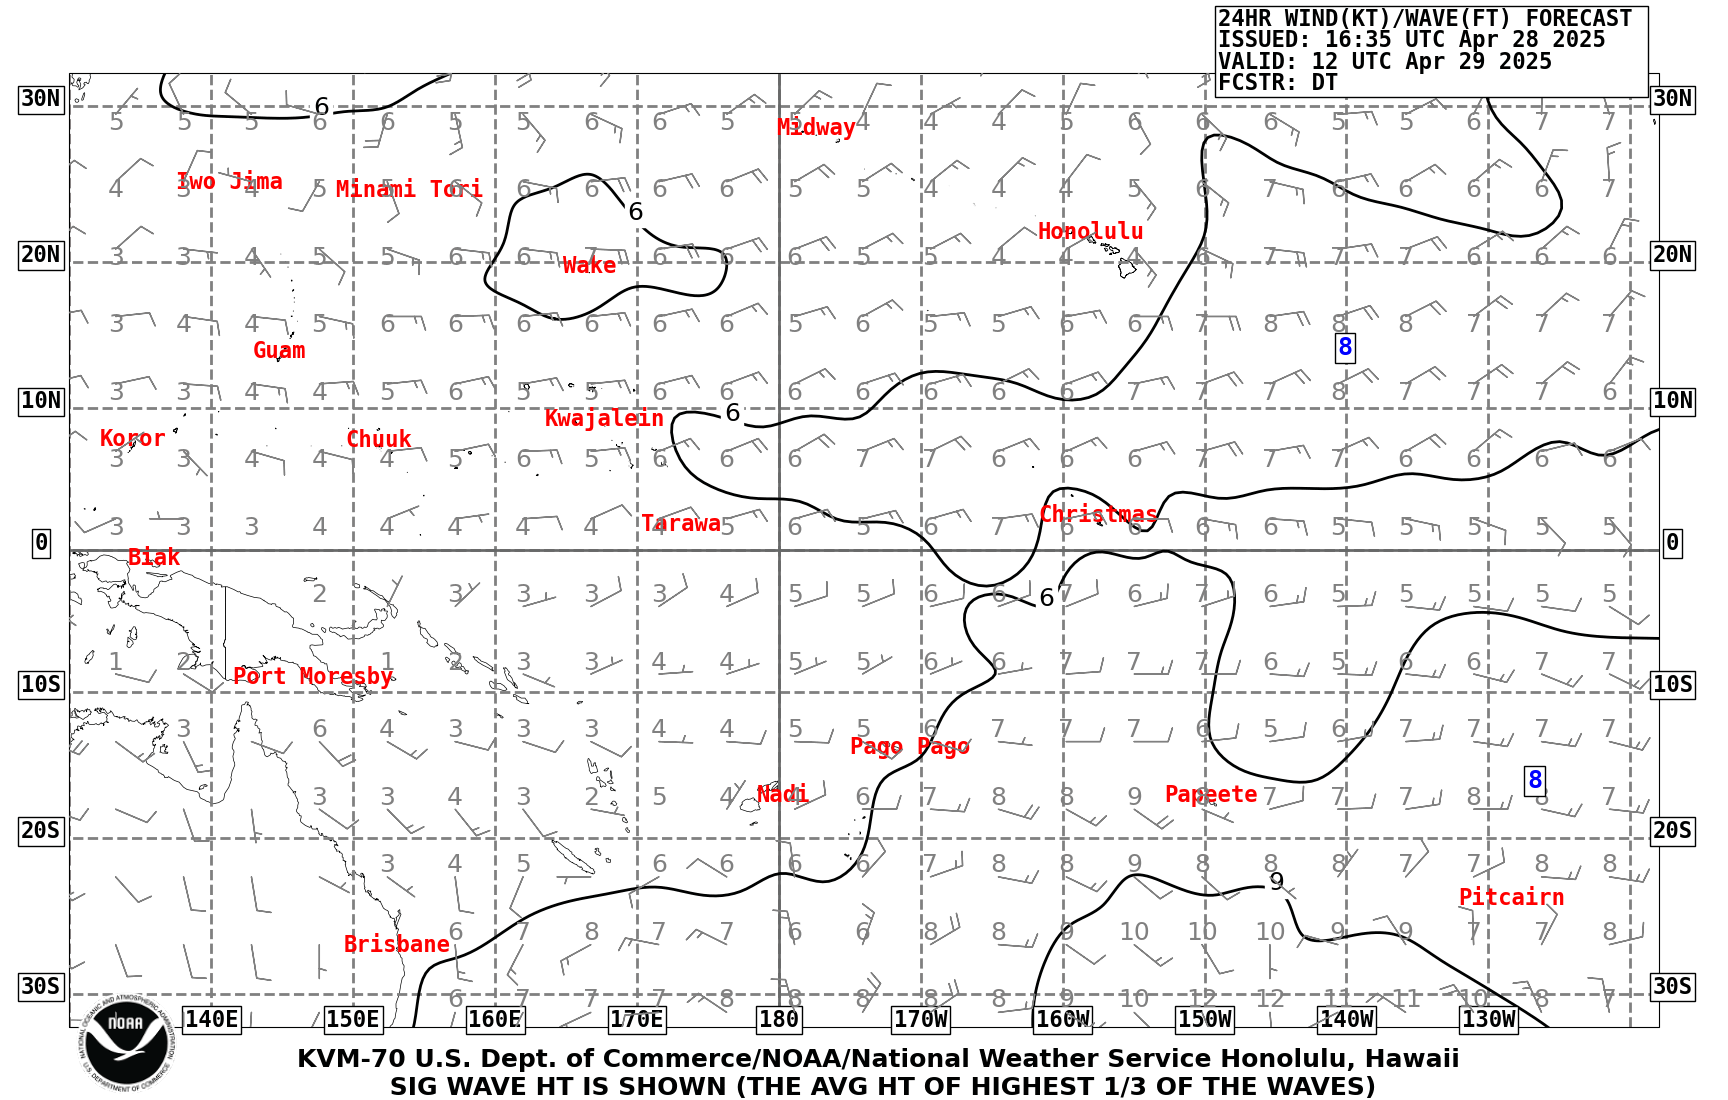
| 24 HR Wind/Wave Forecast VT12Z 30S-30N 120W-130E | |
 |
 |
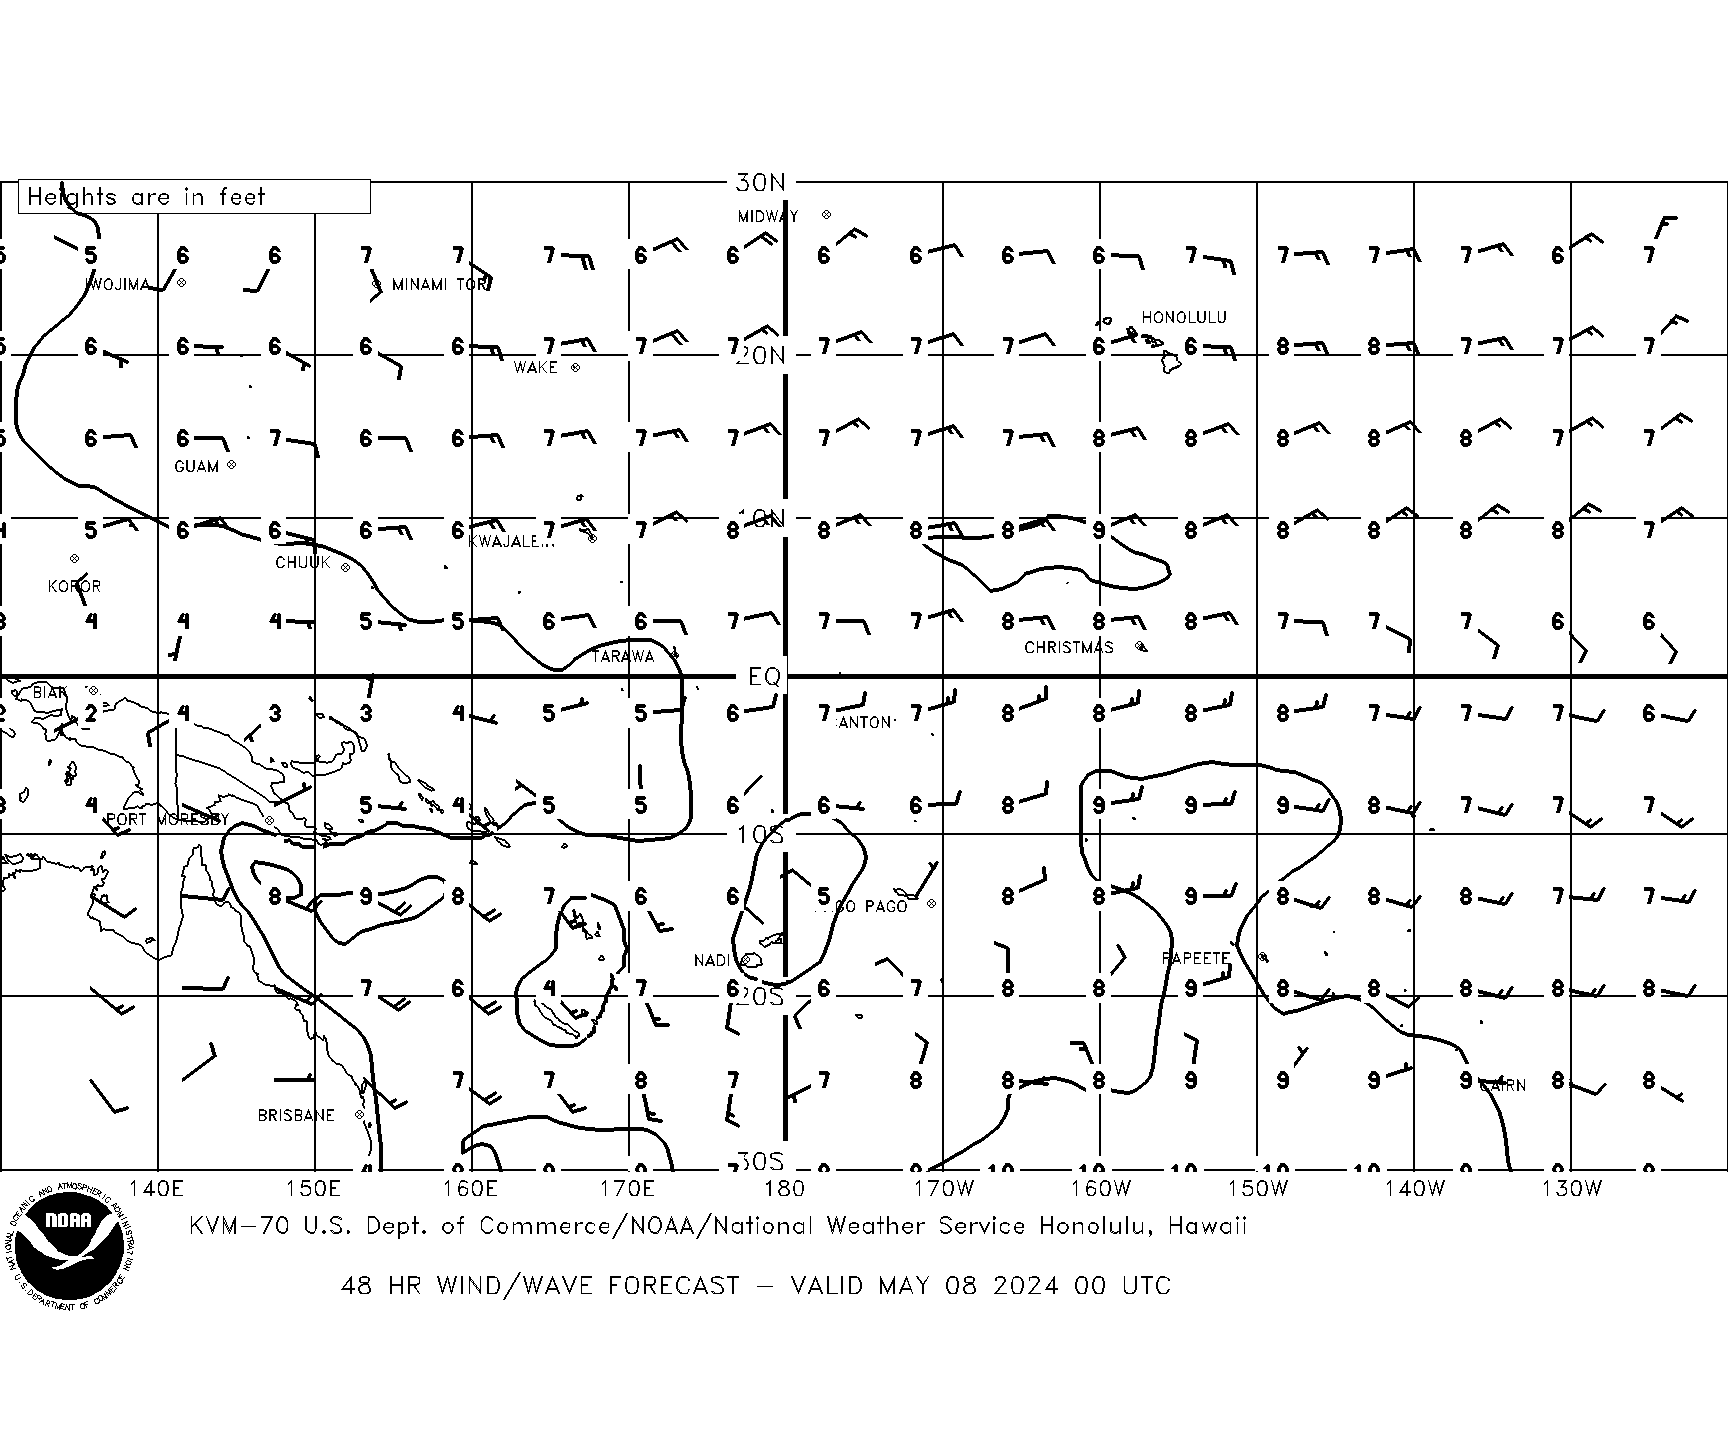
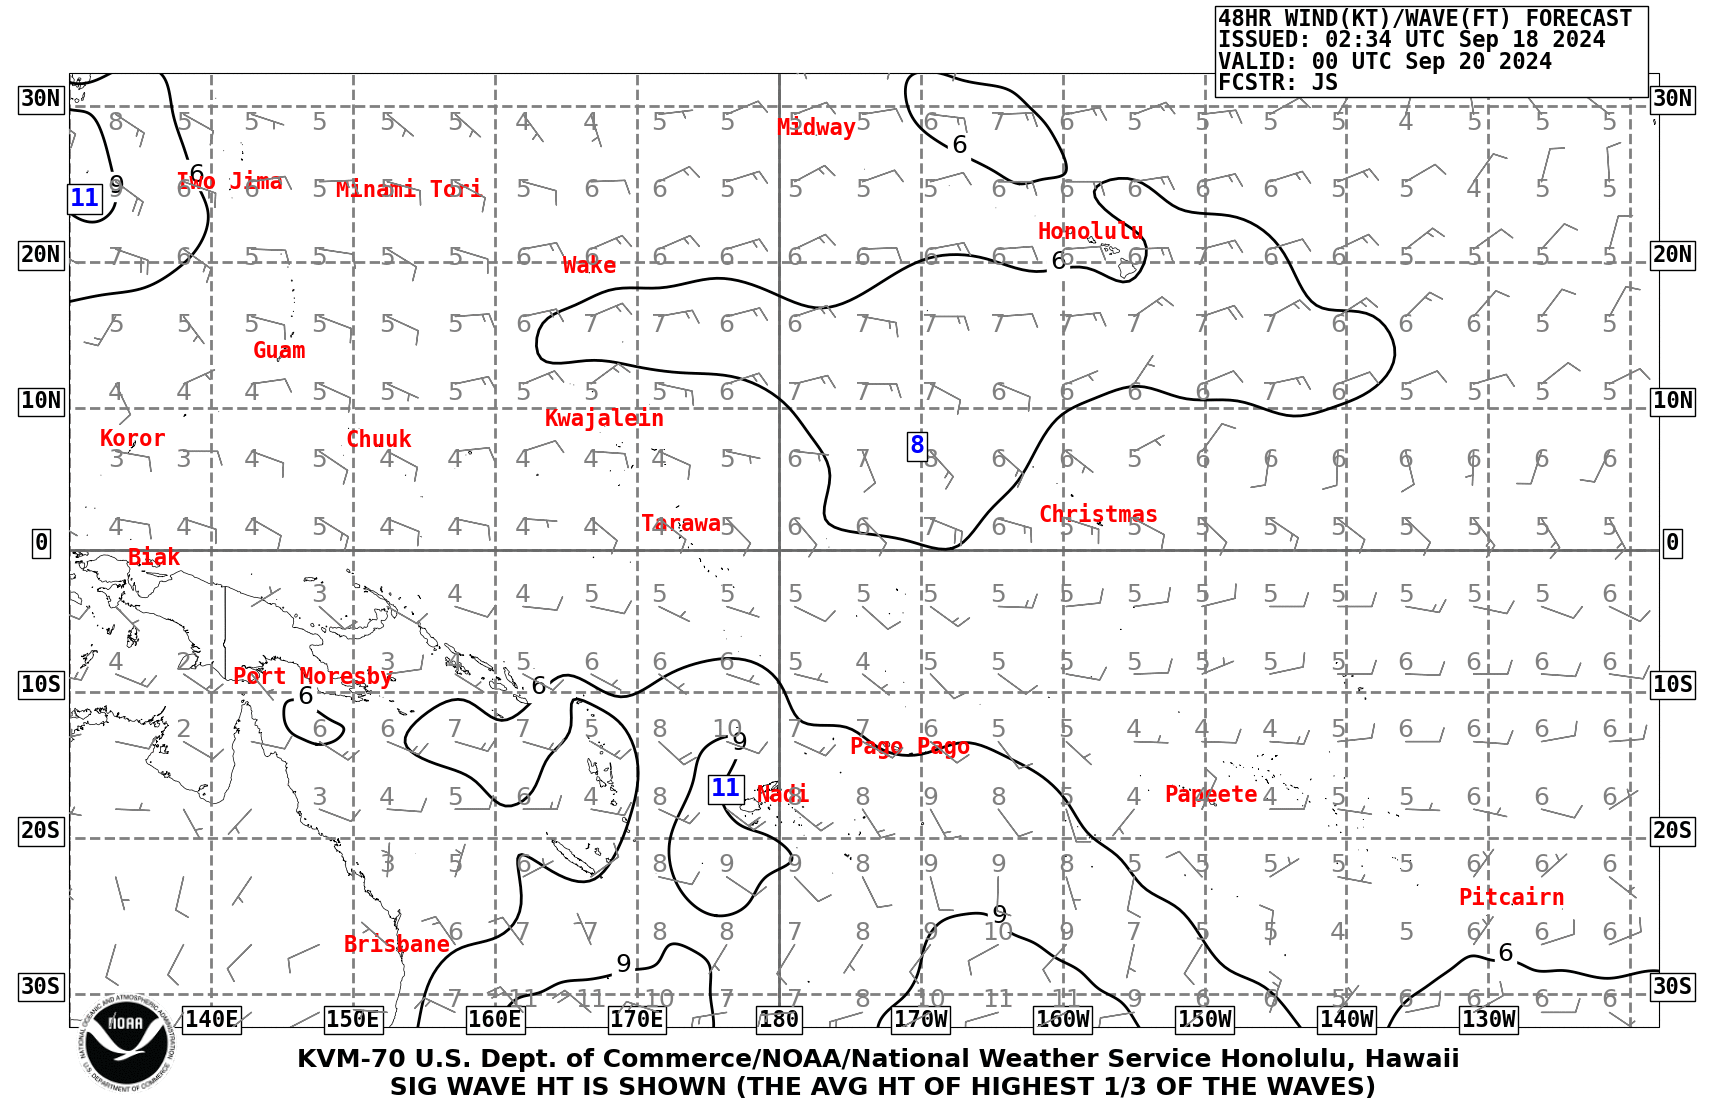
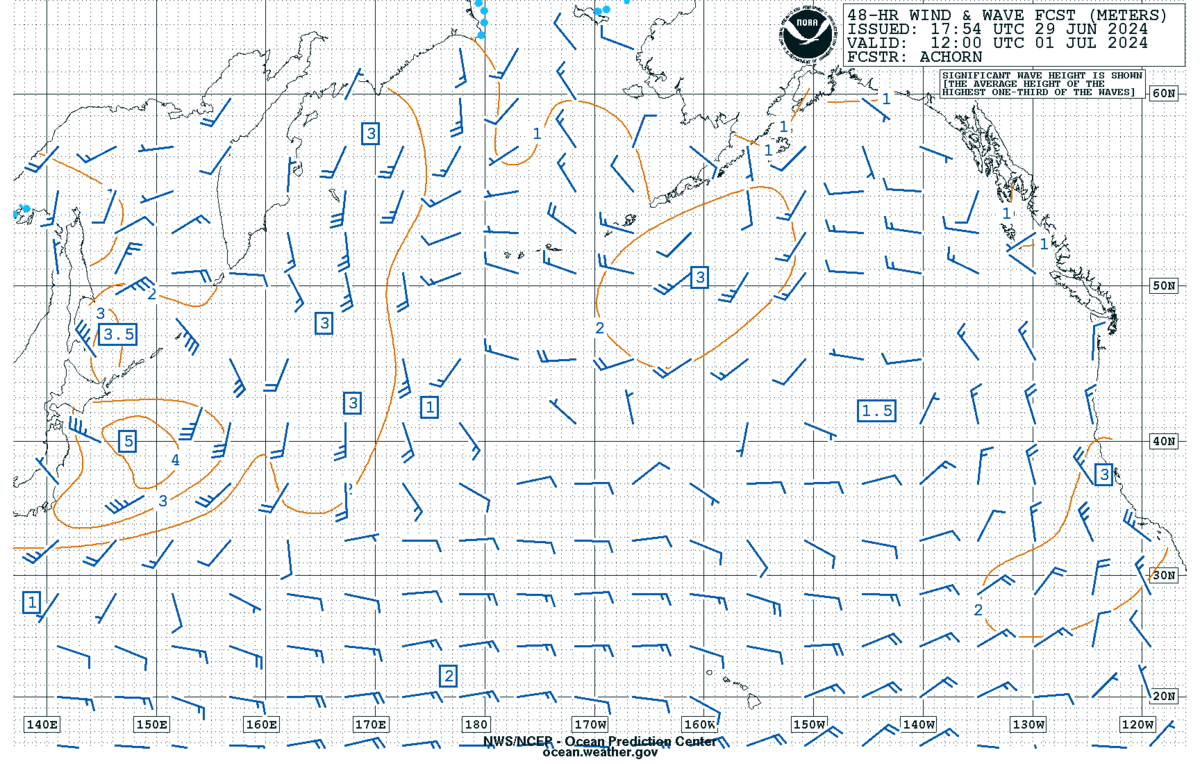
| 48 HR Wind/Wave Forecast VT00Z 30S-30N 120W-130E | |
 |
 |
| 48 HR Wind/Wave Forecast VT12Z 30S-30N 120W-130E | |
 |
 |
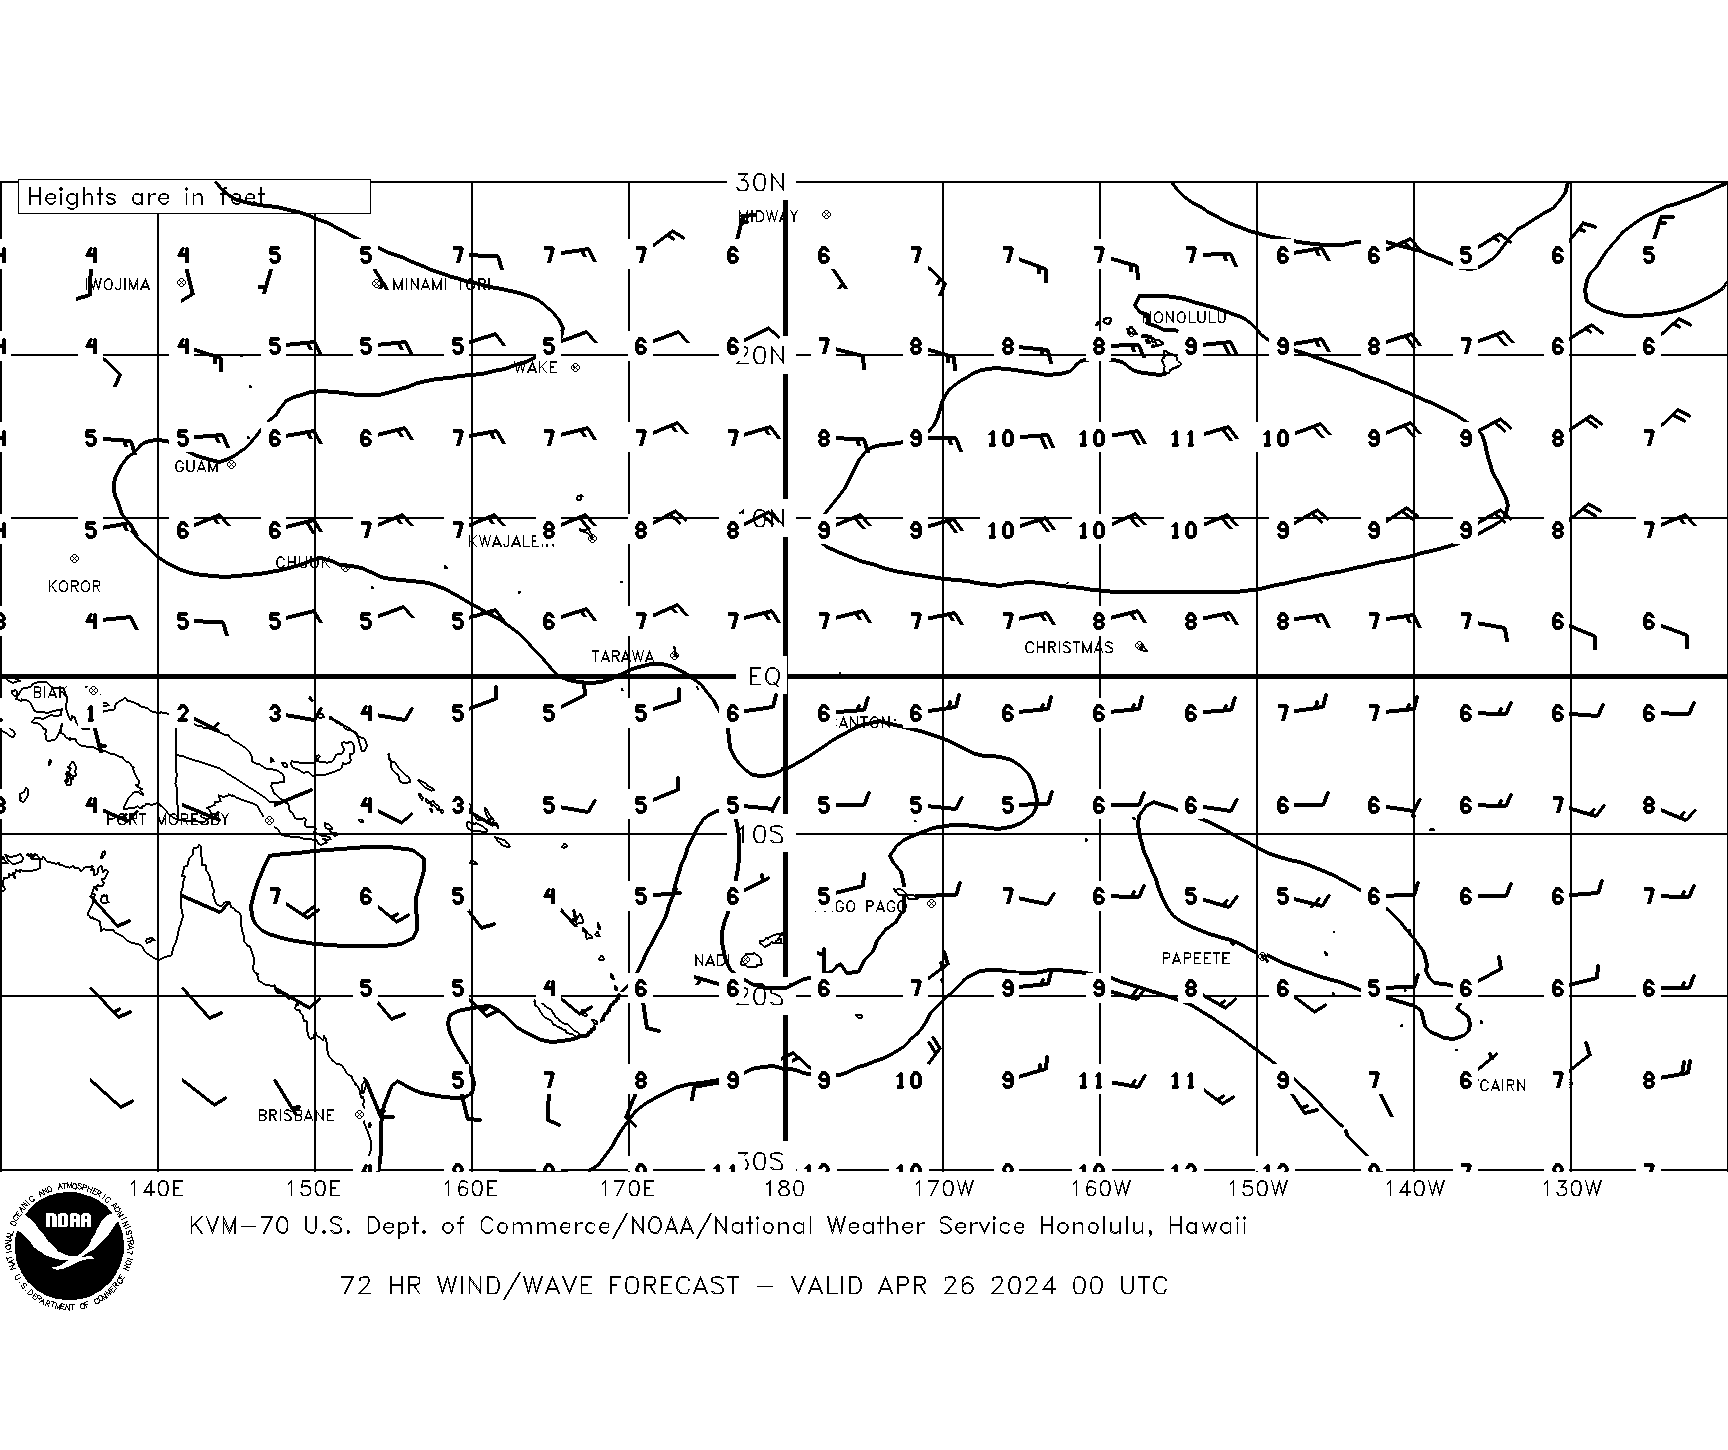
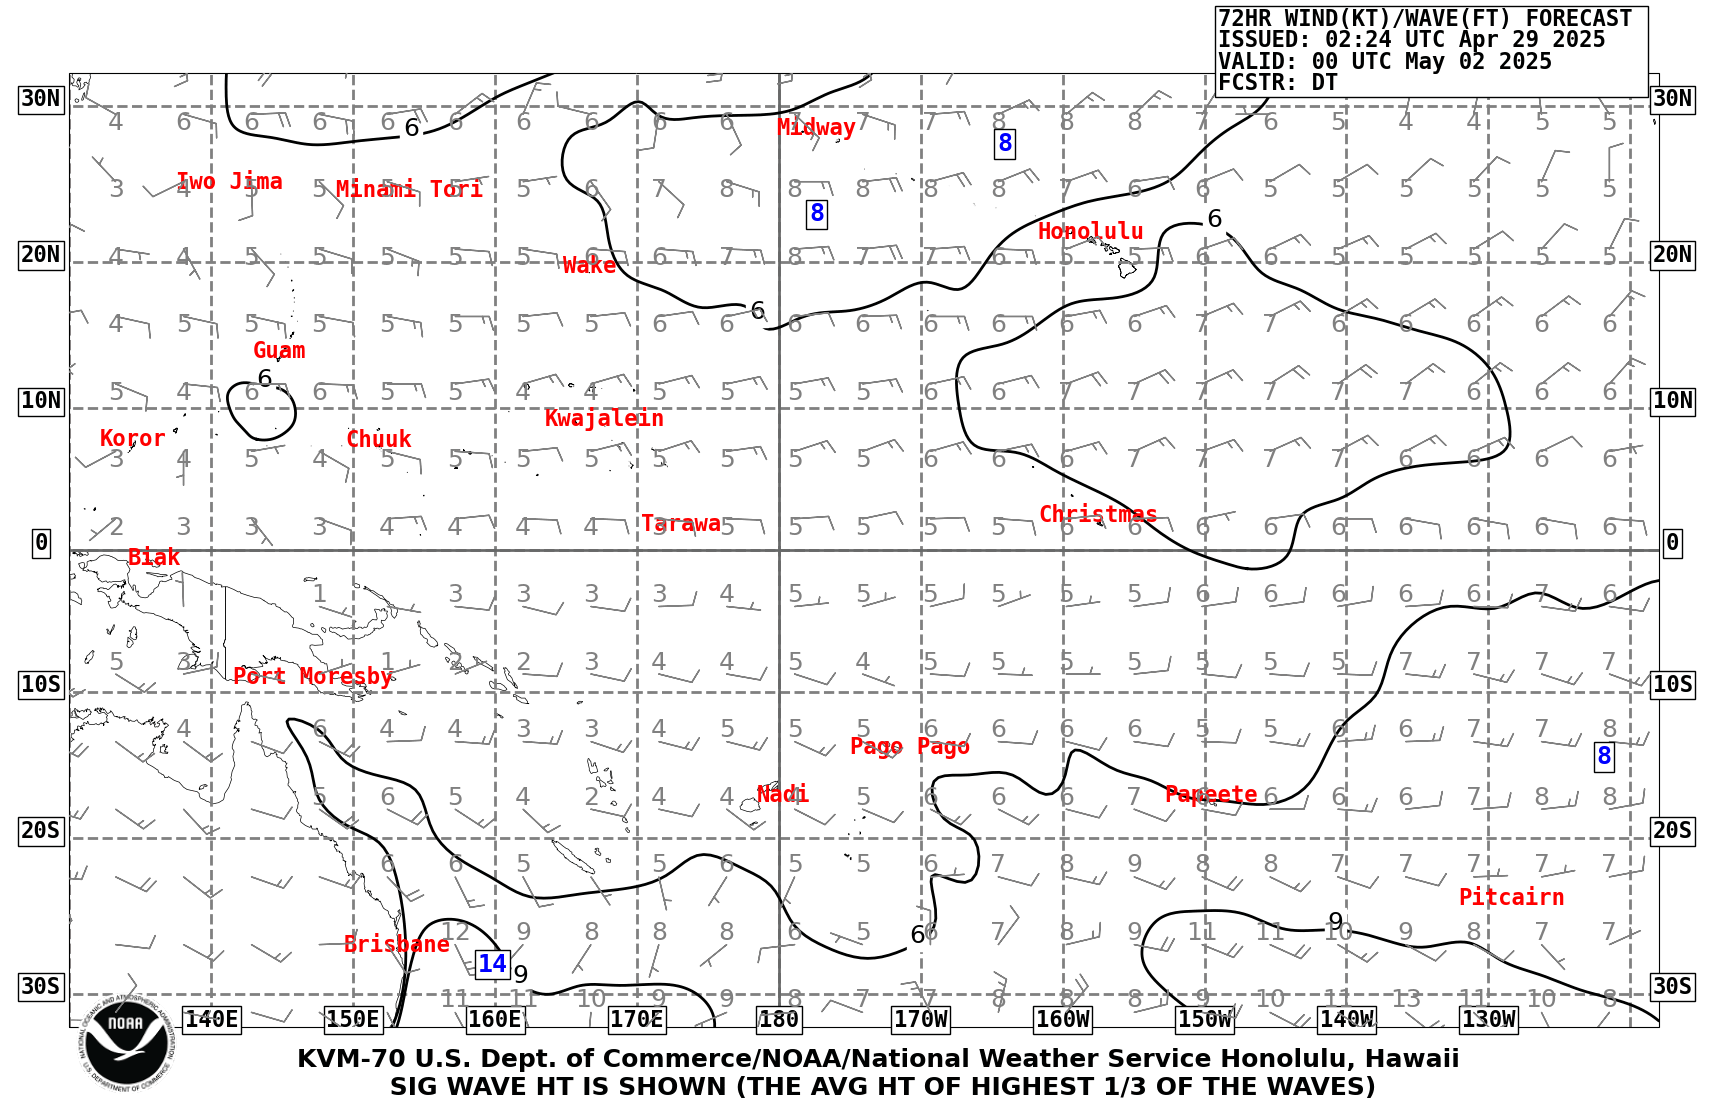
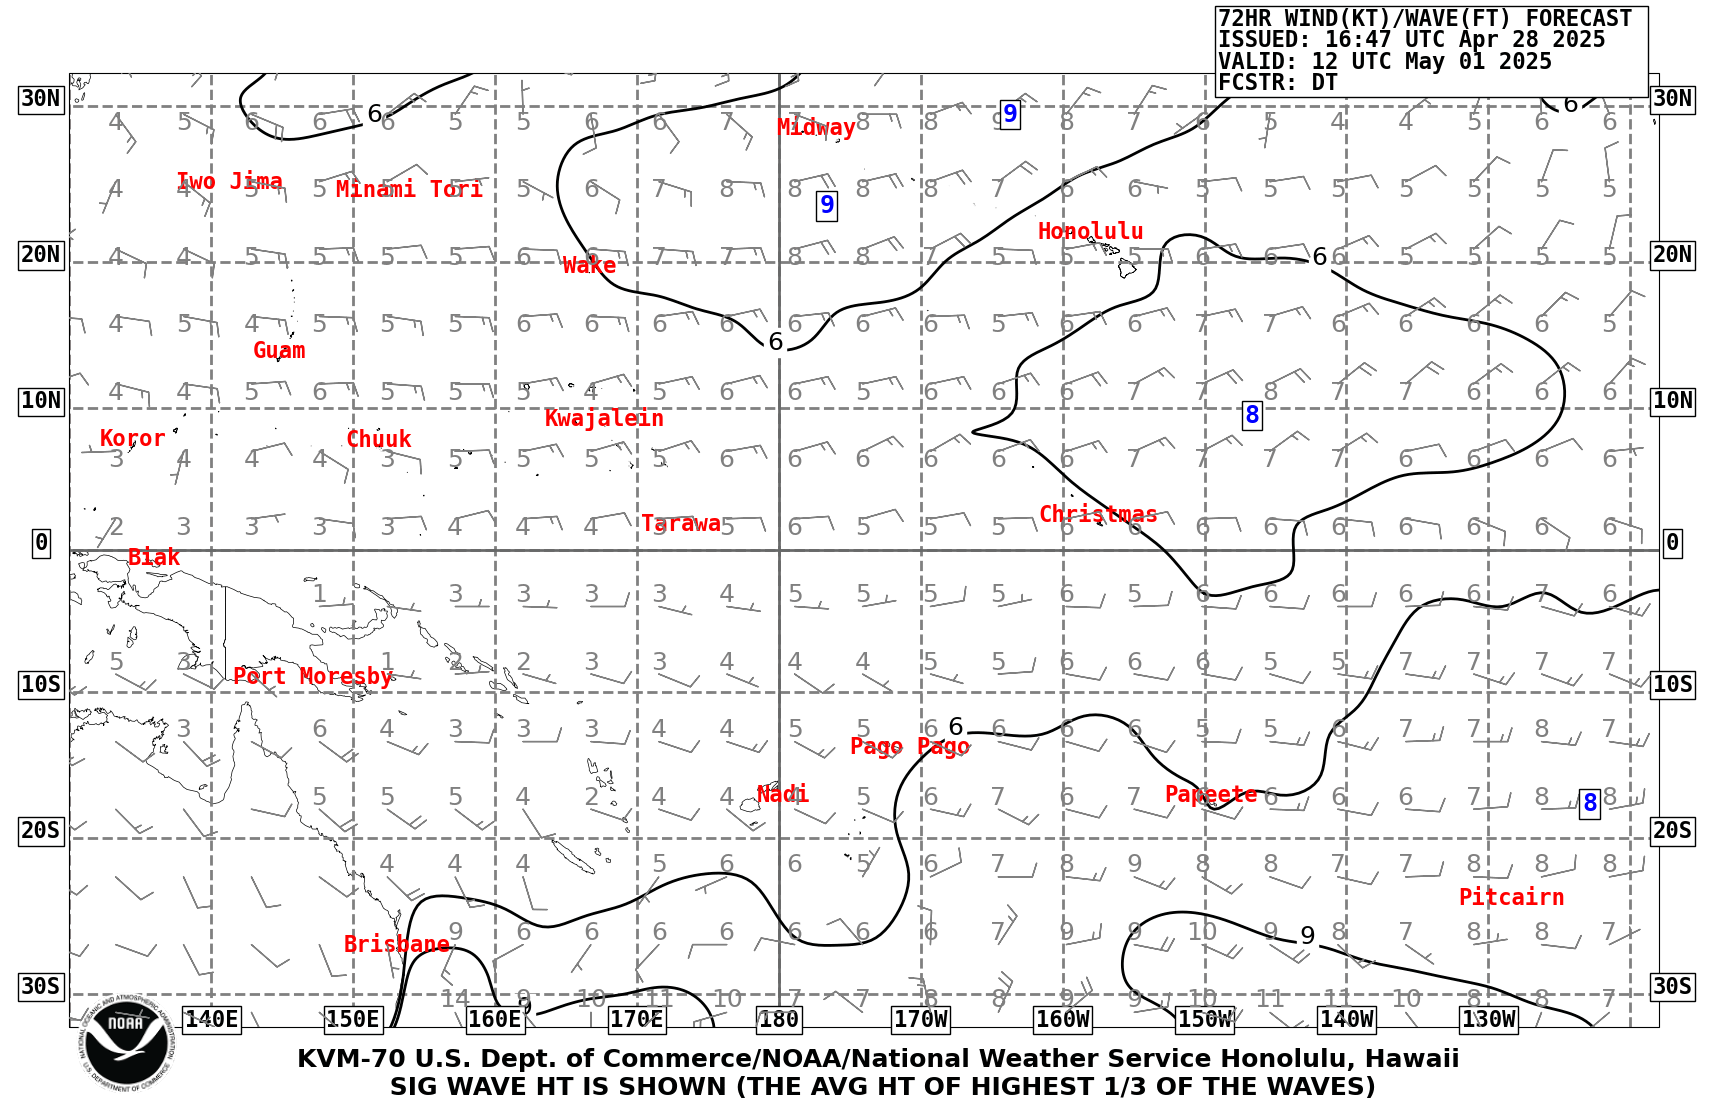
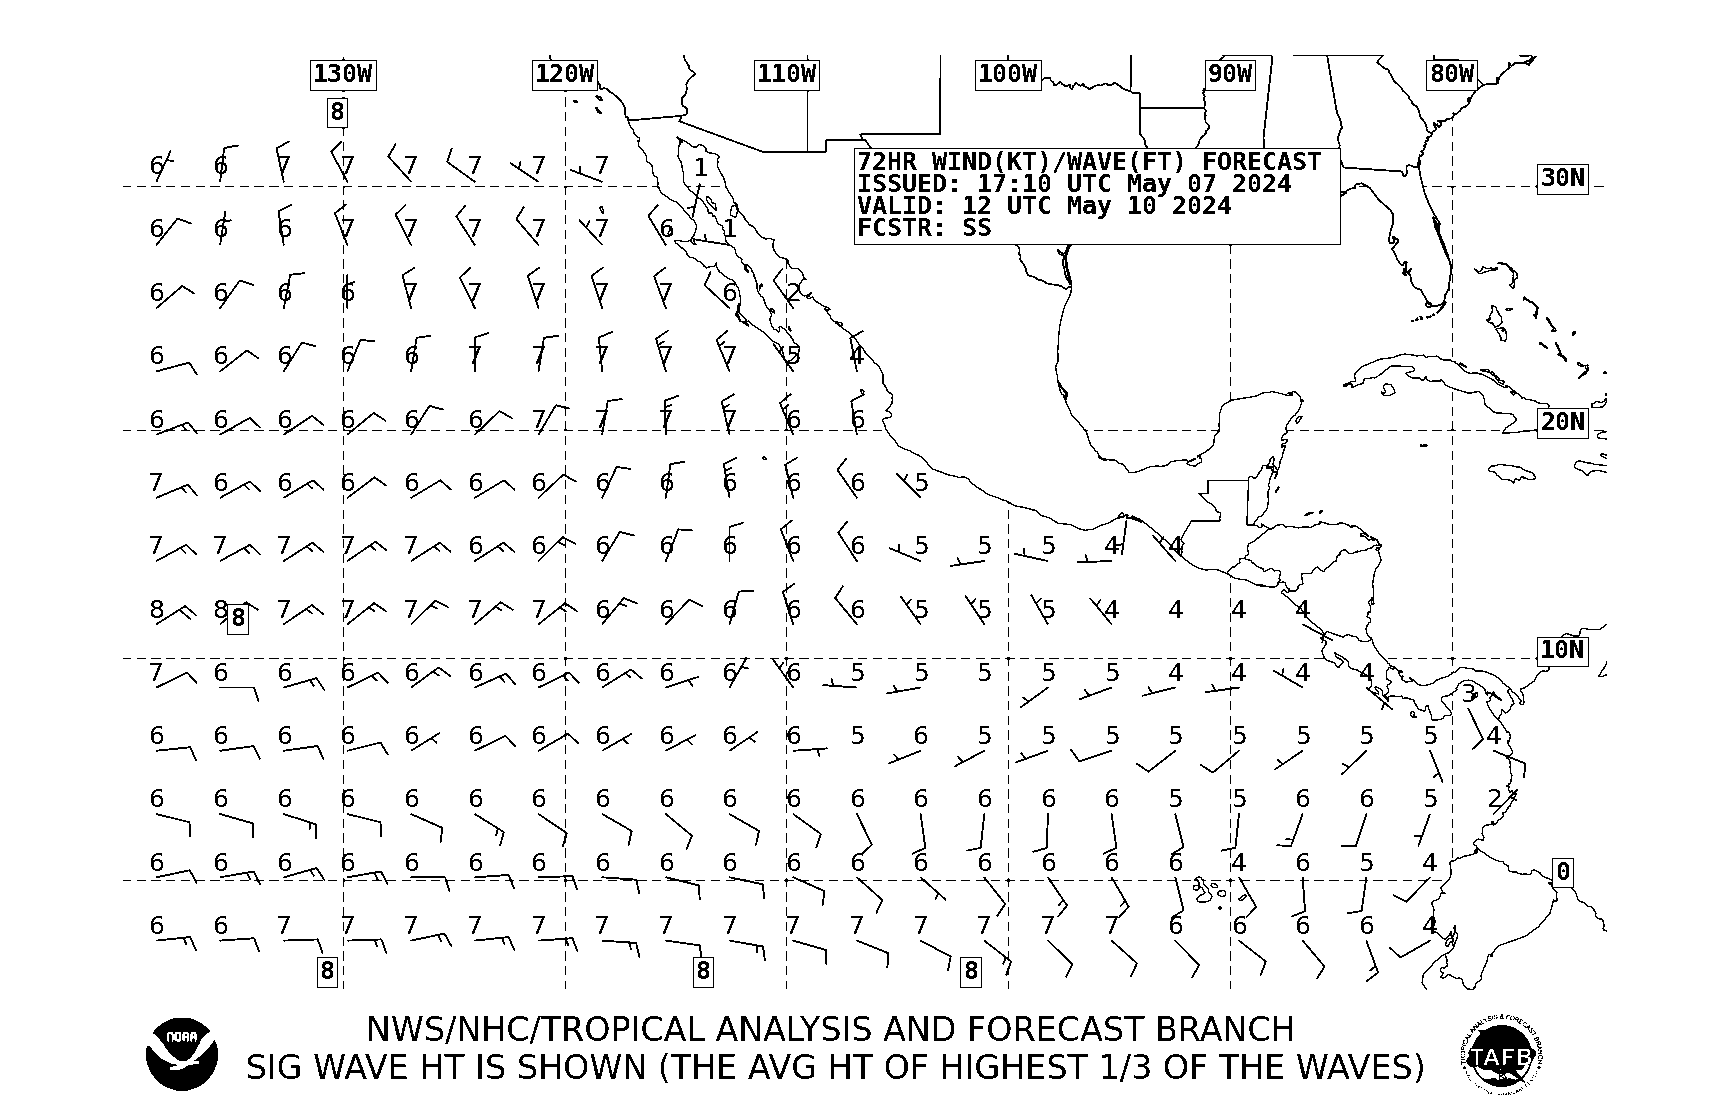
| 72 HR Wind/Wave Forecast VT00Z 30S-30N 120W-130E | |
 |
 |
| 72 HR Wind/Wave Forecast VT12Z 30S-30N 120W-130E | |
 |
 |
| Wind/Wave Charts - Southeast Pacific | ||
|---|---|---|
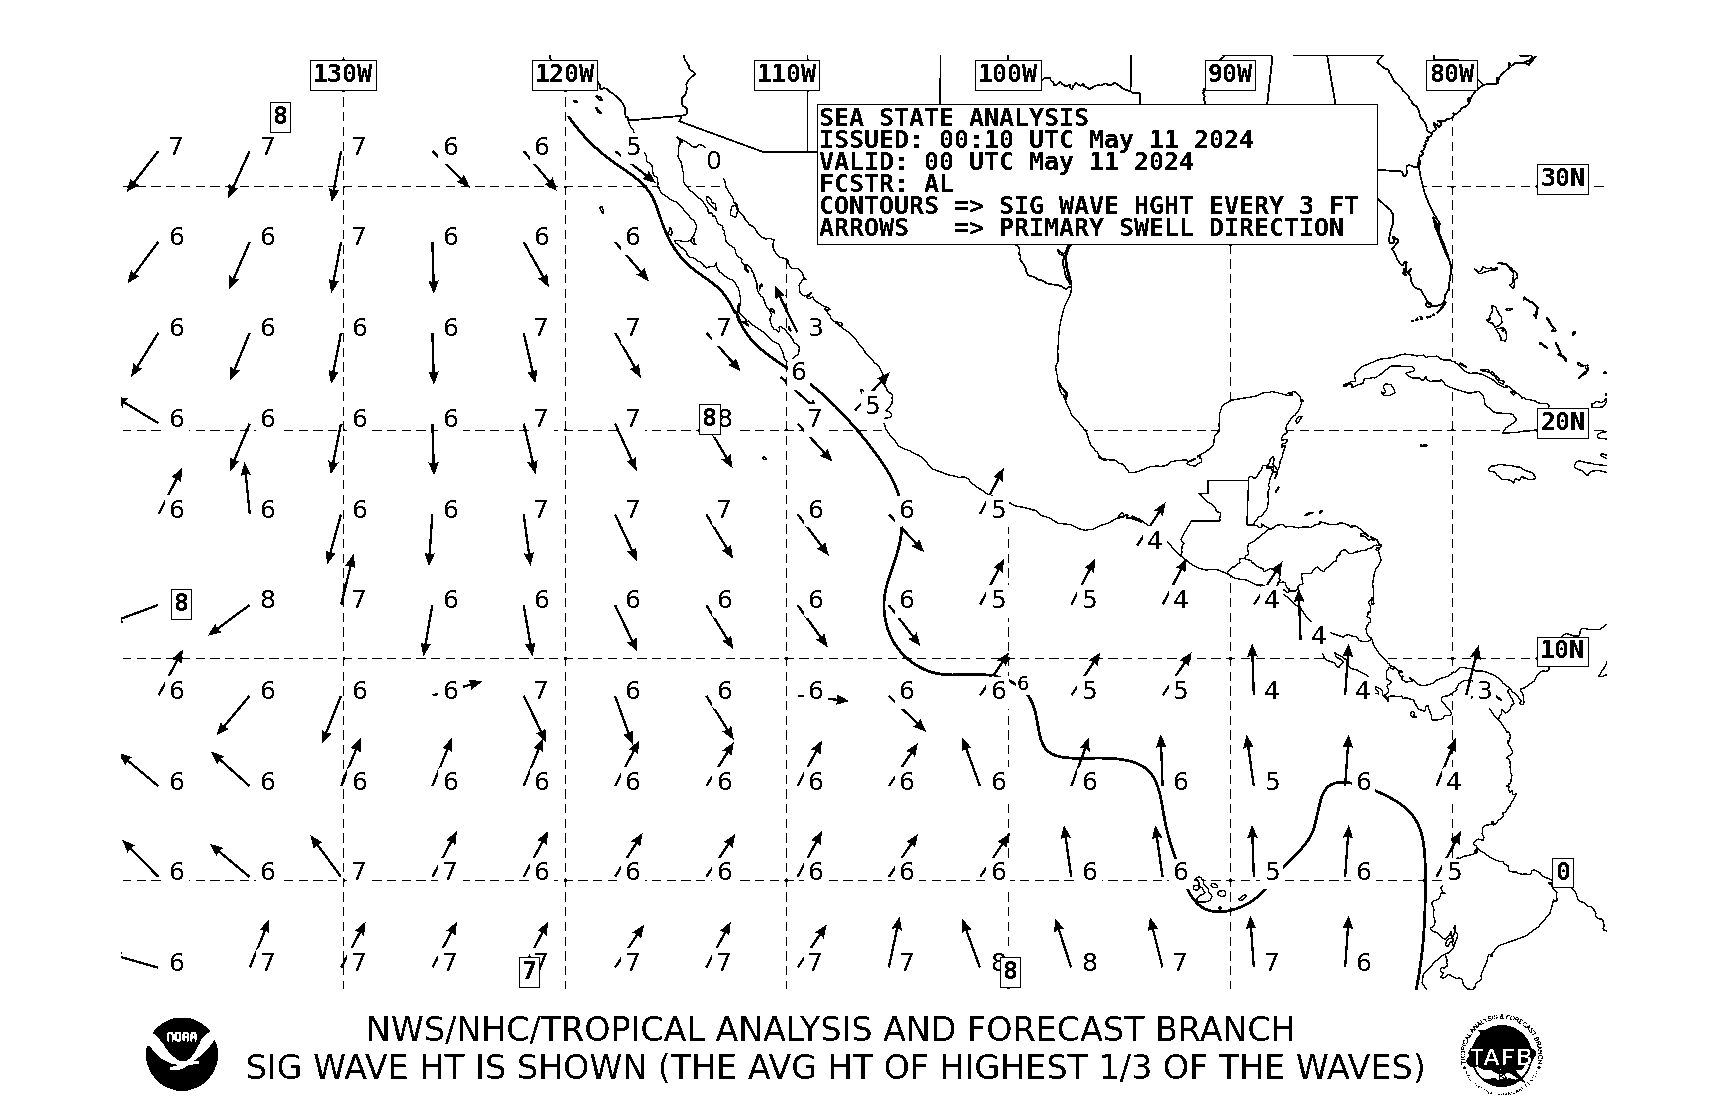
| Sea State Analysis VT00Z 20S-30N E of 145W | |
 |
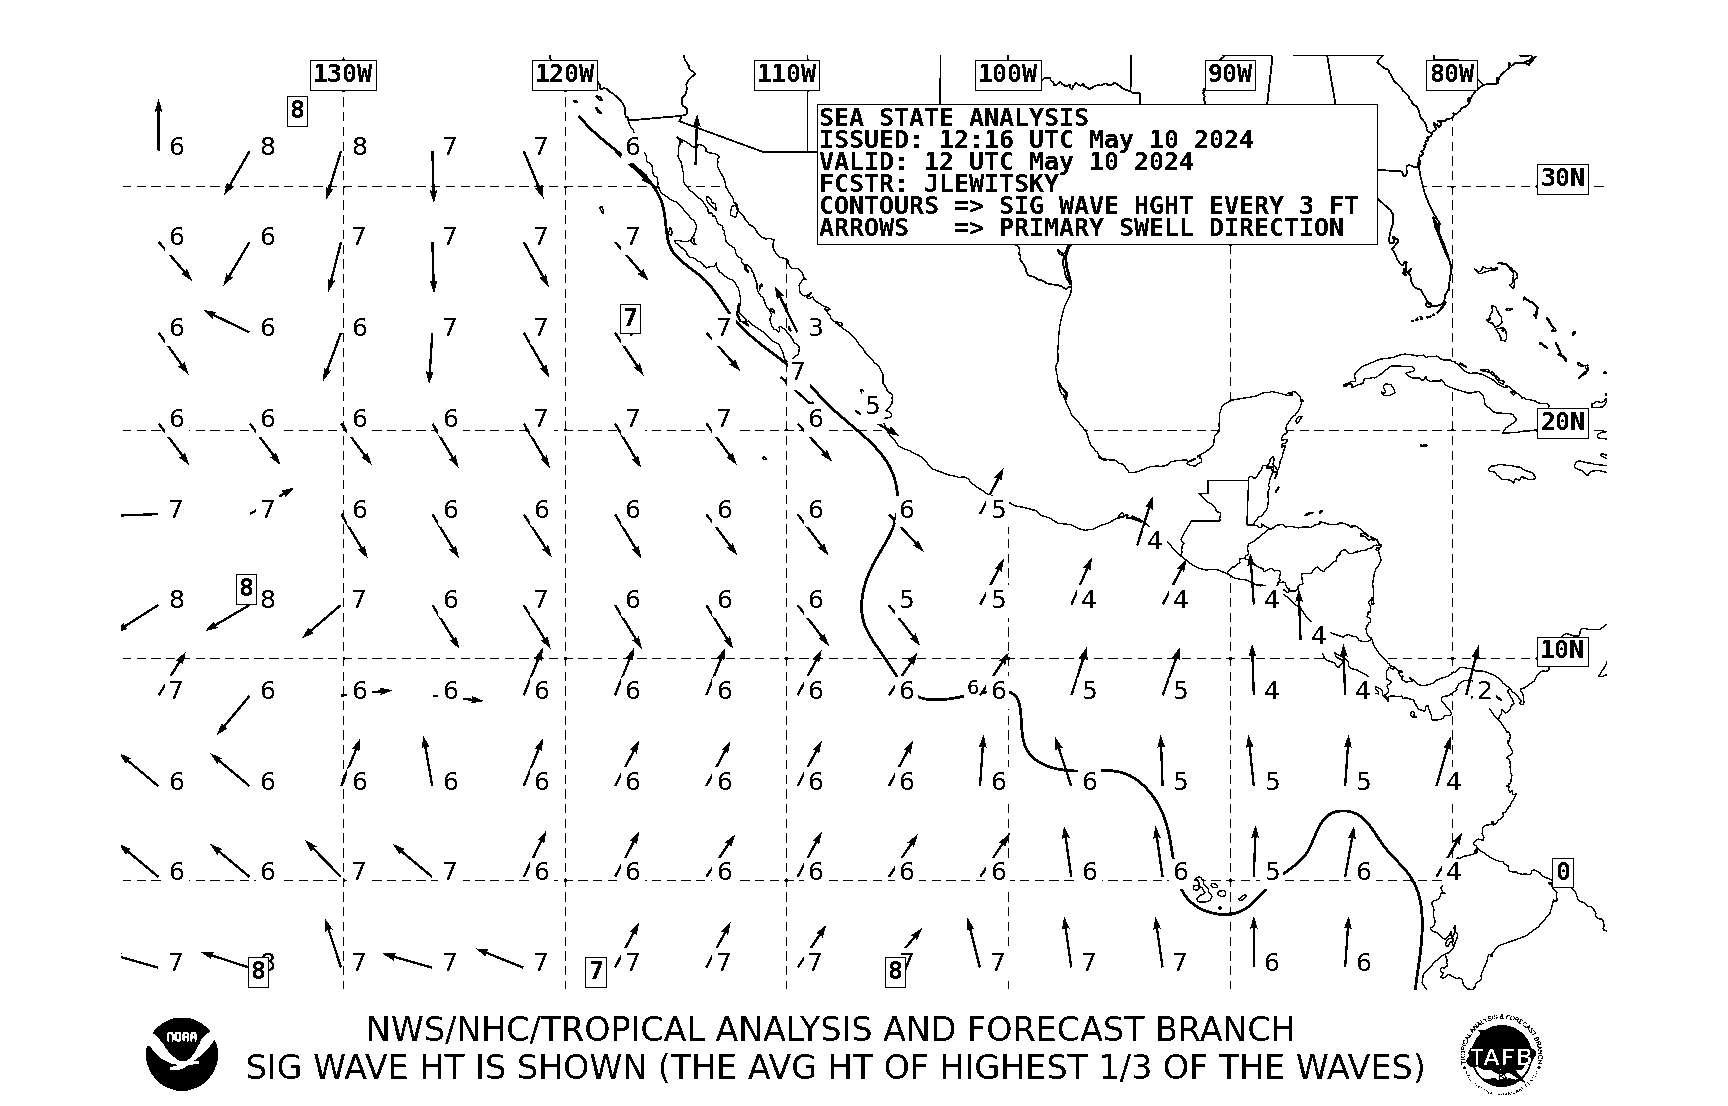
| Sea State Analysis VT12Z 20S-30N E of 145W | |
 |
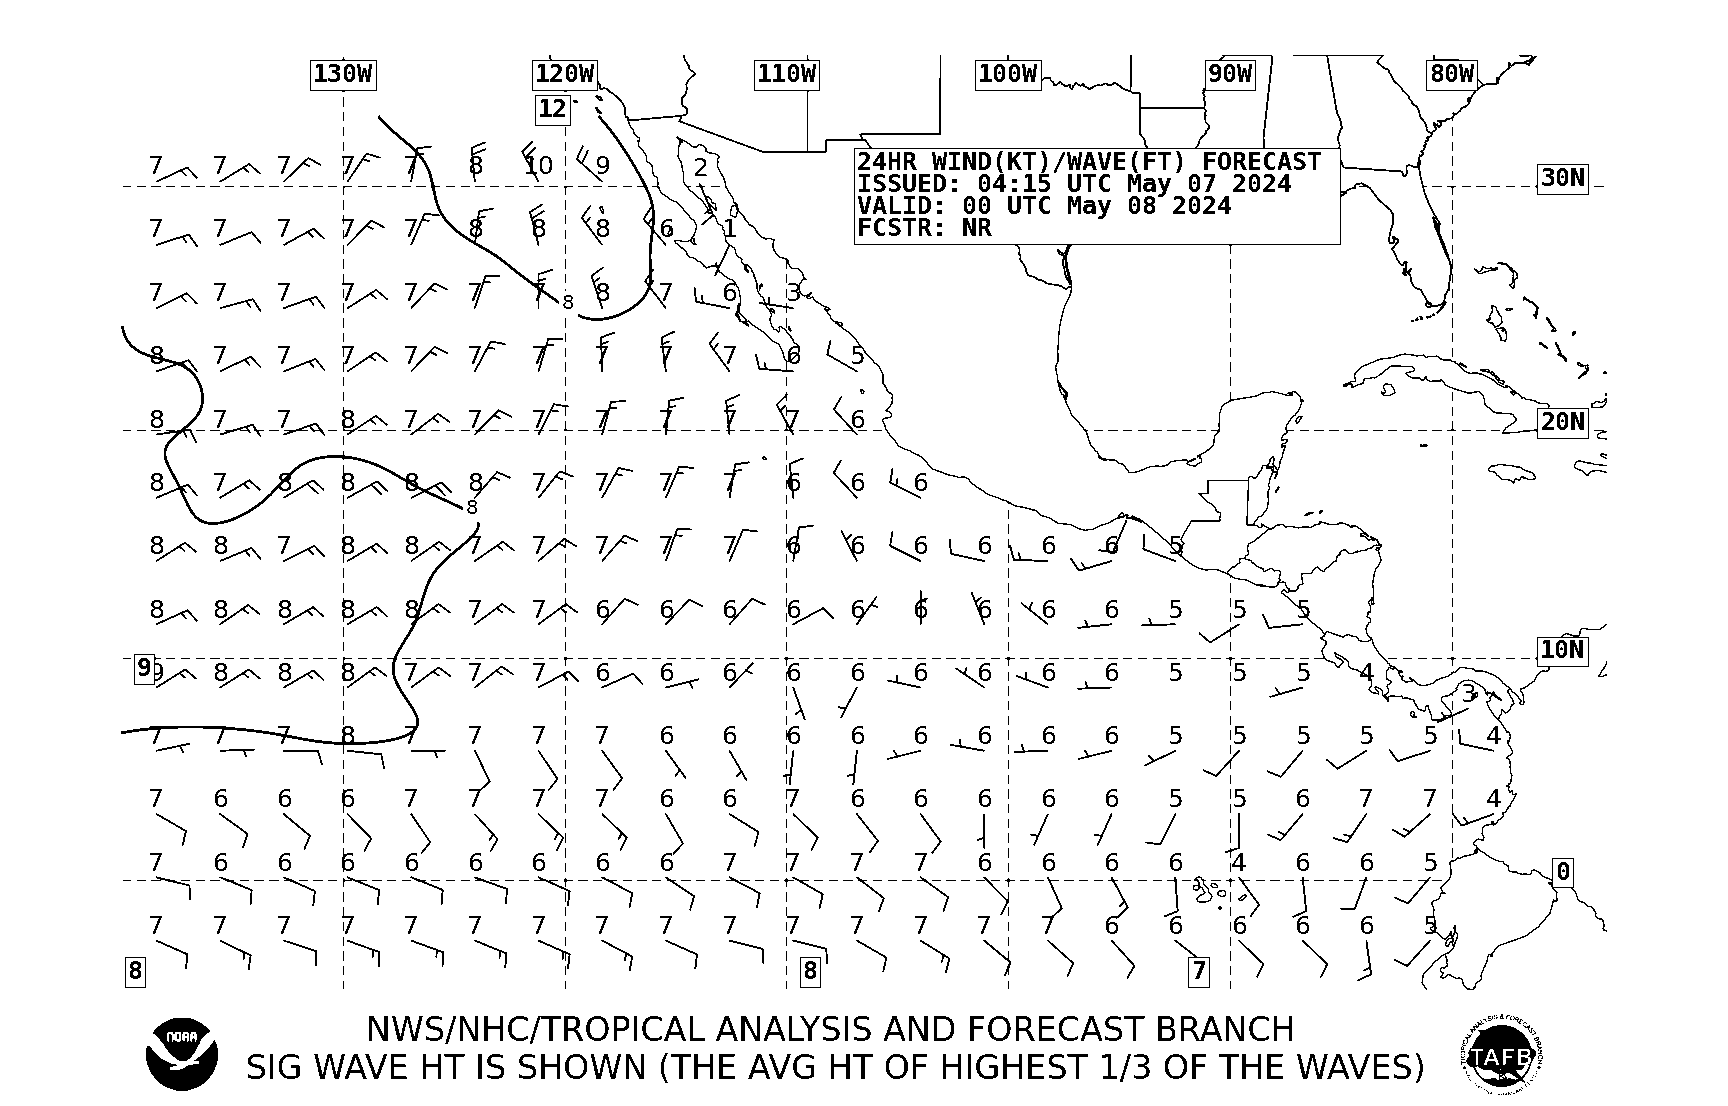
| 24HR Wind/Wave Forecast VT00Z 20S-30N E of 145W | |
 |
| 24HR Wind/Wave Forecast VT12Z 20S-30N E of 145W | |
 |
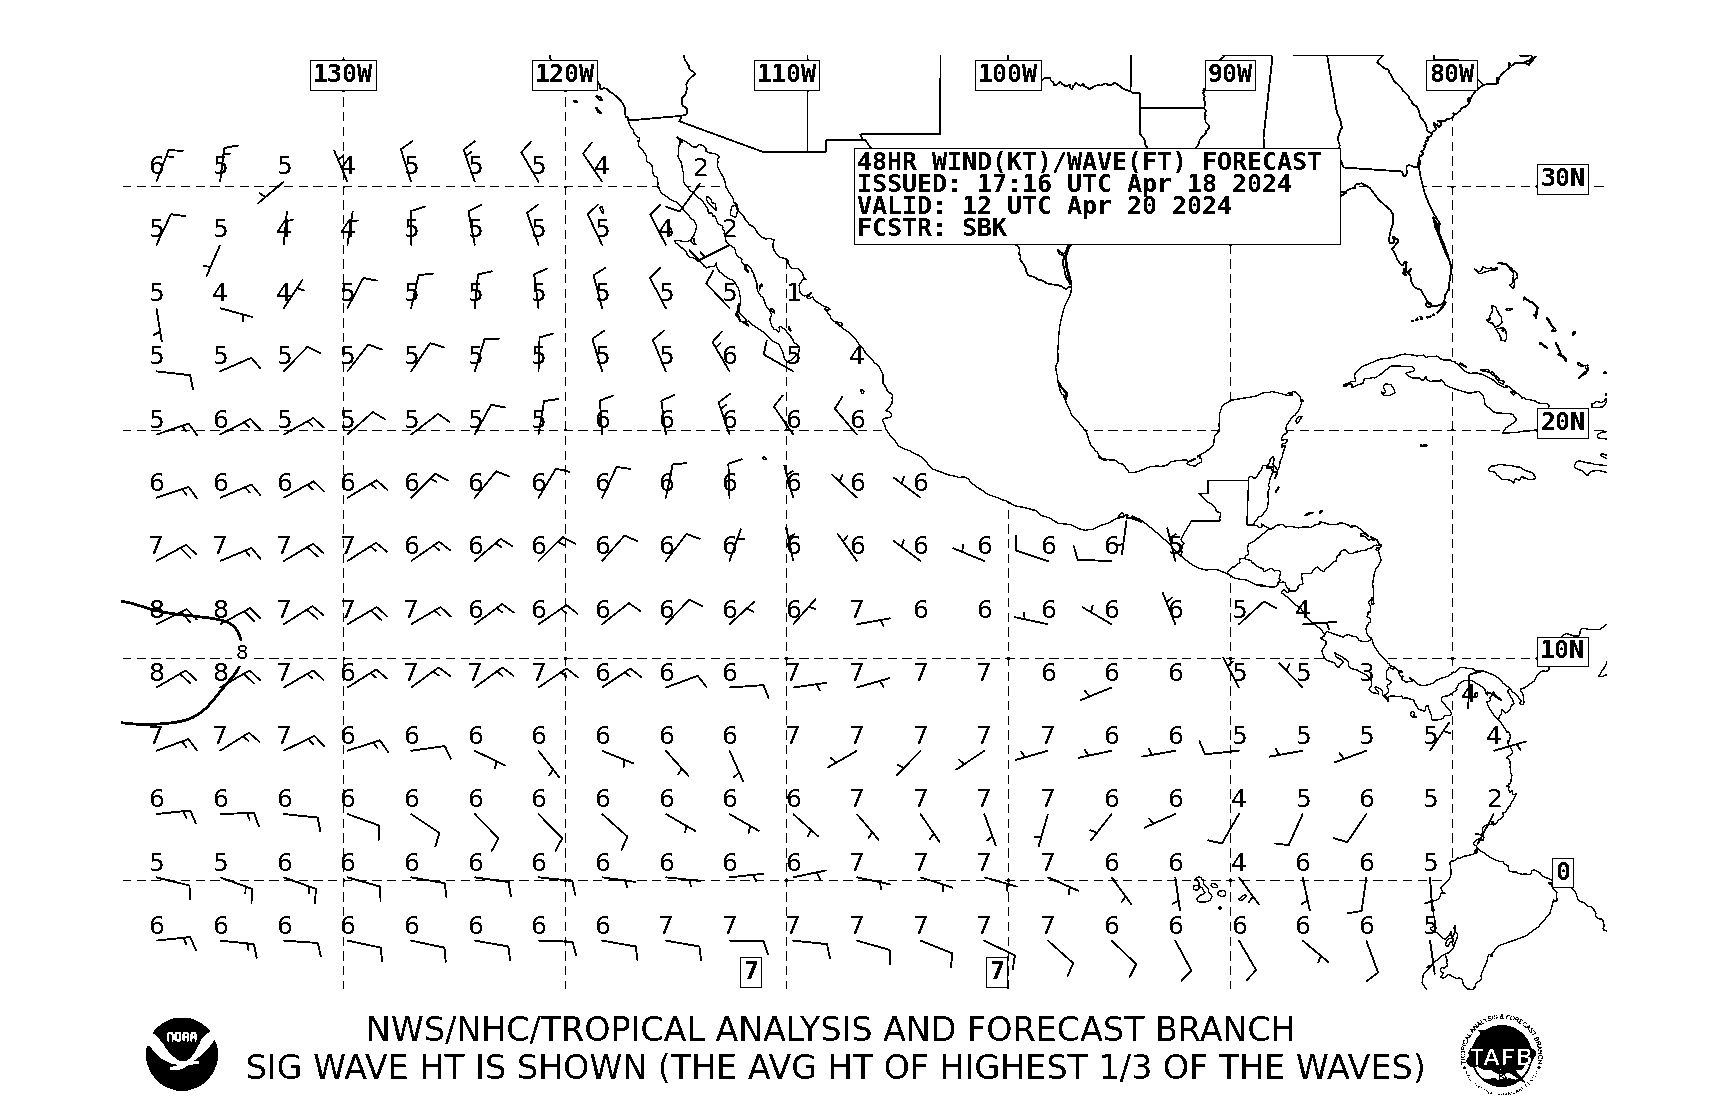
| 48HR Wind/Wave Forecast VT00Z 20S-30N E of 145W | |
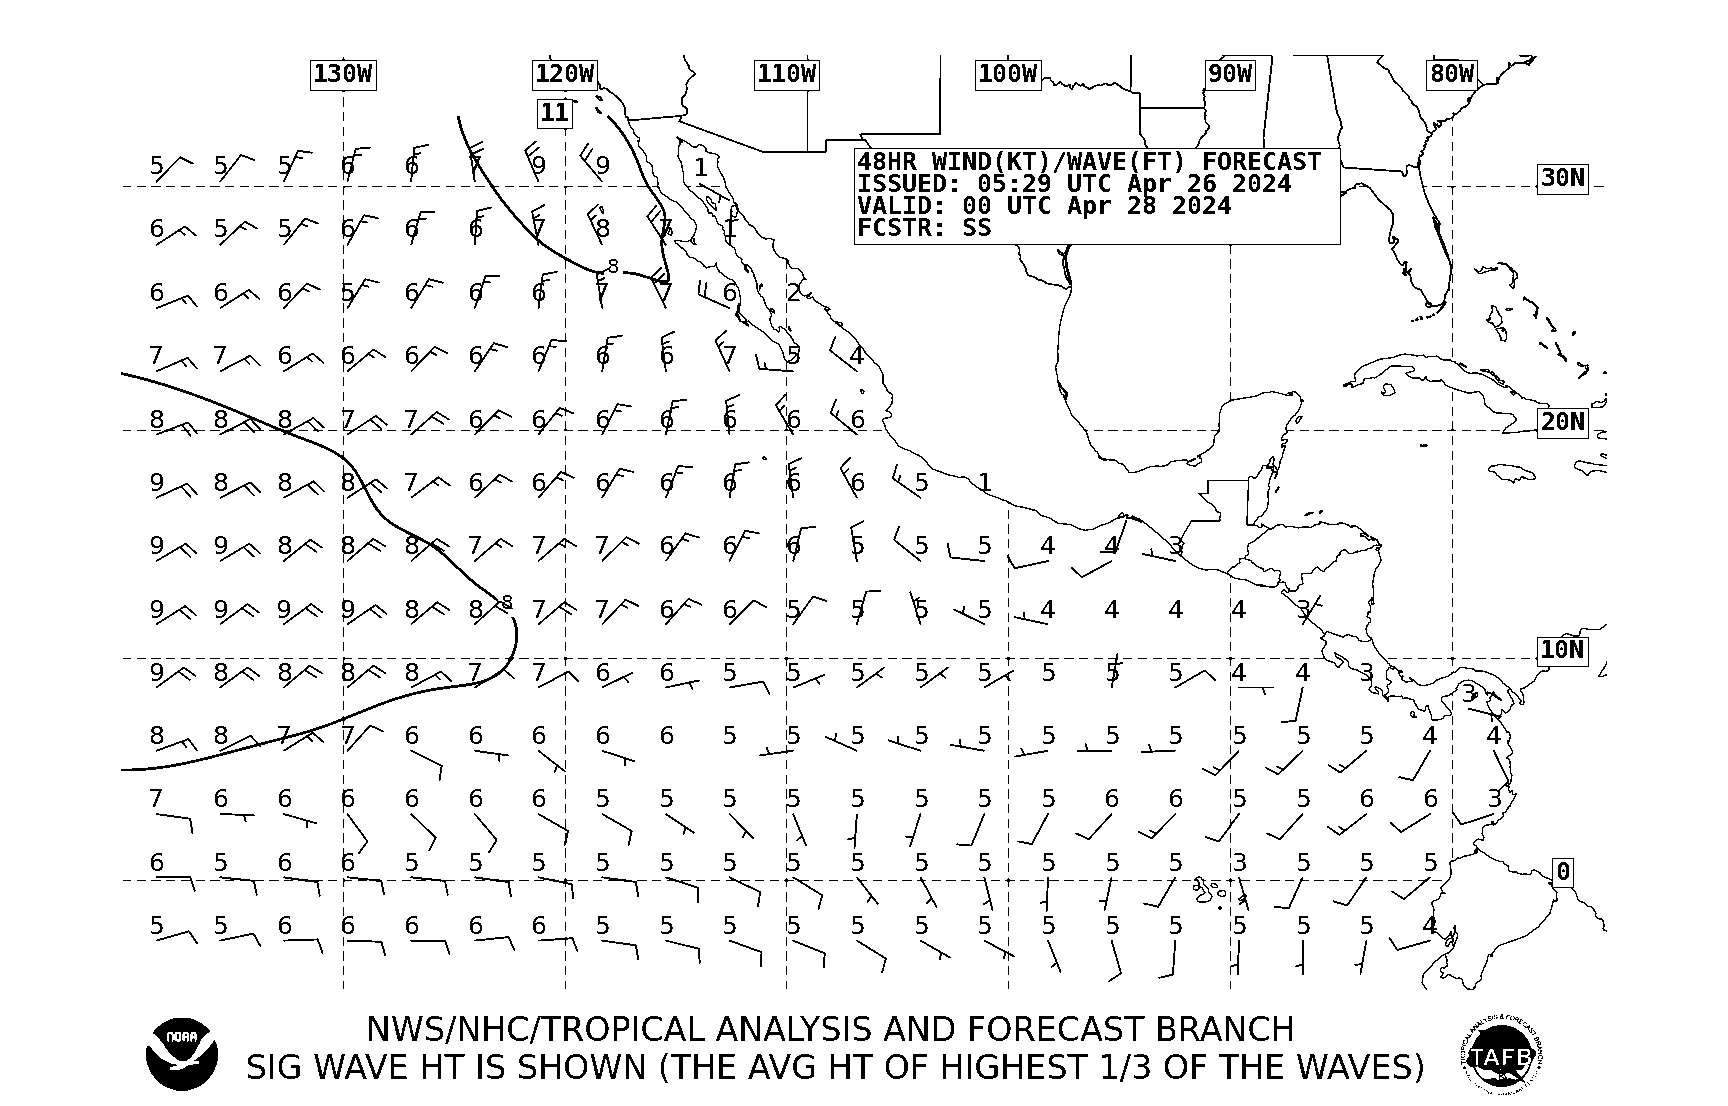 |
| 48HR Wind/Wave Forecast VT12Z 20S-30N E of 145W | |
 |
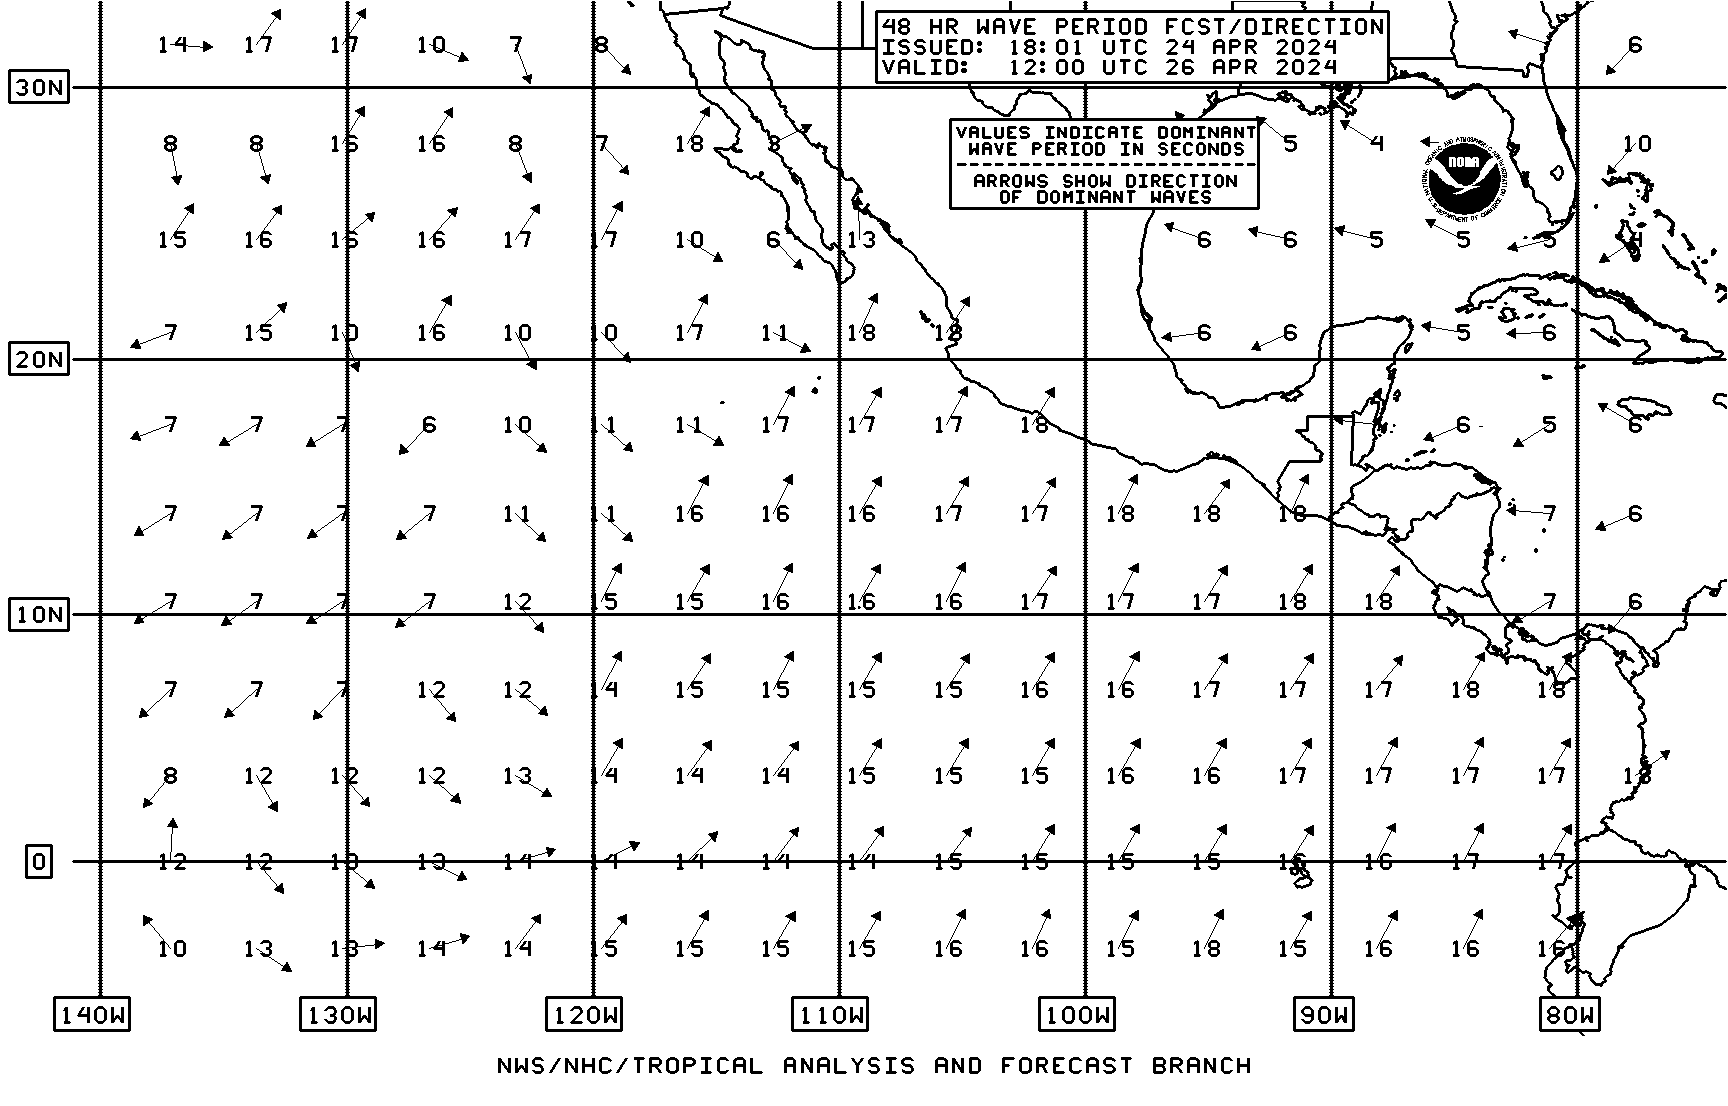
| 48HR Wave Period/Swell Dir VT00Z 20S-30N E of 145W* | |
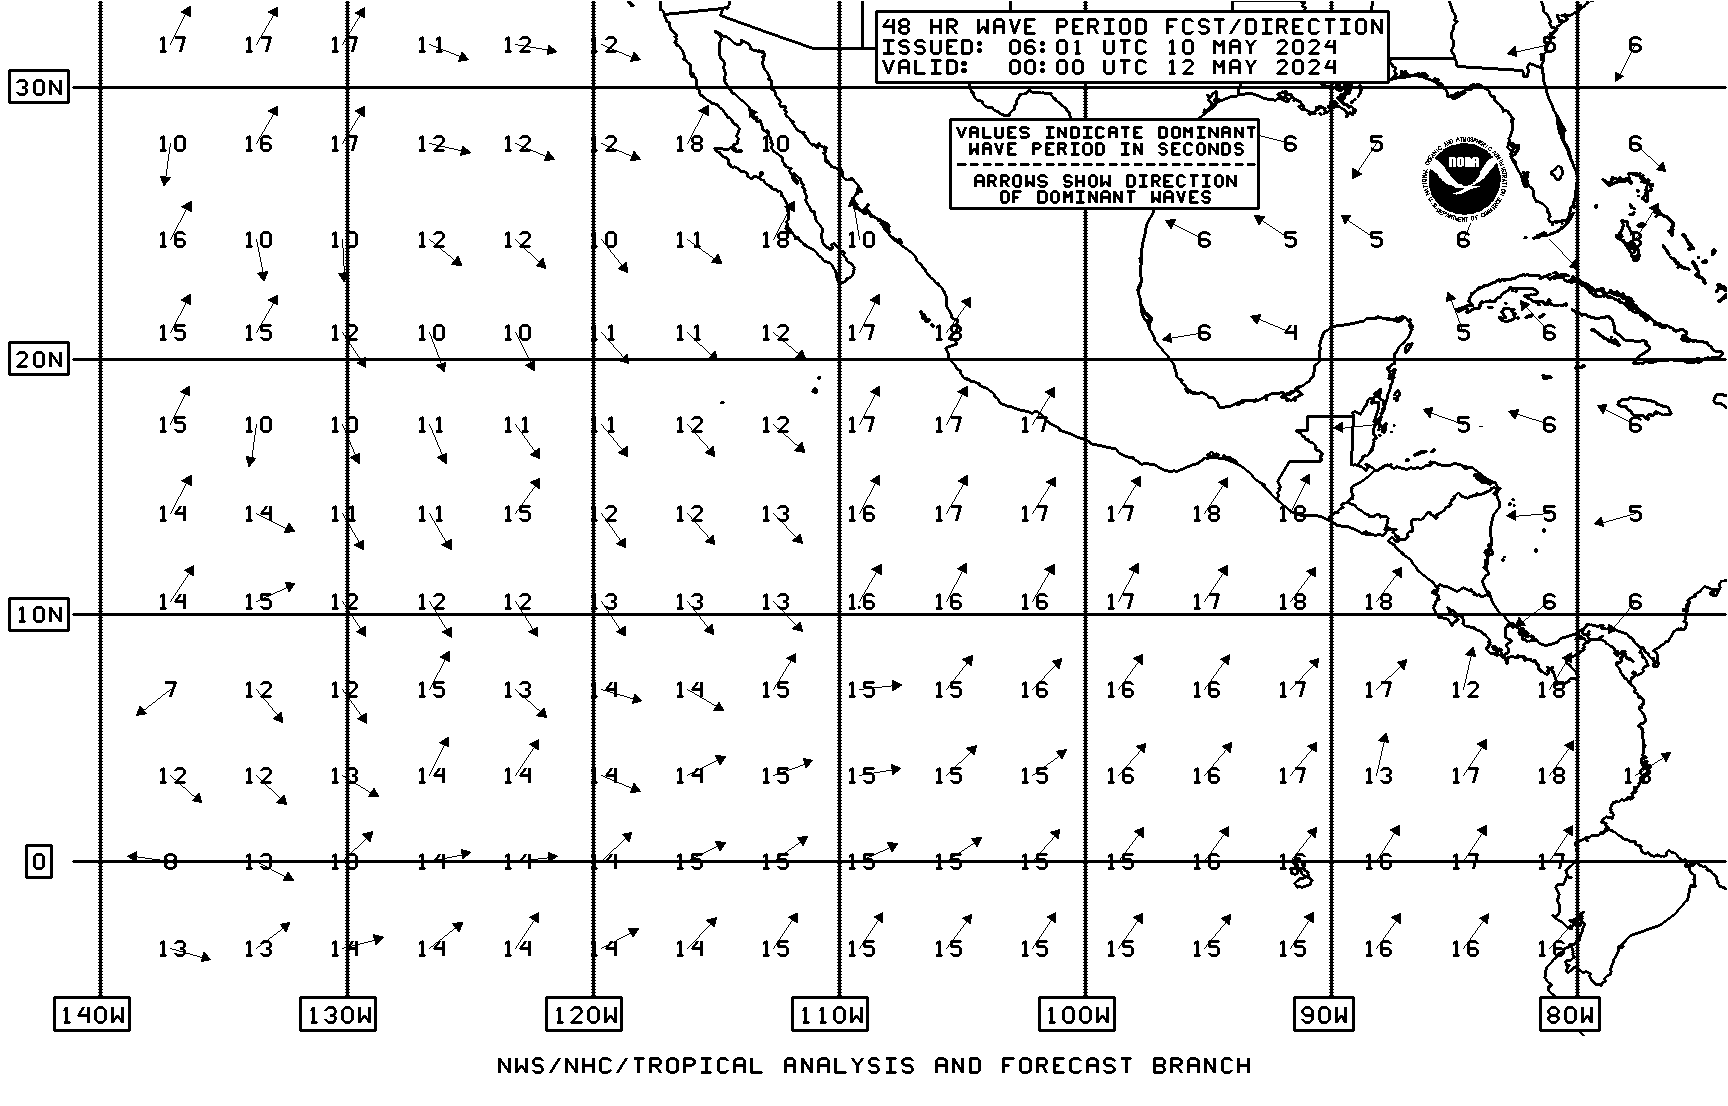 |
| 48HR Wave Period/Swell Dir VT12Z 20S-30N E of 145W | |
 |
| 72HR Wind/Wave Forecast VT00Z 20S-30N E of 145W | |
 |
| 72HR Wind/Wave Forecast VT12Z 20S-30N E of 145W | |
 |
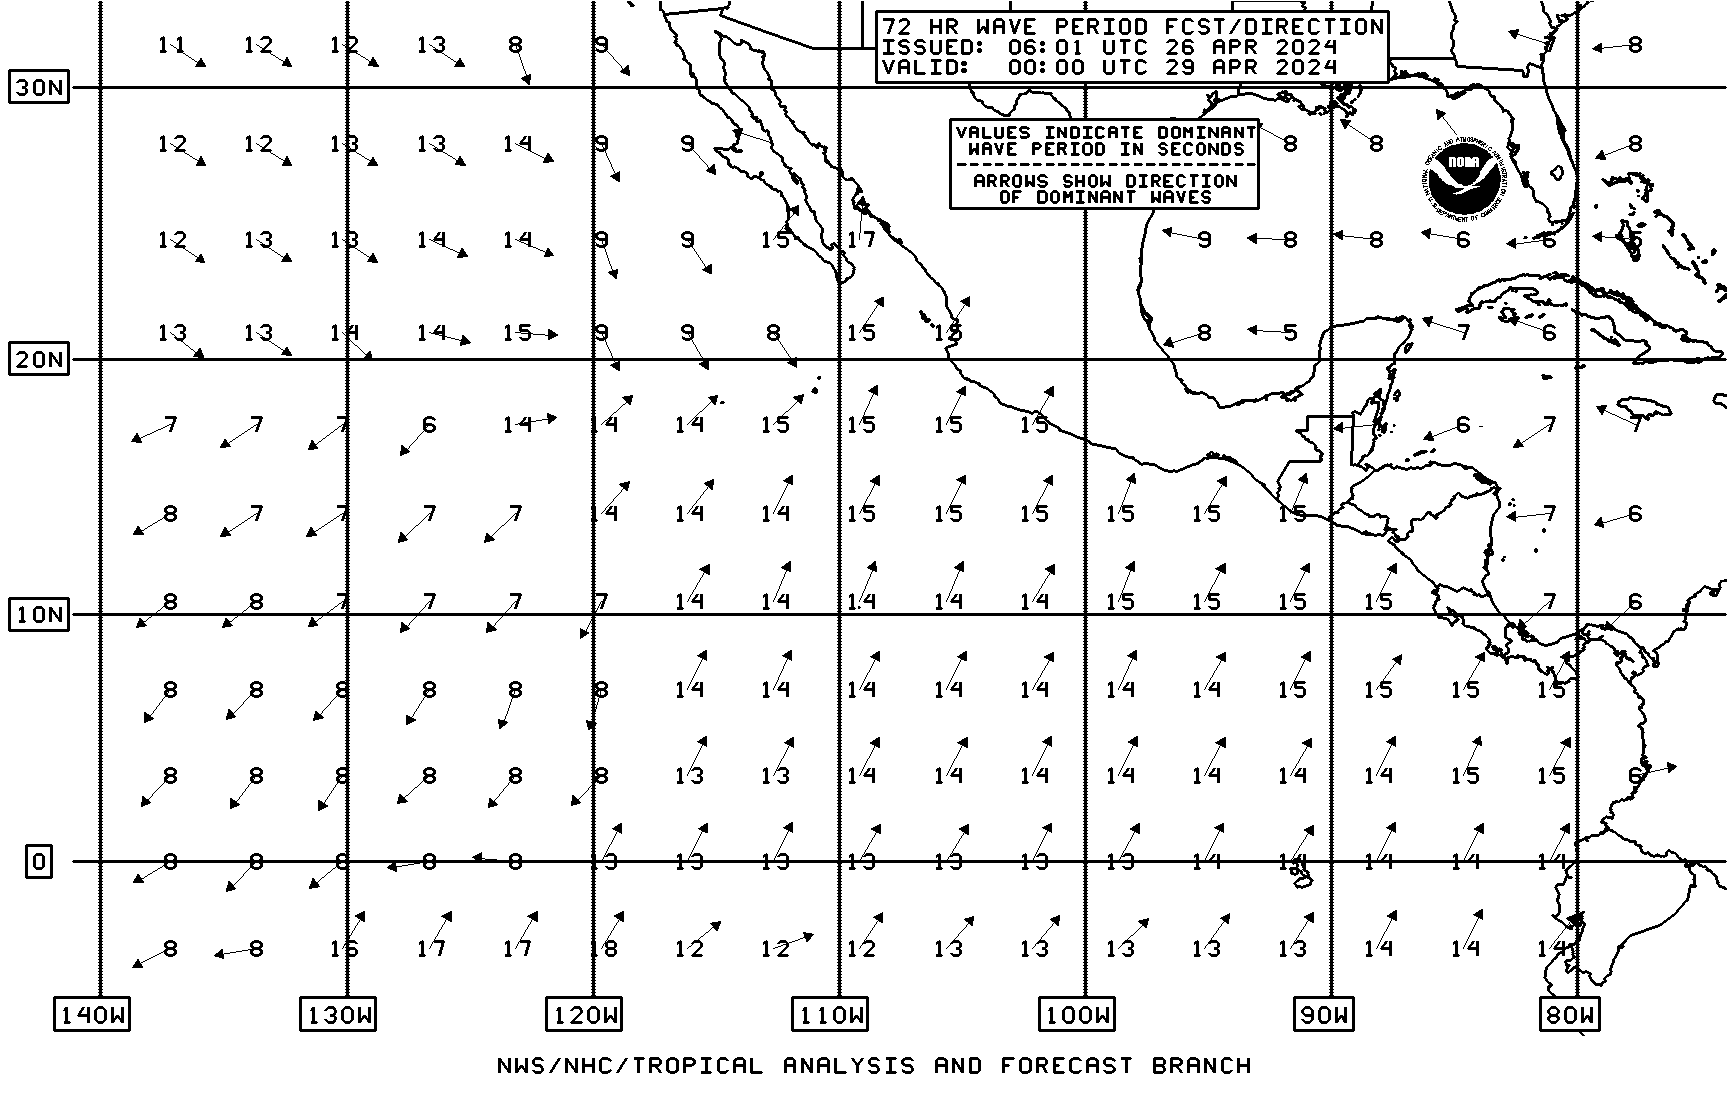
| 72HR Wave Period/Swell Dir VT00Z 20S-30N E of 145W | |
 |
| * Not transmitted via Honolulu radiofax but listed here for convenience | ||
| Wind/Wave Charts - North Pacific | |||
|---|---|---|---|
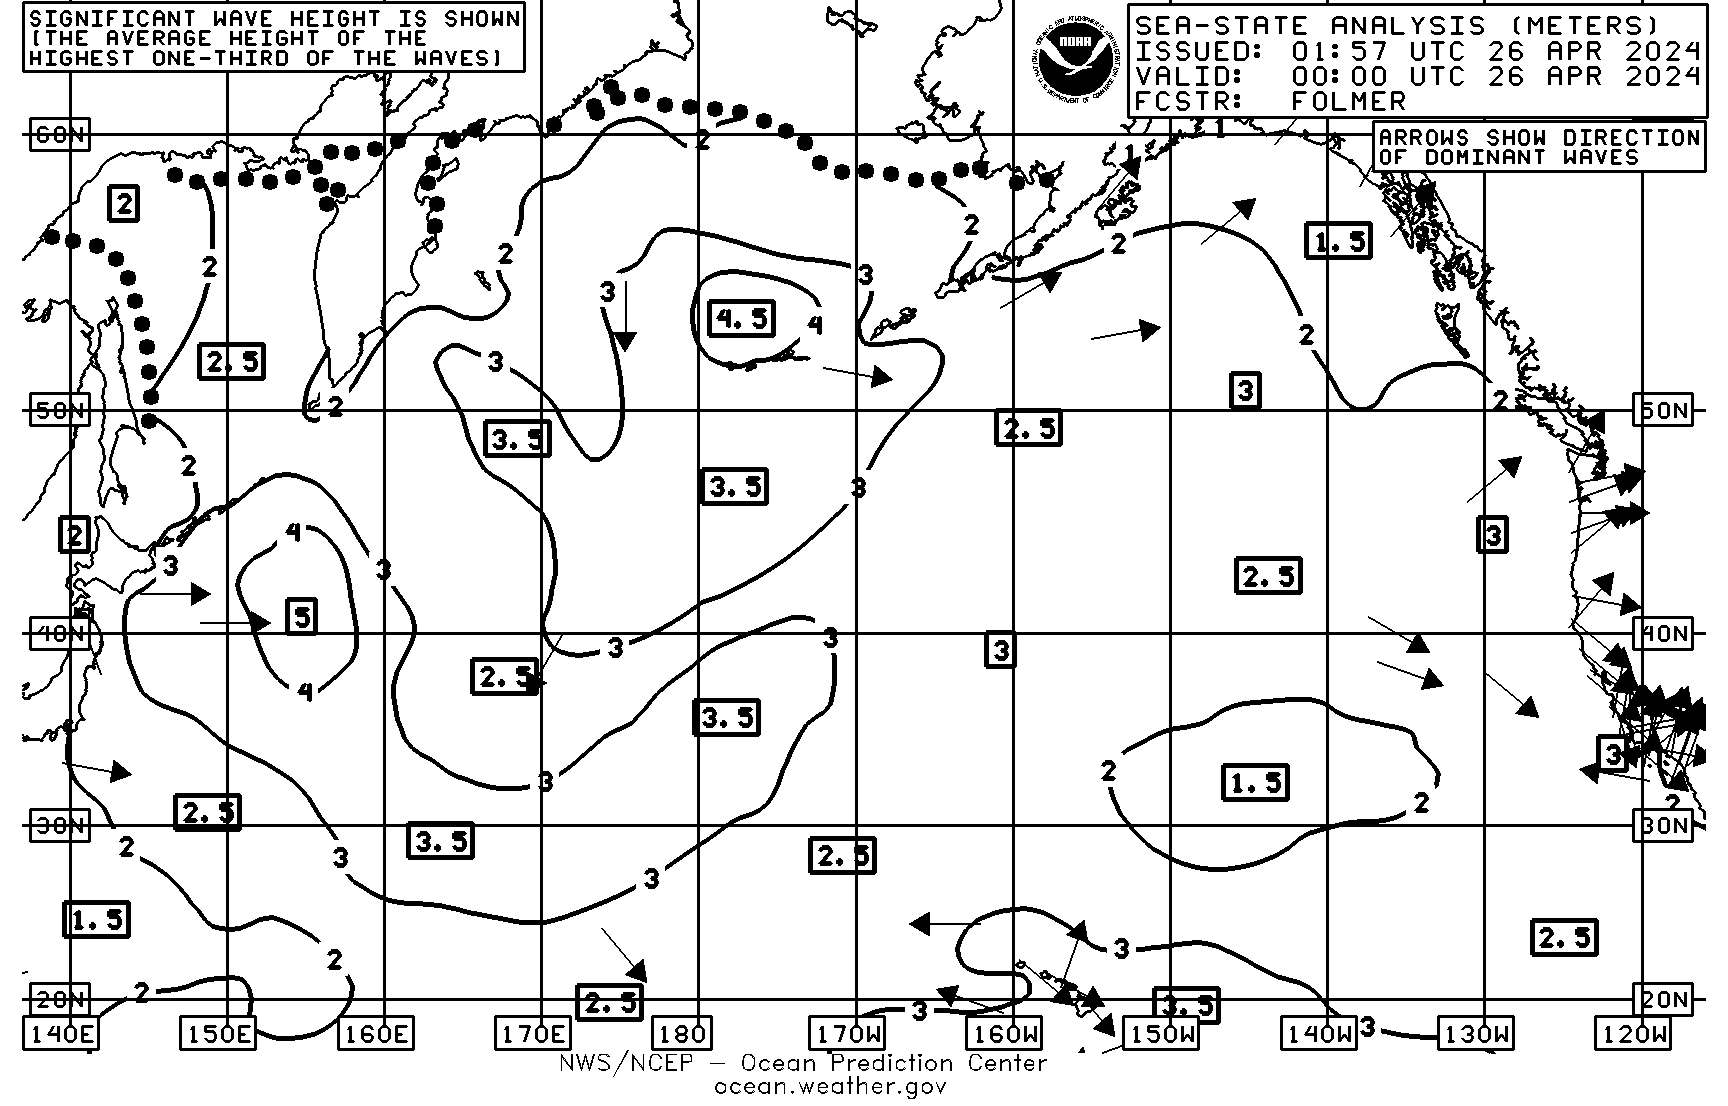
| 00Z Sea State Analysis 20N-70N 115W-135E | |
 |
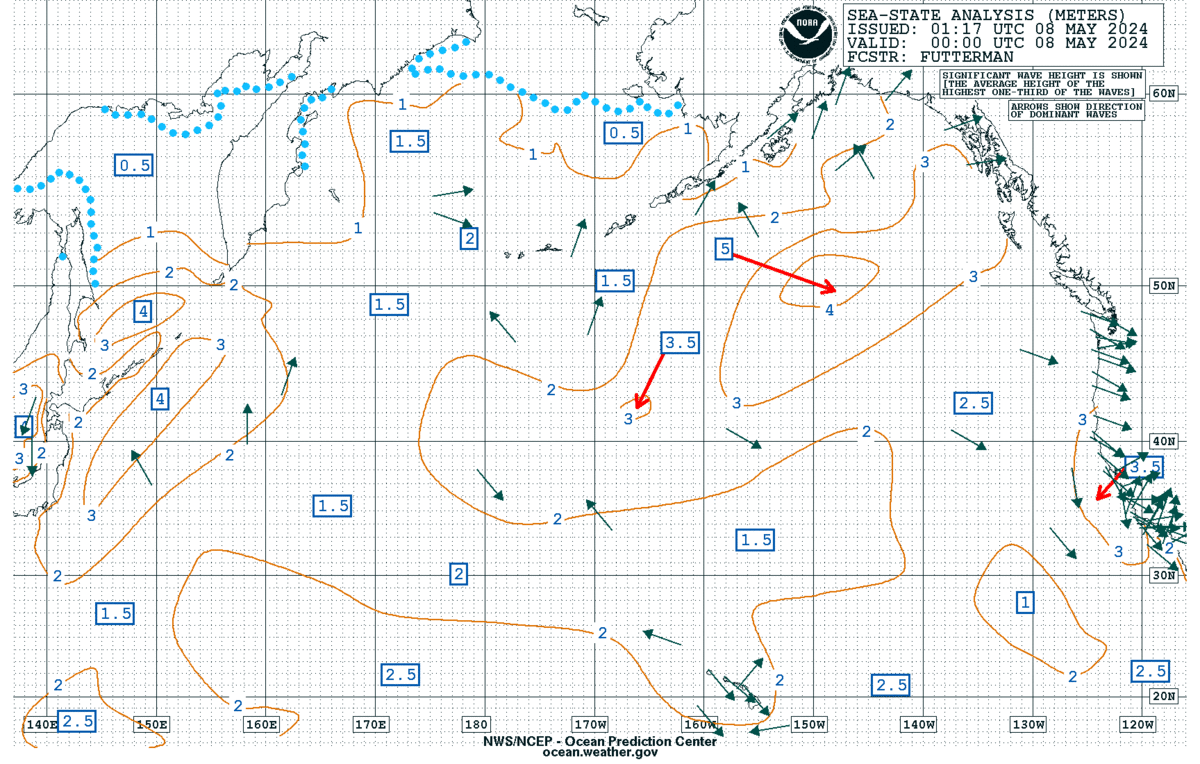 |
| 00Z Wind/Wave Analysis 18N-62N E of 157W* | |
 |
 |
| 06Z Wind/Wave Analysis 18N-62N E of 157W* | |
 |
 |
| 12Z Wind/Wave Analysis 18N-62N E of 157W* | |
 |
 |
| 18Z Wind/Wave Analysis 18N-62N E of 157W* | |
 |
 |
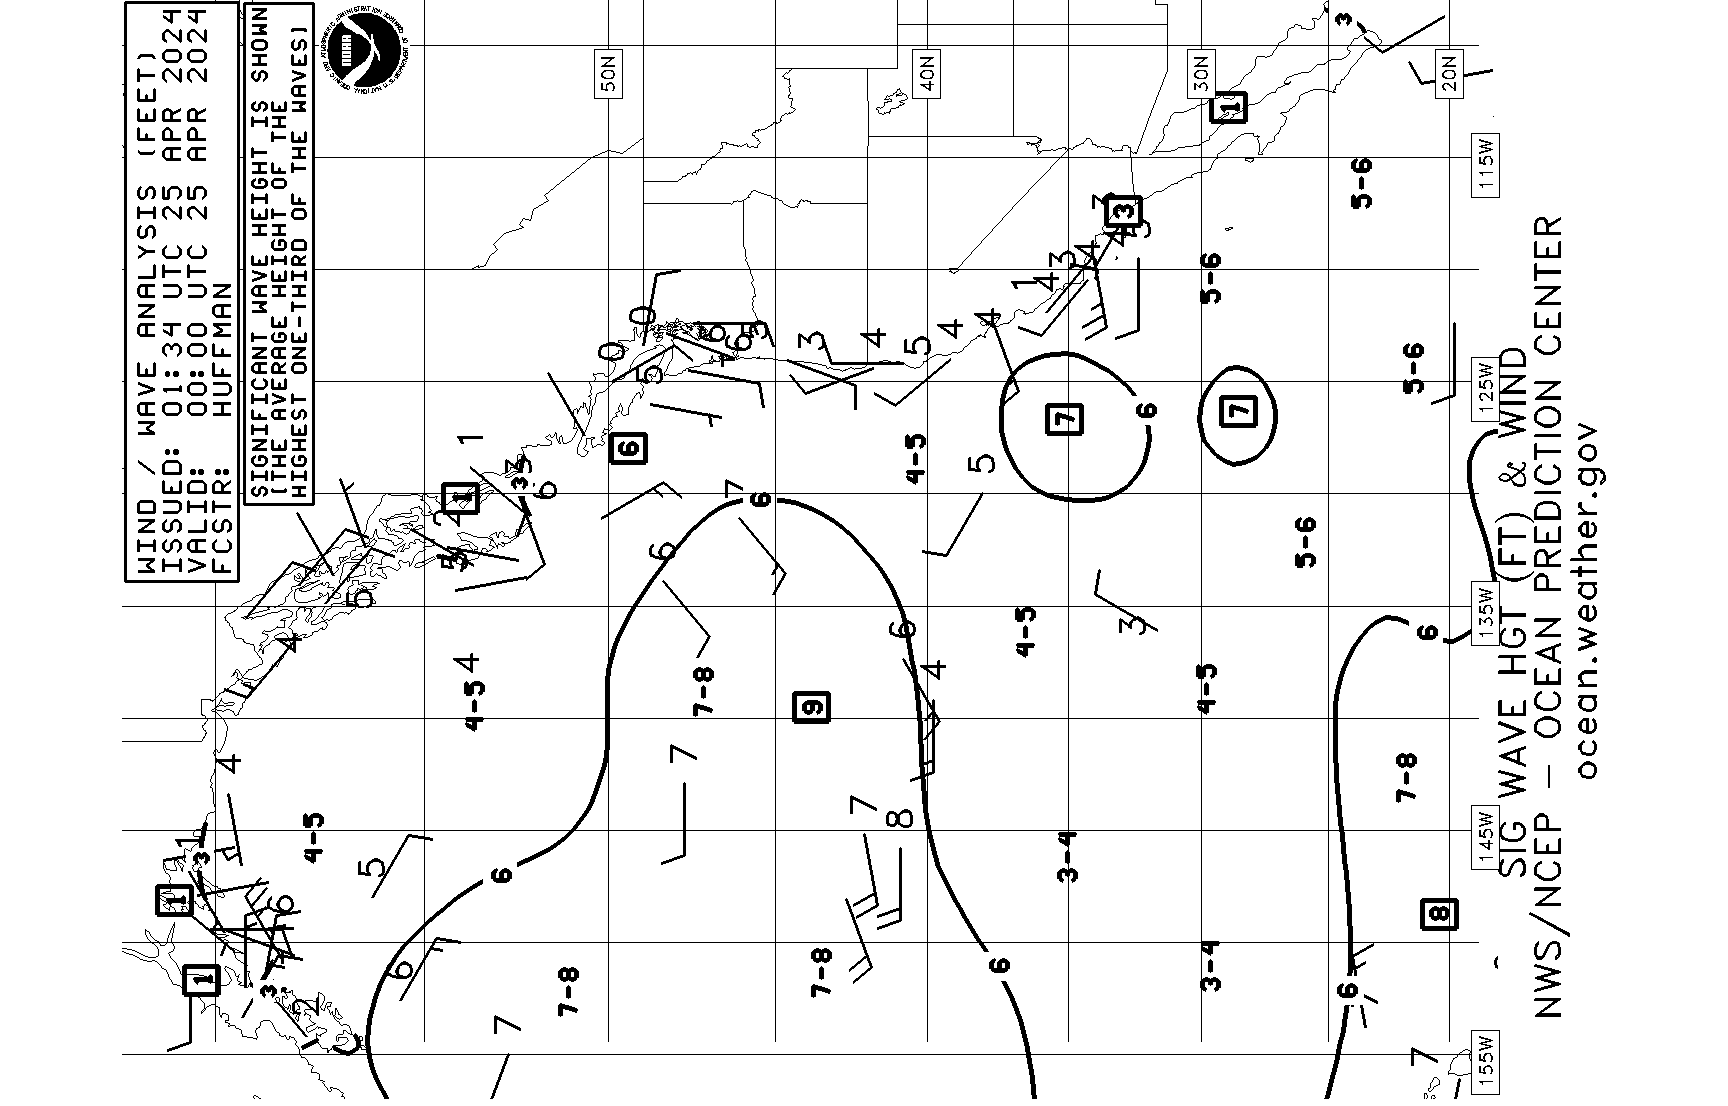
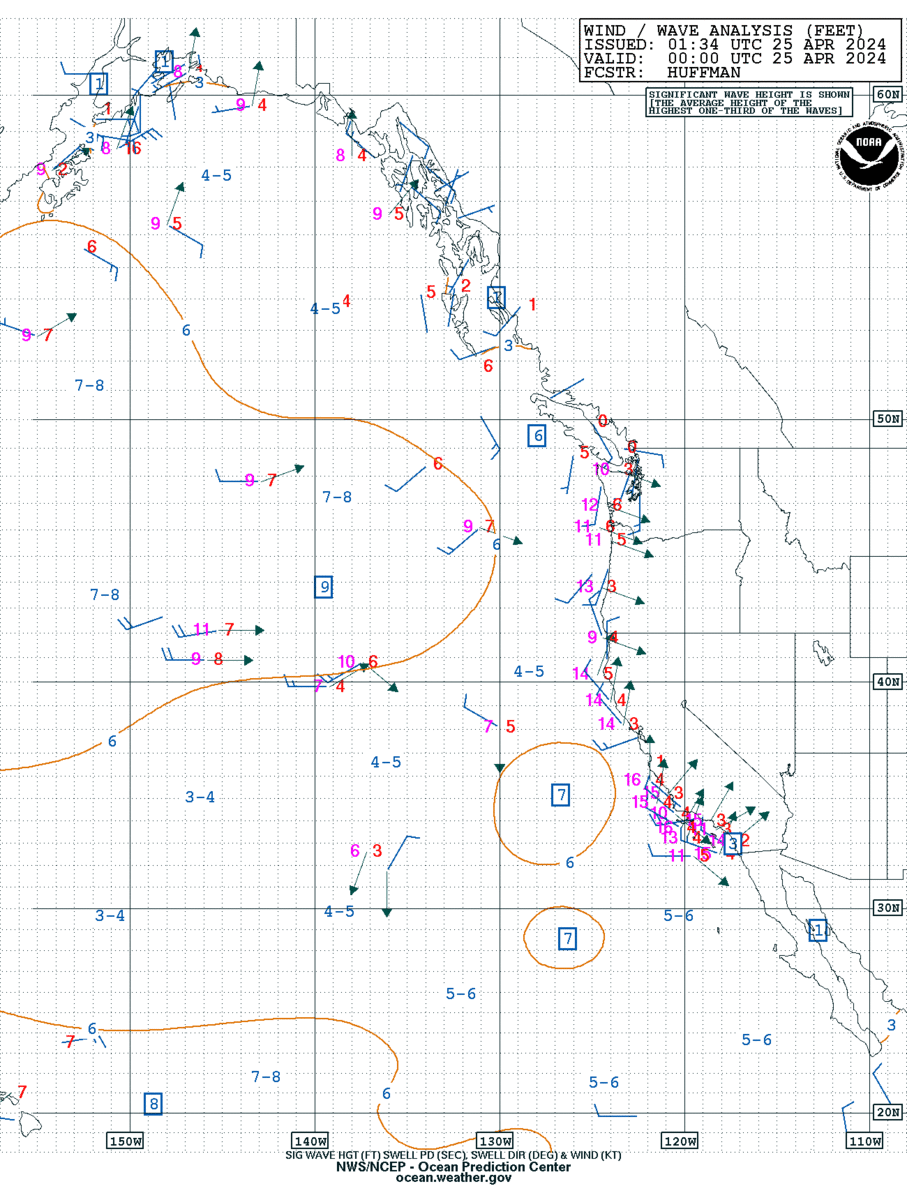
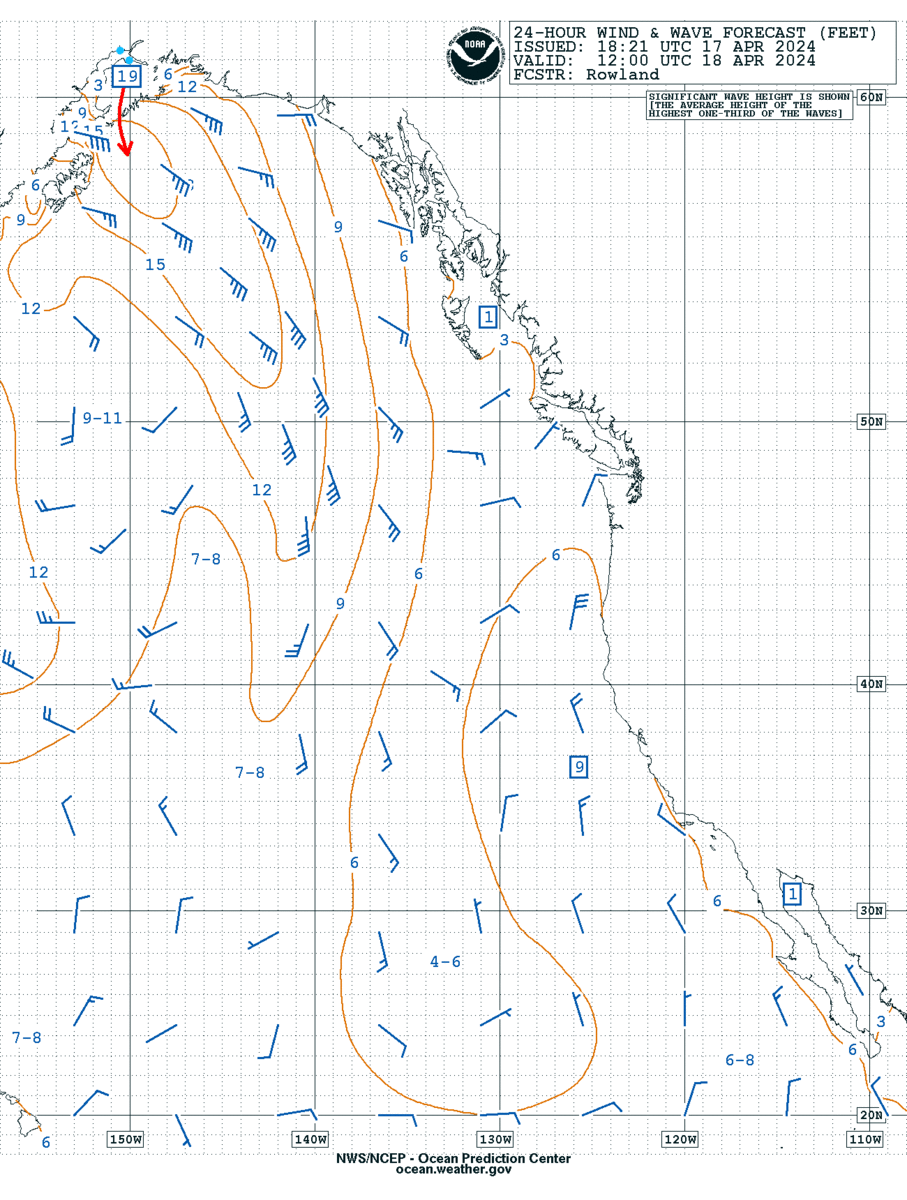
| 24HR Wind/Wave Forecast VT00Z 18N-62N E of 157W | |
 |
 |
| 24HR Wind/Wave Forecast VT12Z 18N-62N E of 157W | |
 |
 |
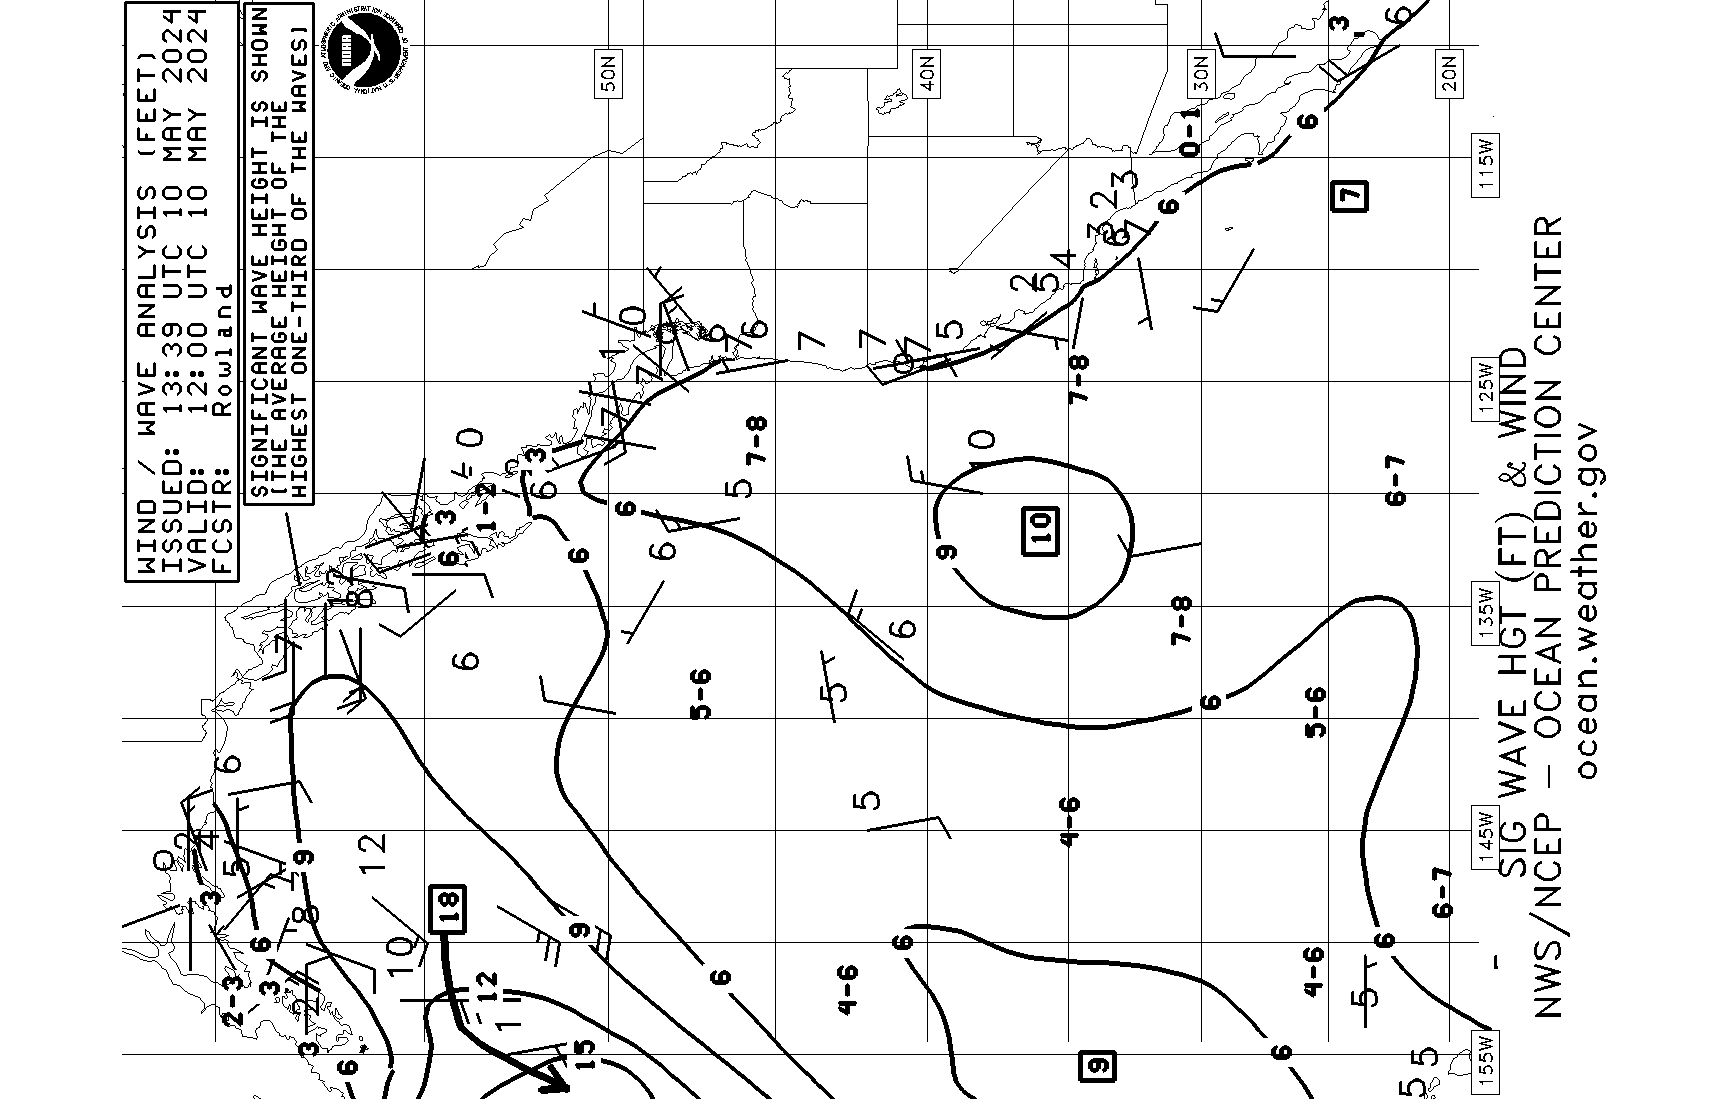
| 48HR Wind/Wave Forecast VT00Z 20N-70N 115W-135E | |
 |
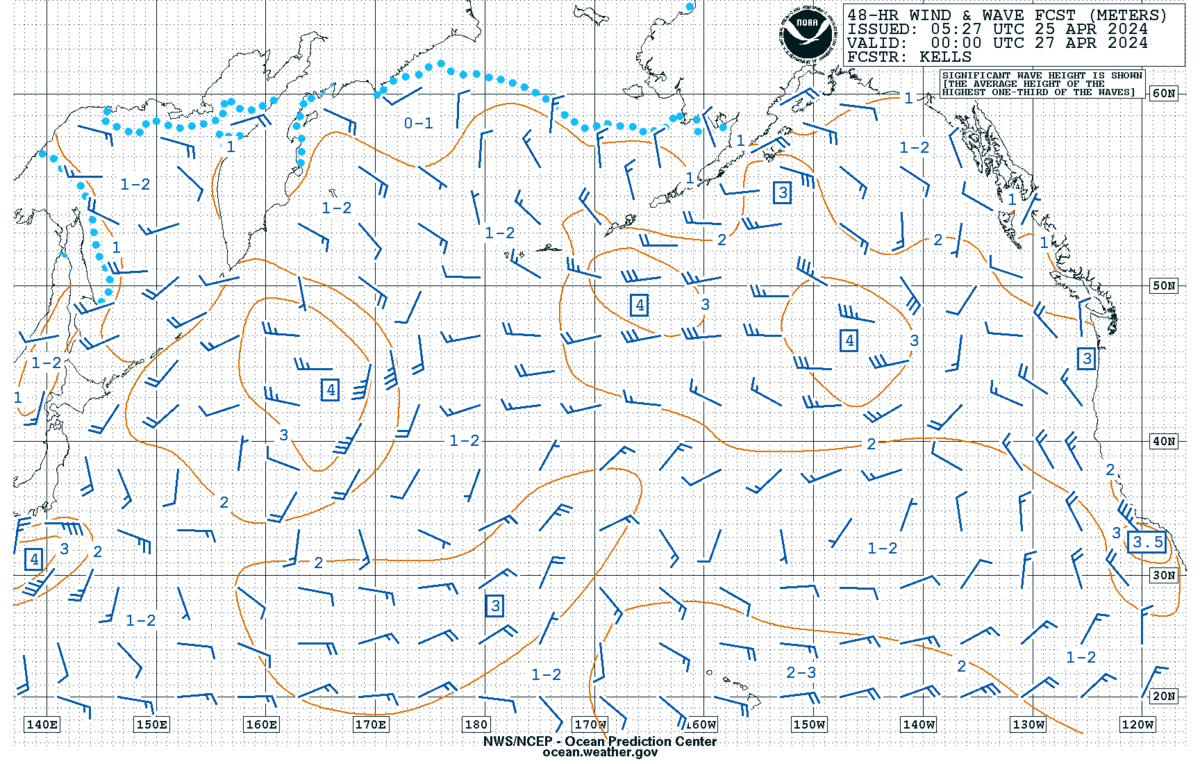 |
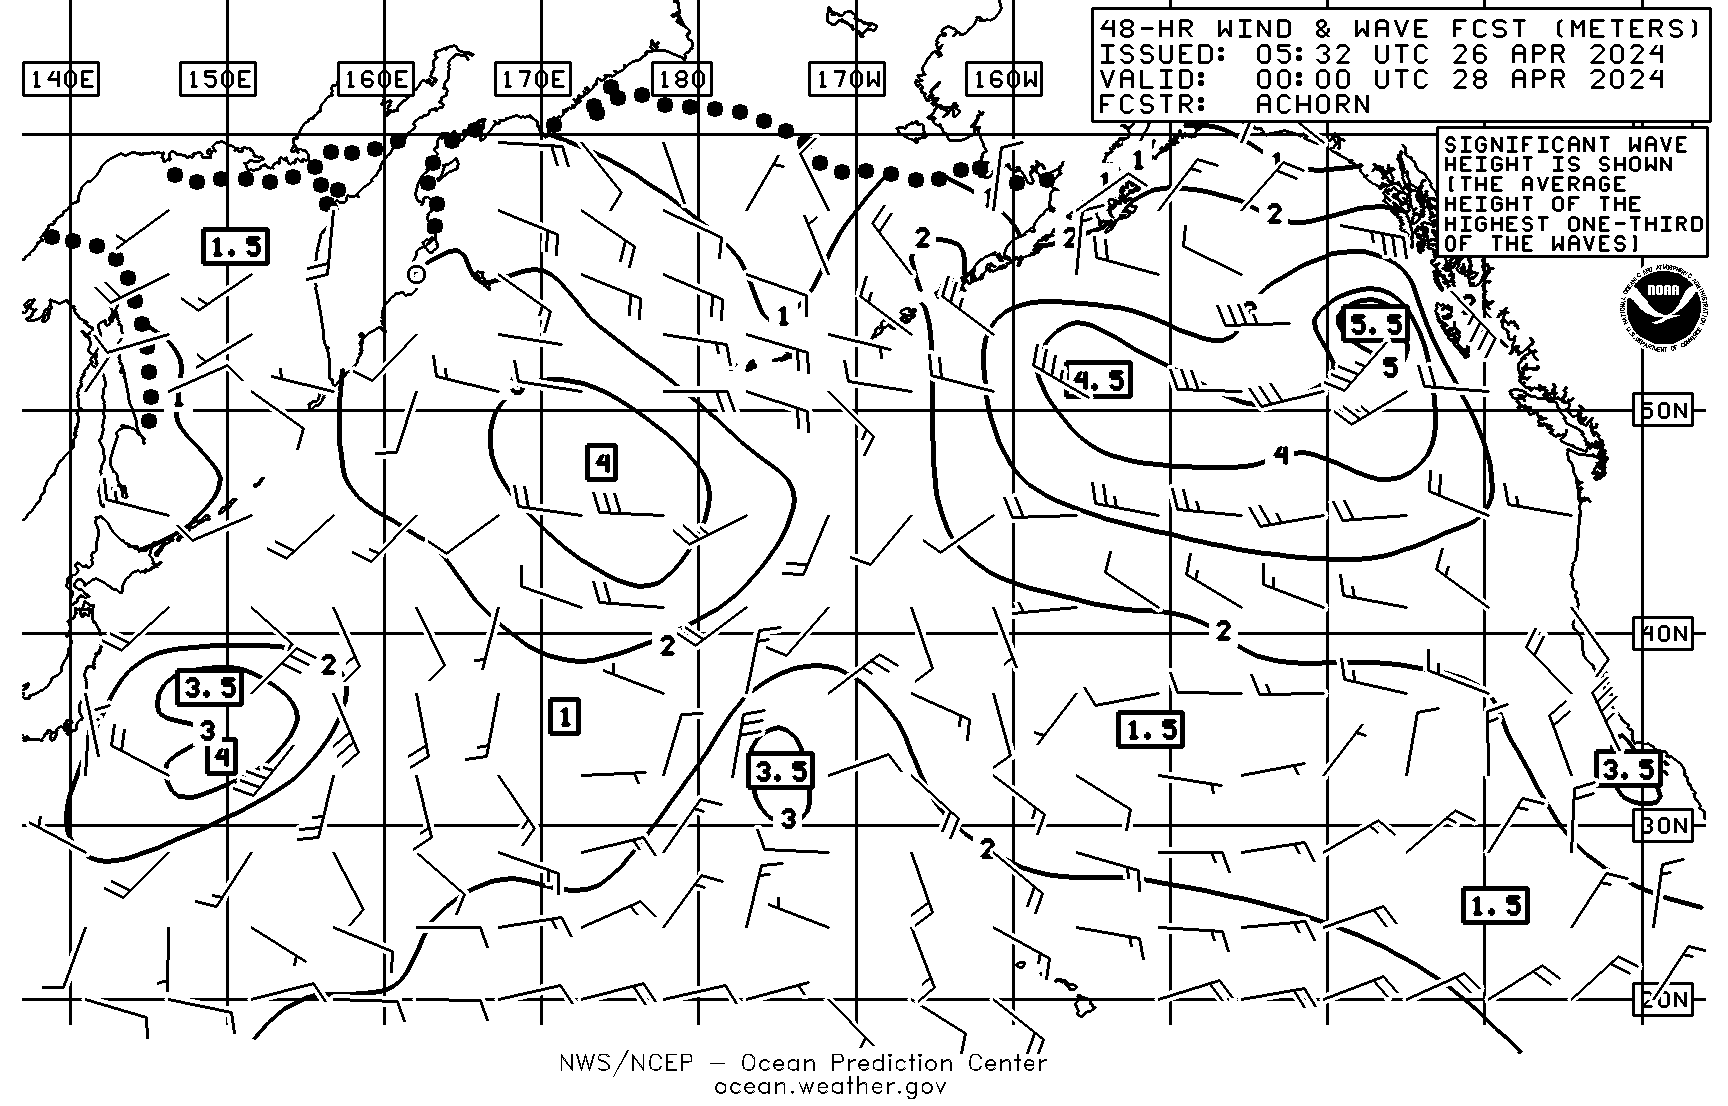
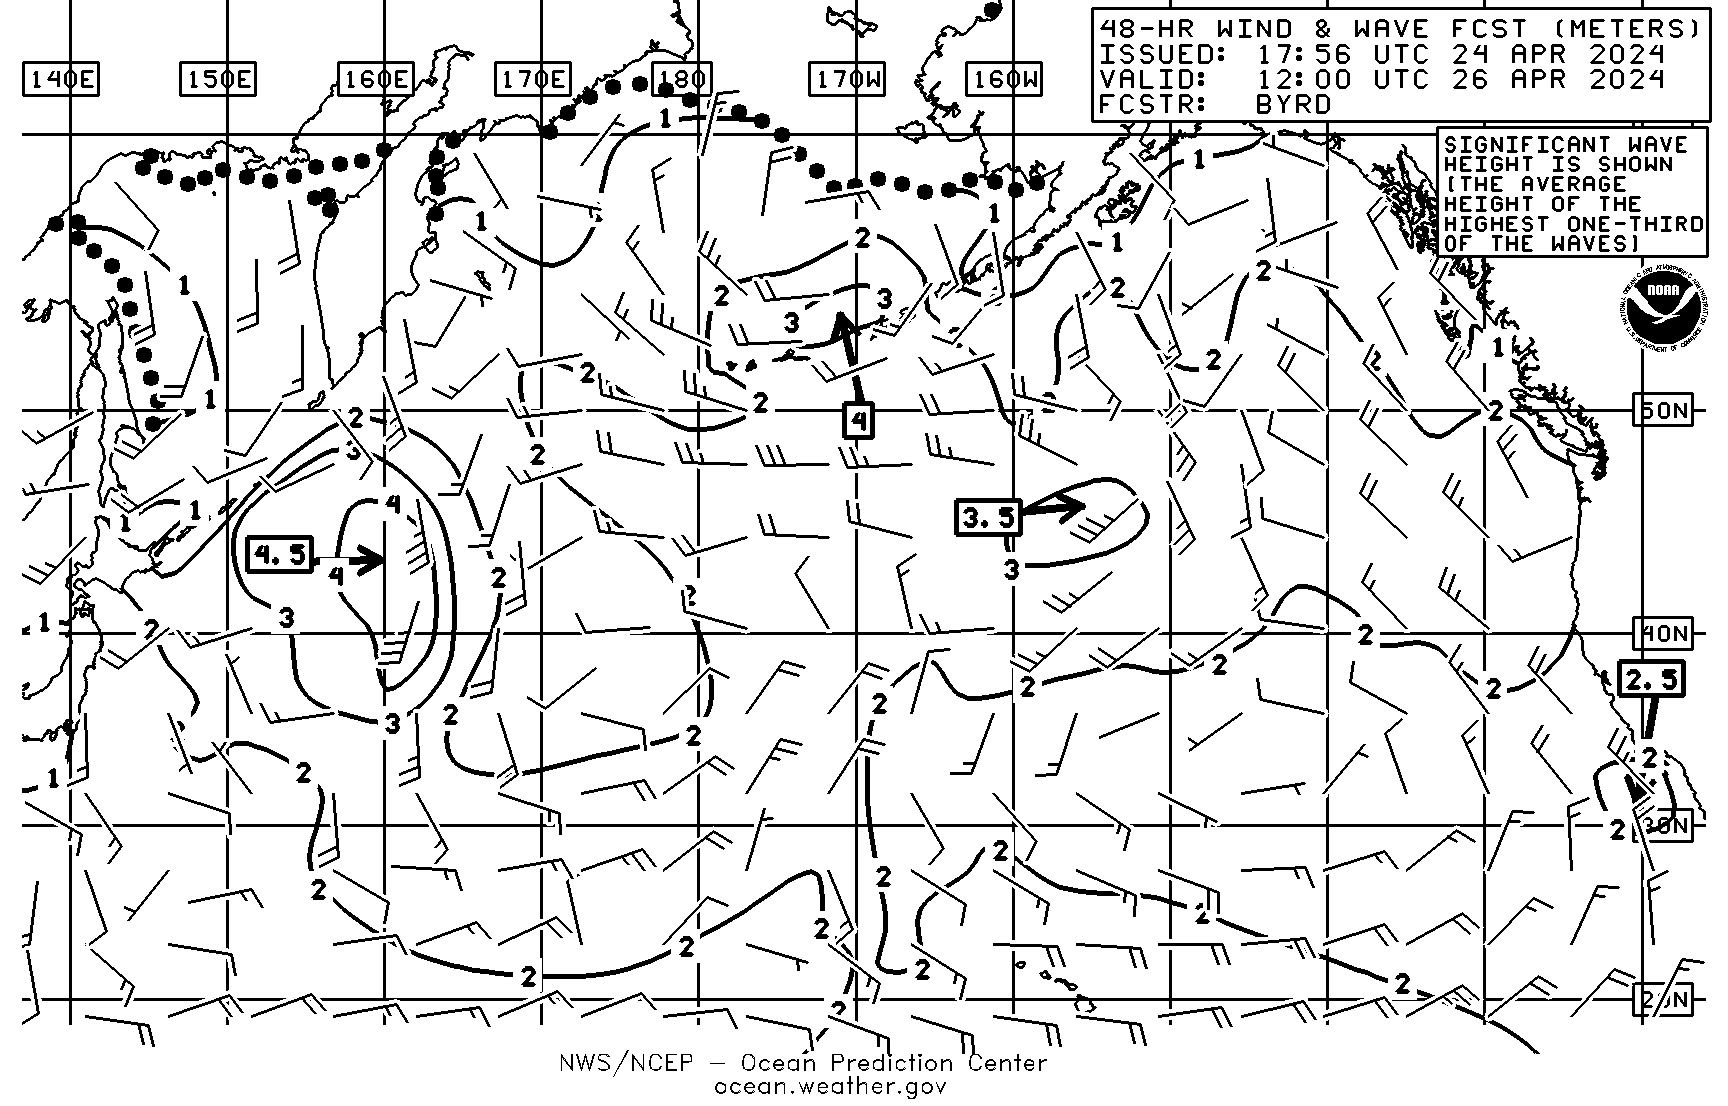
| 48HR Wind/Wave Forecast VT12Z 20N-70N 115W-135E | |
 |
 |
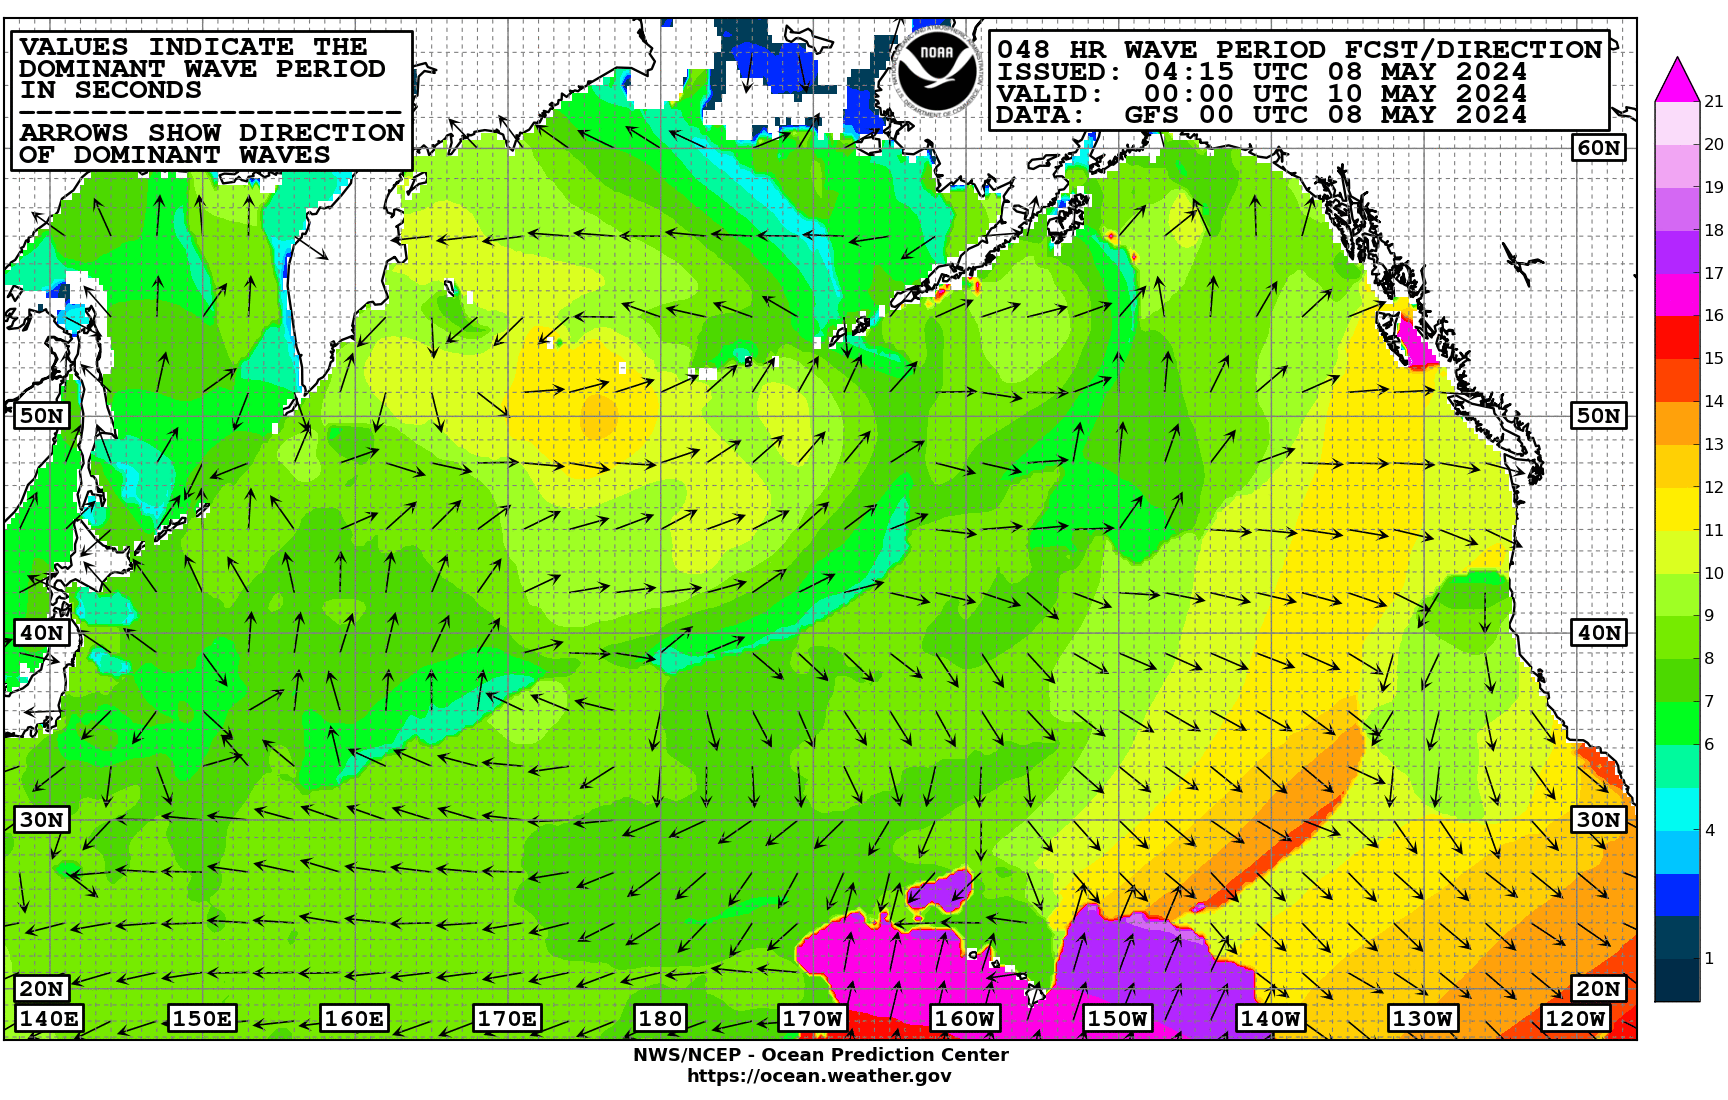
| 48HR Wave Period/Swell Dir VT00Z 20N-70N 115W-135E | |
 |
 |
| 48HR Wave Period/Swell Dir VT12Z 20N-70N 115W-135E* | |
 |
 |
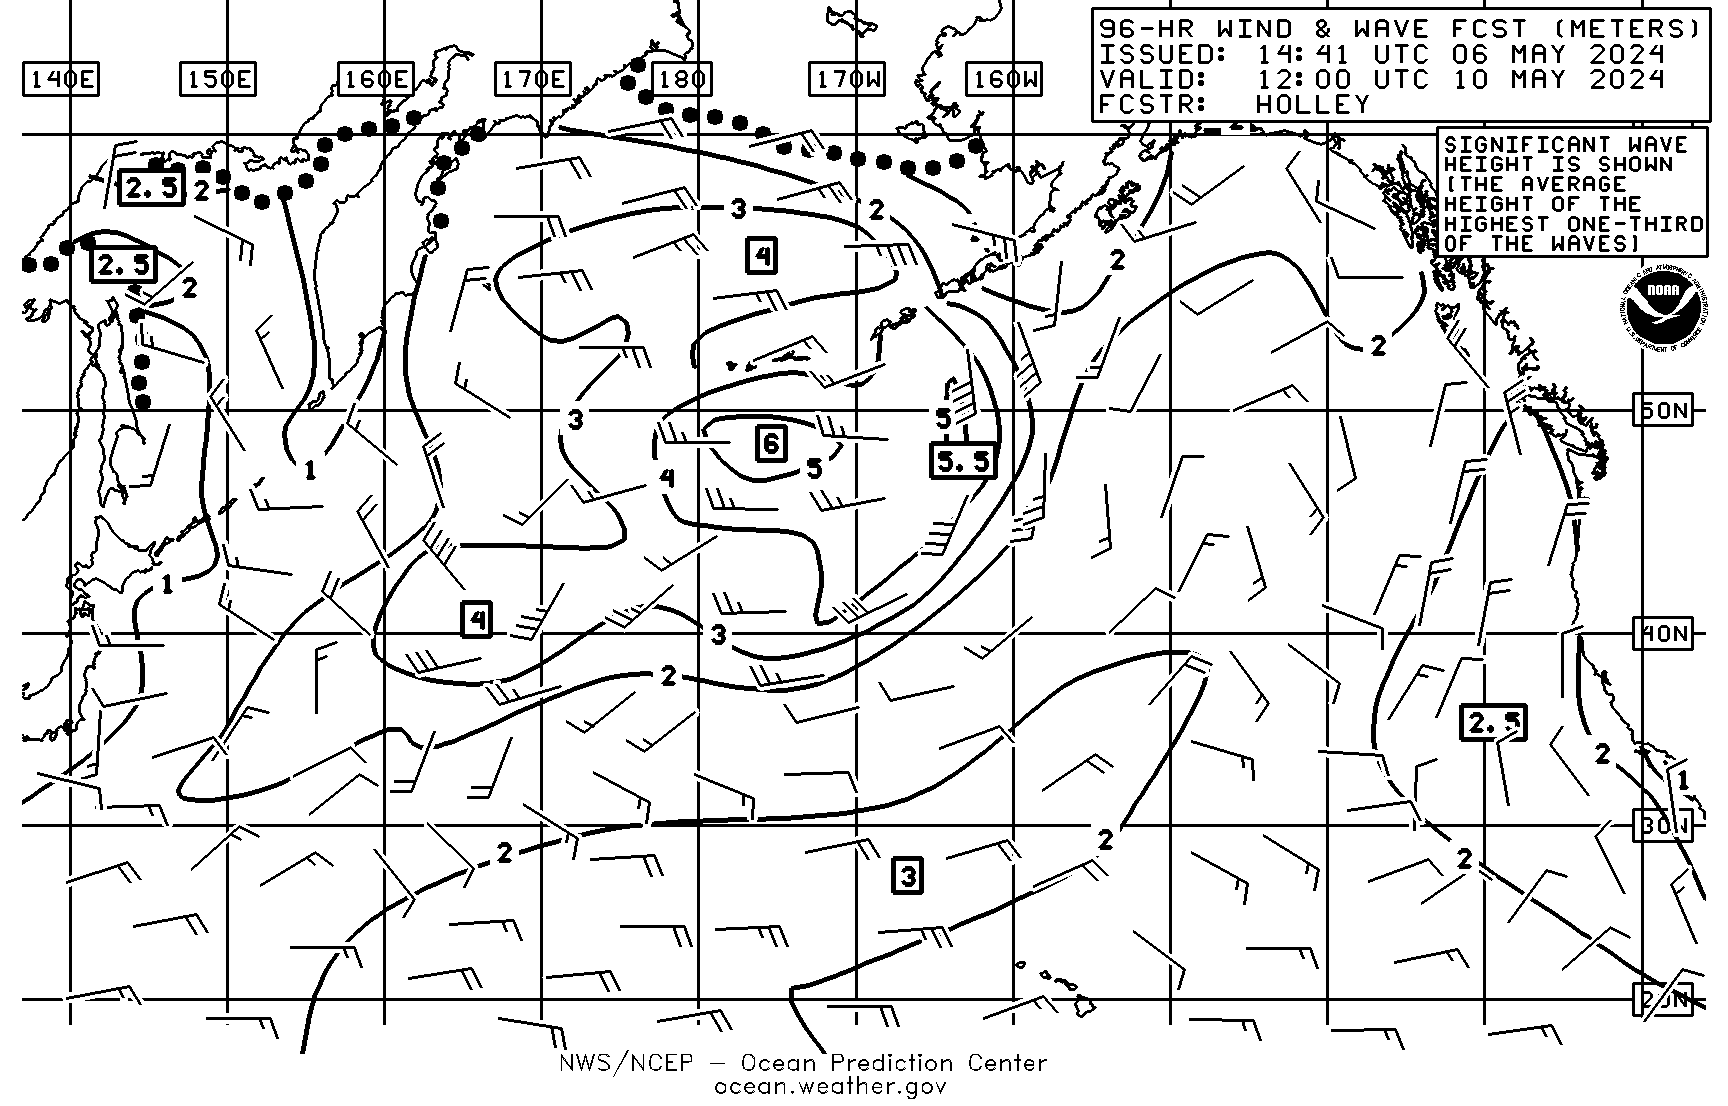
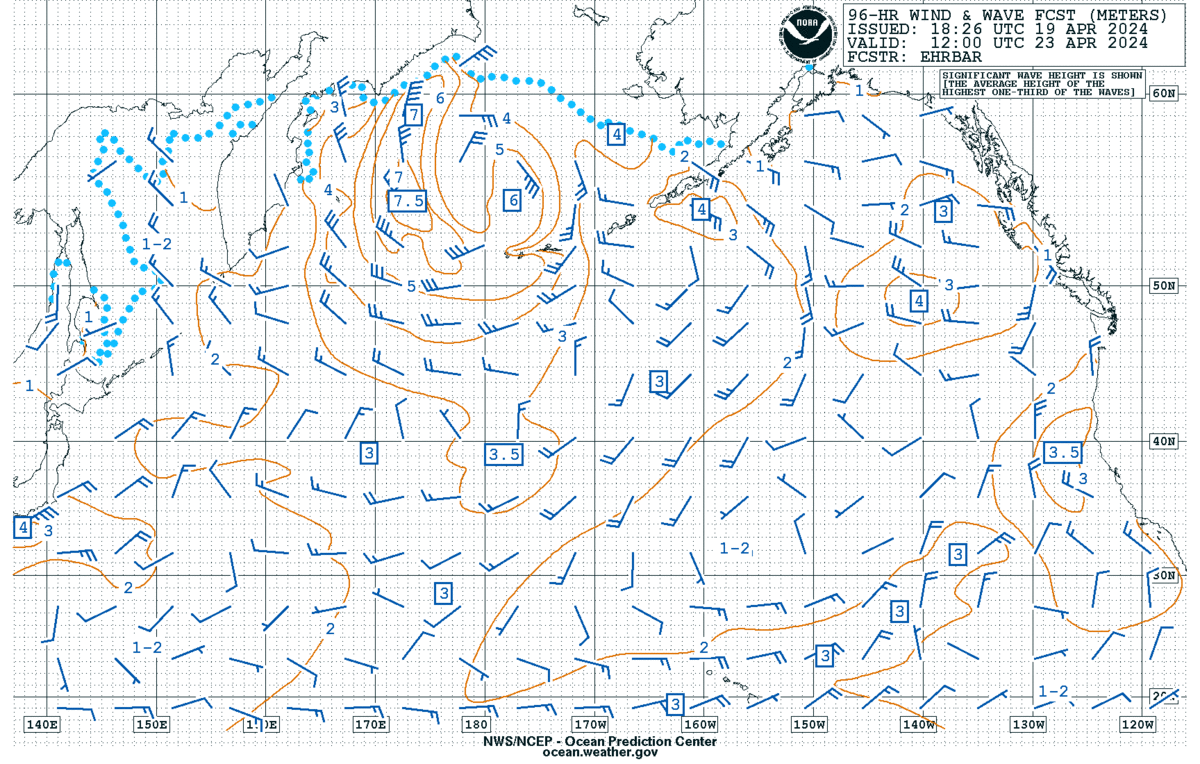
| 96HR Wind/Wave Forecast VT12Z 20N-70N 115W-135E | |
 |
 |
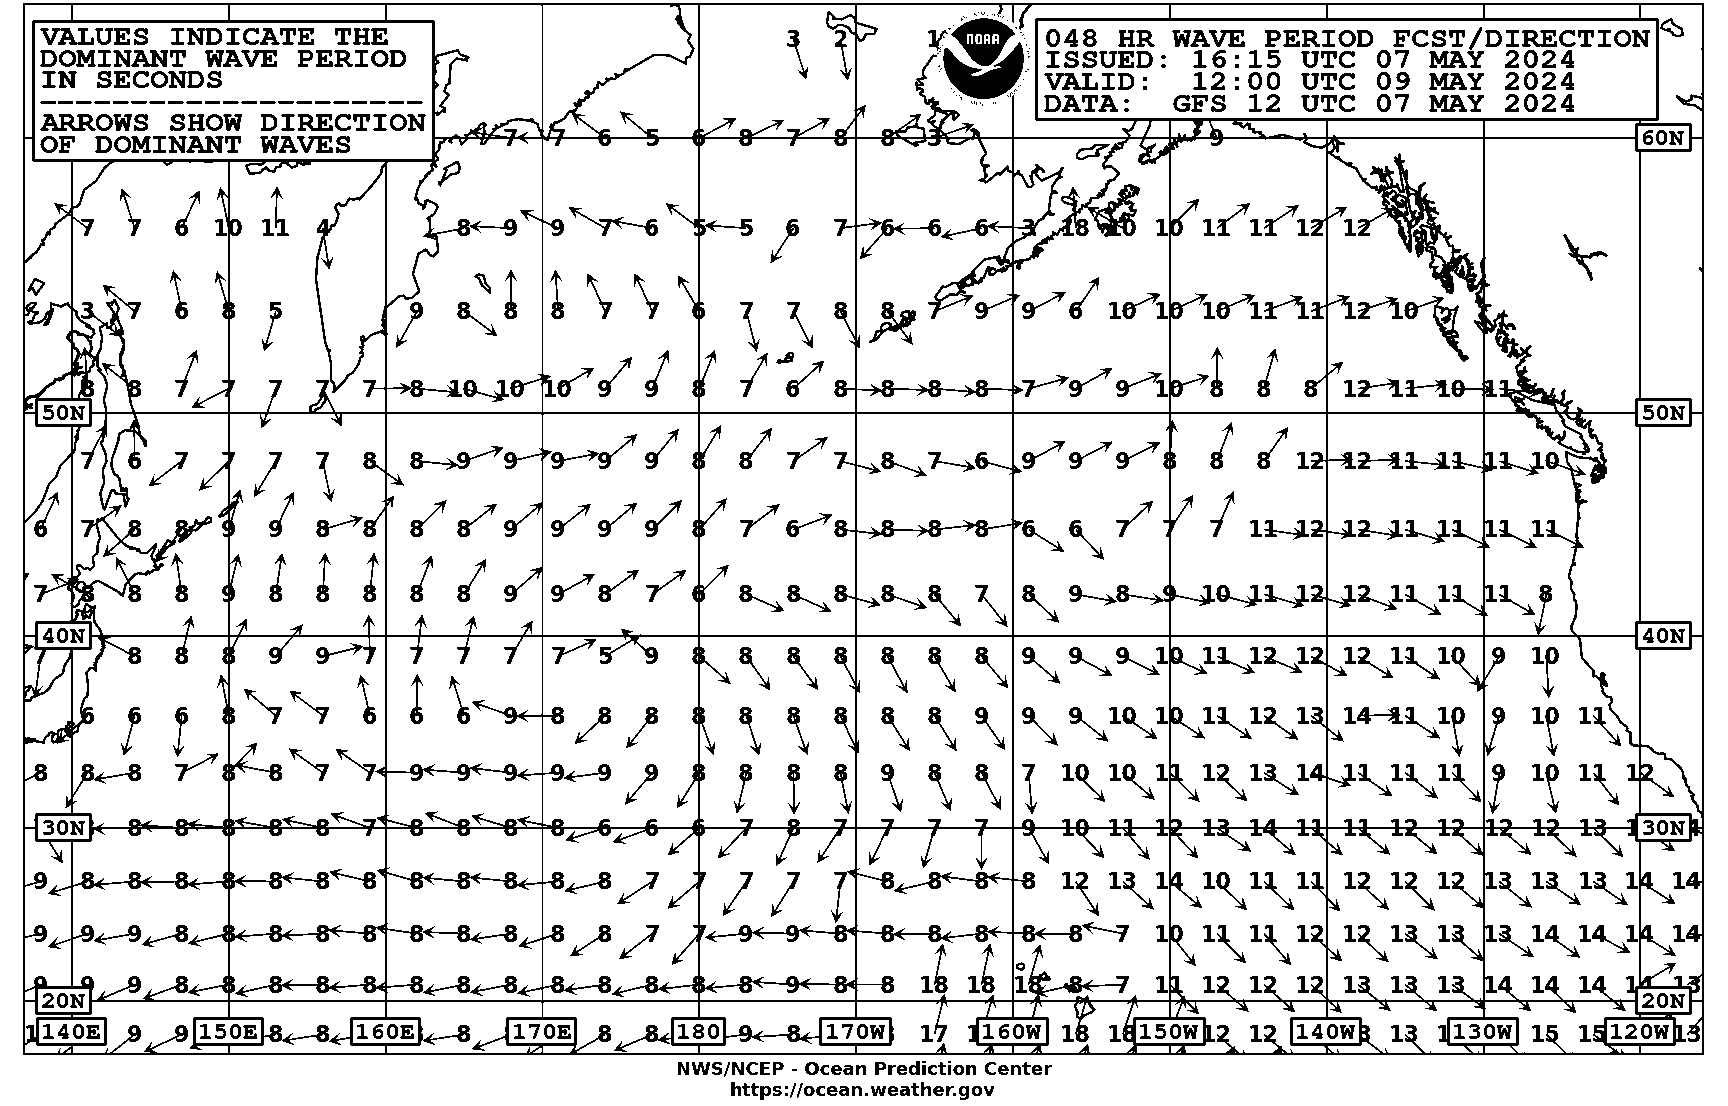
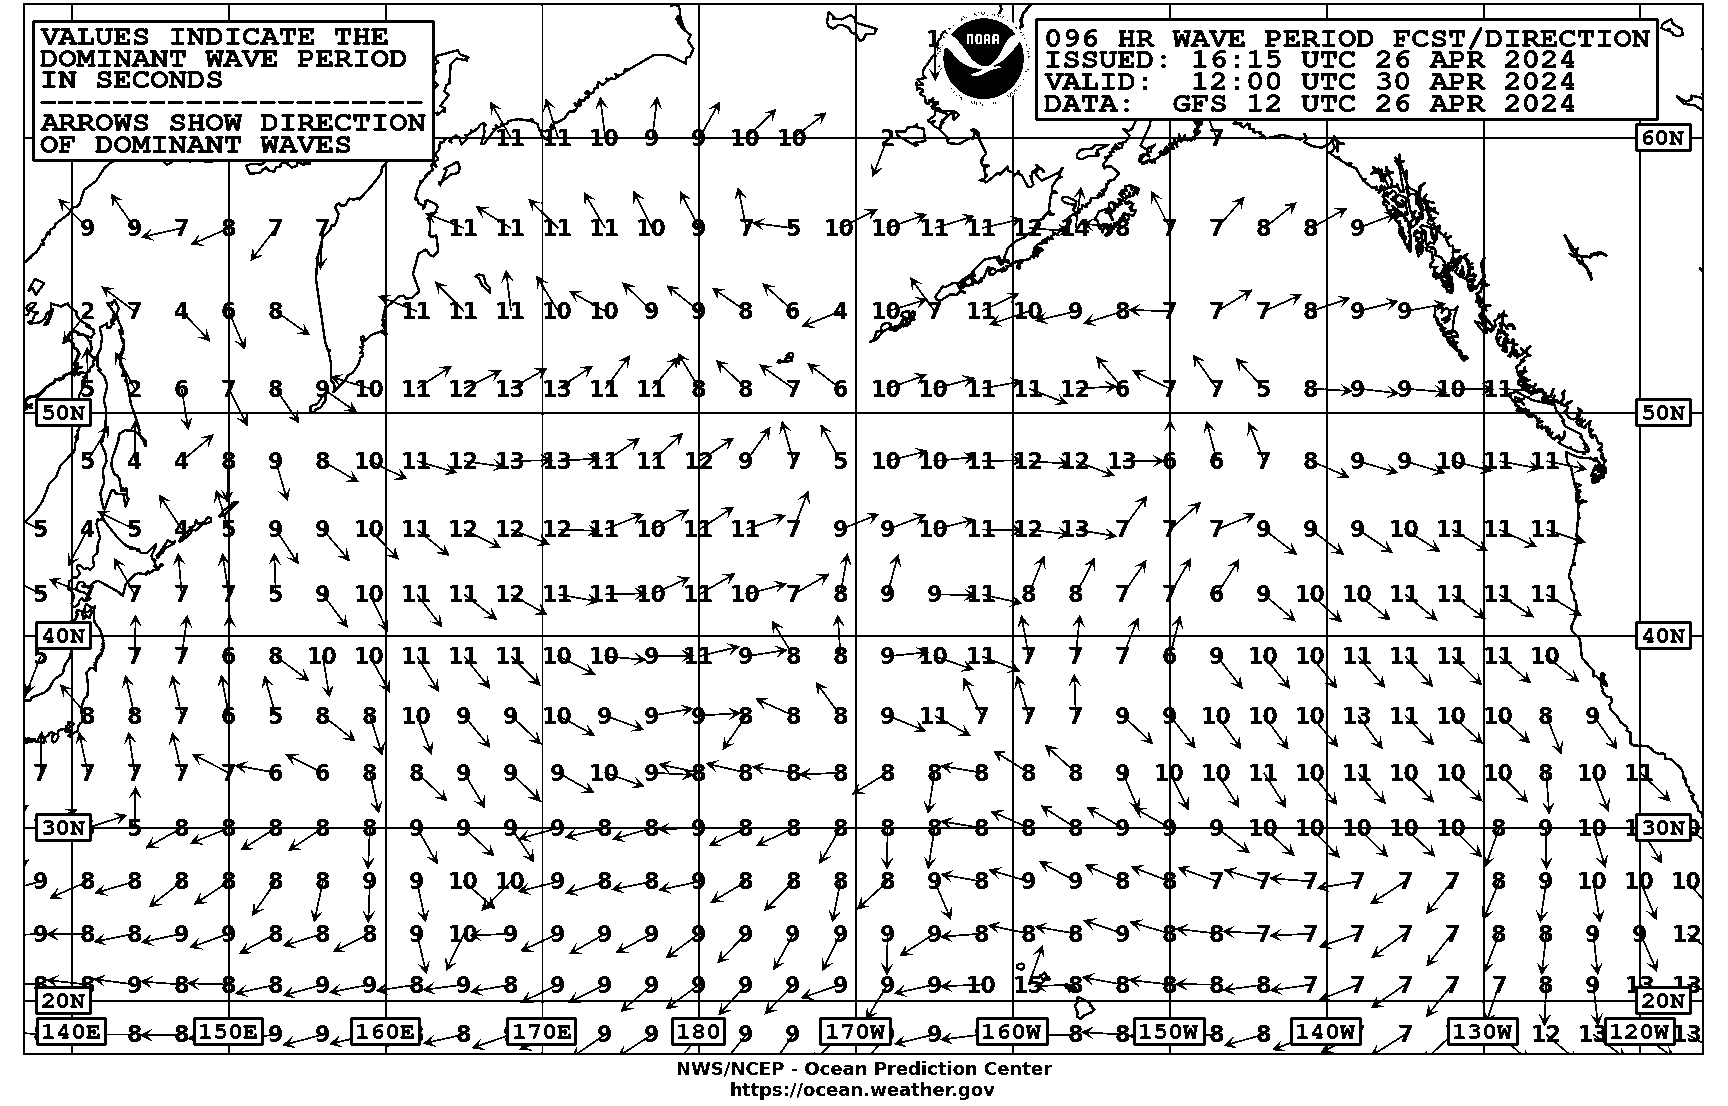
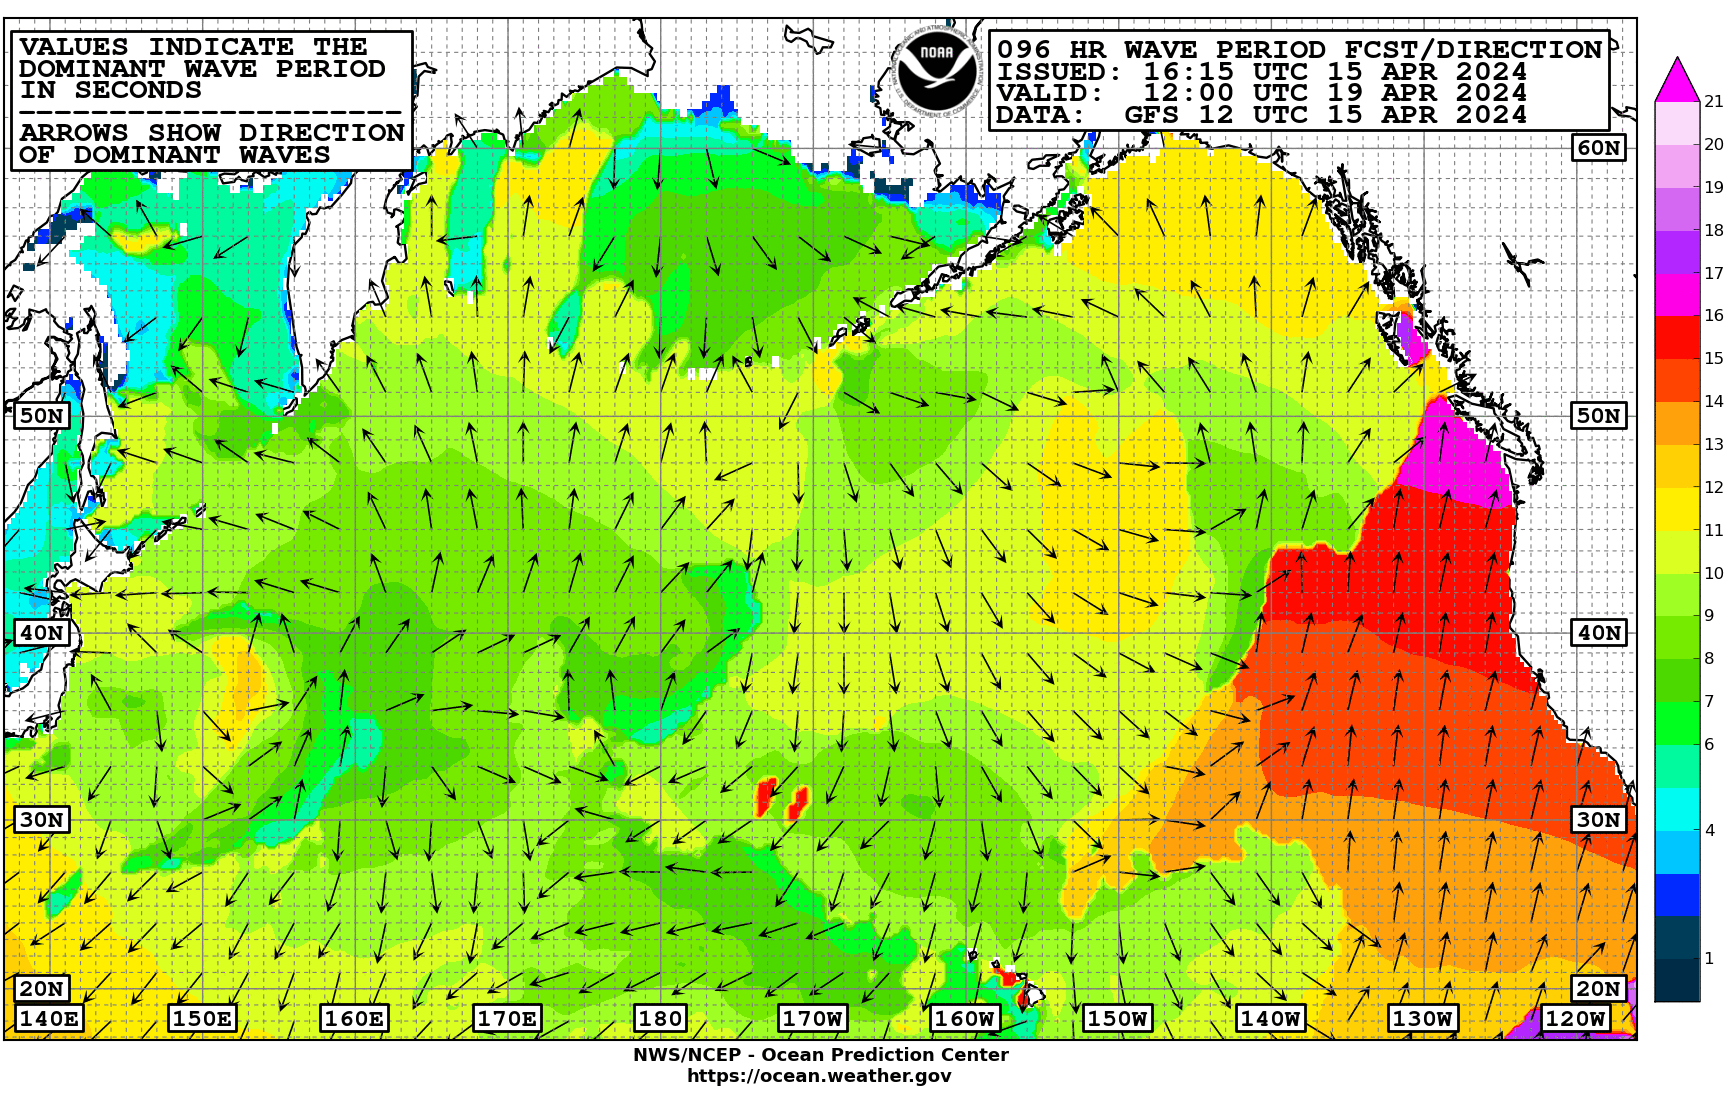
| 96HR Wave Period/Swell Dir VT12Z 20N-70N 115W-135E | |
 |
 |
| * Not transmitted via Honolulu radiofax but listed here for convenience | |||
| Surface Charts - Central Pacific | |||
|---|---|---|---|
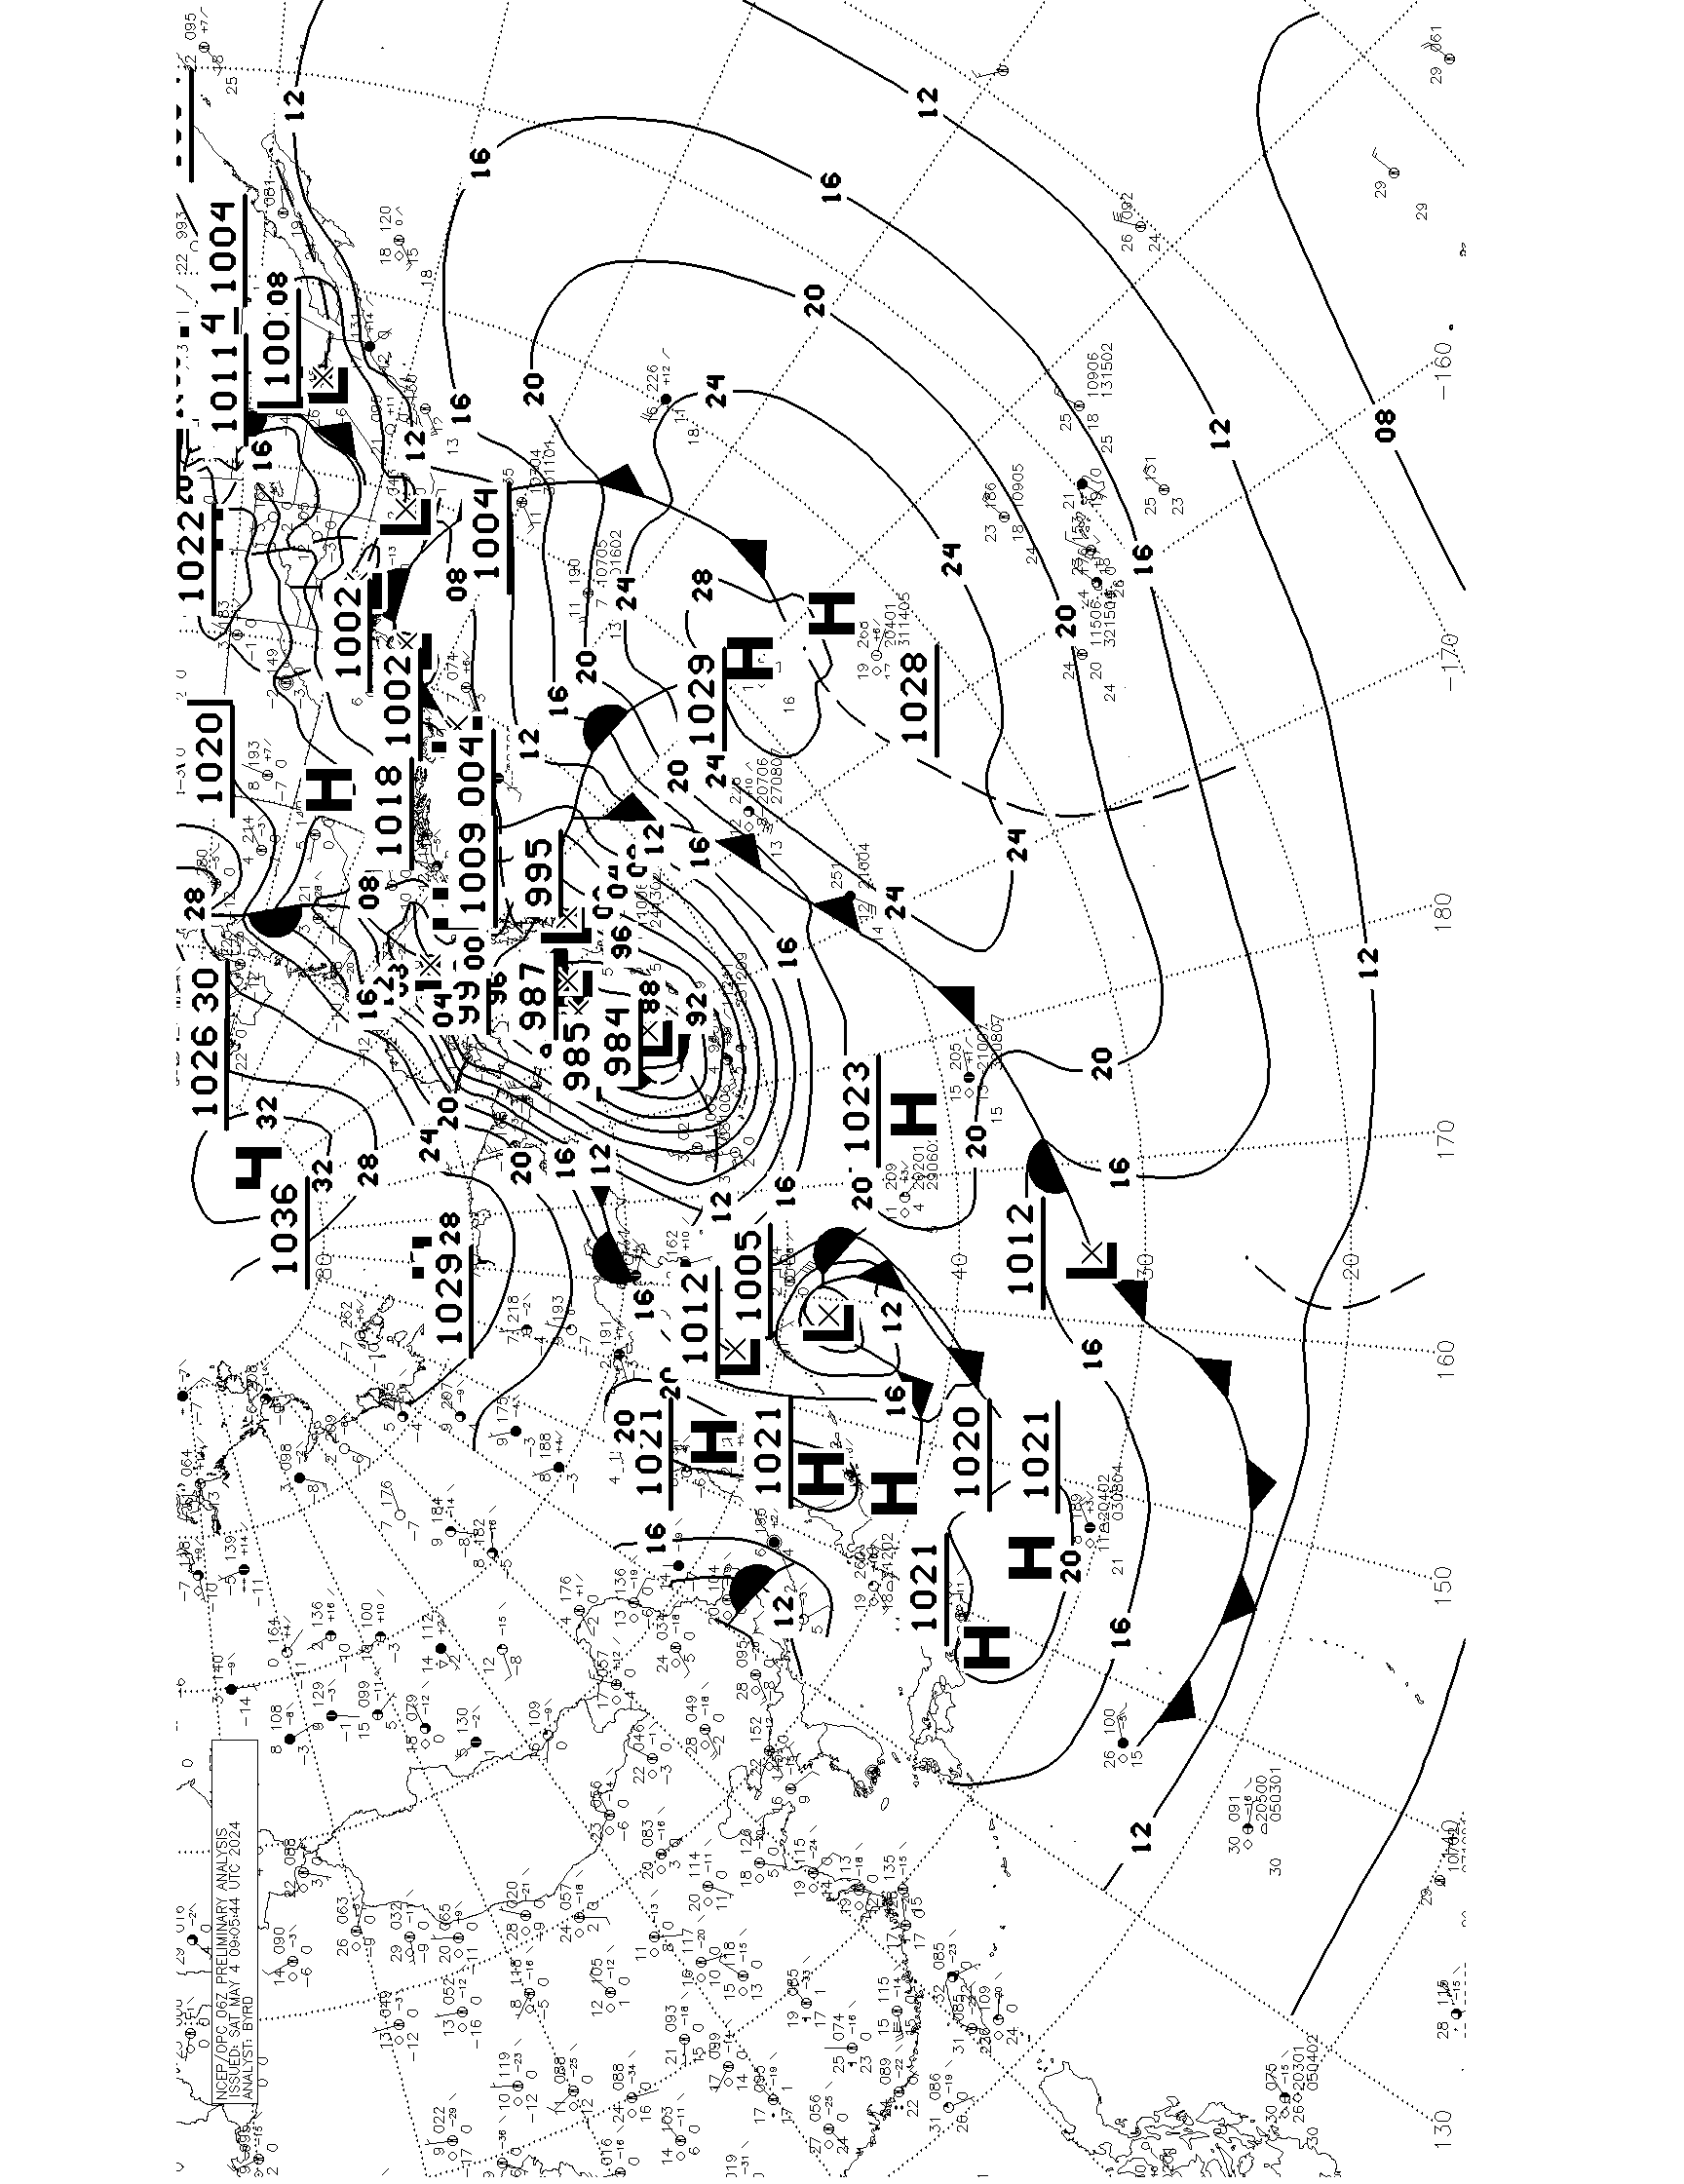
| 00/06/12/18Z N Pacific Prelim Sfc Analysis 20N-80N 110W-110E* | |
 |
|
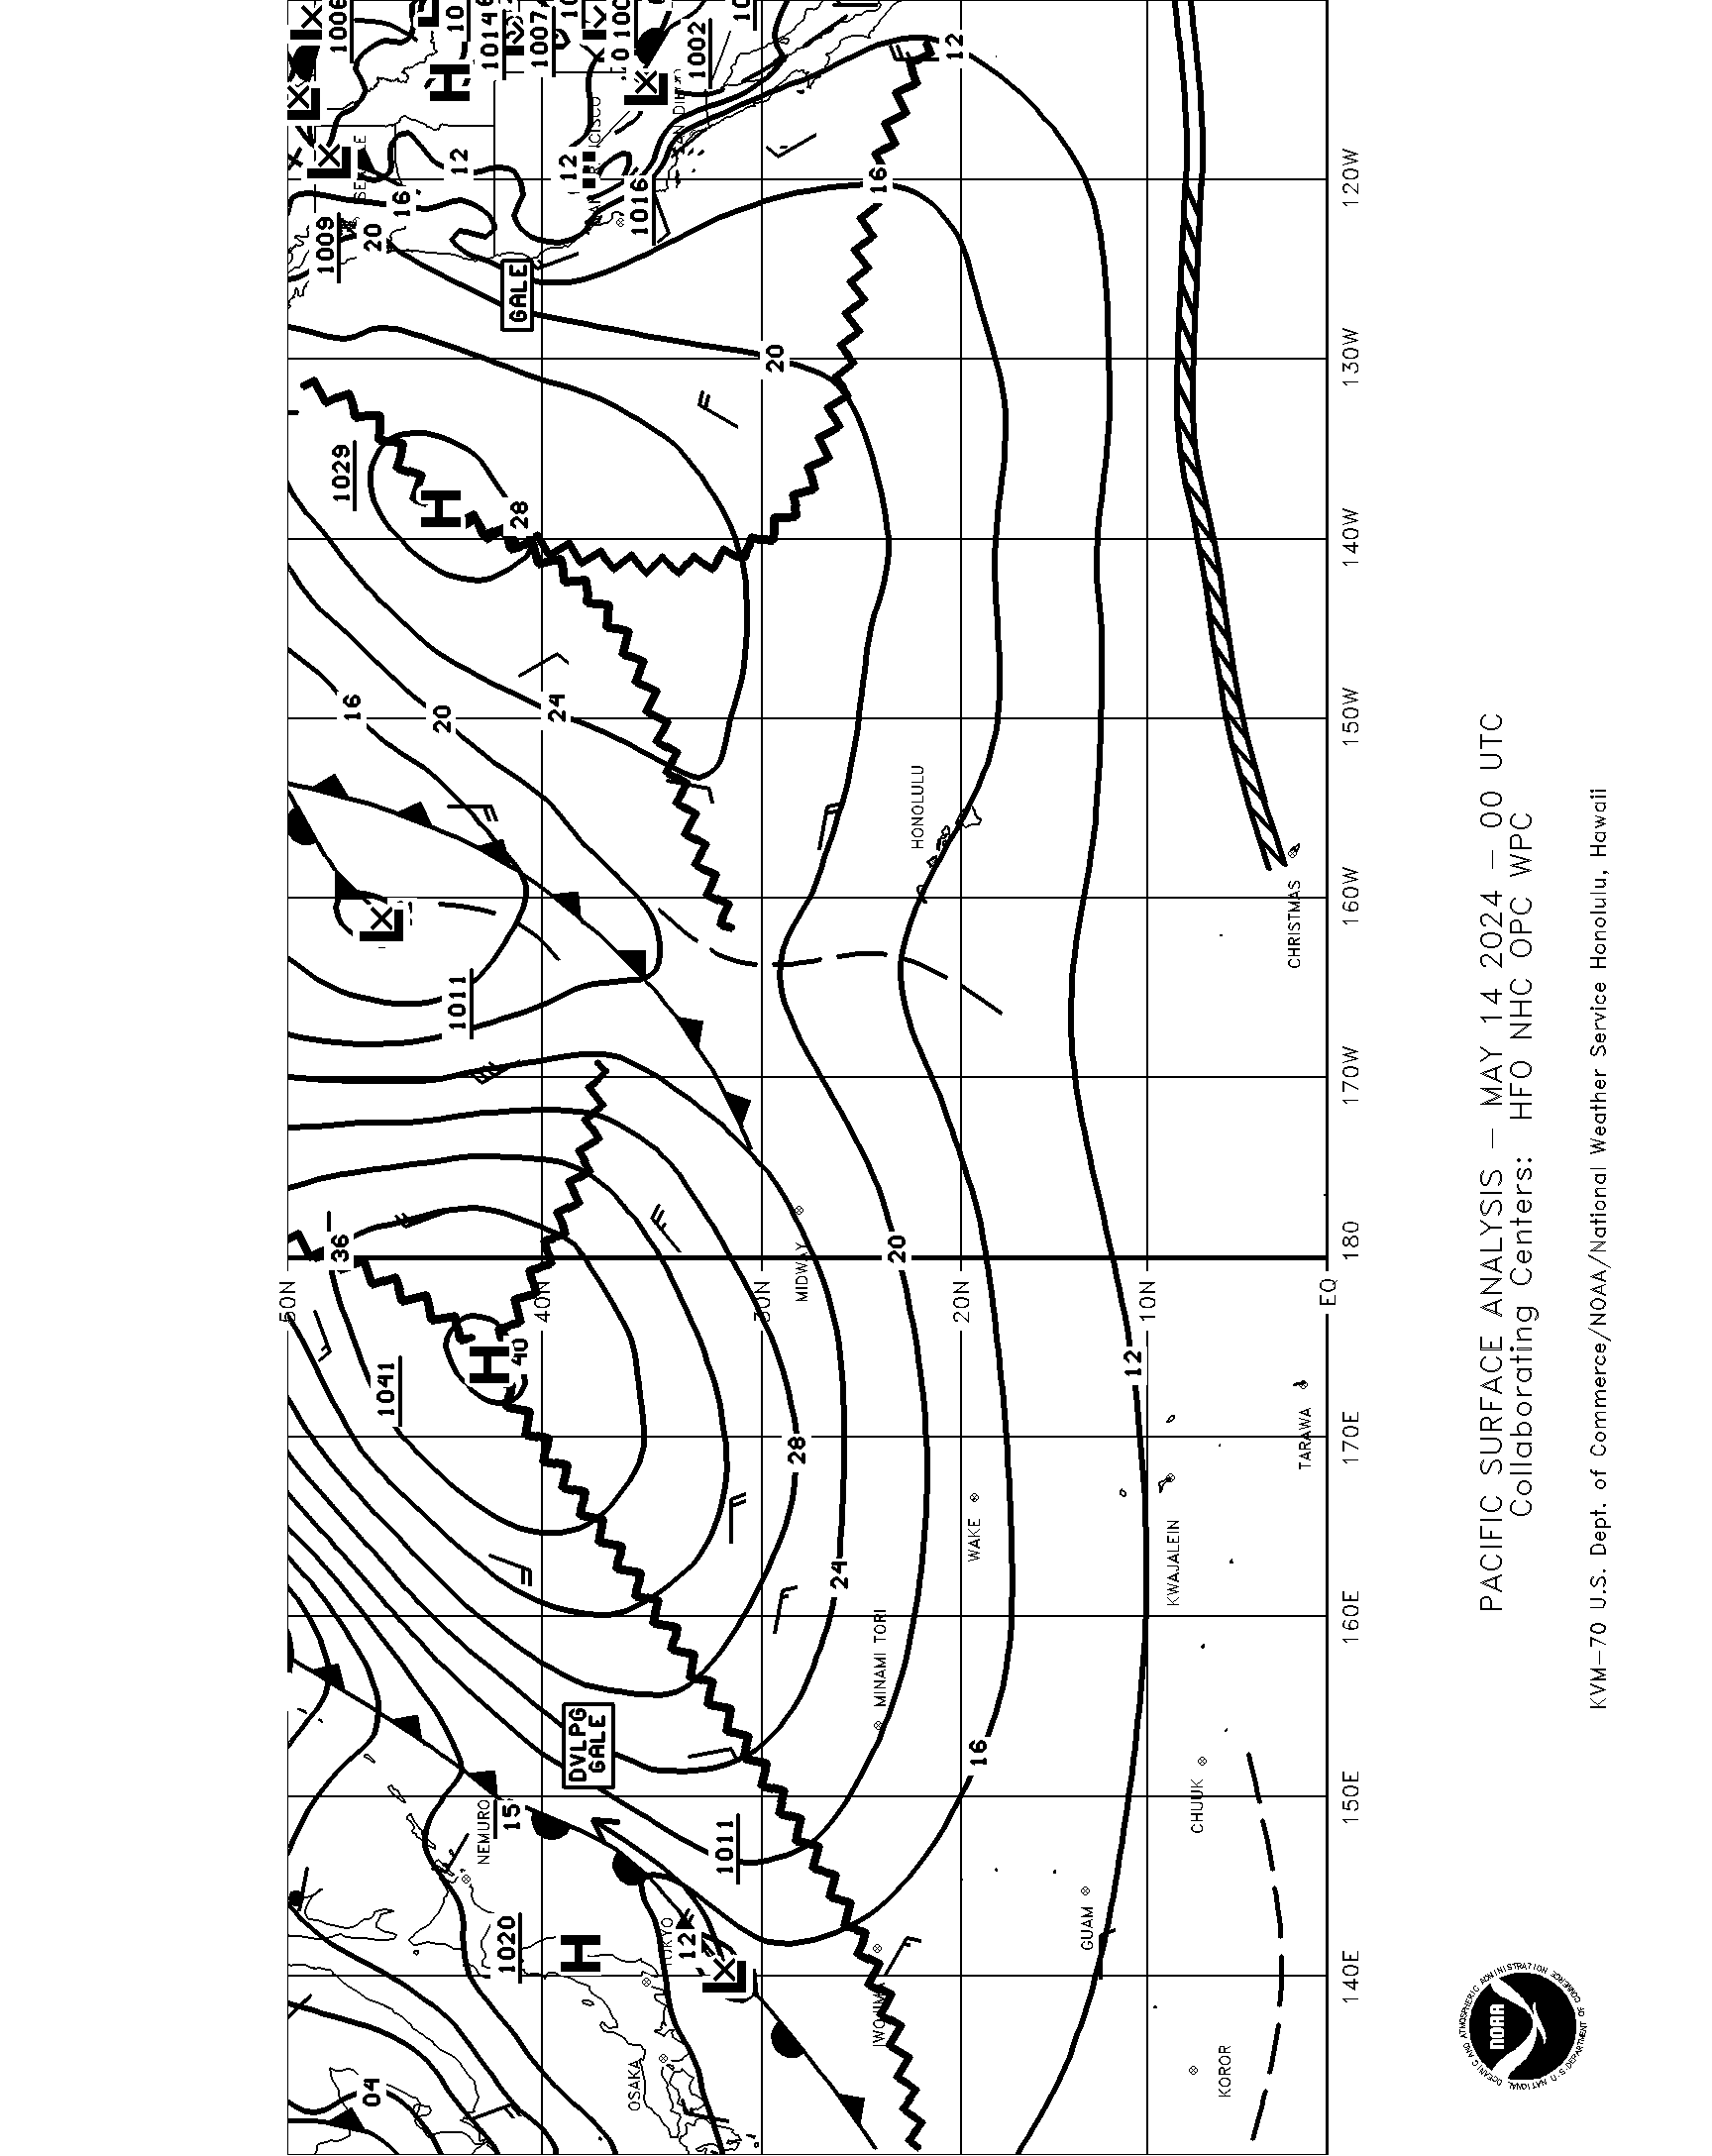
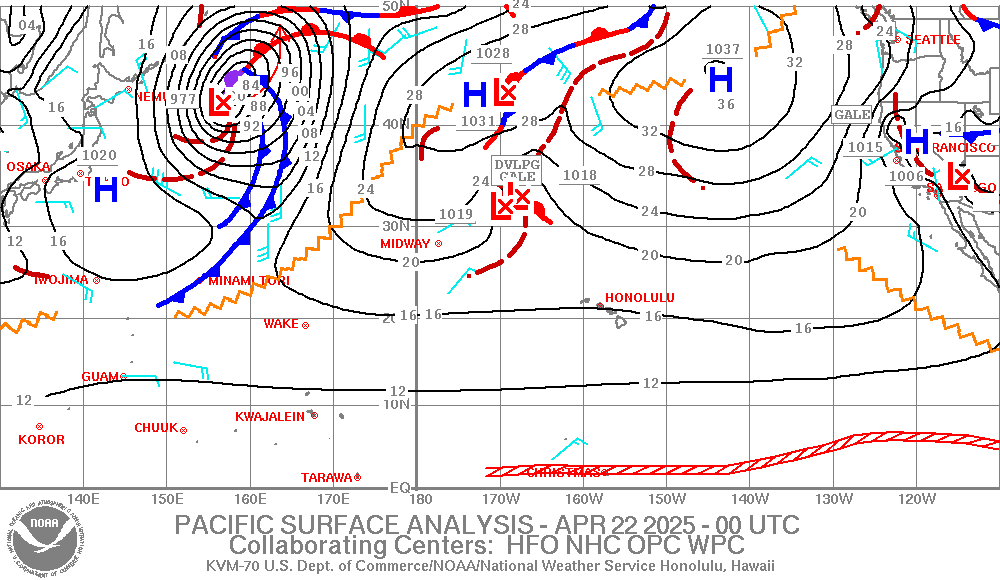
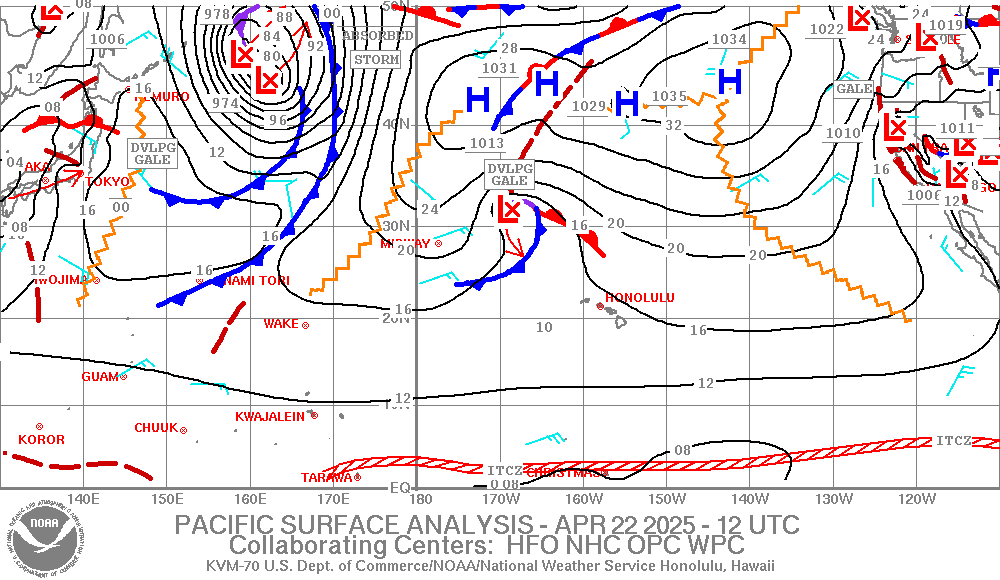
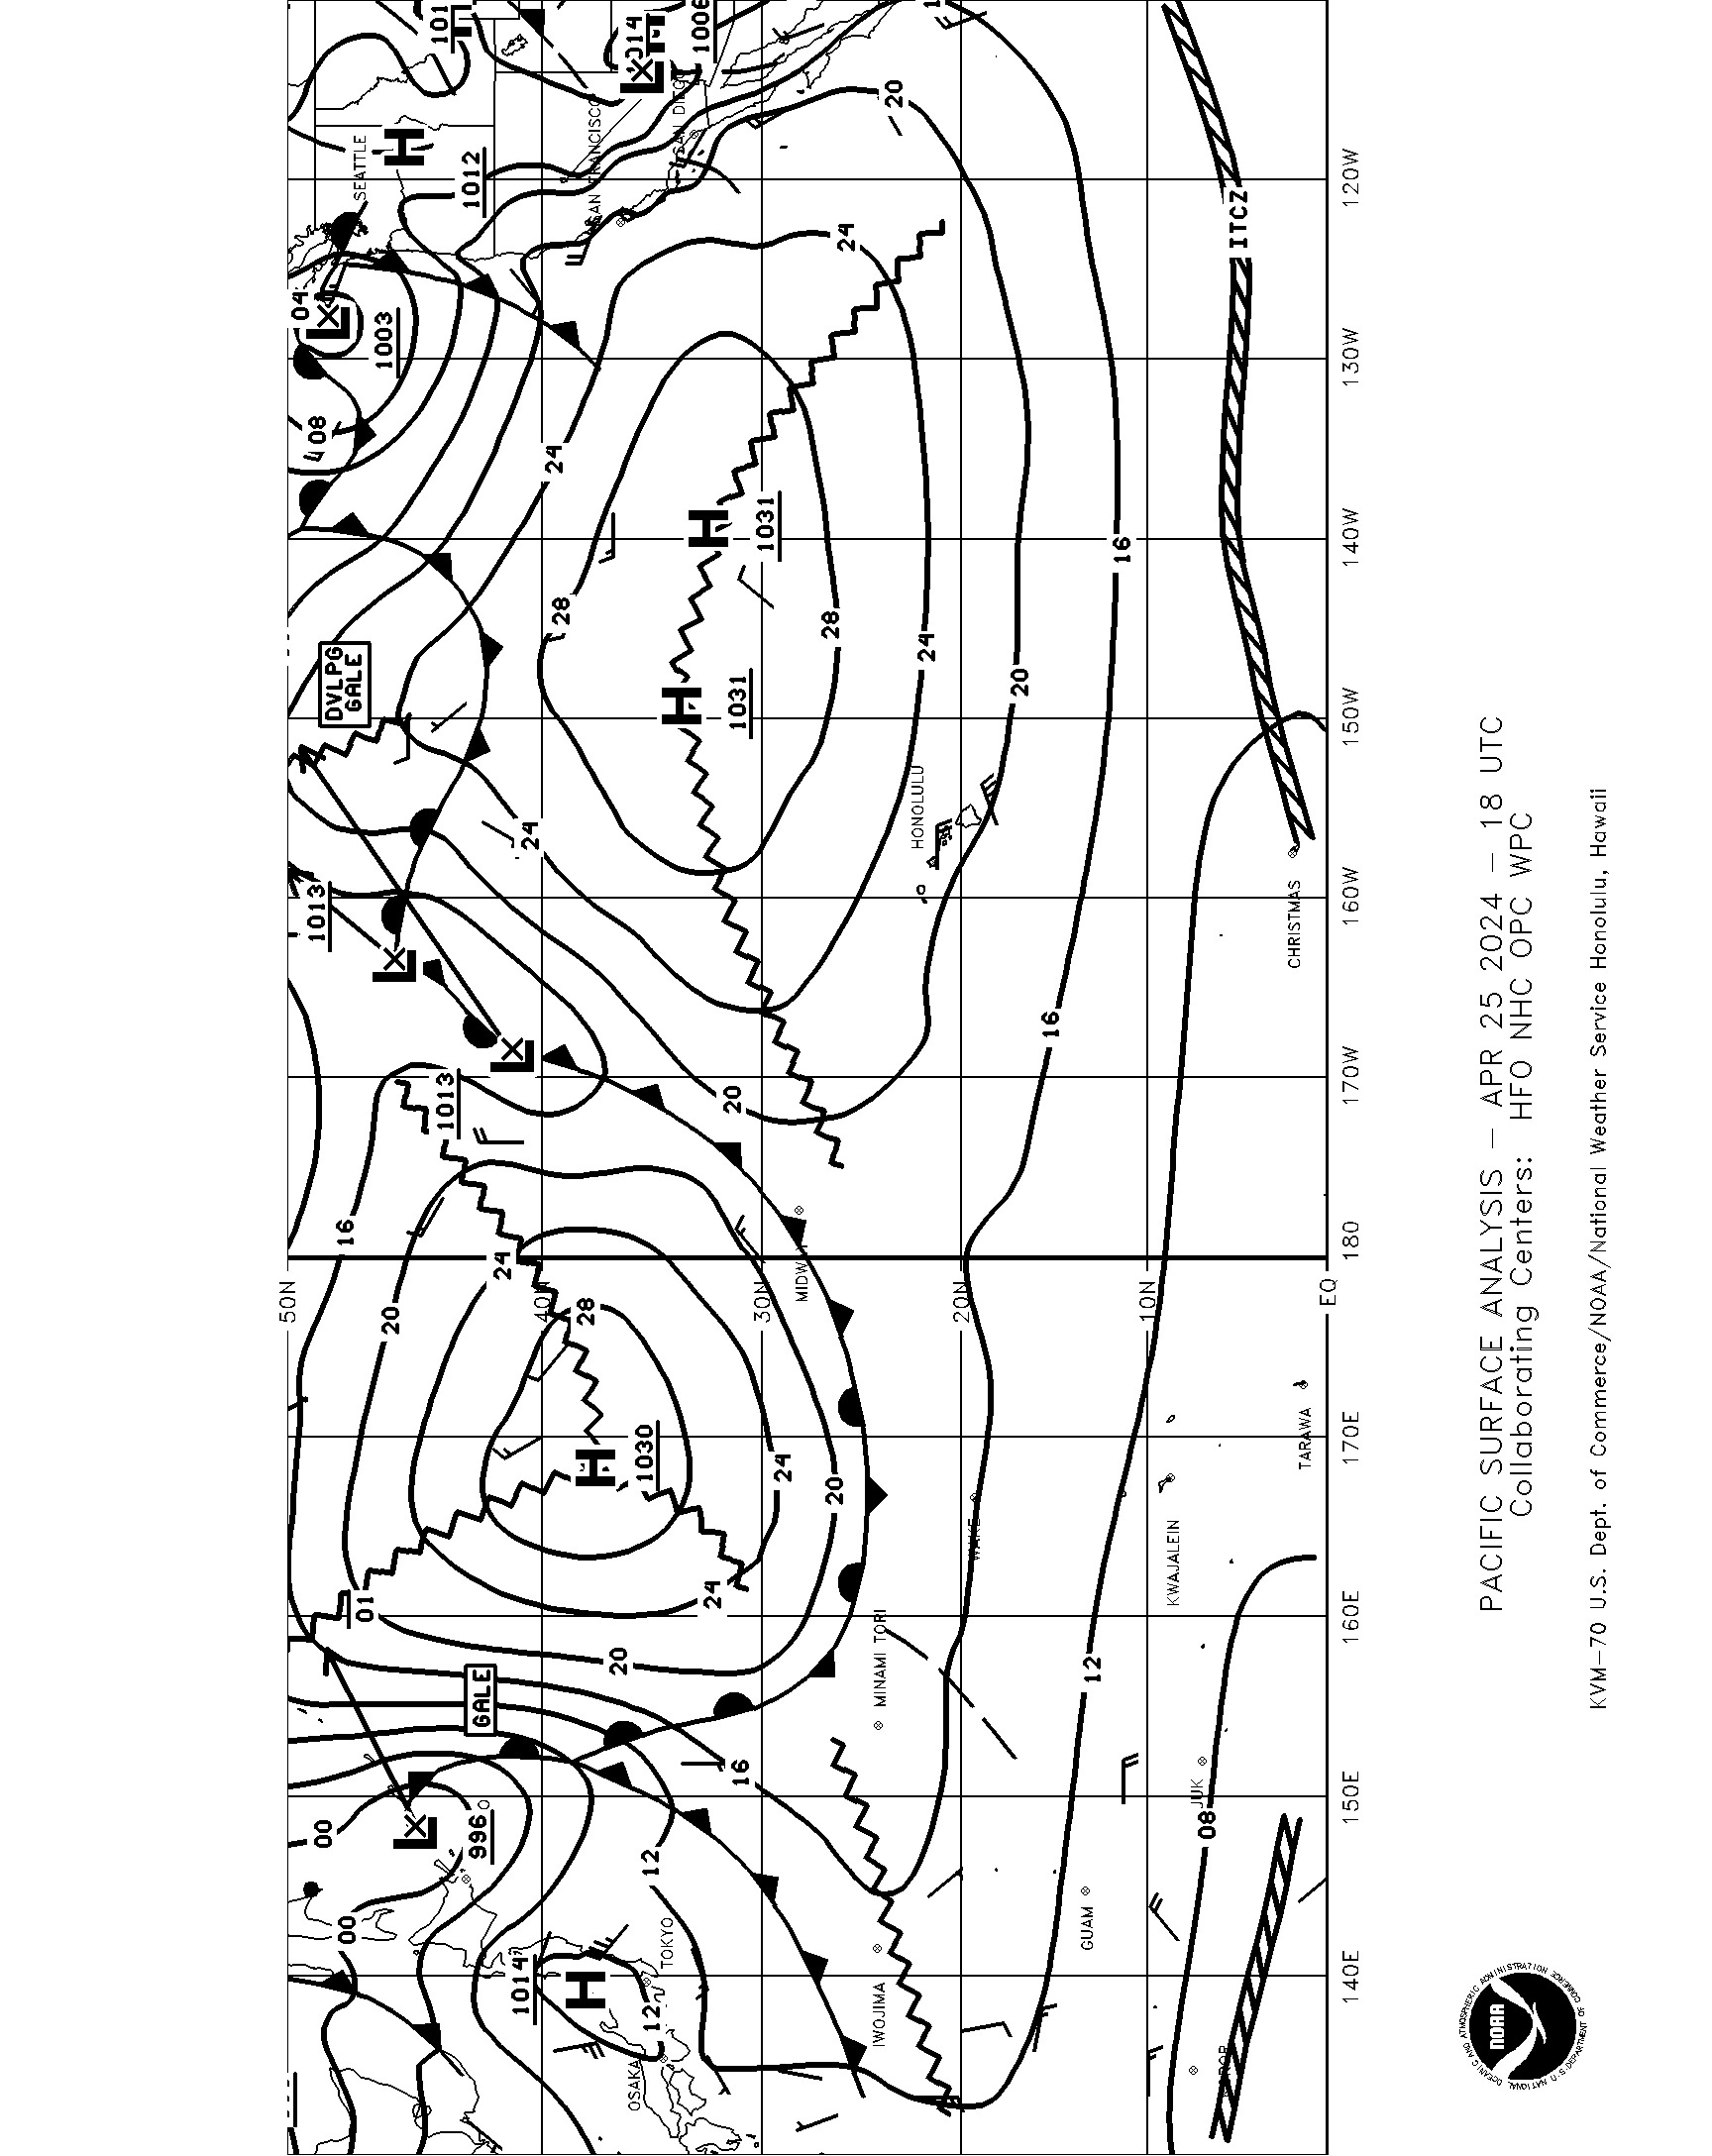
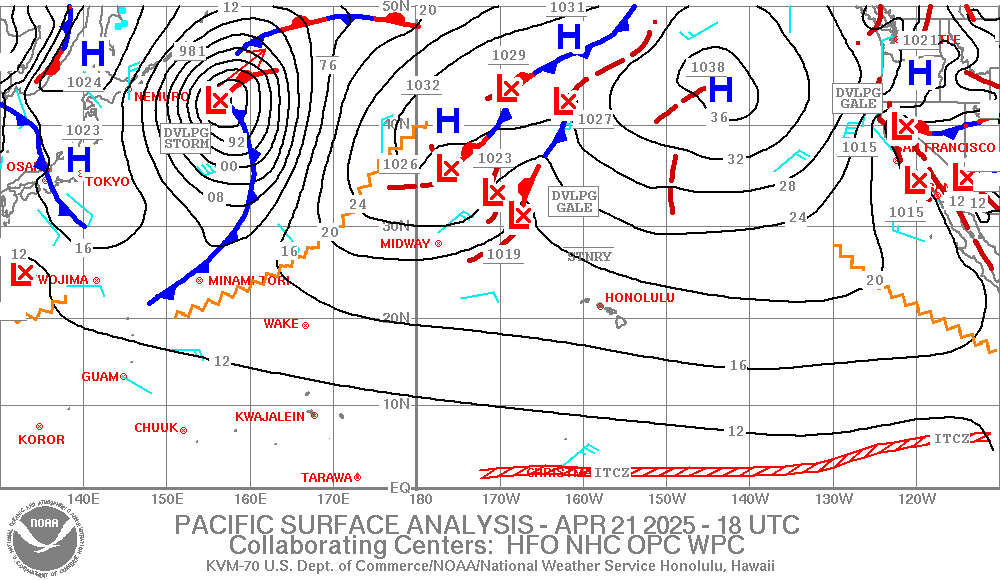
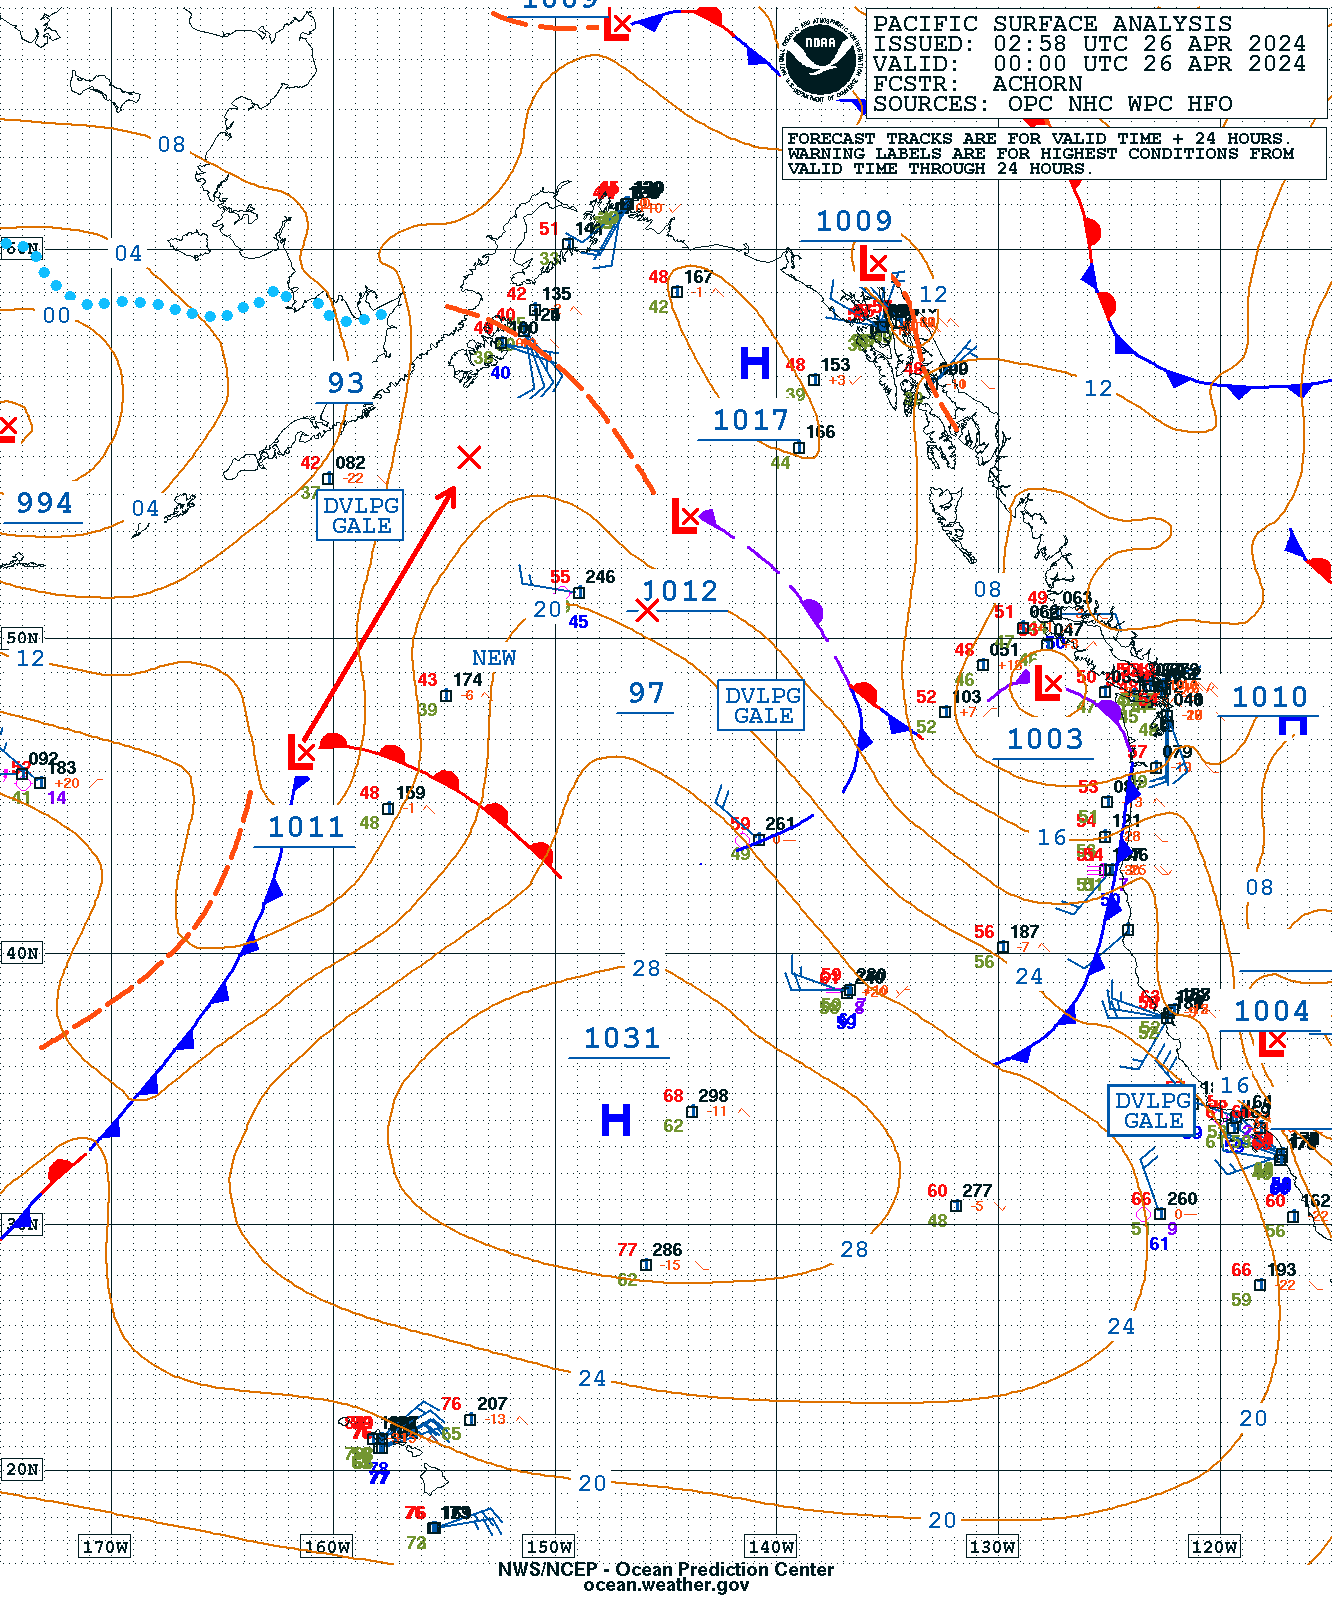
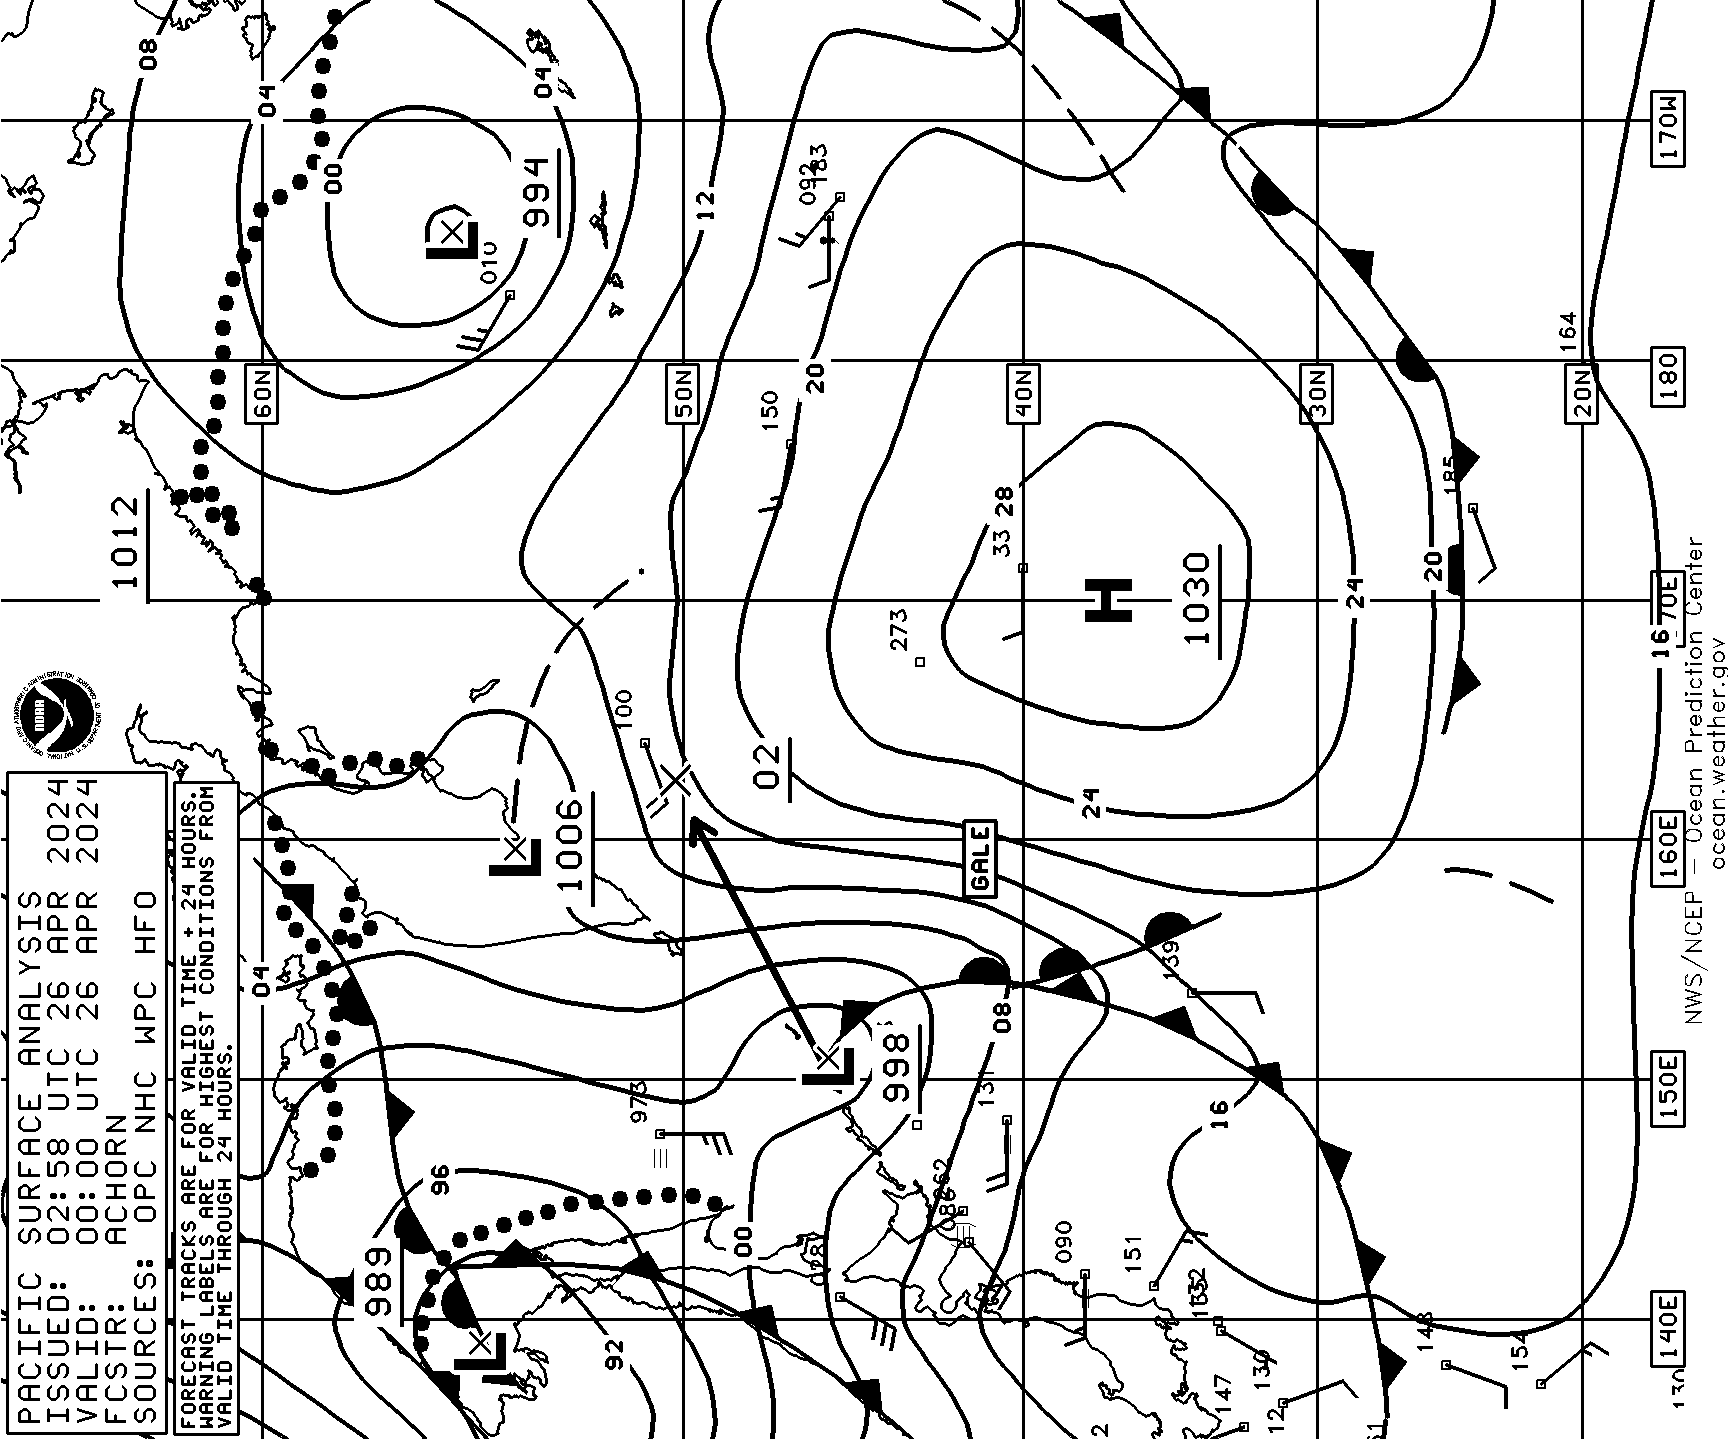
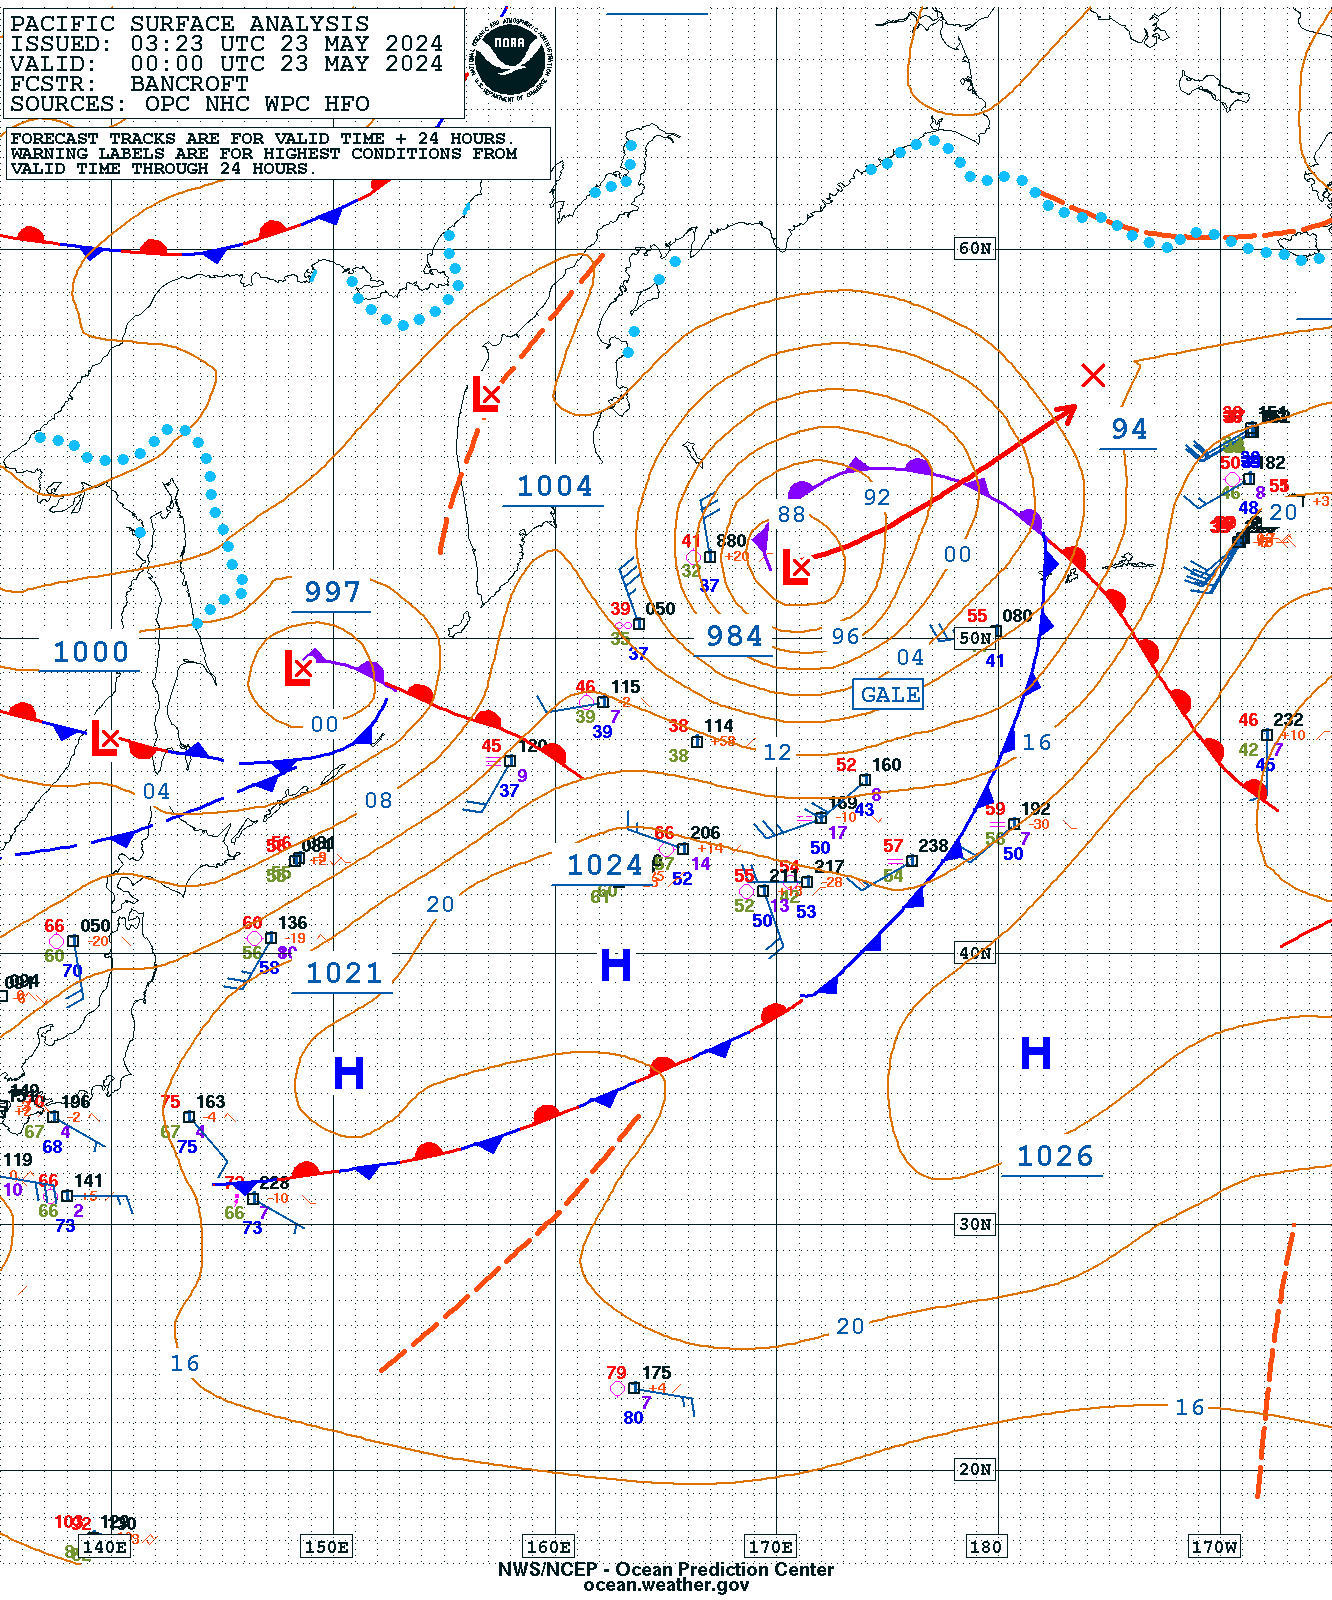
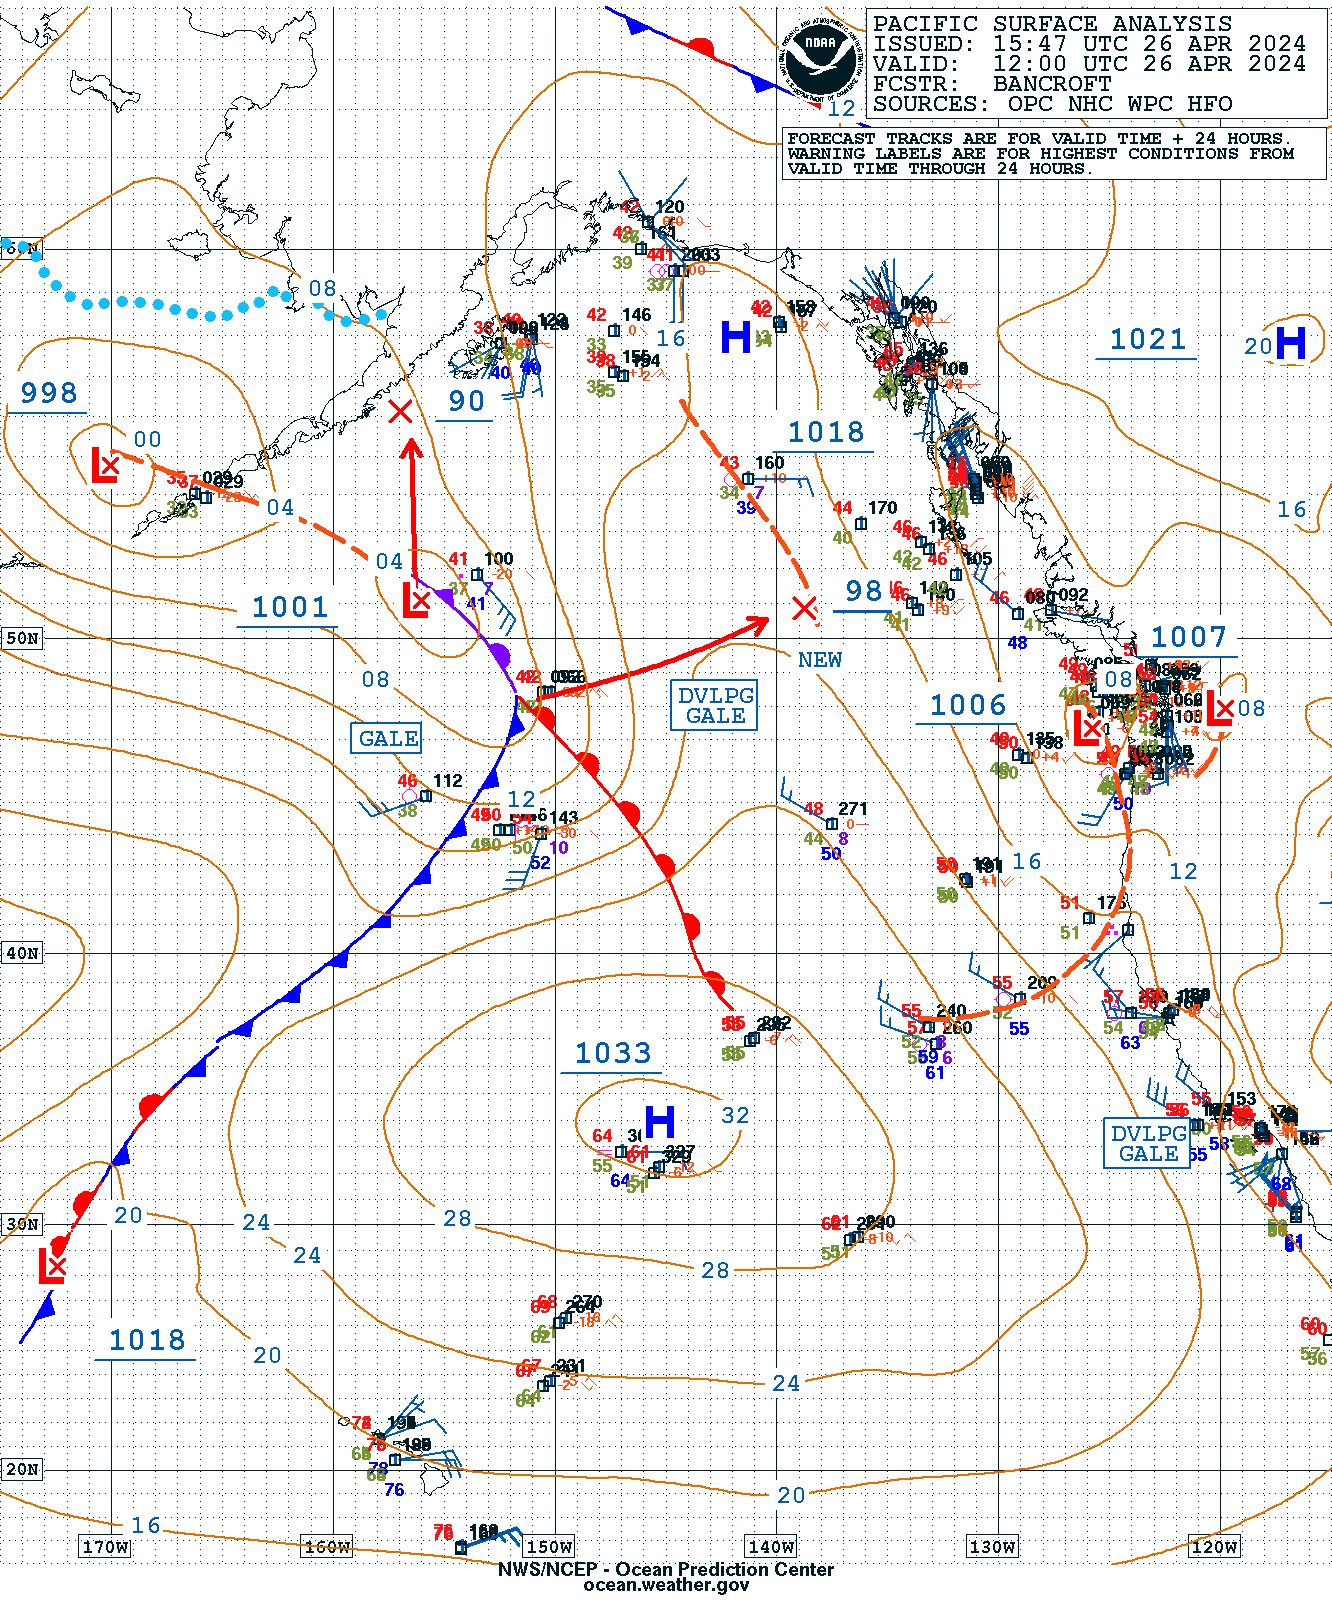
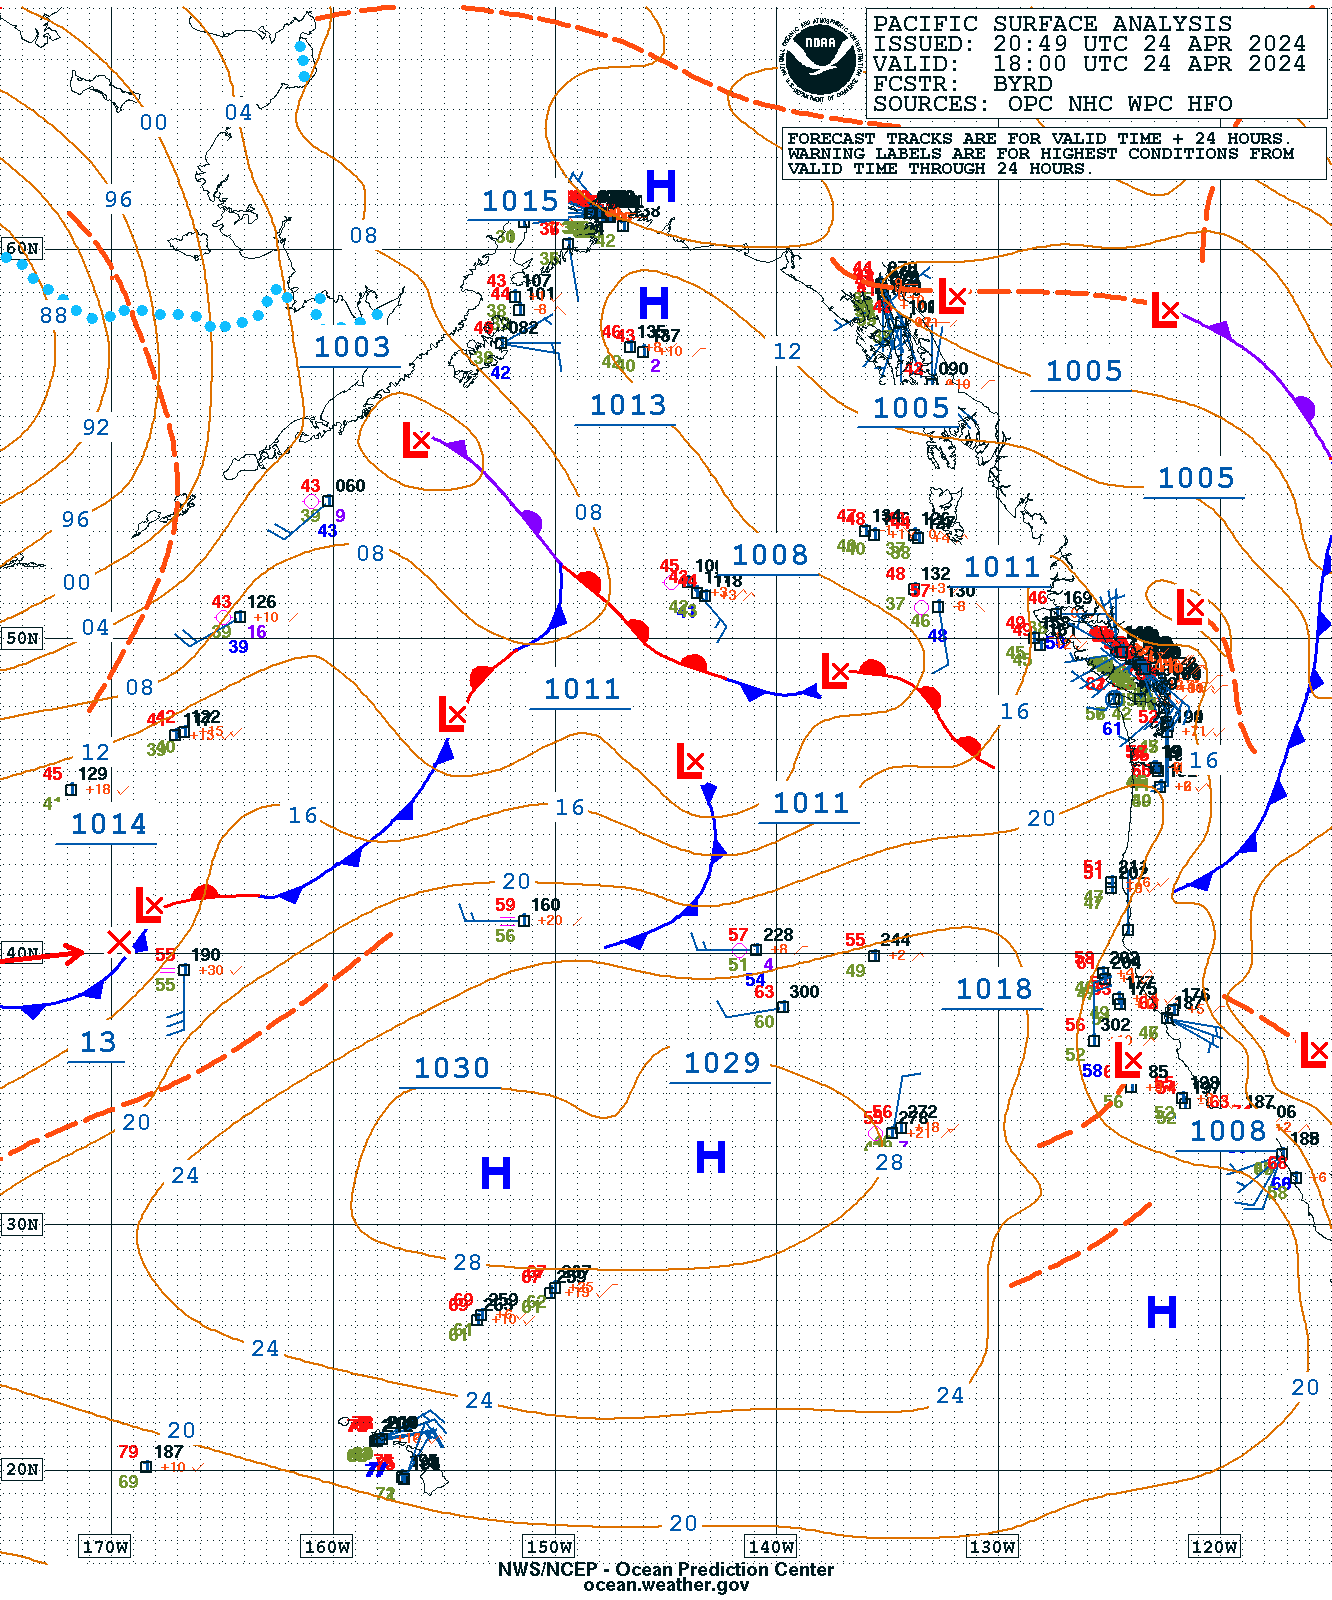
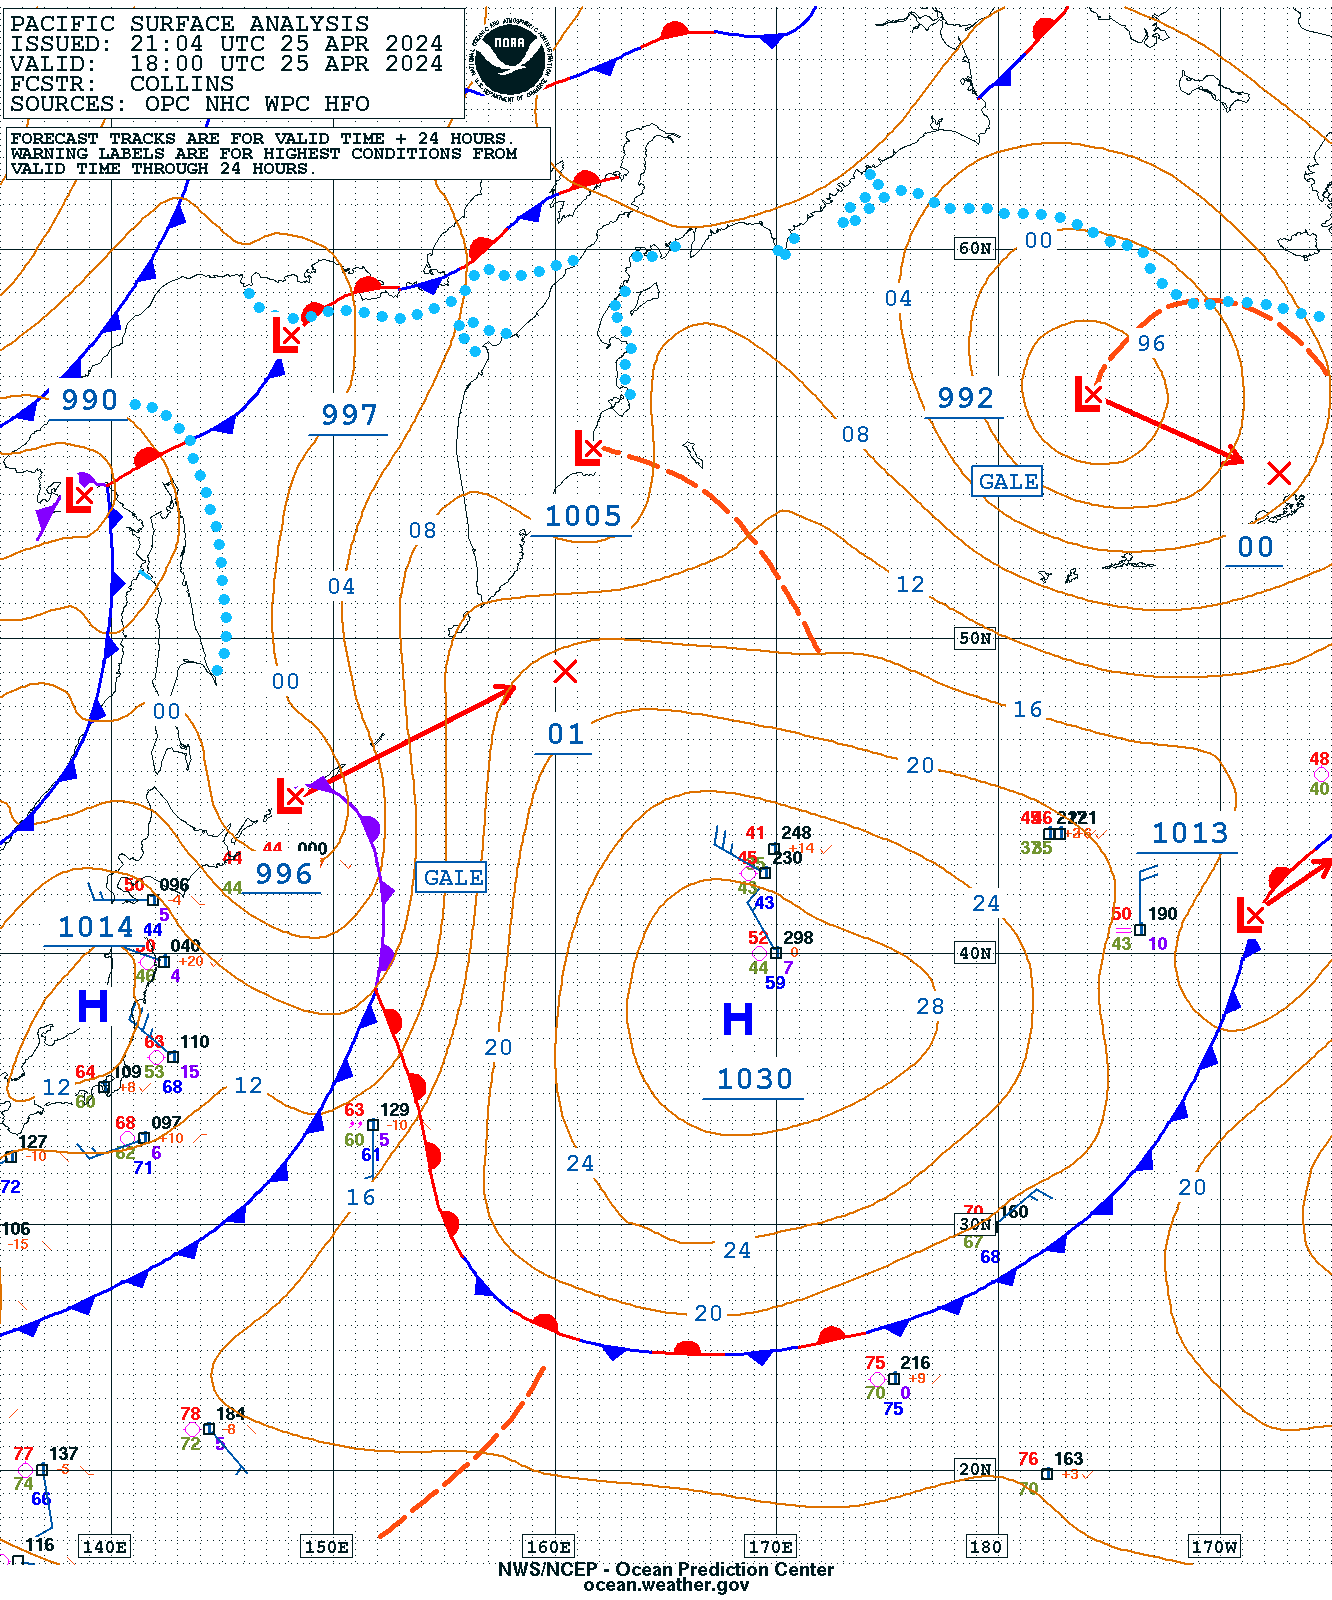
| 00Z Pacific Surface Analysis EQ-50N, 110W-130E | |
 |
 |
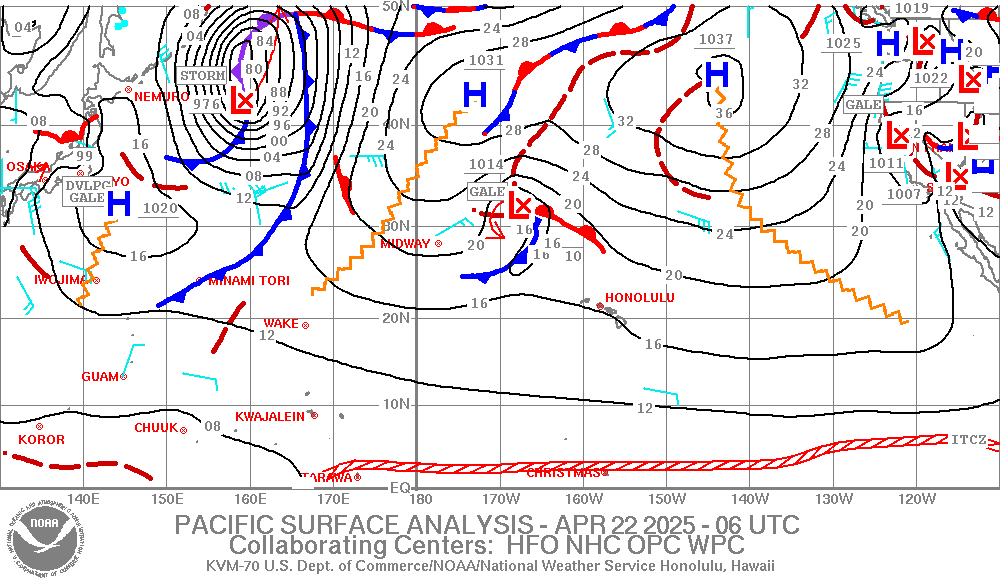
| 06Z Pacific Surface Analysis EQ-50N, 110W-130E | |
 |
 |
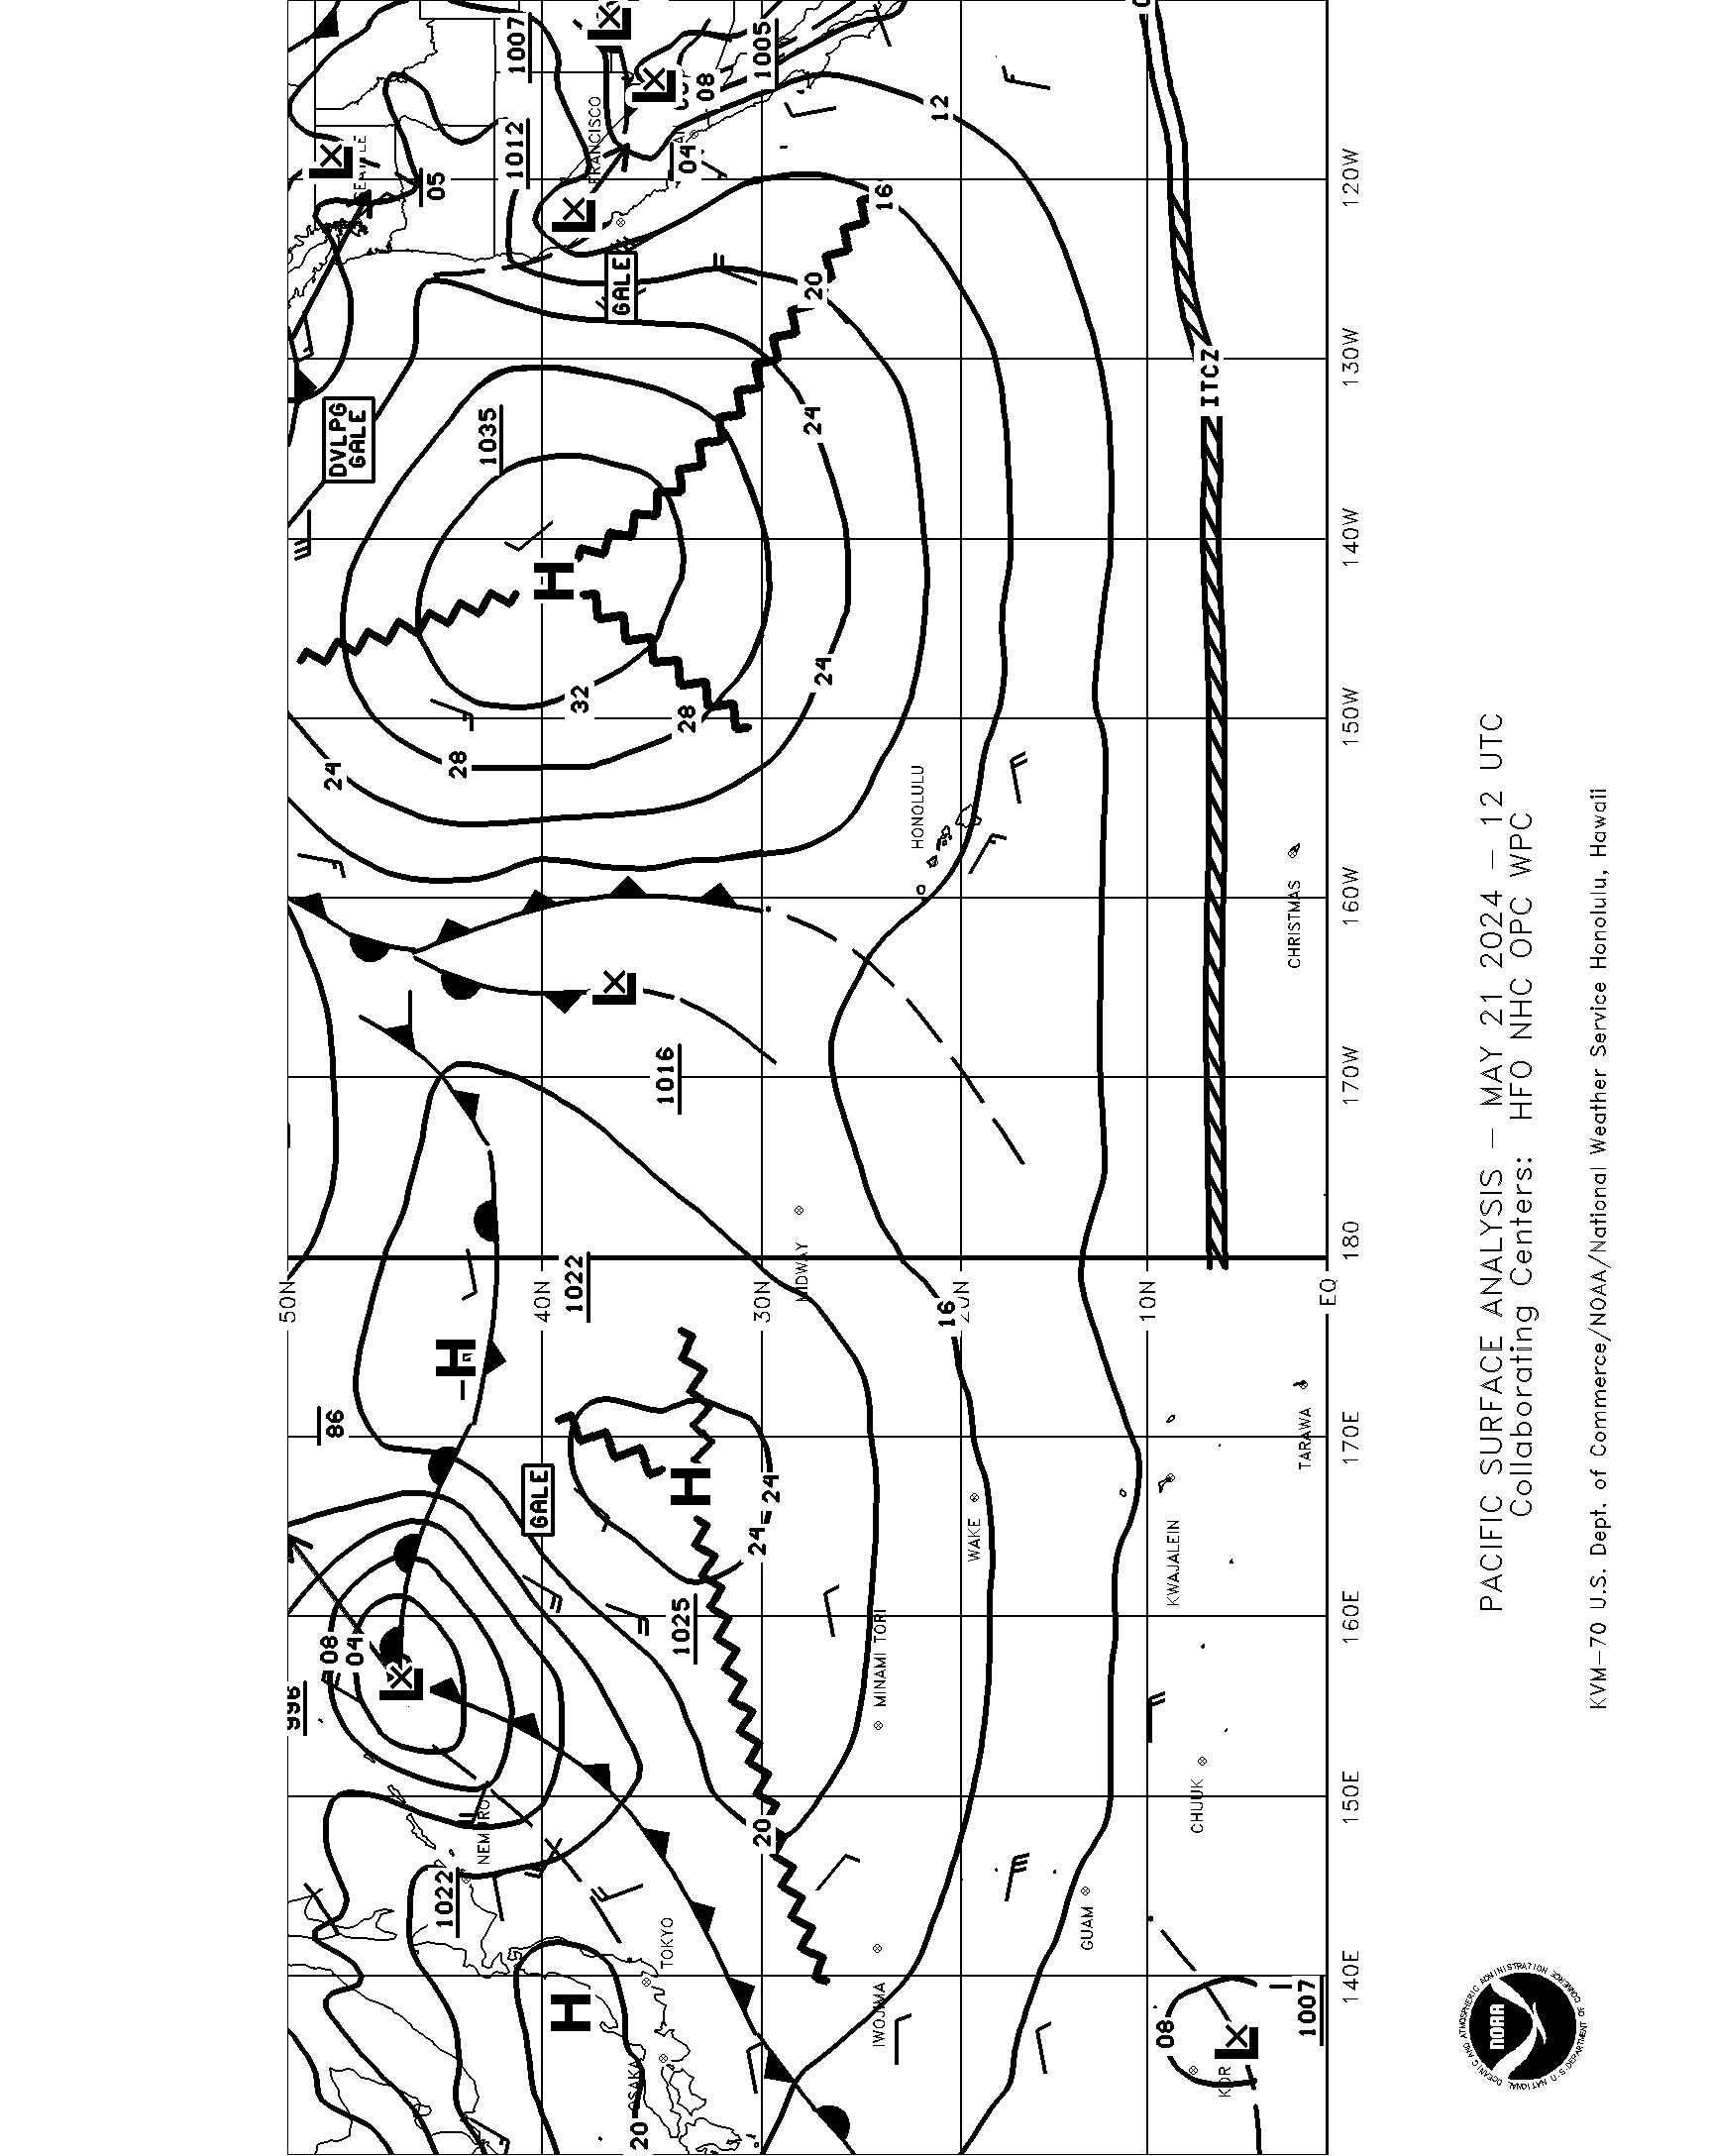
| 12Z Pacific Surface Analysis EQ-50N, 110W-130E | |
 |
 |
| 18Z Pacific Surface Analysis EQ-50N, 110W-130E | |
 |
 |
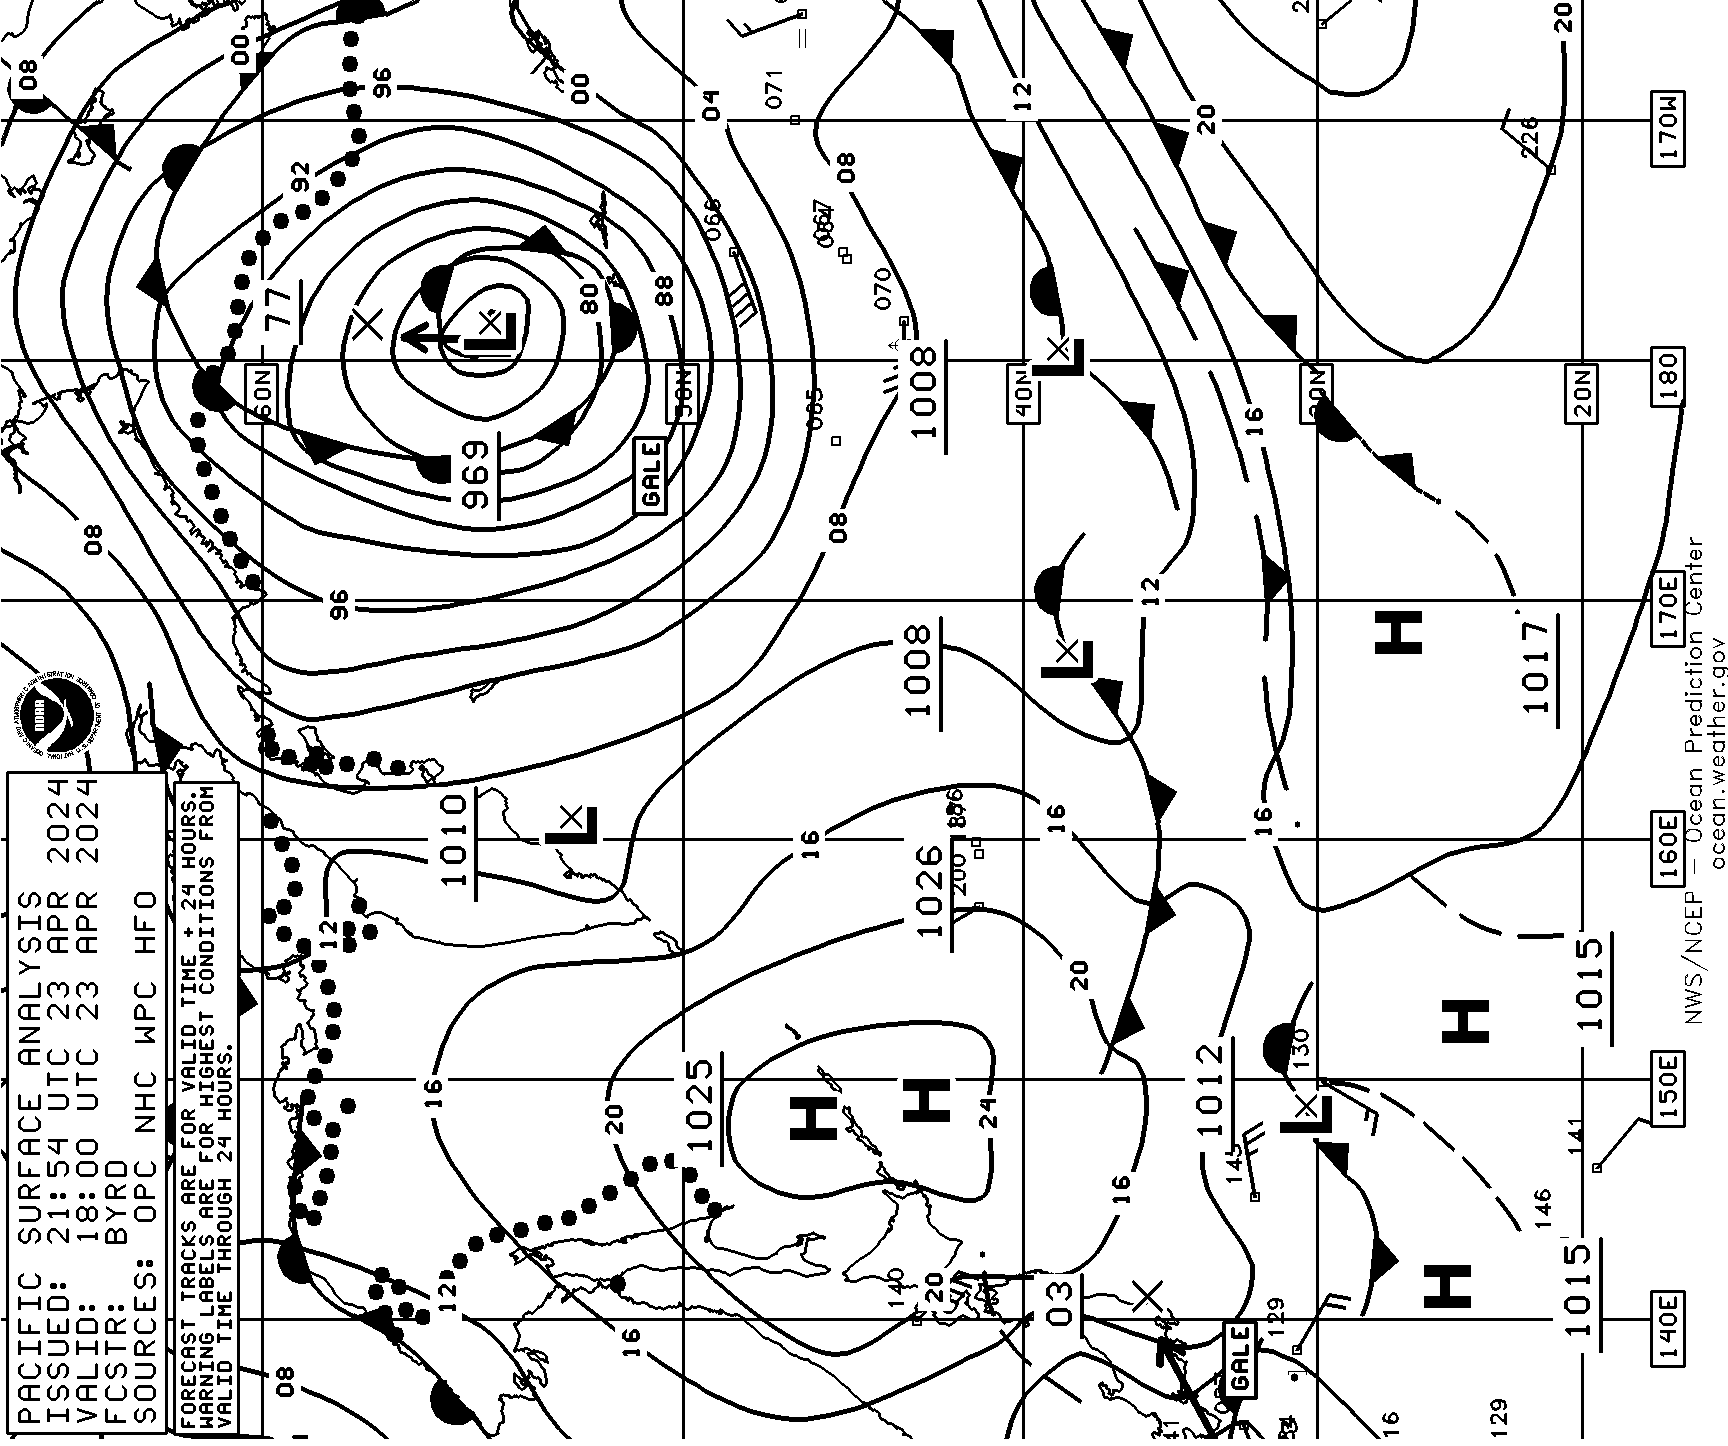
| 00Z N Pacific Surface Analysis EQ-60N 110W-130E* | 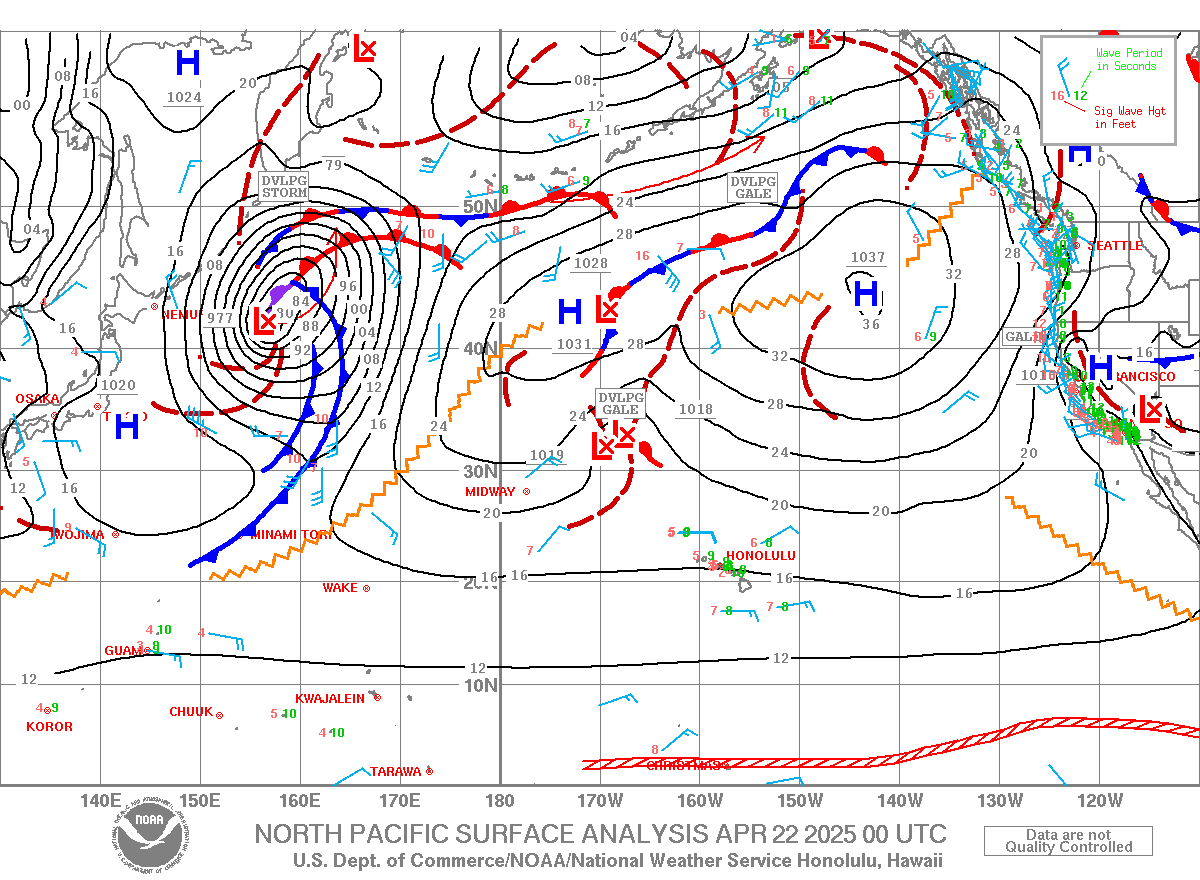 |
||
| 06Z N Pacific Surface Analysis EQ-60N 110W-130E* | 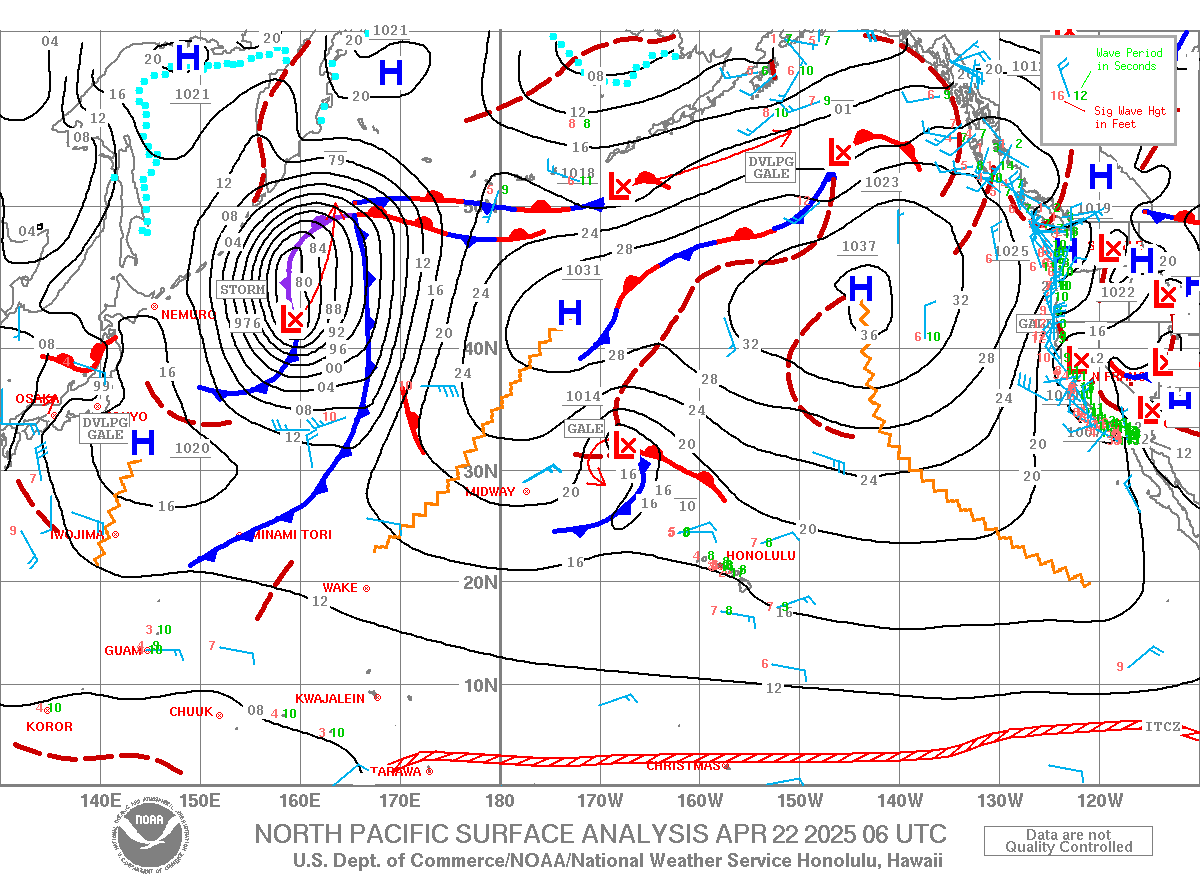 |
||
| 12Z N Pacific Surface Analysis EQ-60N 110W-130E* | 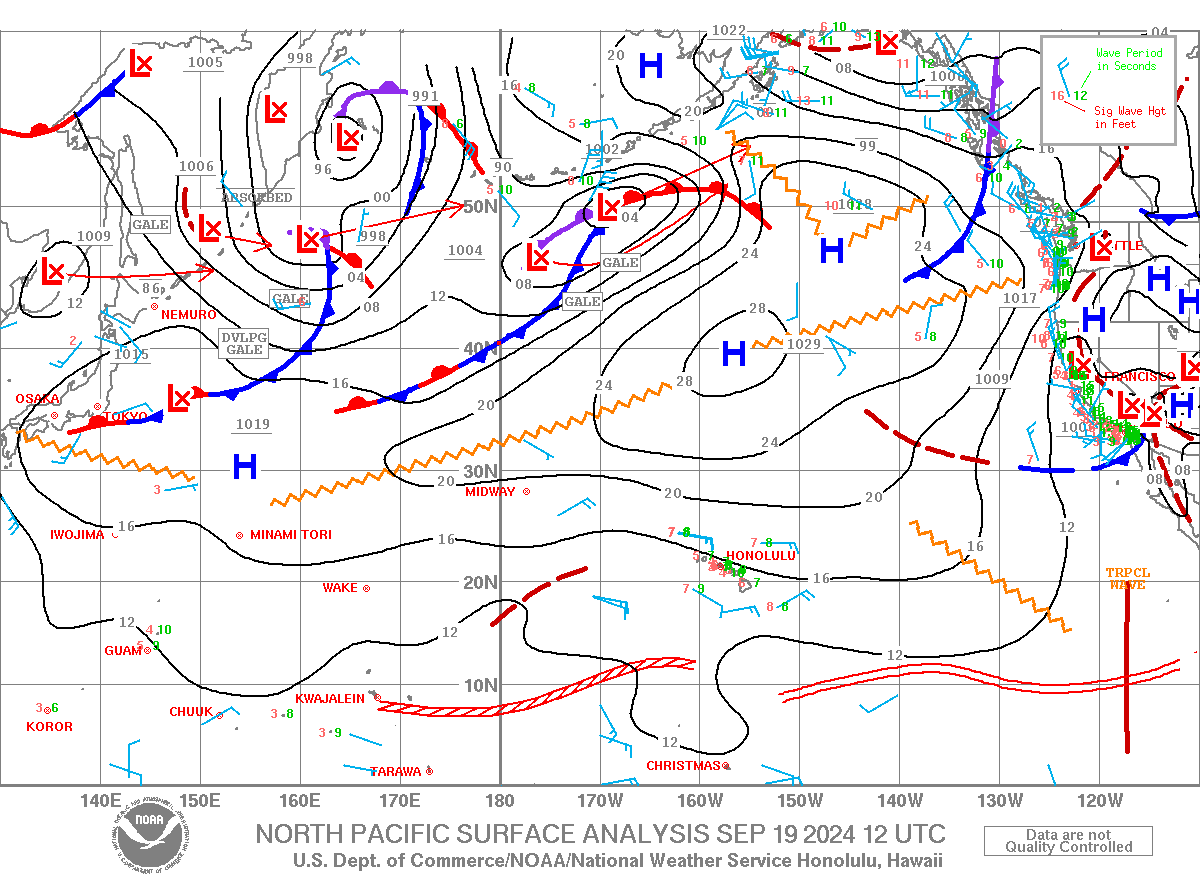 |
||
| 18Z N Pacific Surface Analysis EQ-60N 110W-130E* | 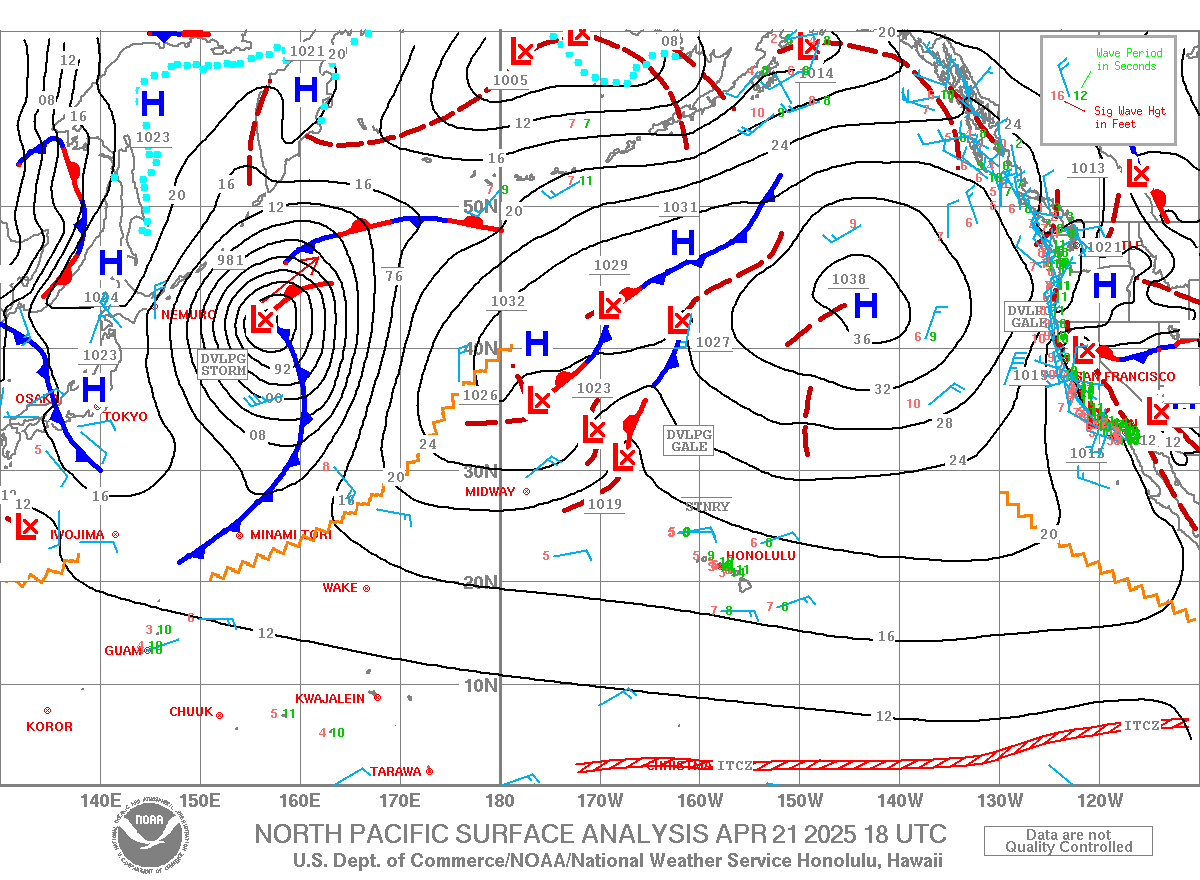 |
||
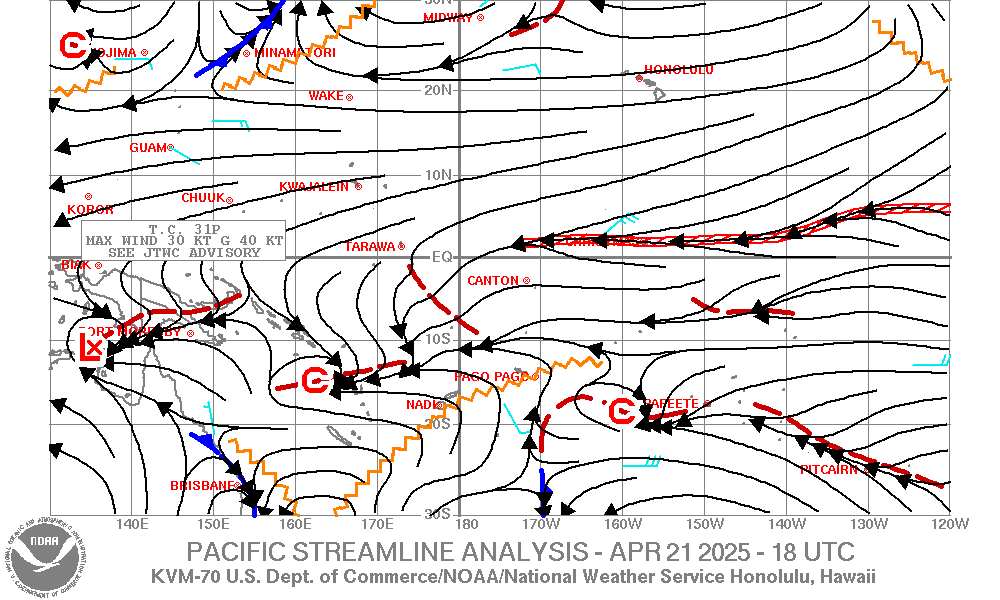
| 00Z Pacific Streamline Analysis 30S-30N 120W-130E | |
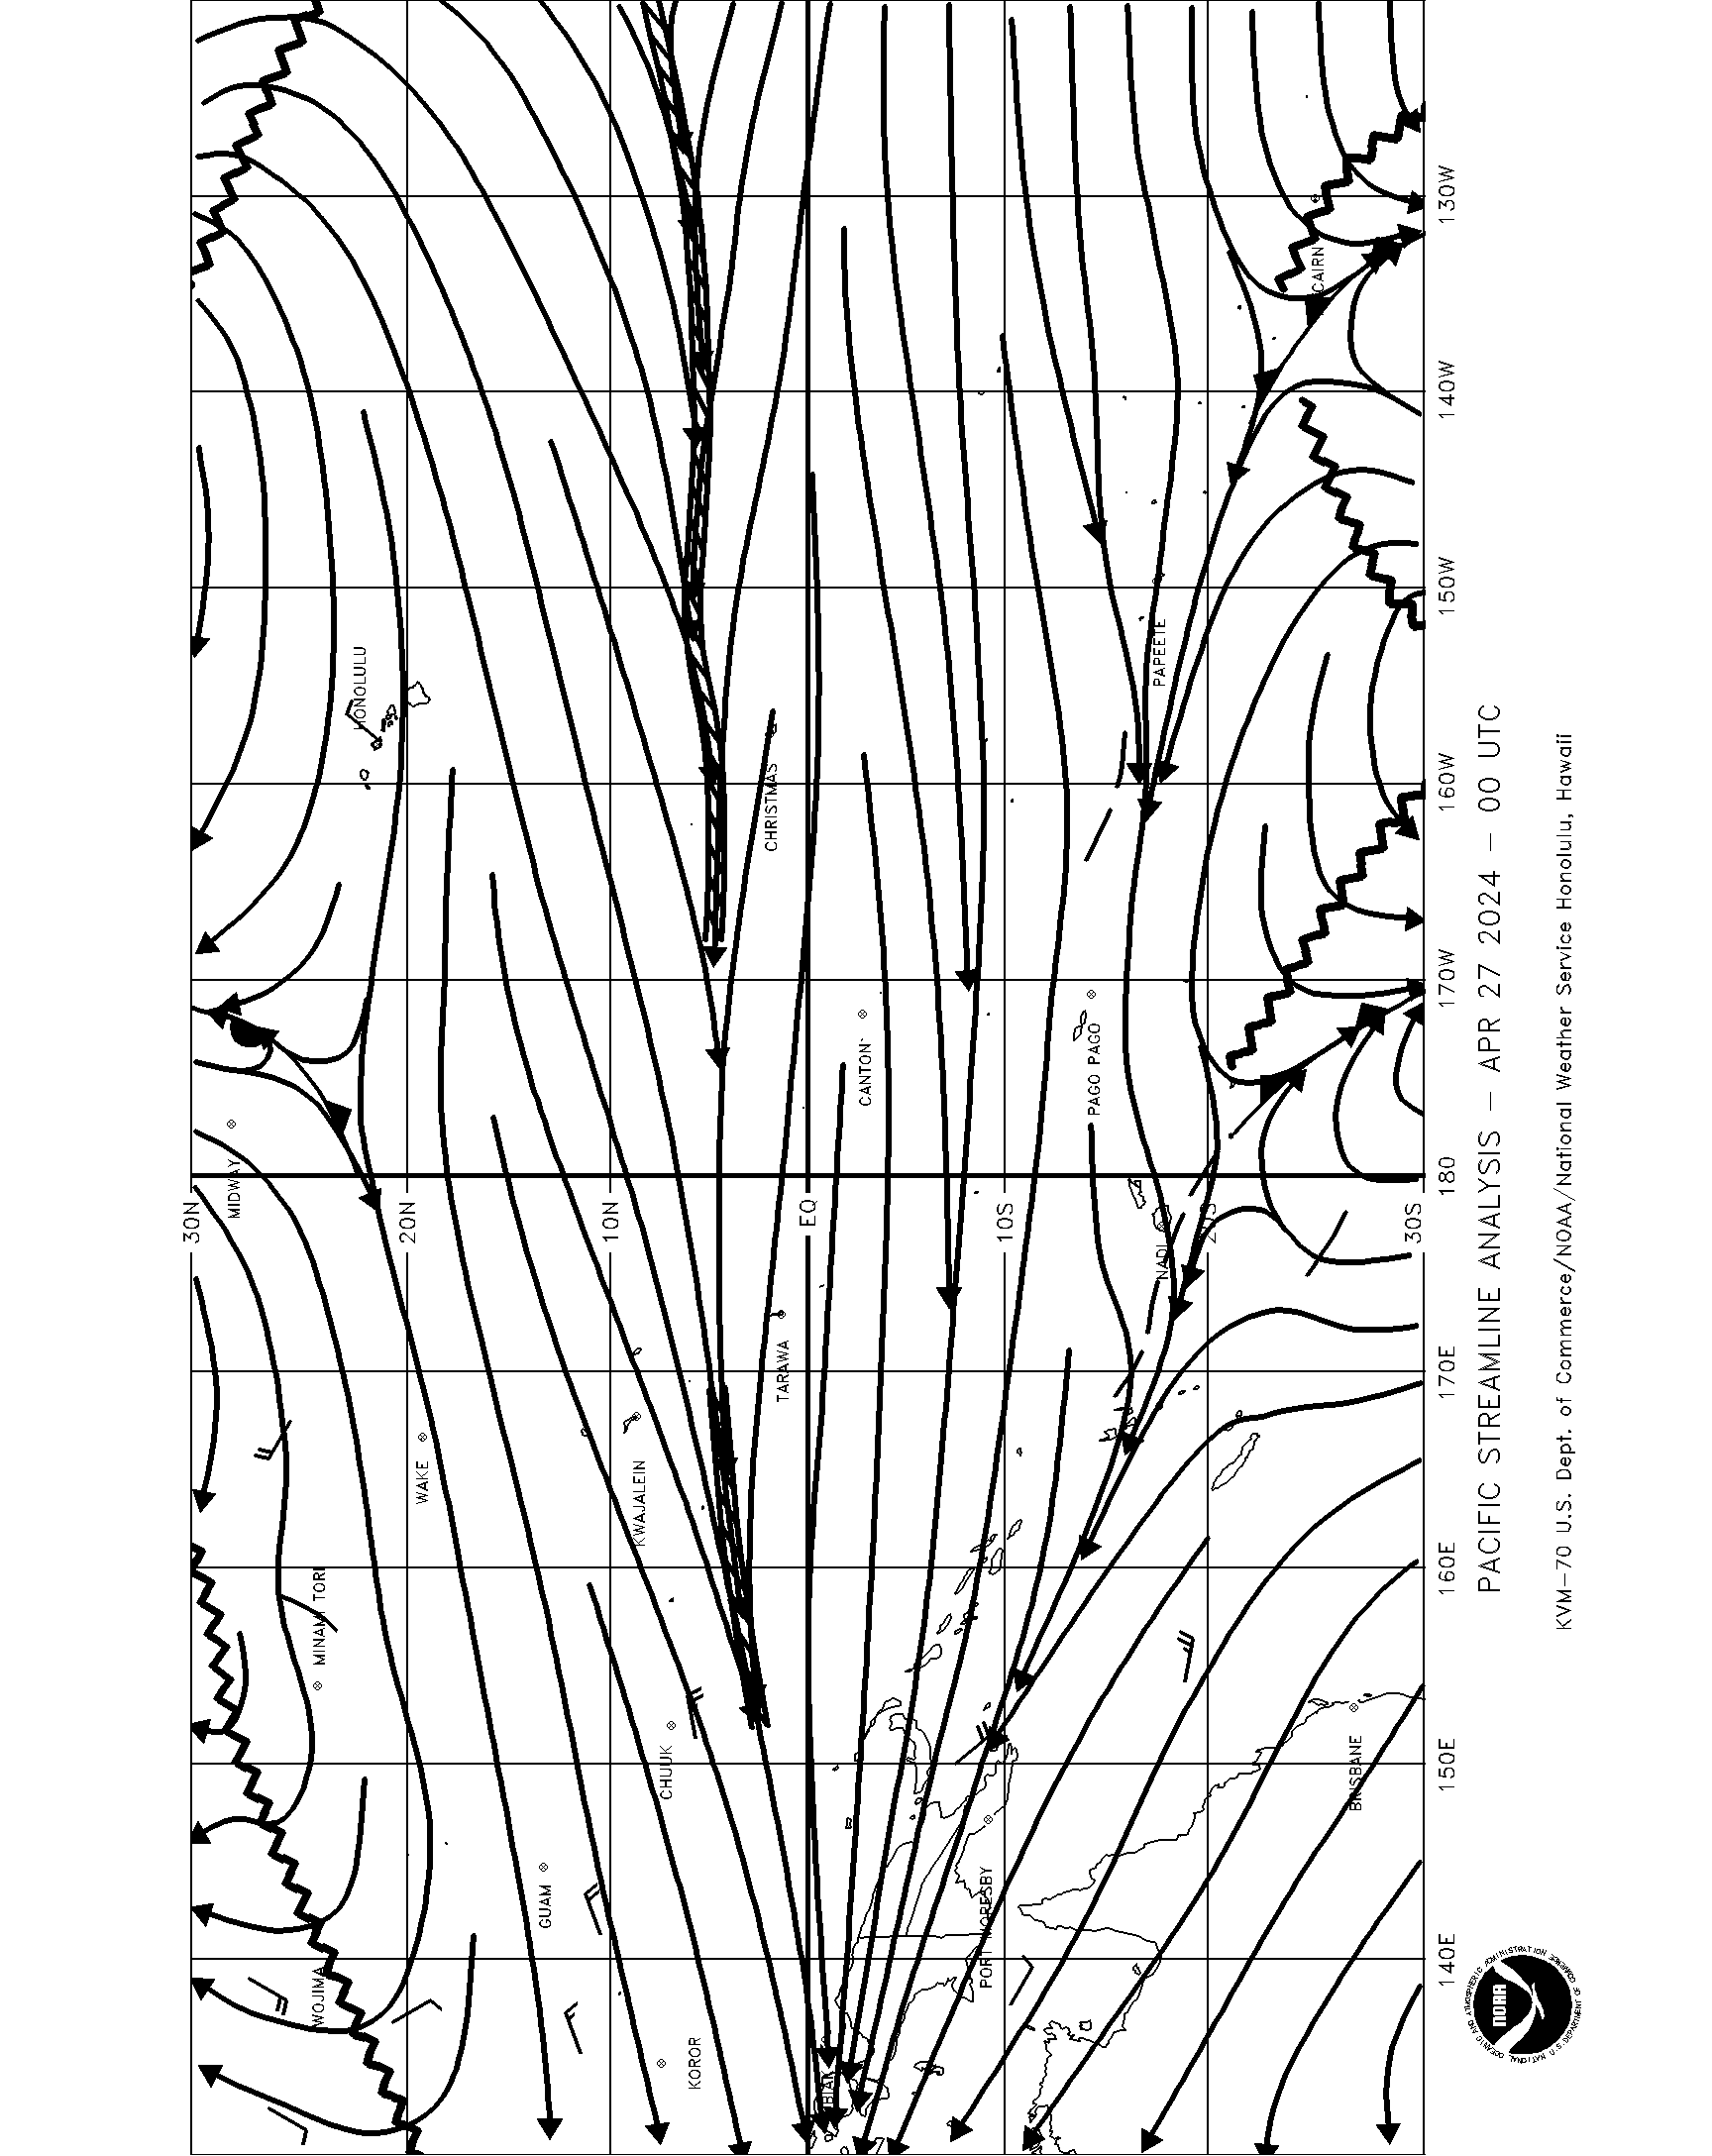 |
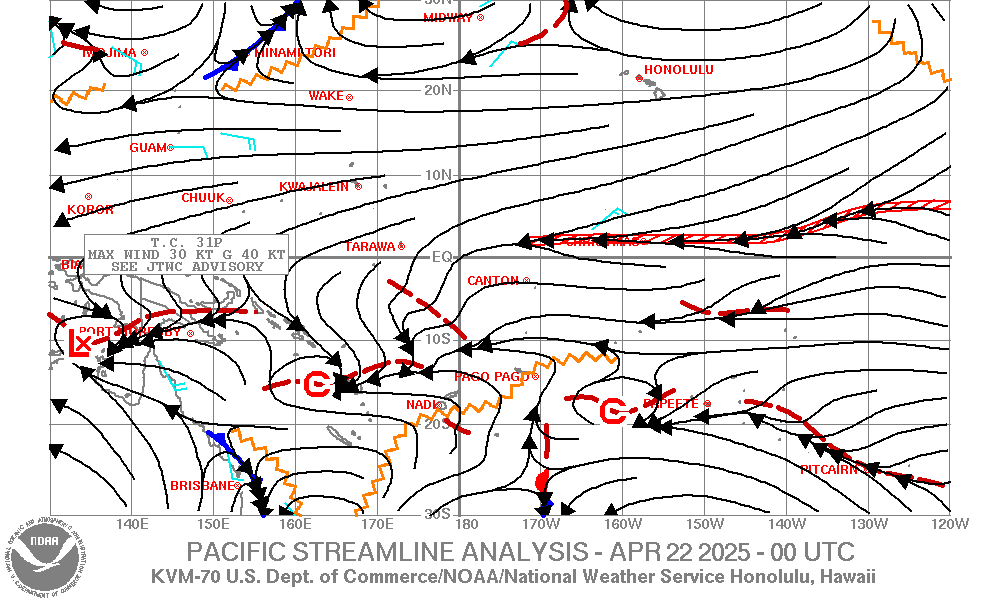 |
| 06Z Pacific Streamline Analysis 30S-30N 120W-130E | |
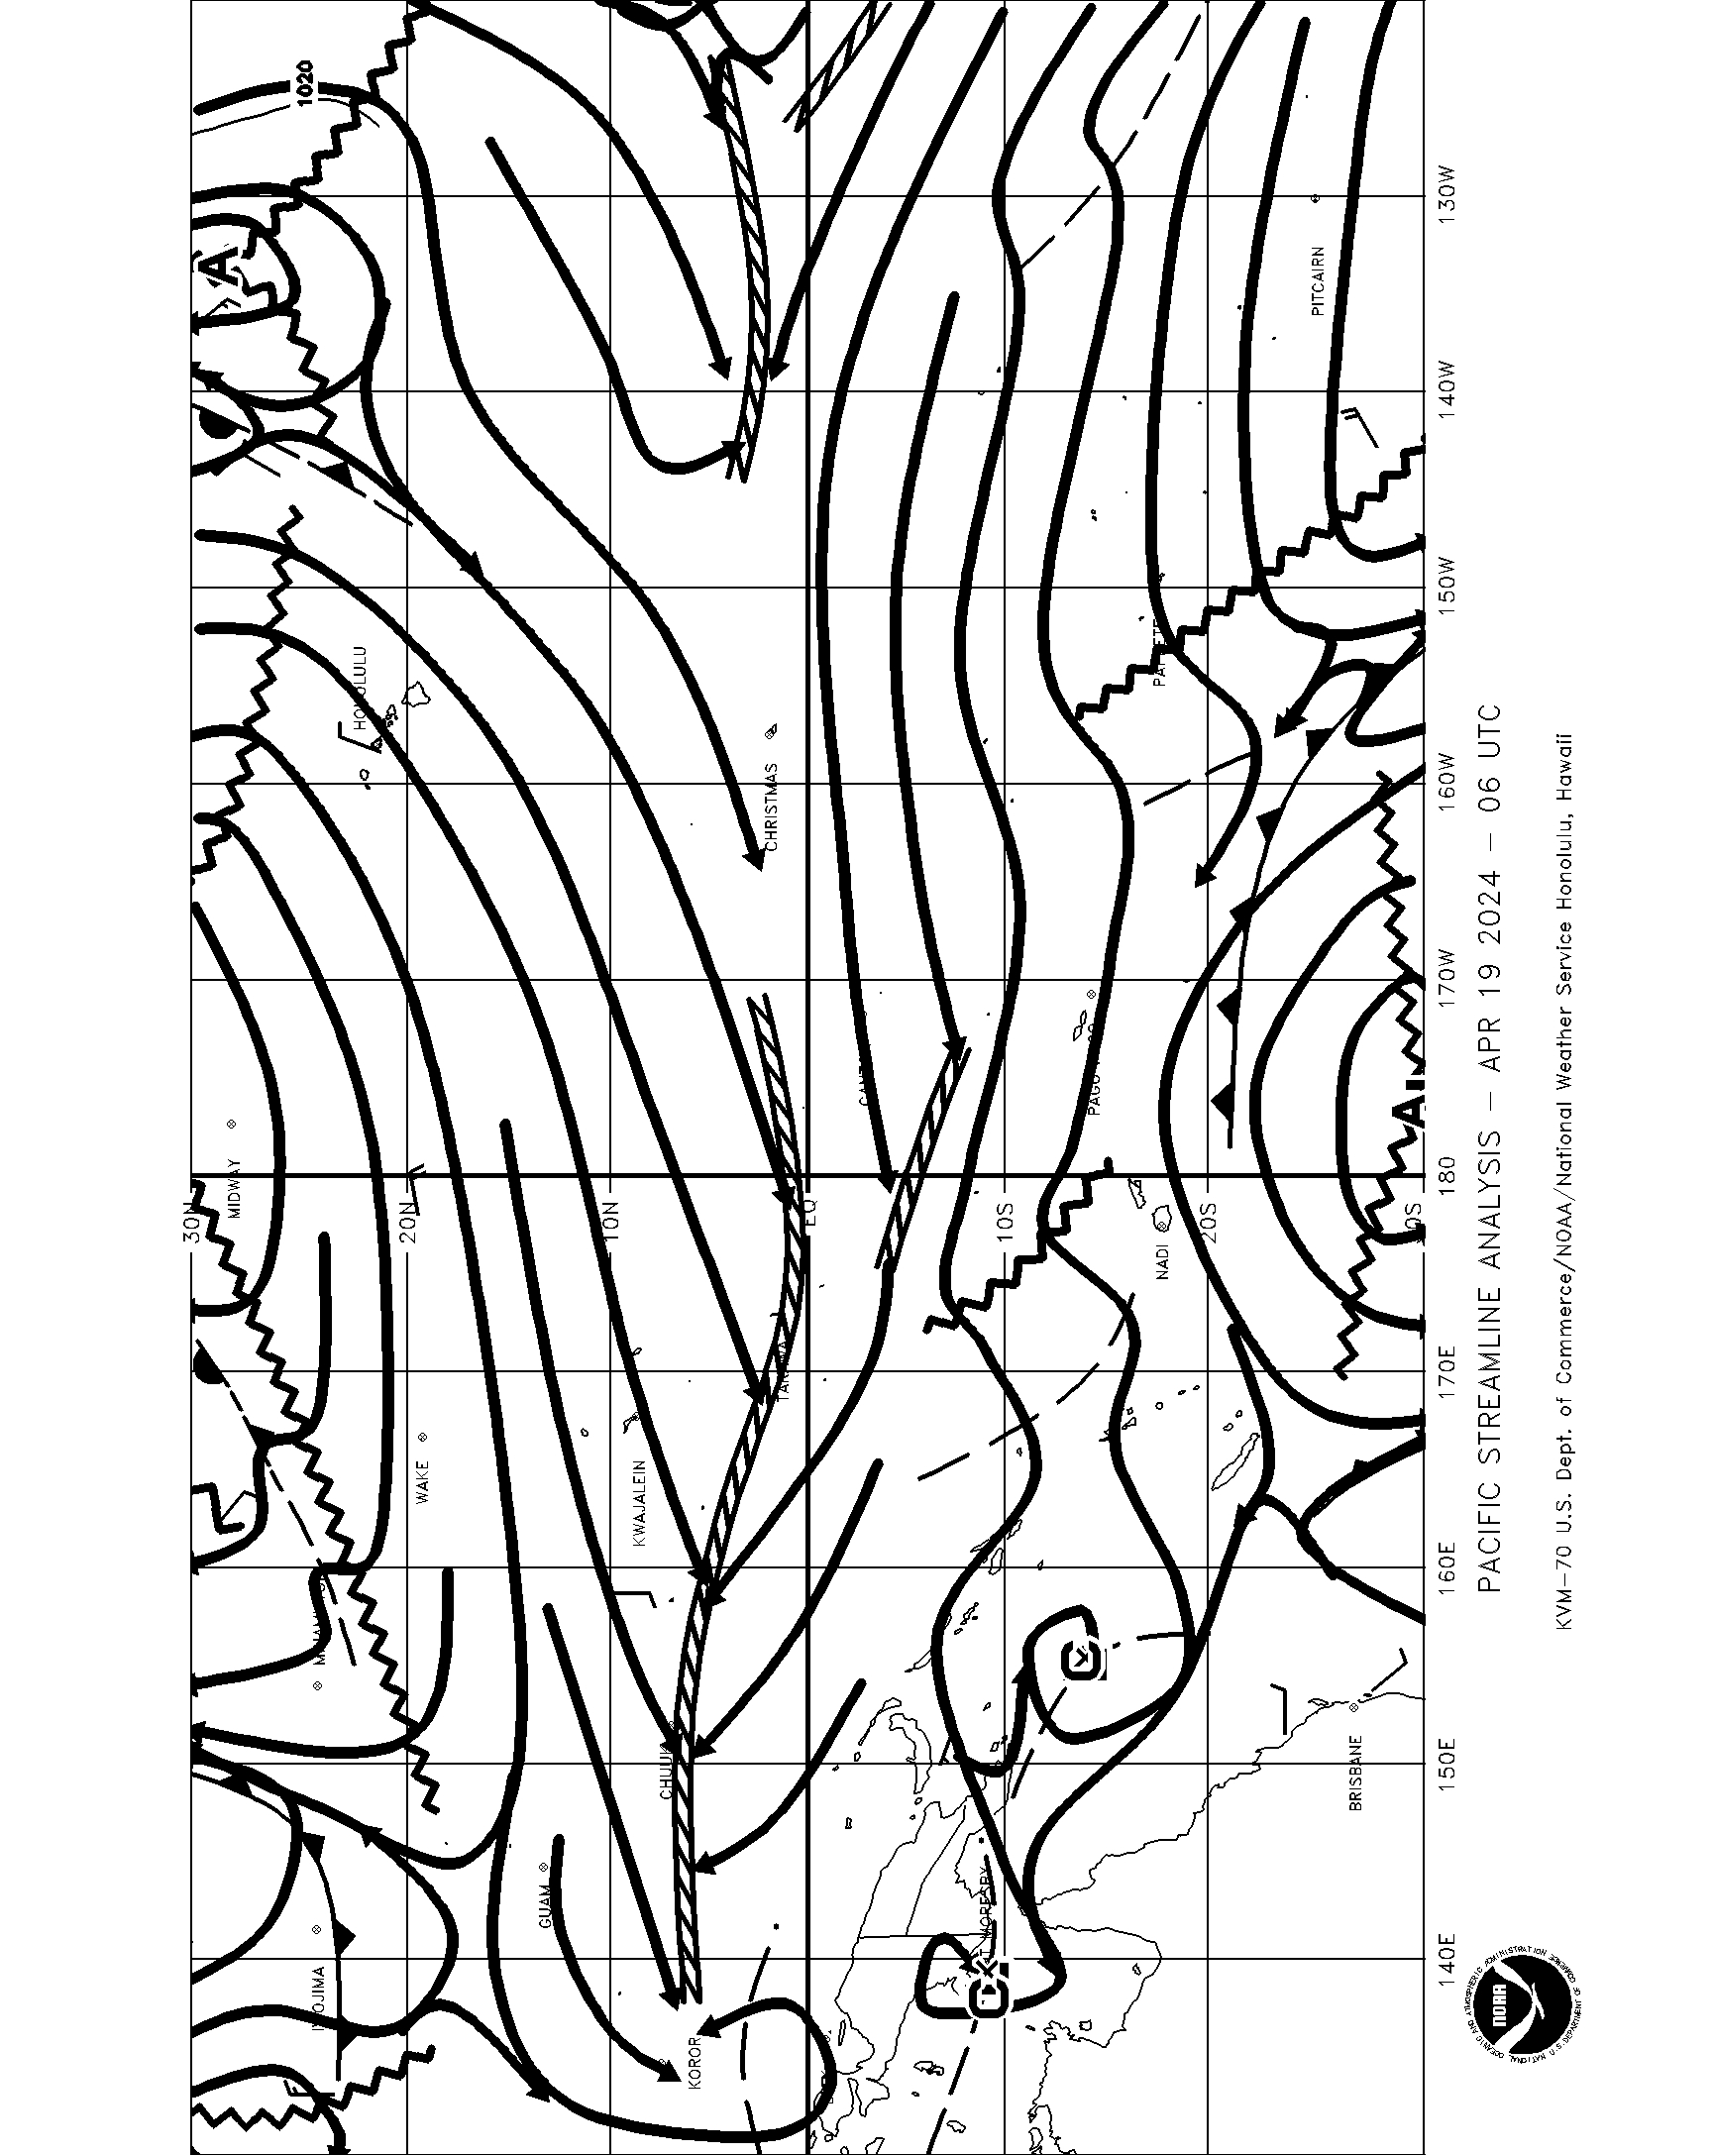 |
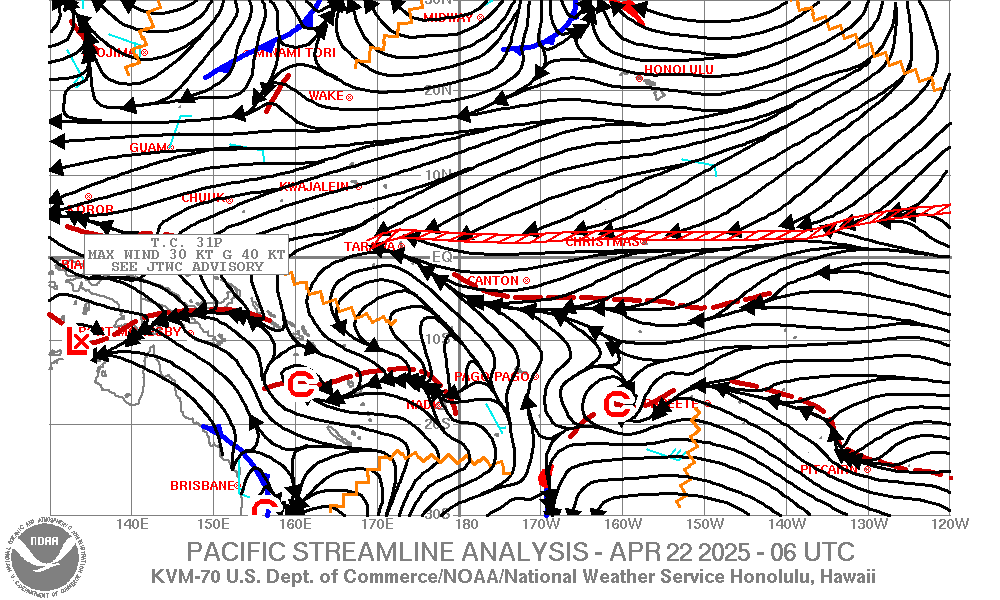 |
| 12Z Pacific Streamline Analysis 30S-30N 120W-130E | |
 |
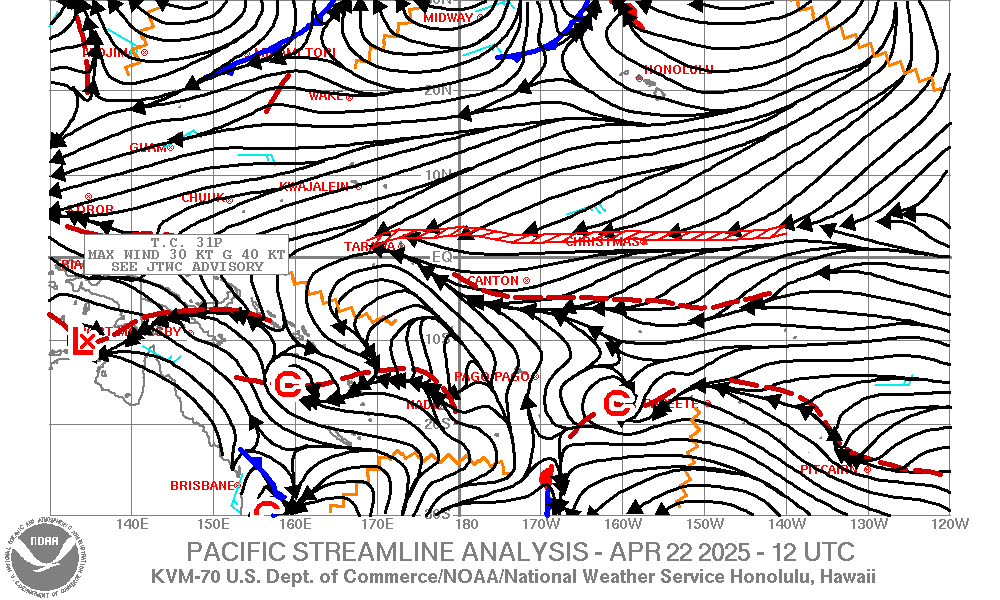 |
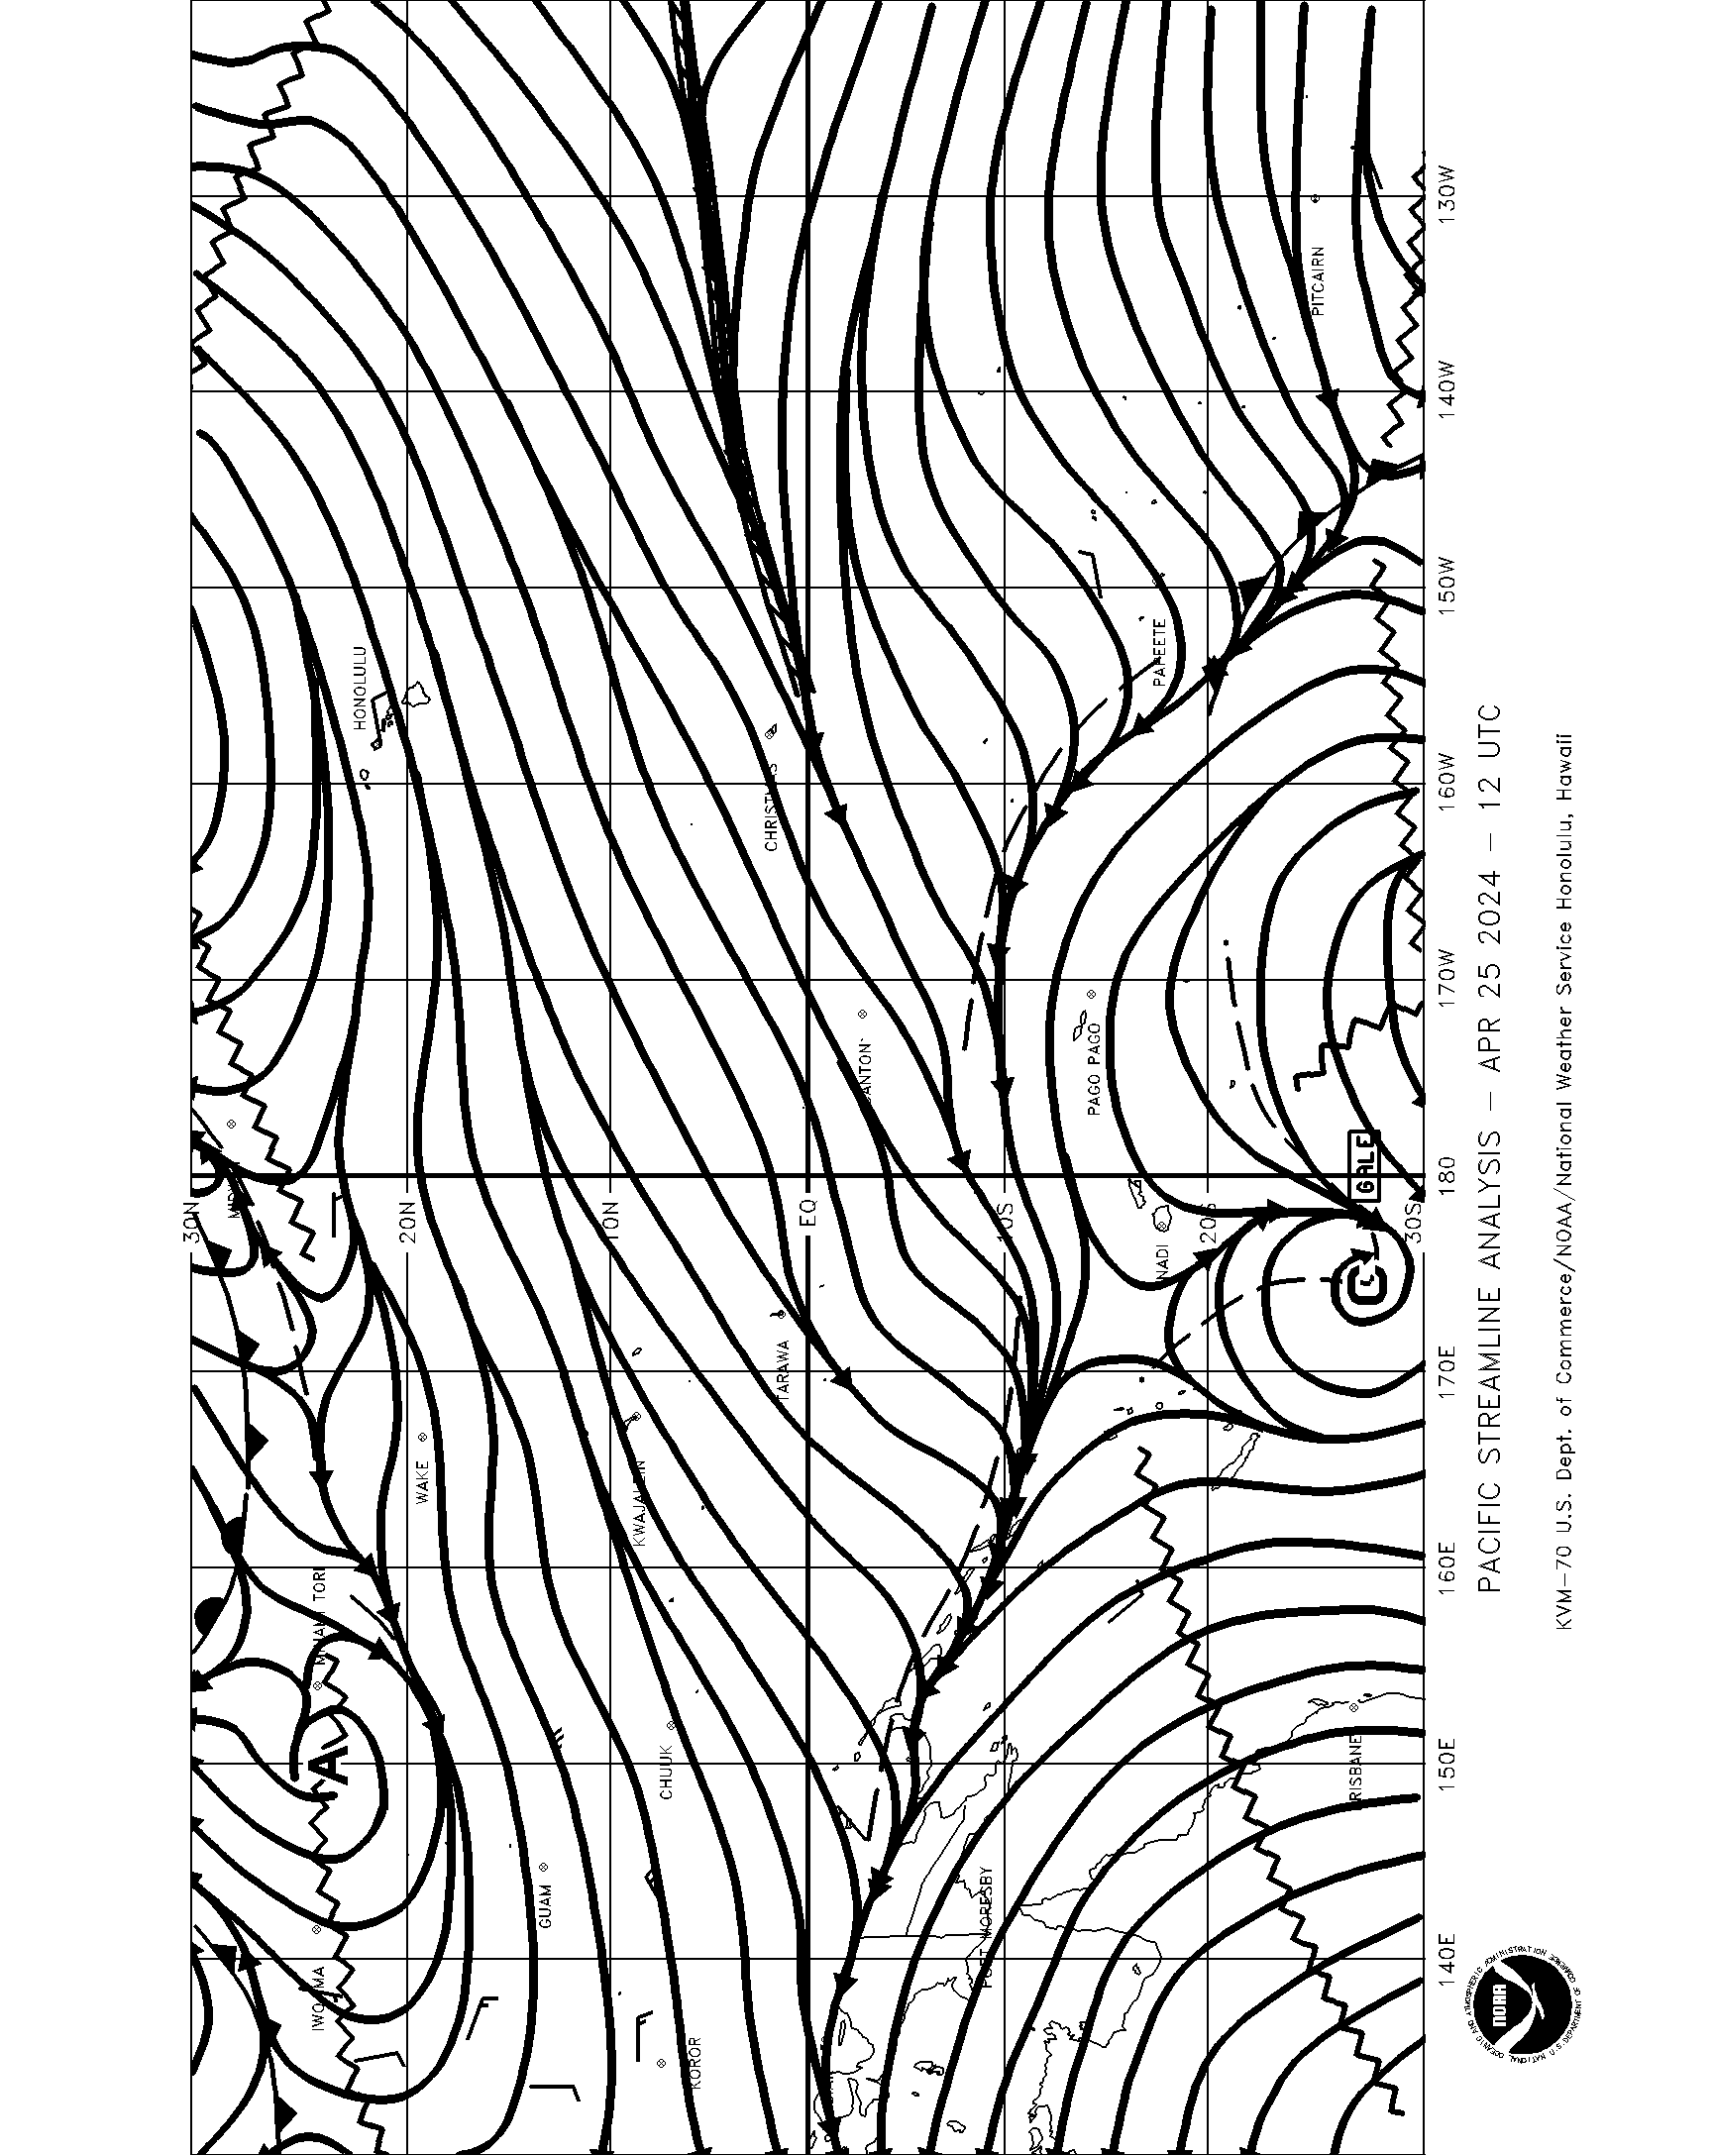
| 18Z Pacific Streamline Analysis 30S-30N 120W-130E | |
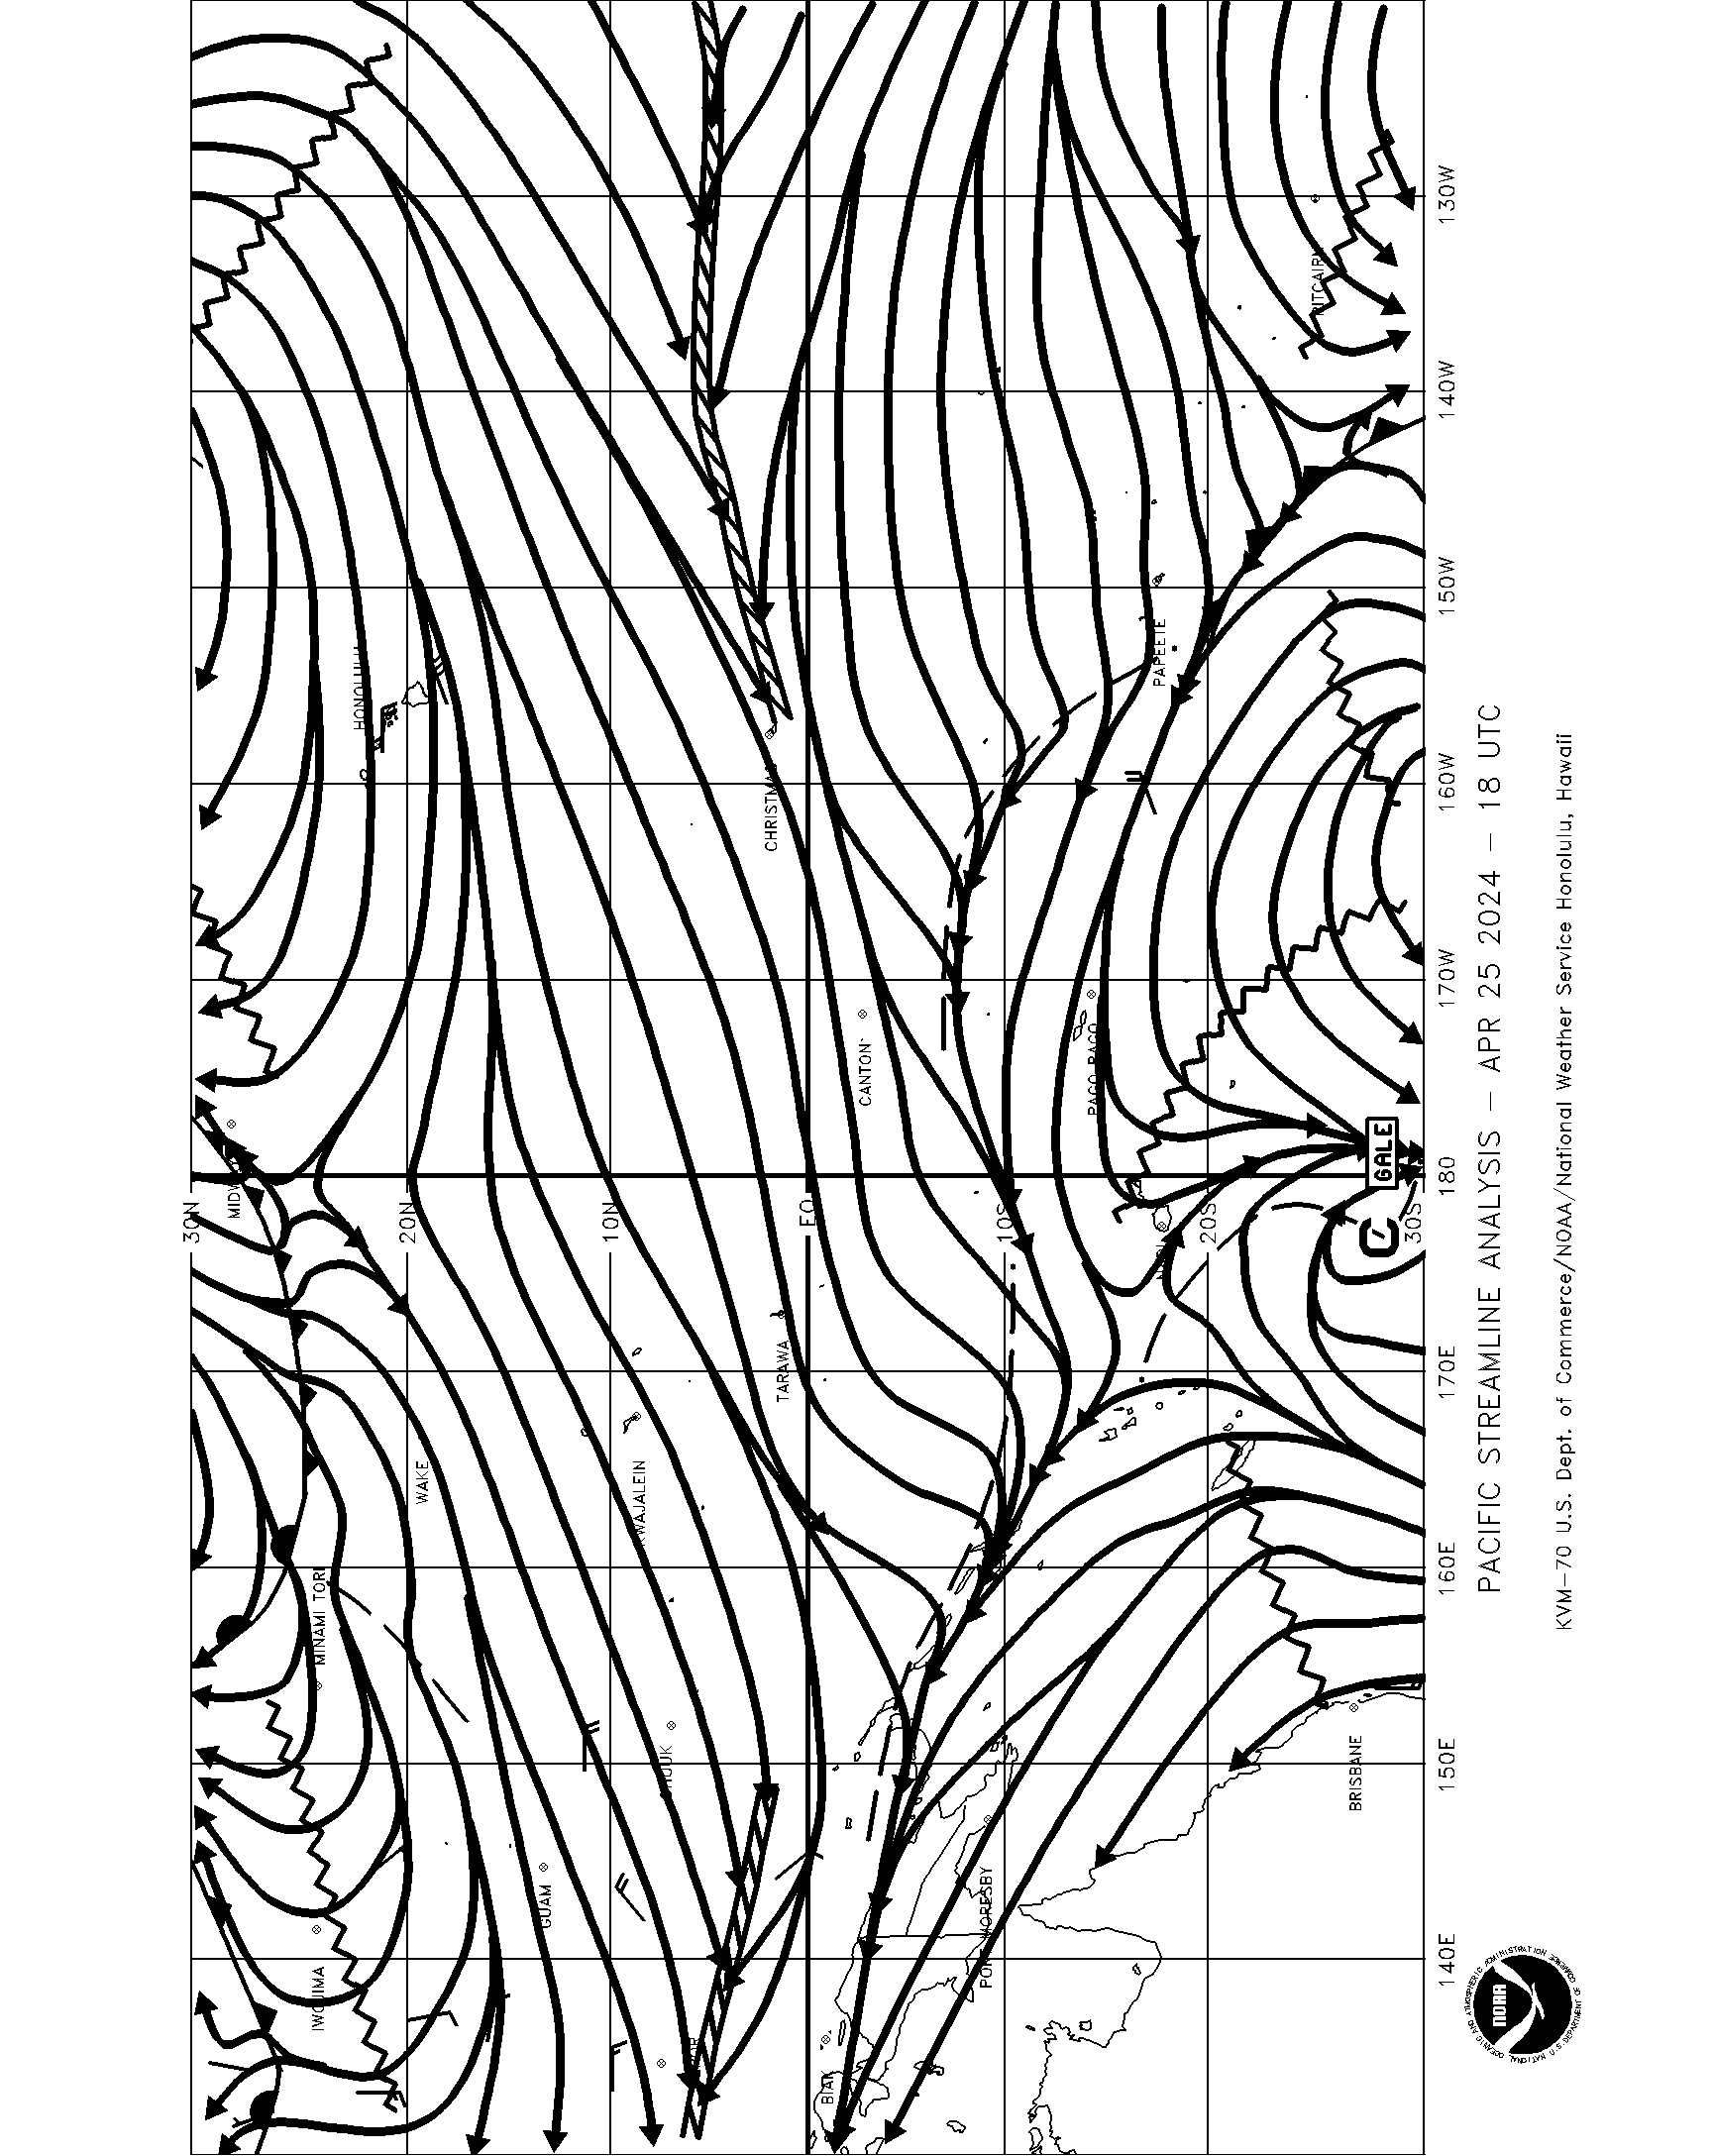 |
 |
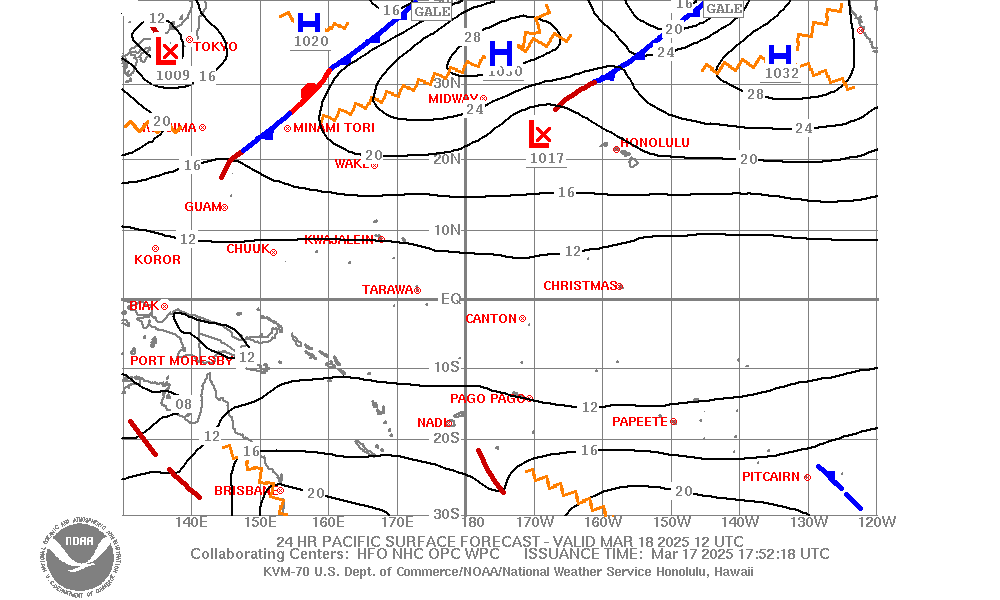
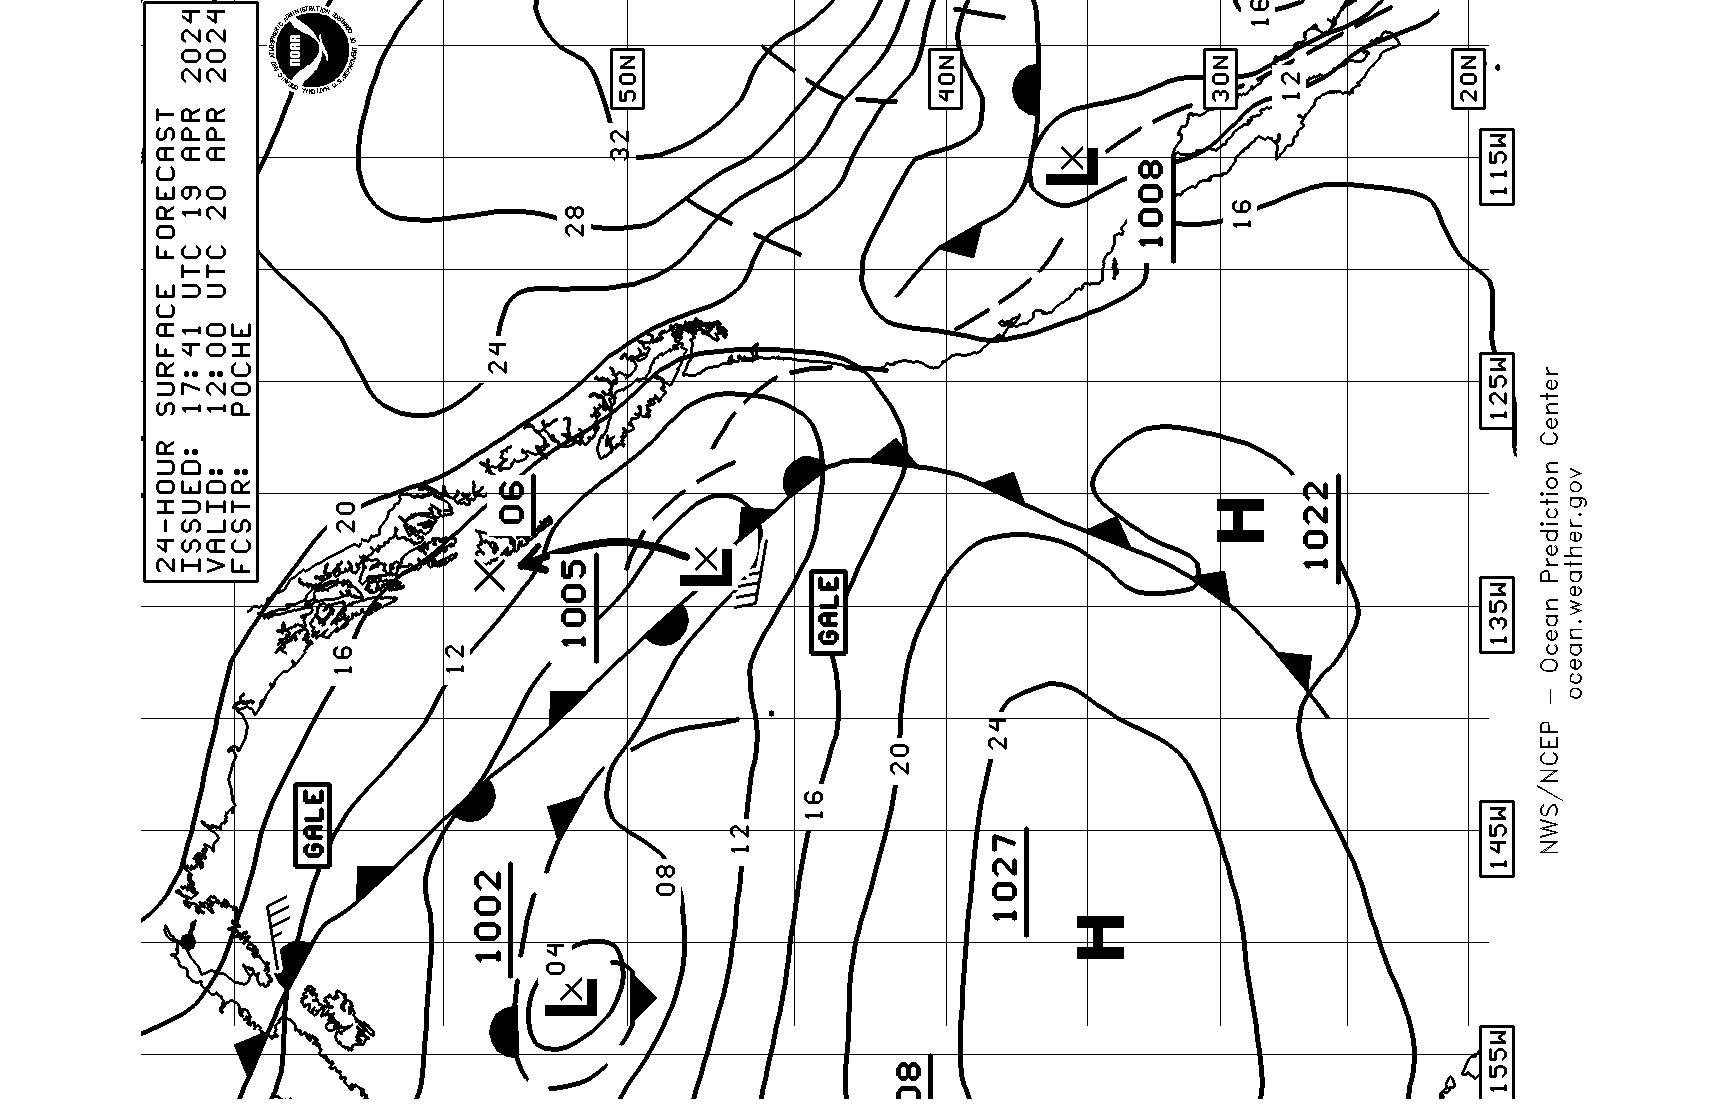
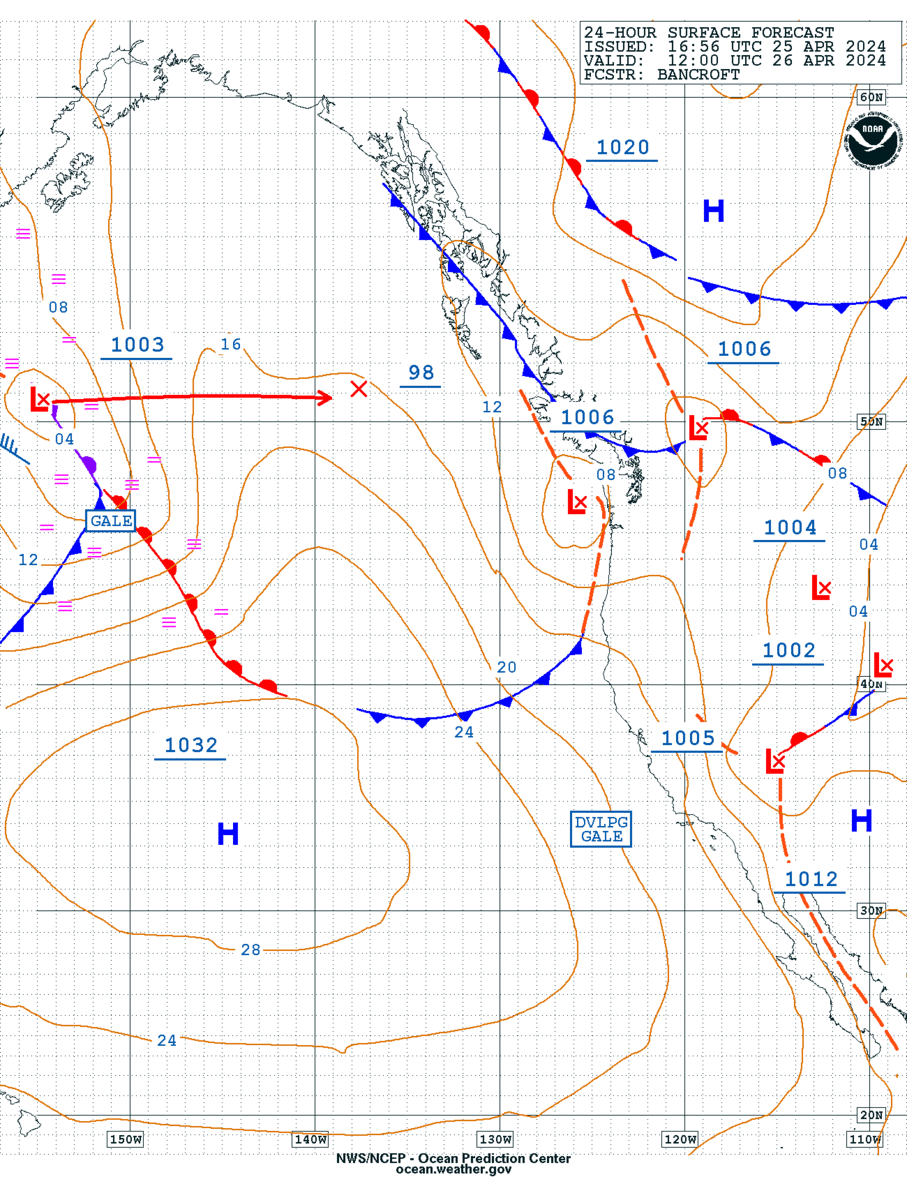
| 24HR Pacific Surface Forecast VT00Z 30S-40N 120W-130E | |
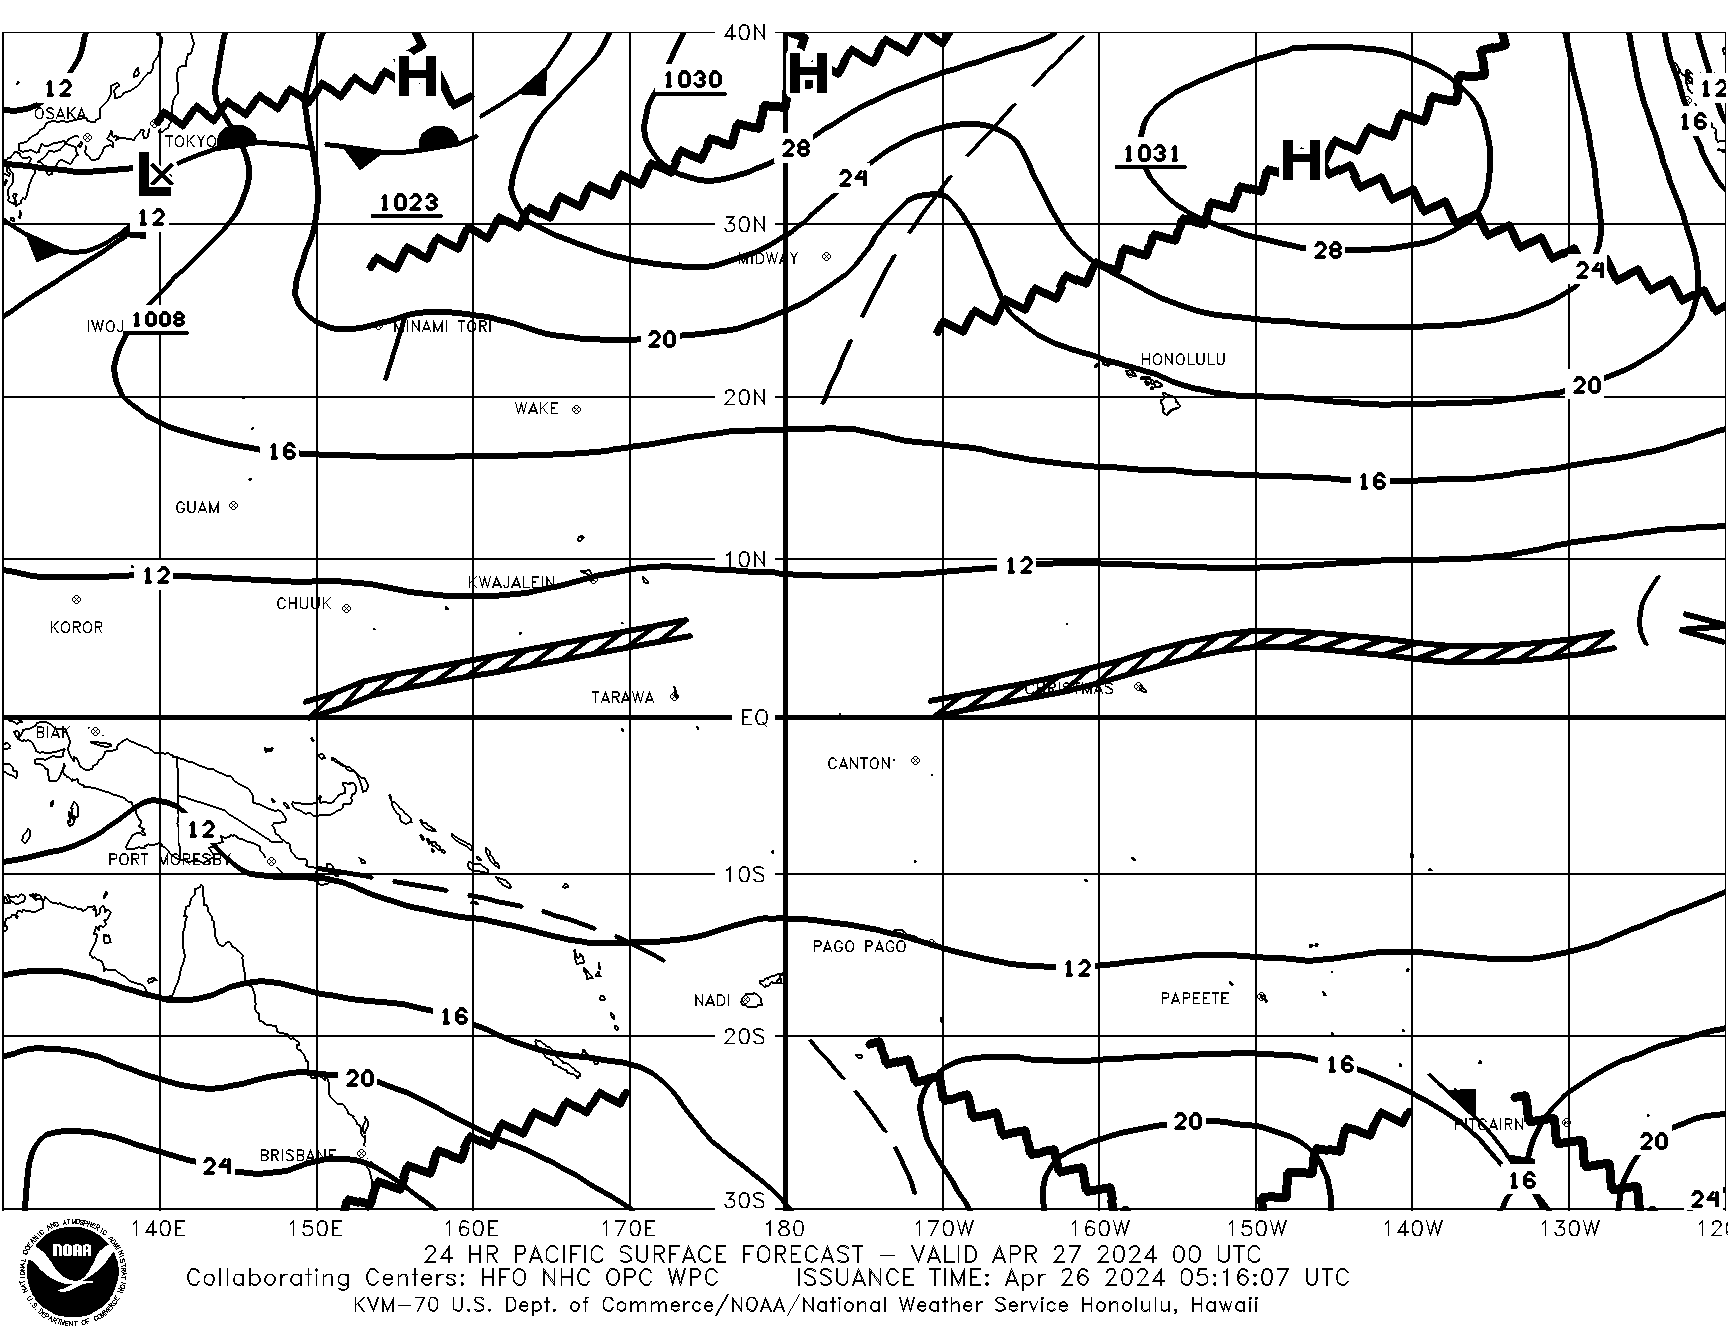 |
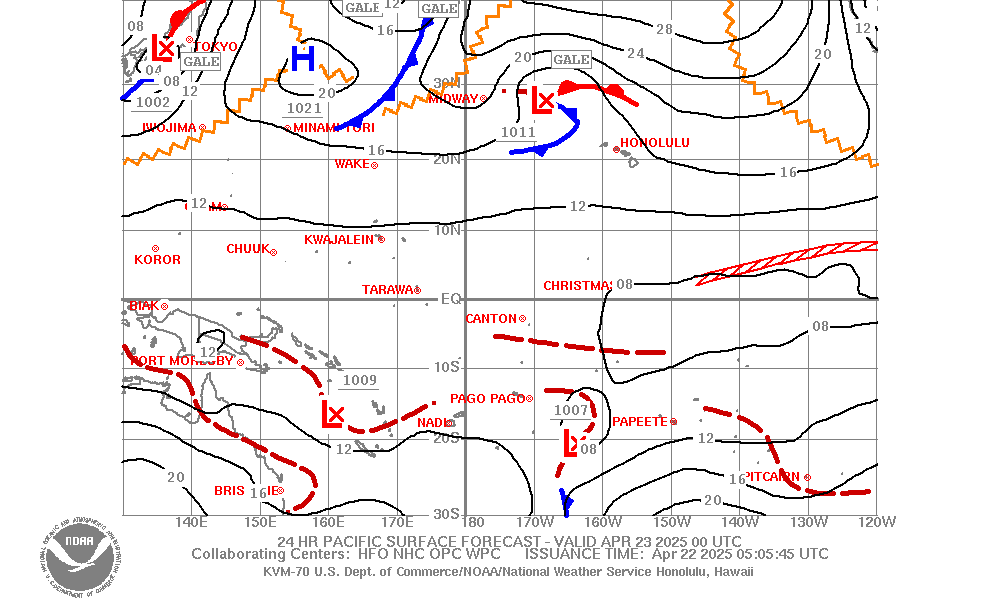 |
| 24HR Pacific Surface Forecast VT12Z 30S-40N 120W-130E | |
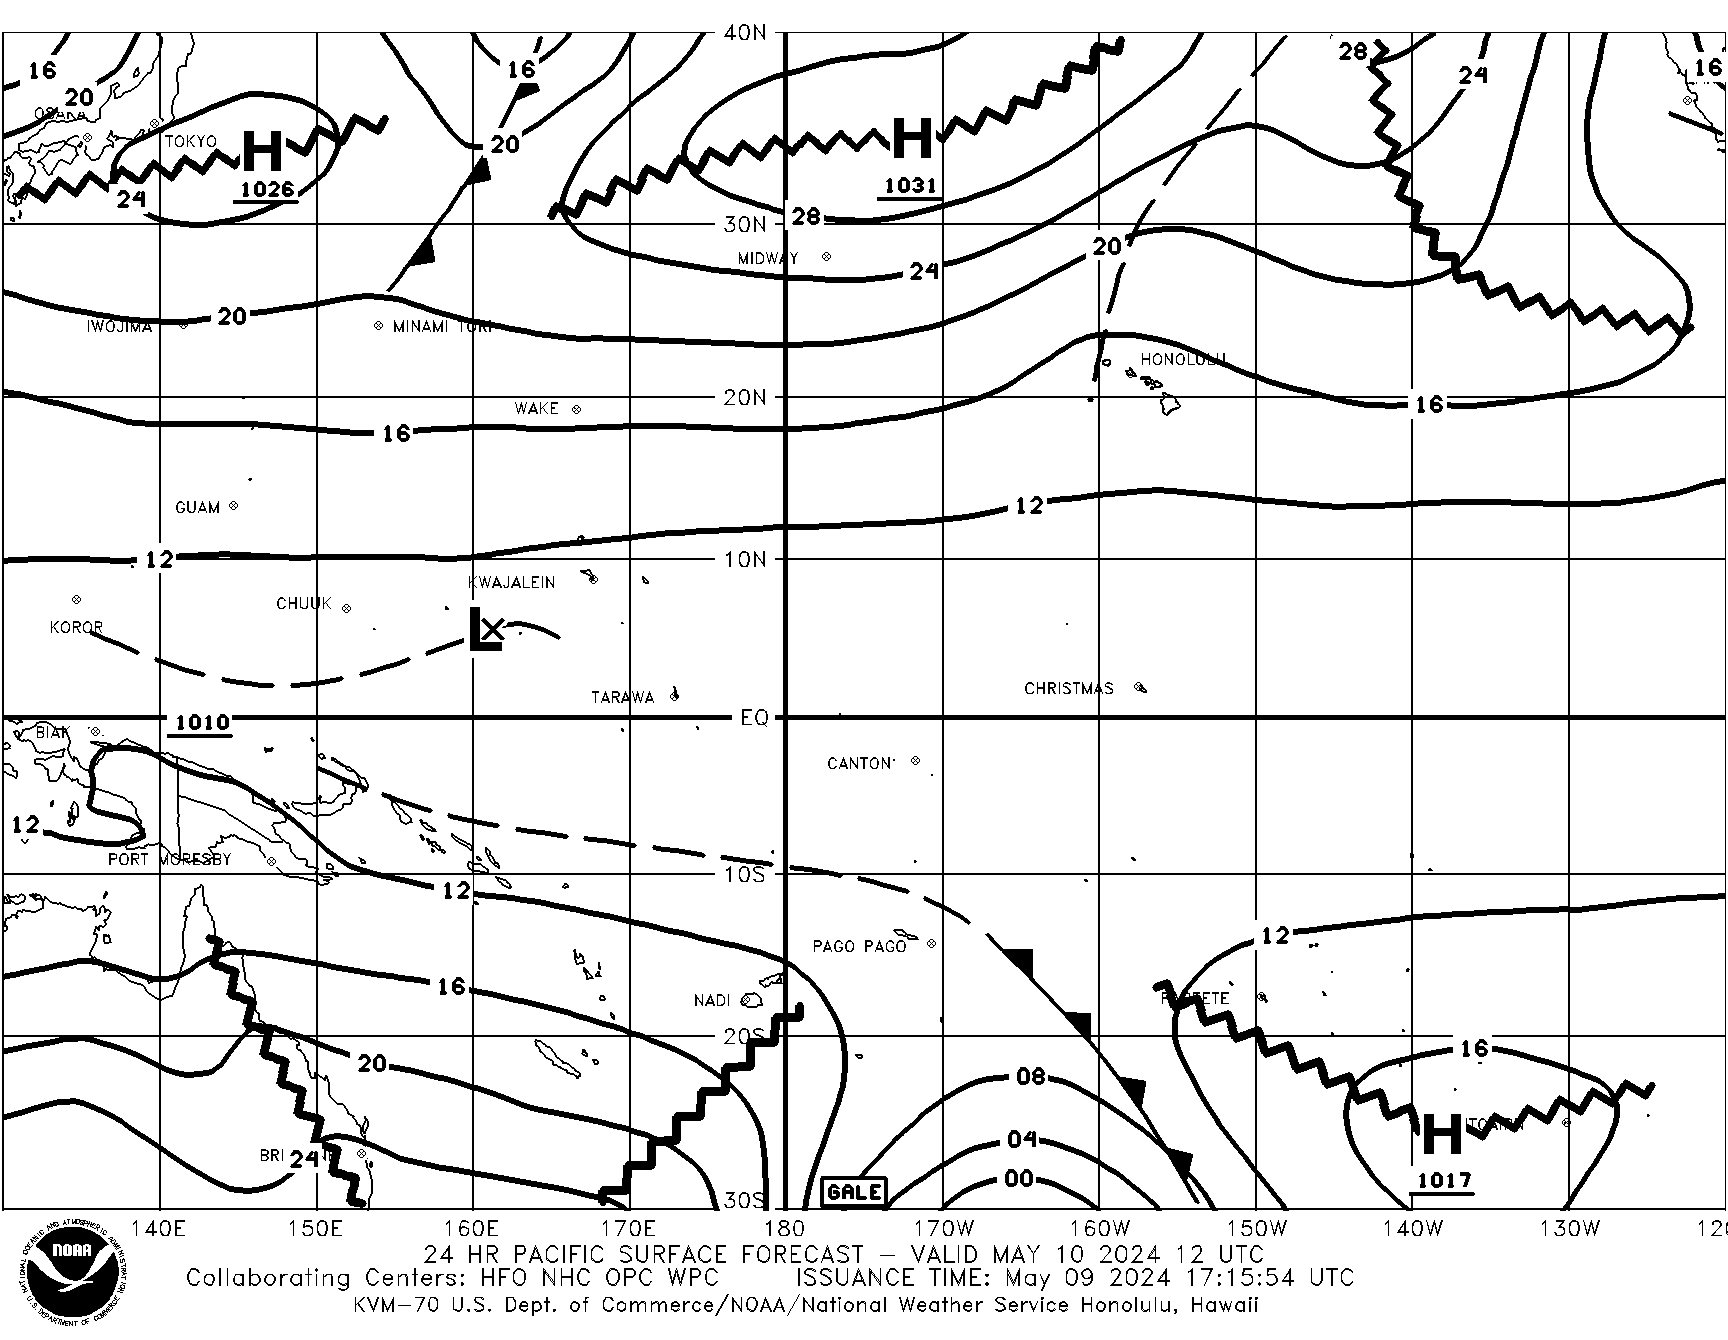 |
 |
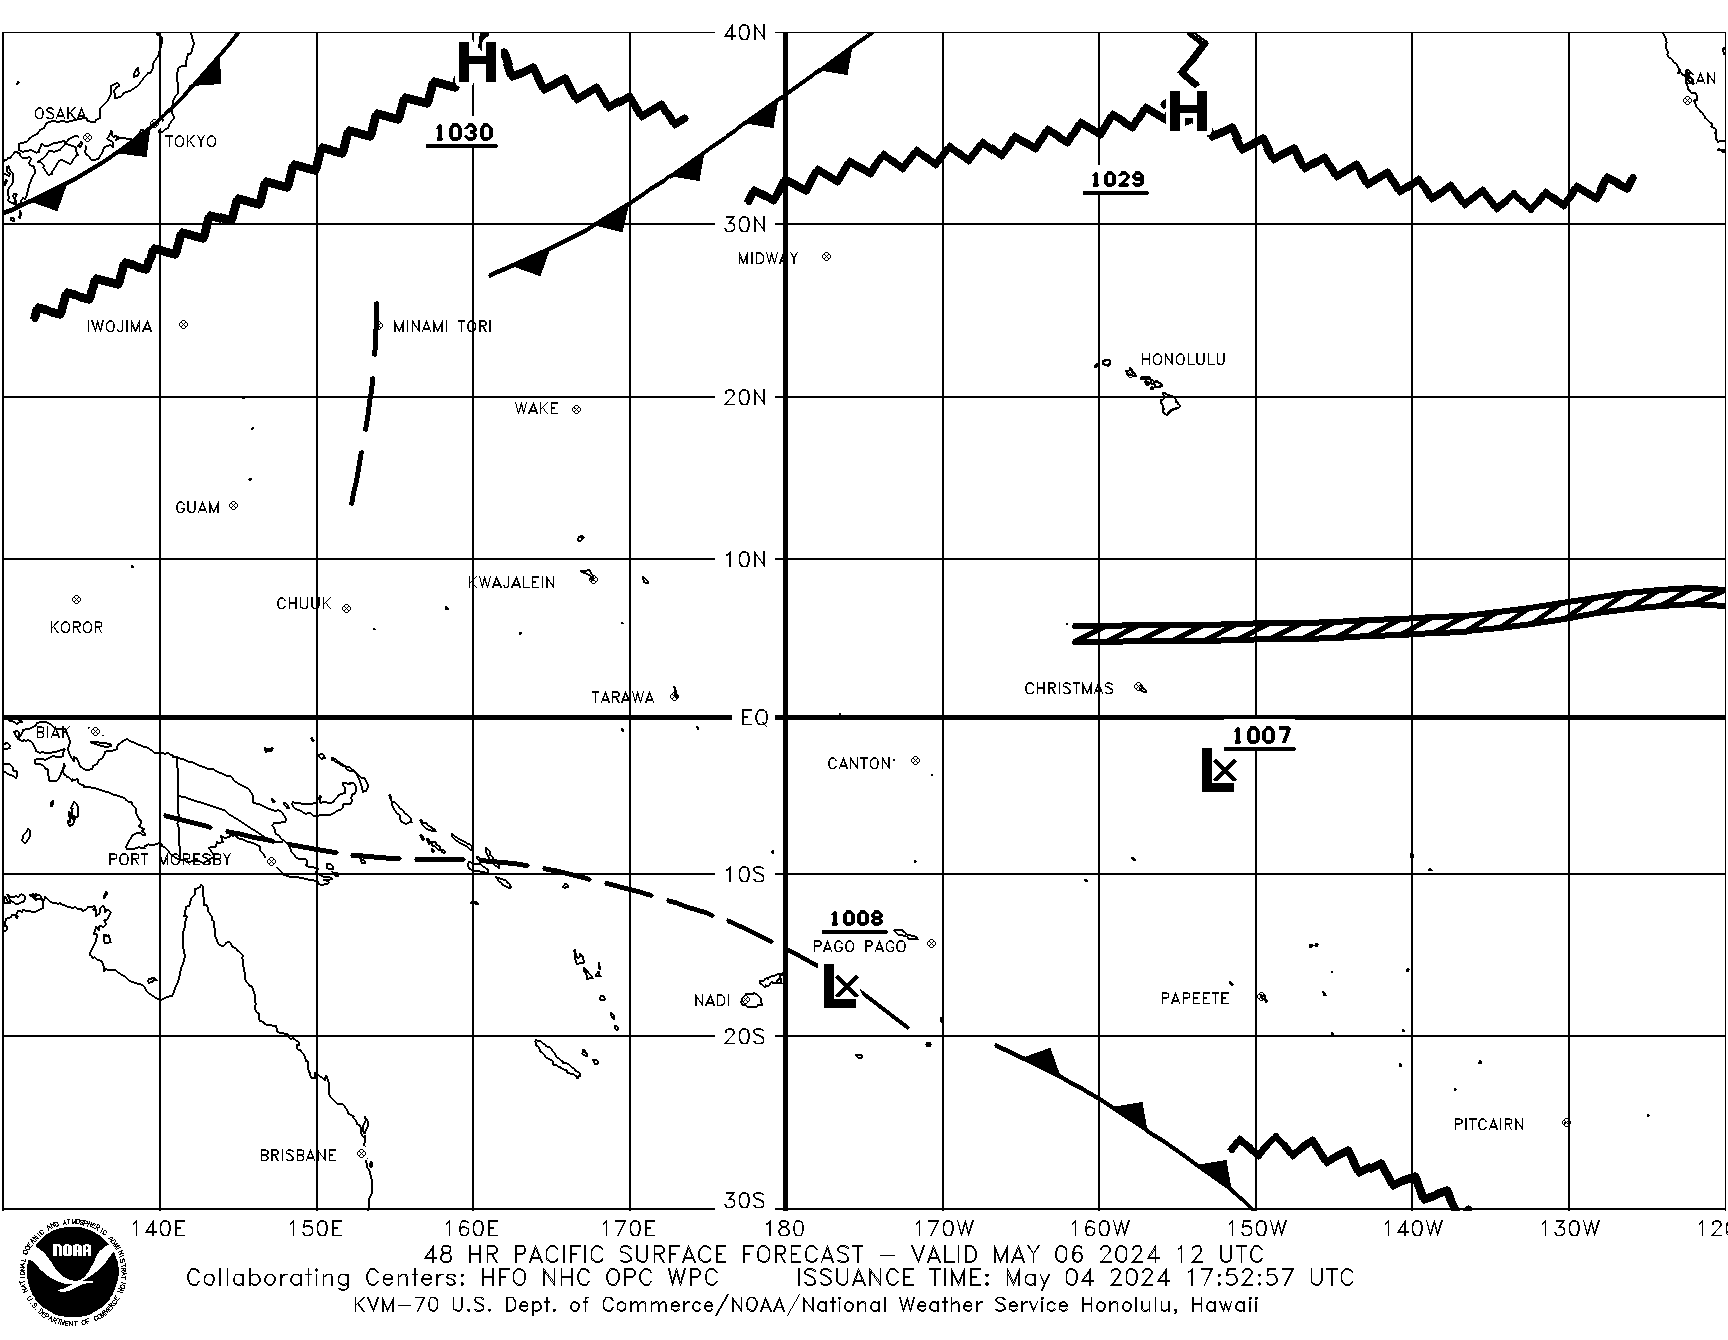
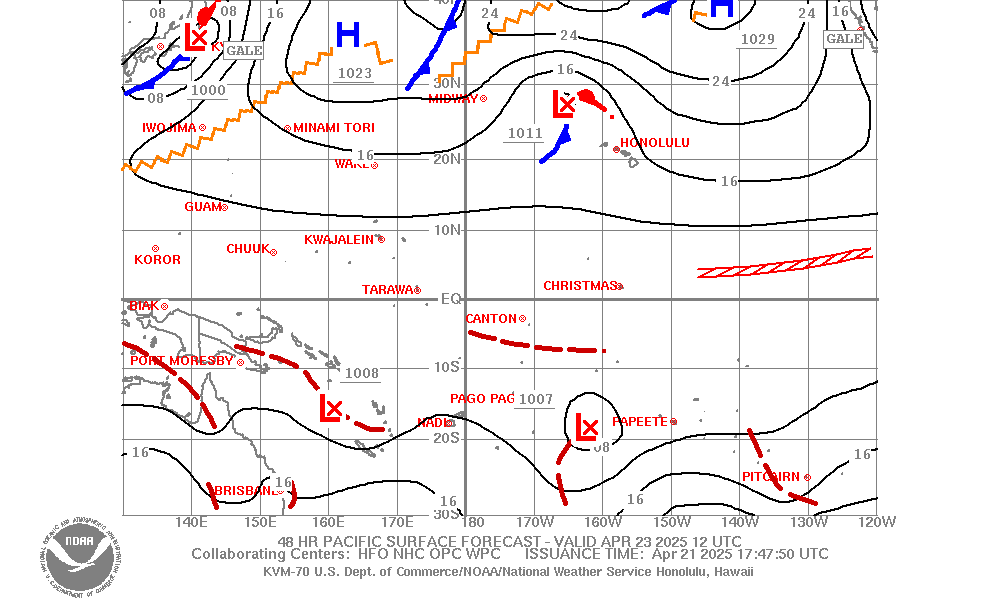
| 48HR Pacific Surface Forecast VT00Z 30S-40N 120W-130E | |
 |
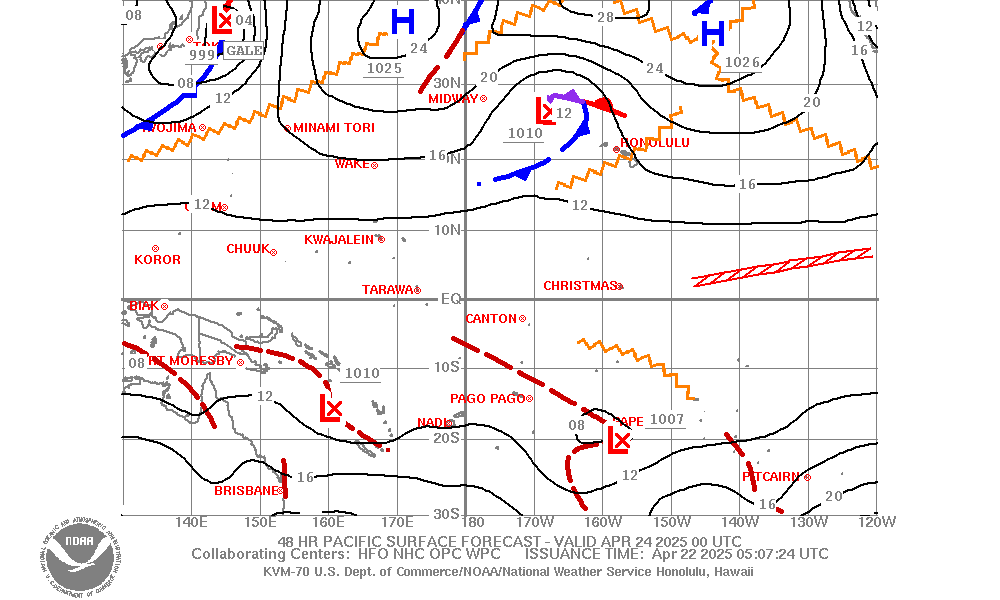 |
| 48HR Pacific Surface Forecast VT12Z 30S-40N 120W-130E | |
 |
 |
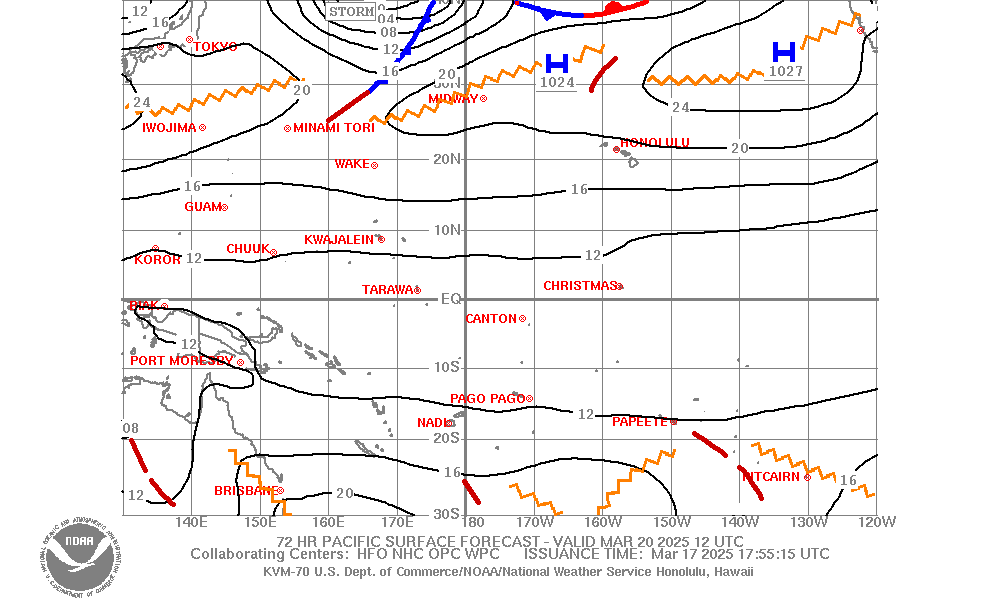
| 72HR Pacific Surface Forecast VT00Z 30S-40N 120W-130E | |
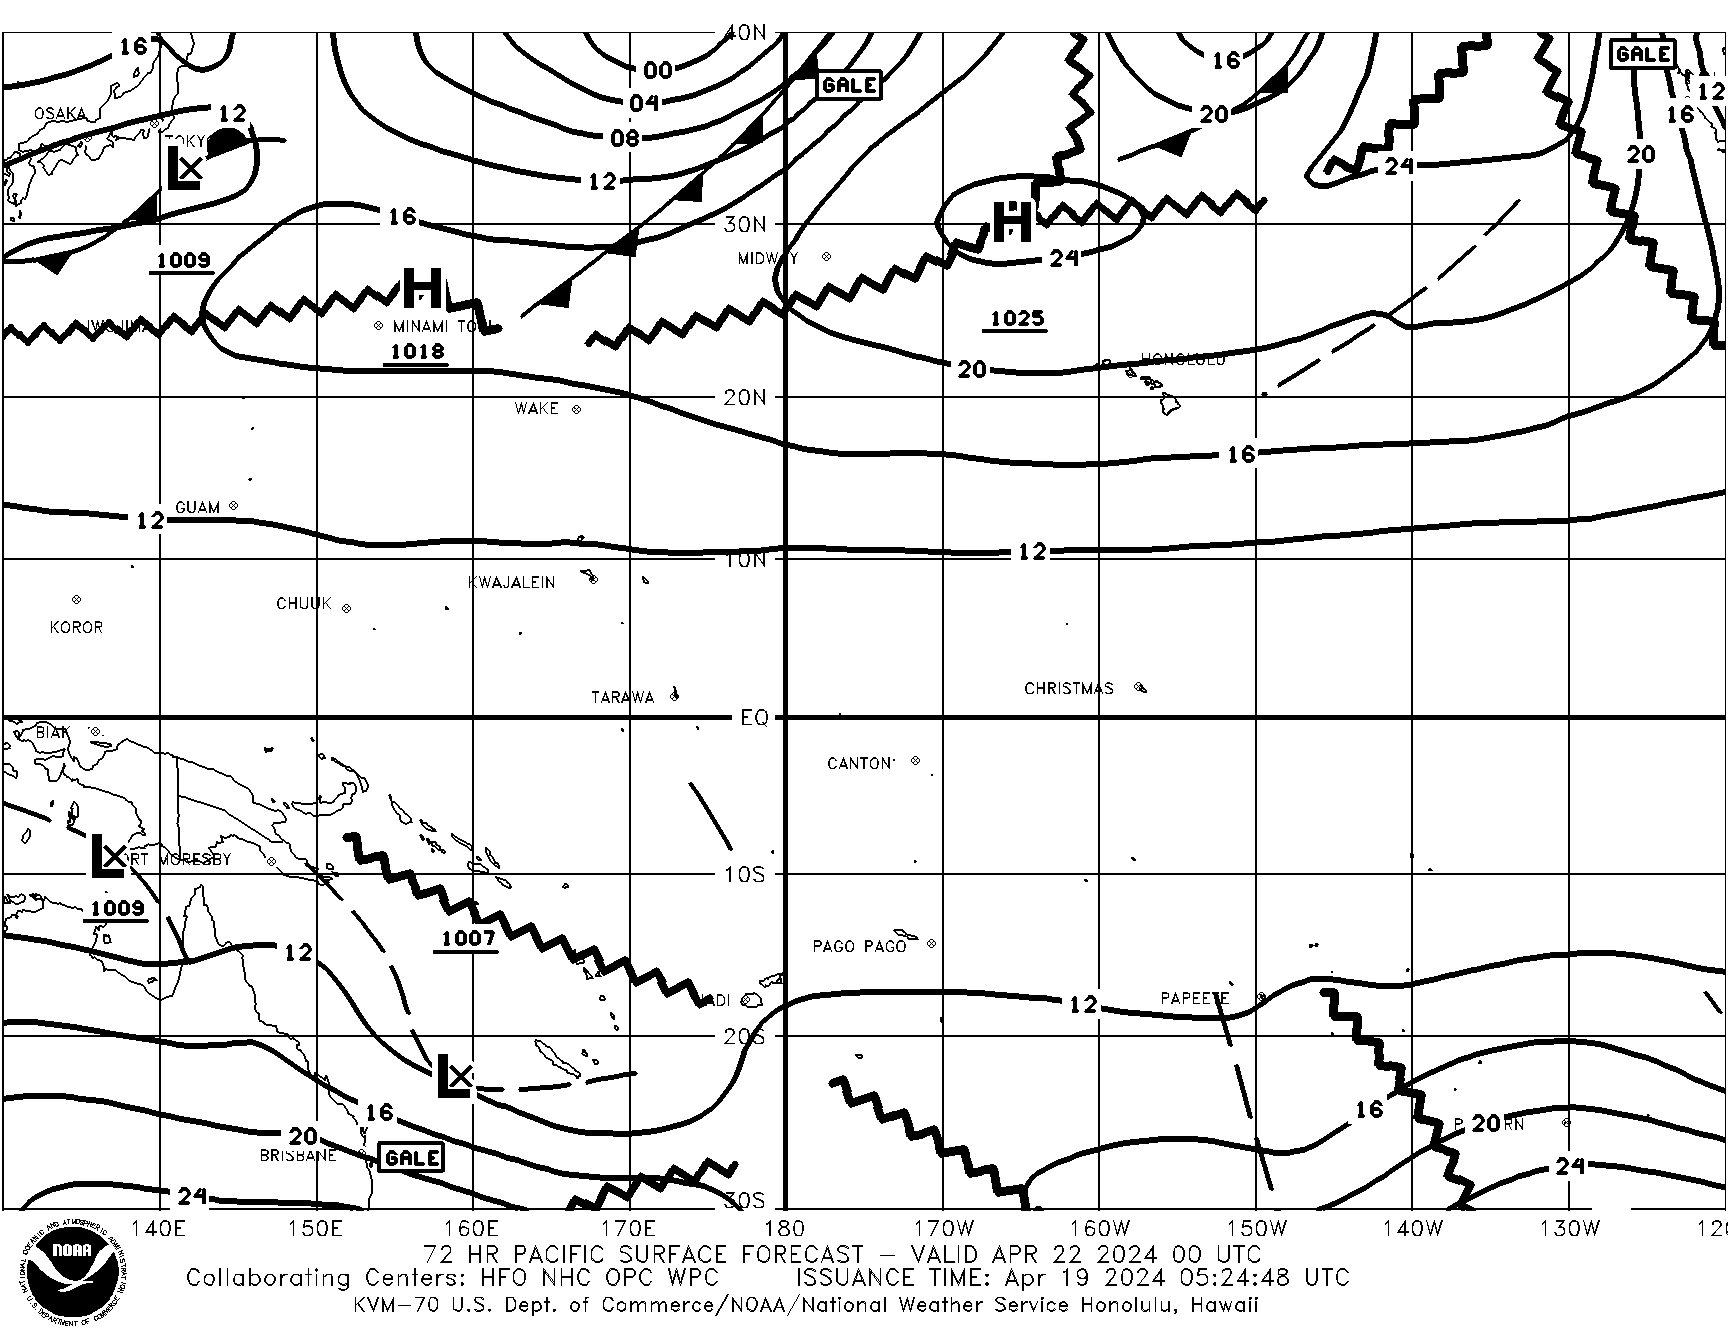 |
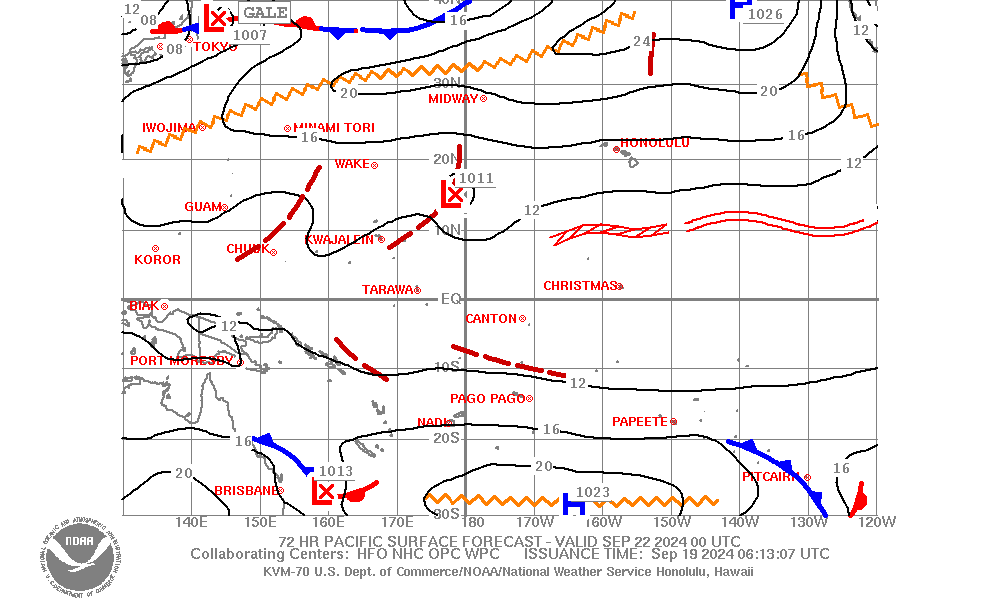 |
| 72HR Pacific Surface Forecast VT12Z 30S-40N 120W-130E | |
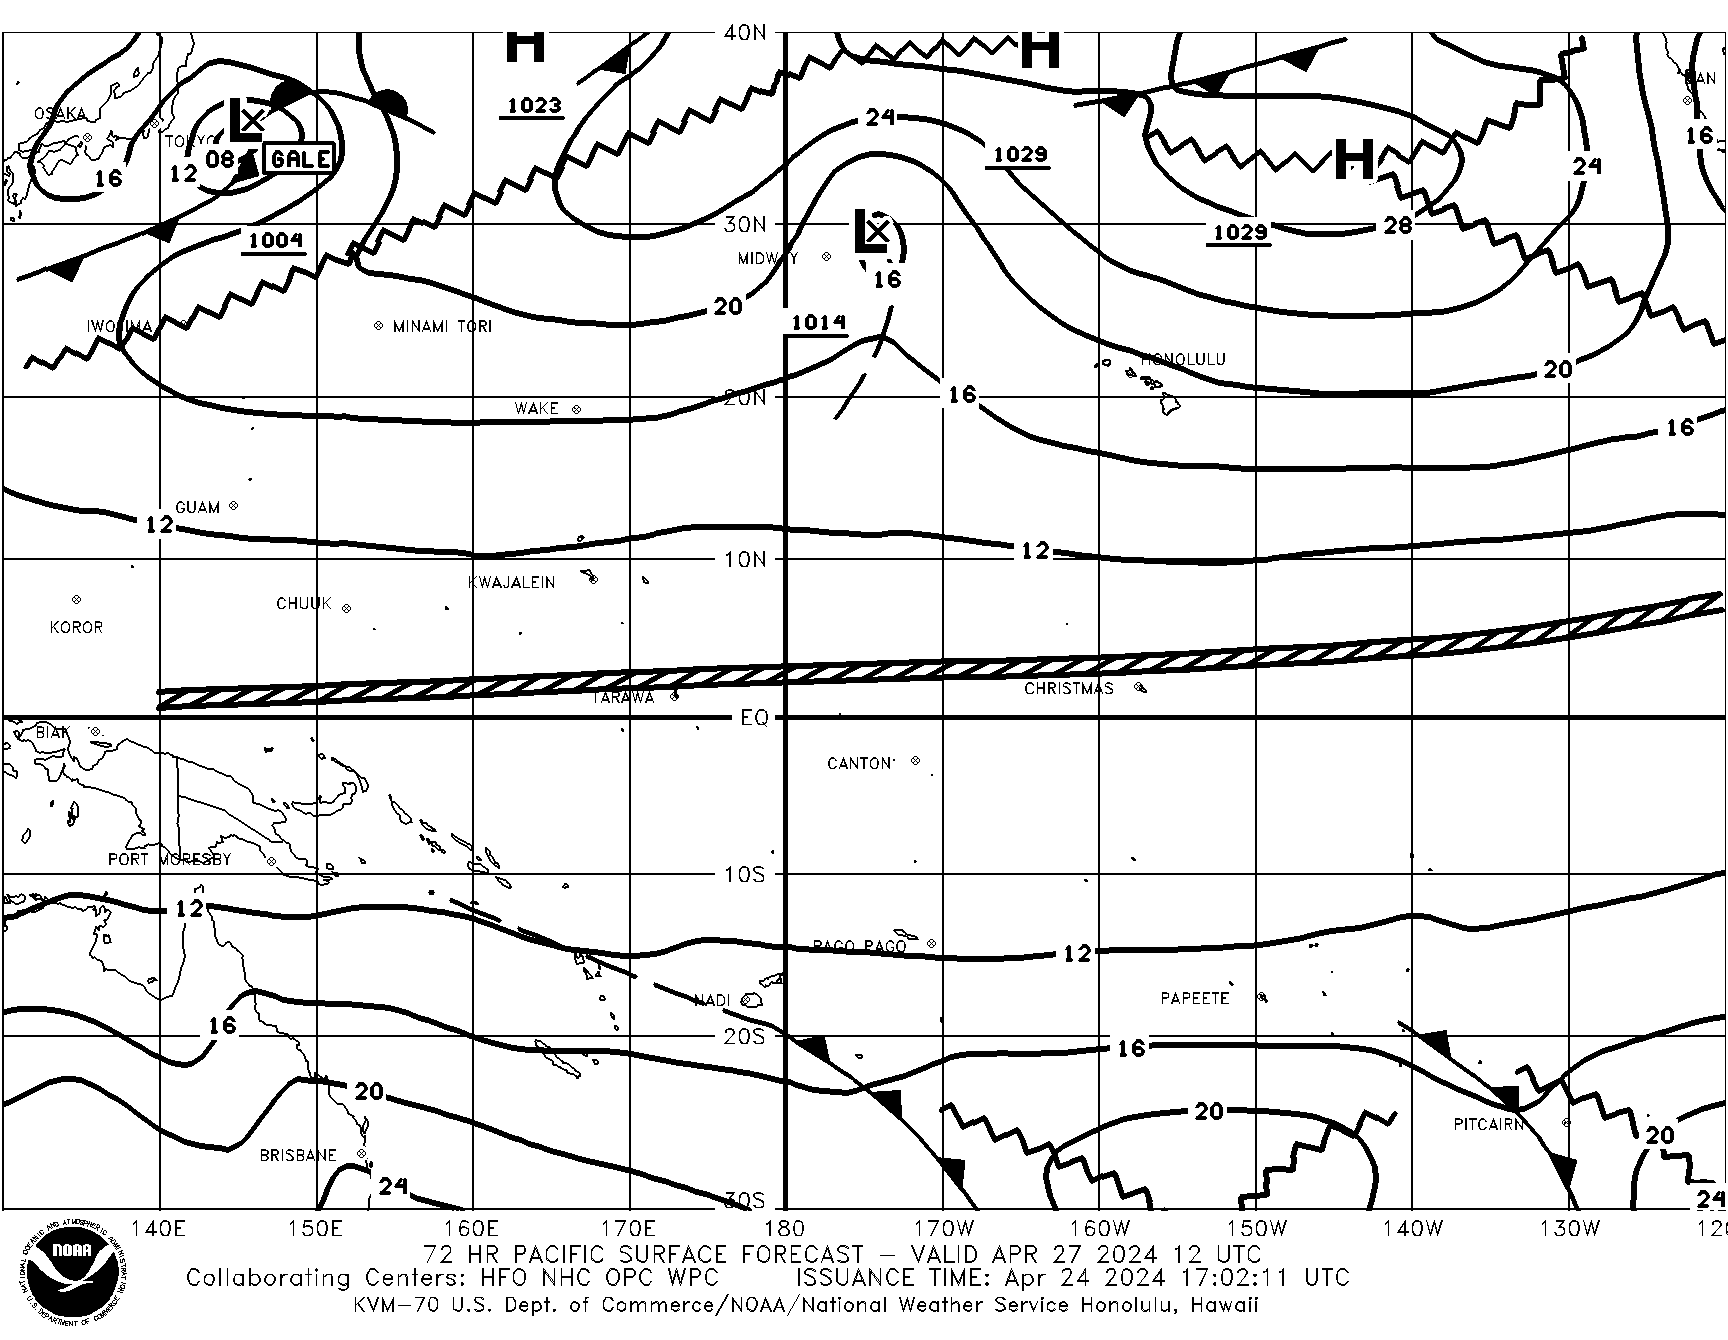 |
 |
| * Not transmitted via Honolulu radiofax but listed here for convenience | |||
| Surface Charts- Southeast Pacific | ||
|---|---|---|
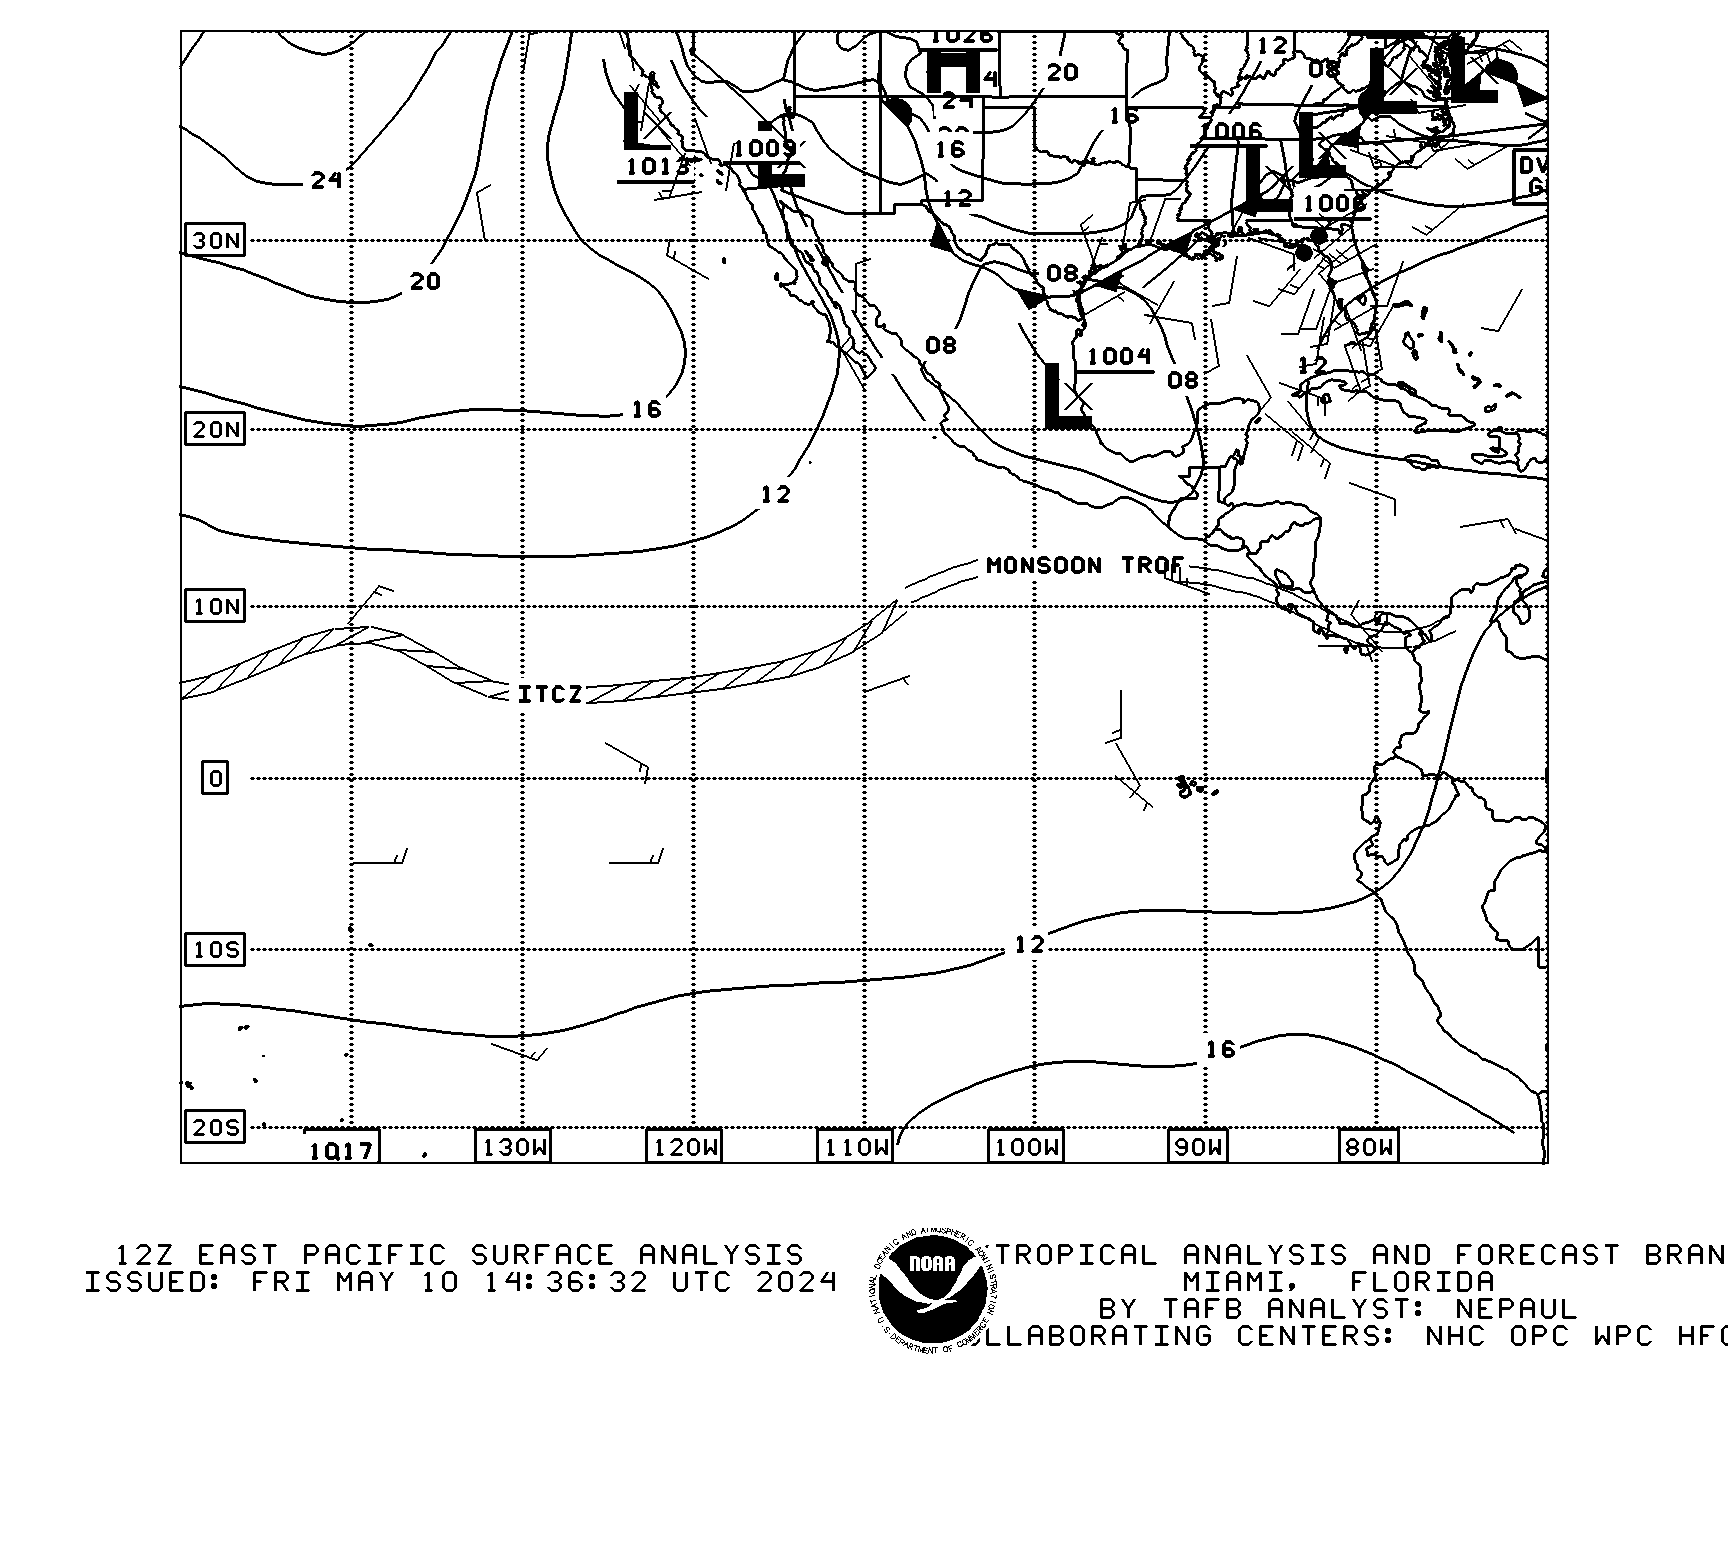
| East Pacific Surface Analysis VT00Z 20S-30N E of 145W | |
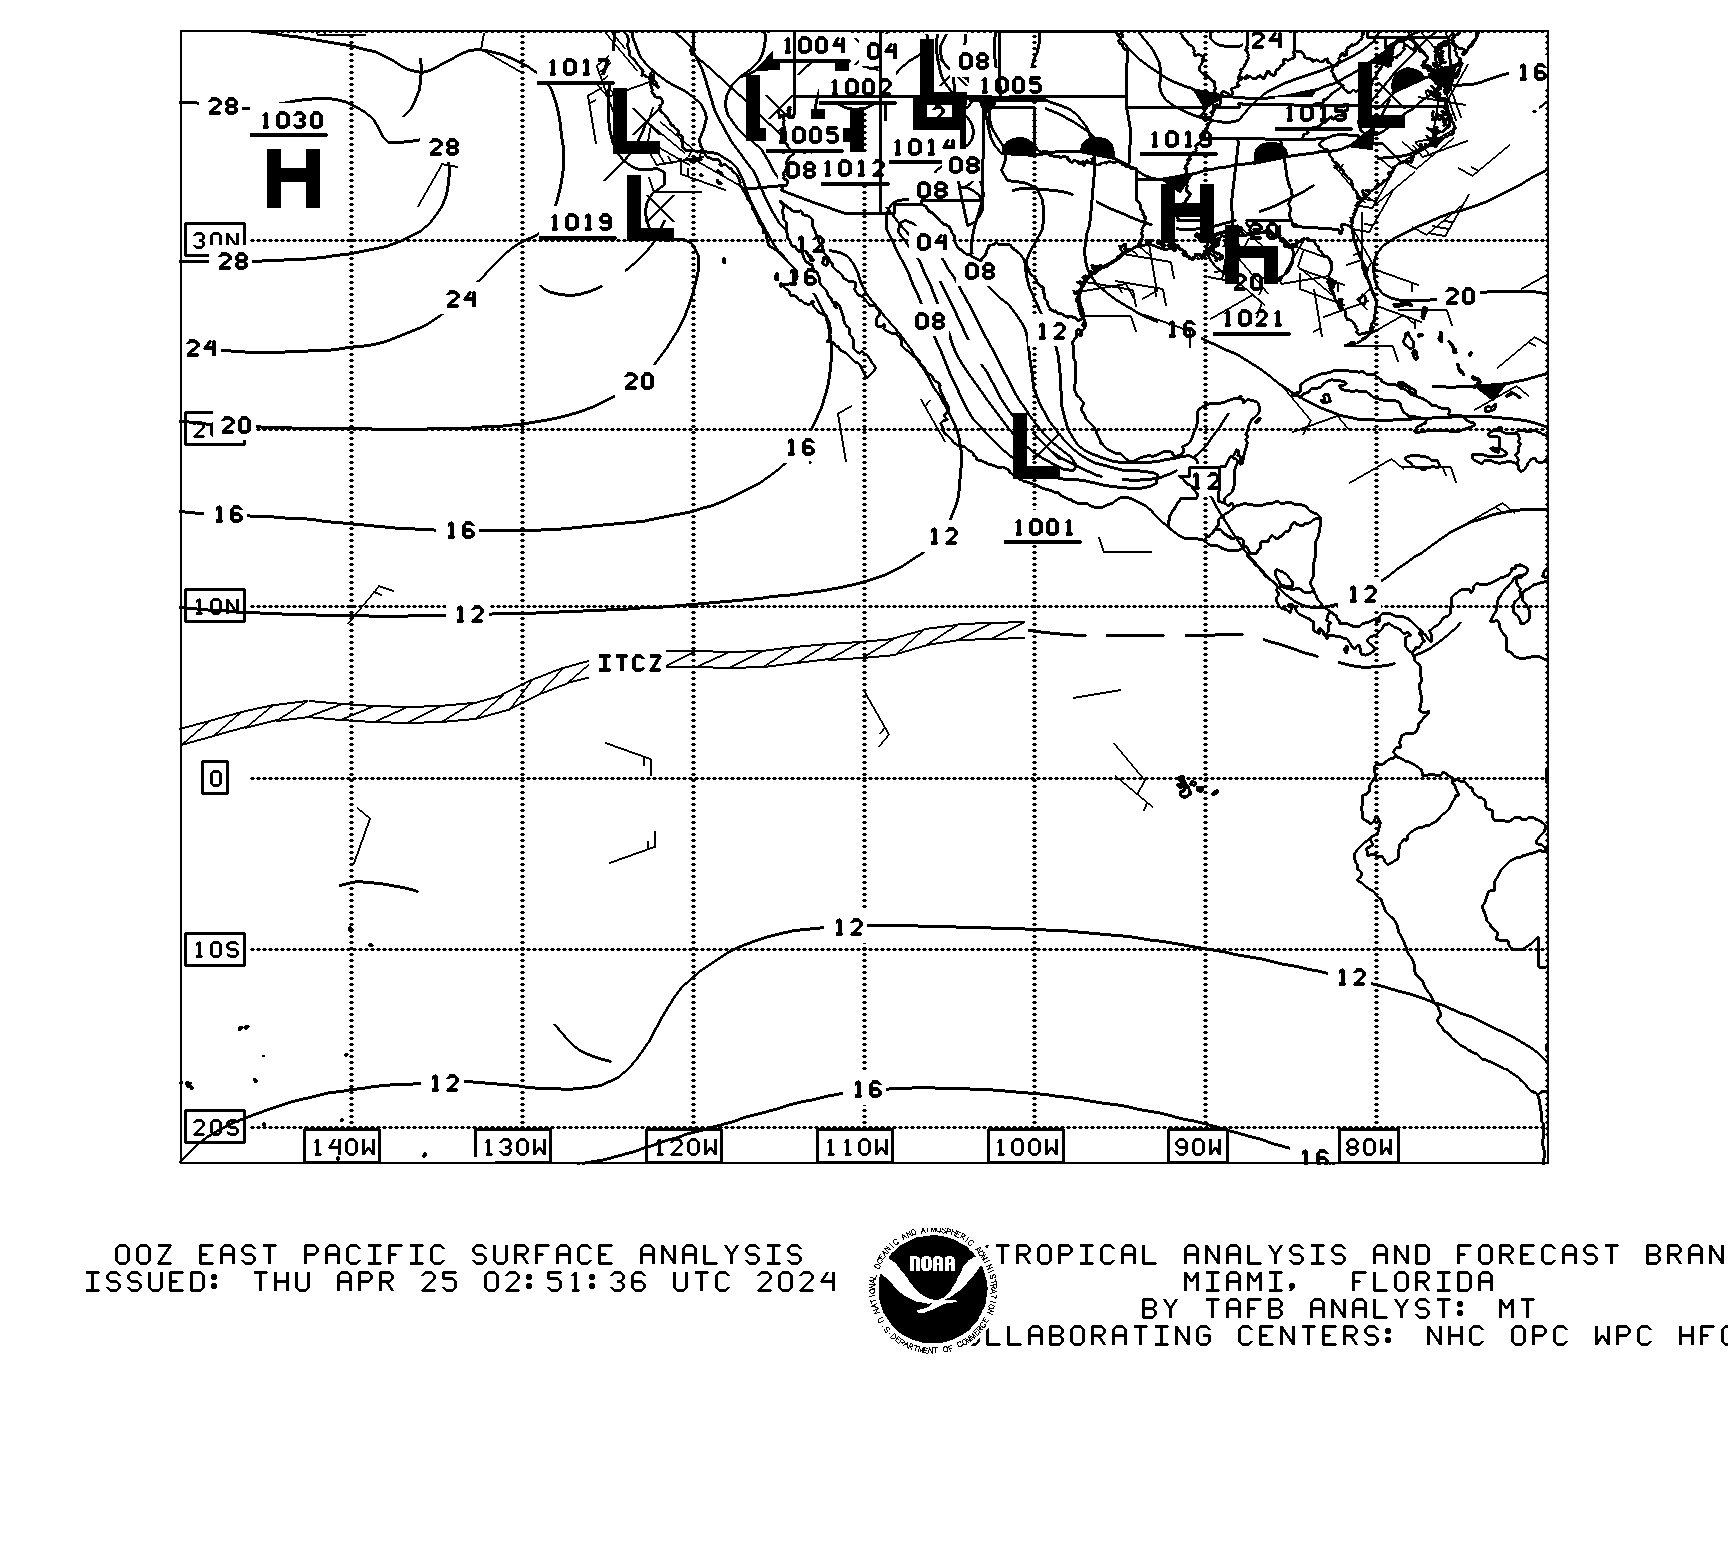 |
| East Pacific Surface Analysis VT06Z 20S-30N E of 145W | |
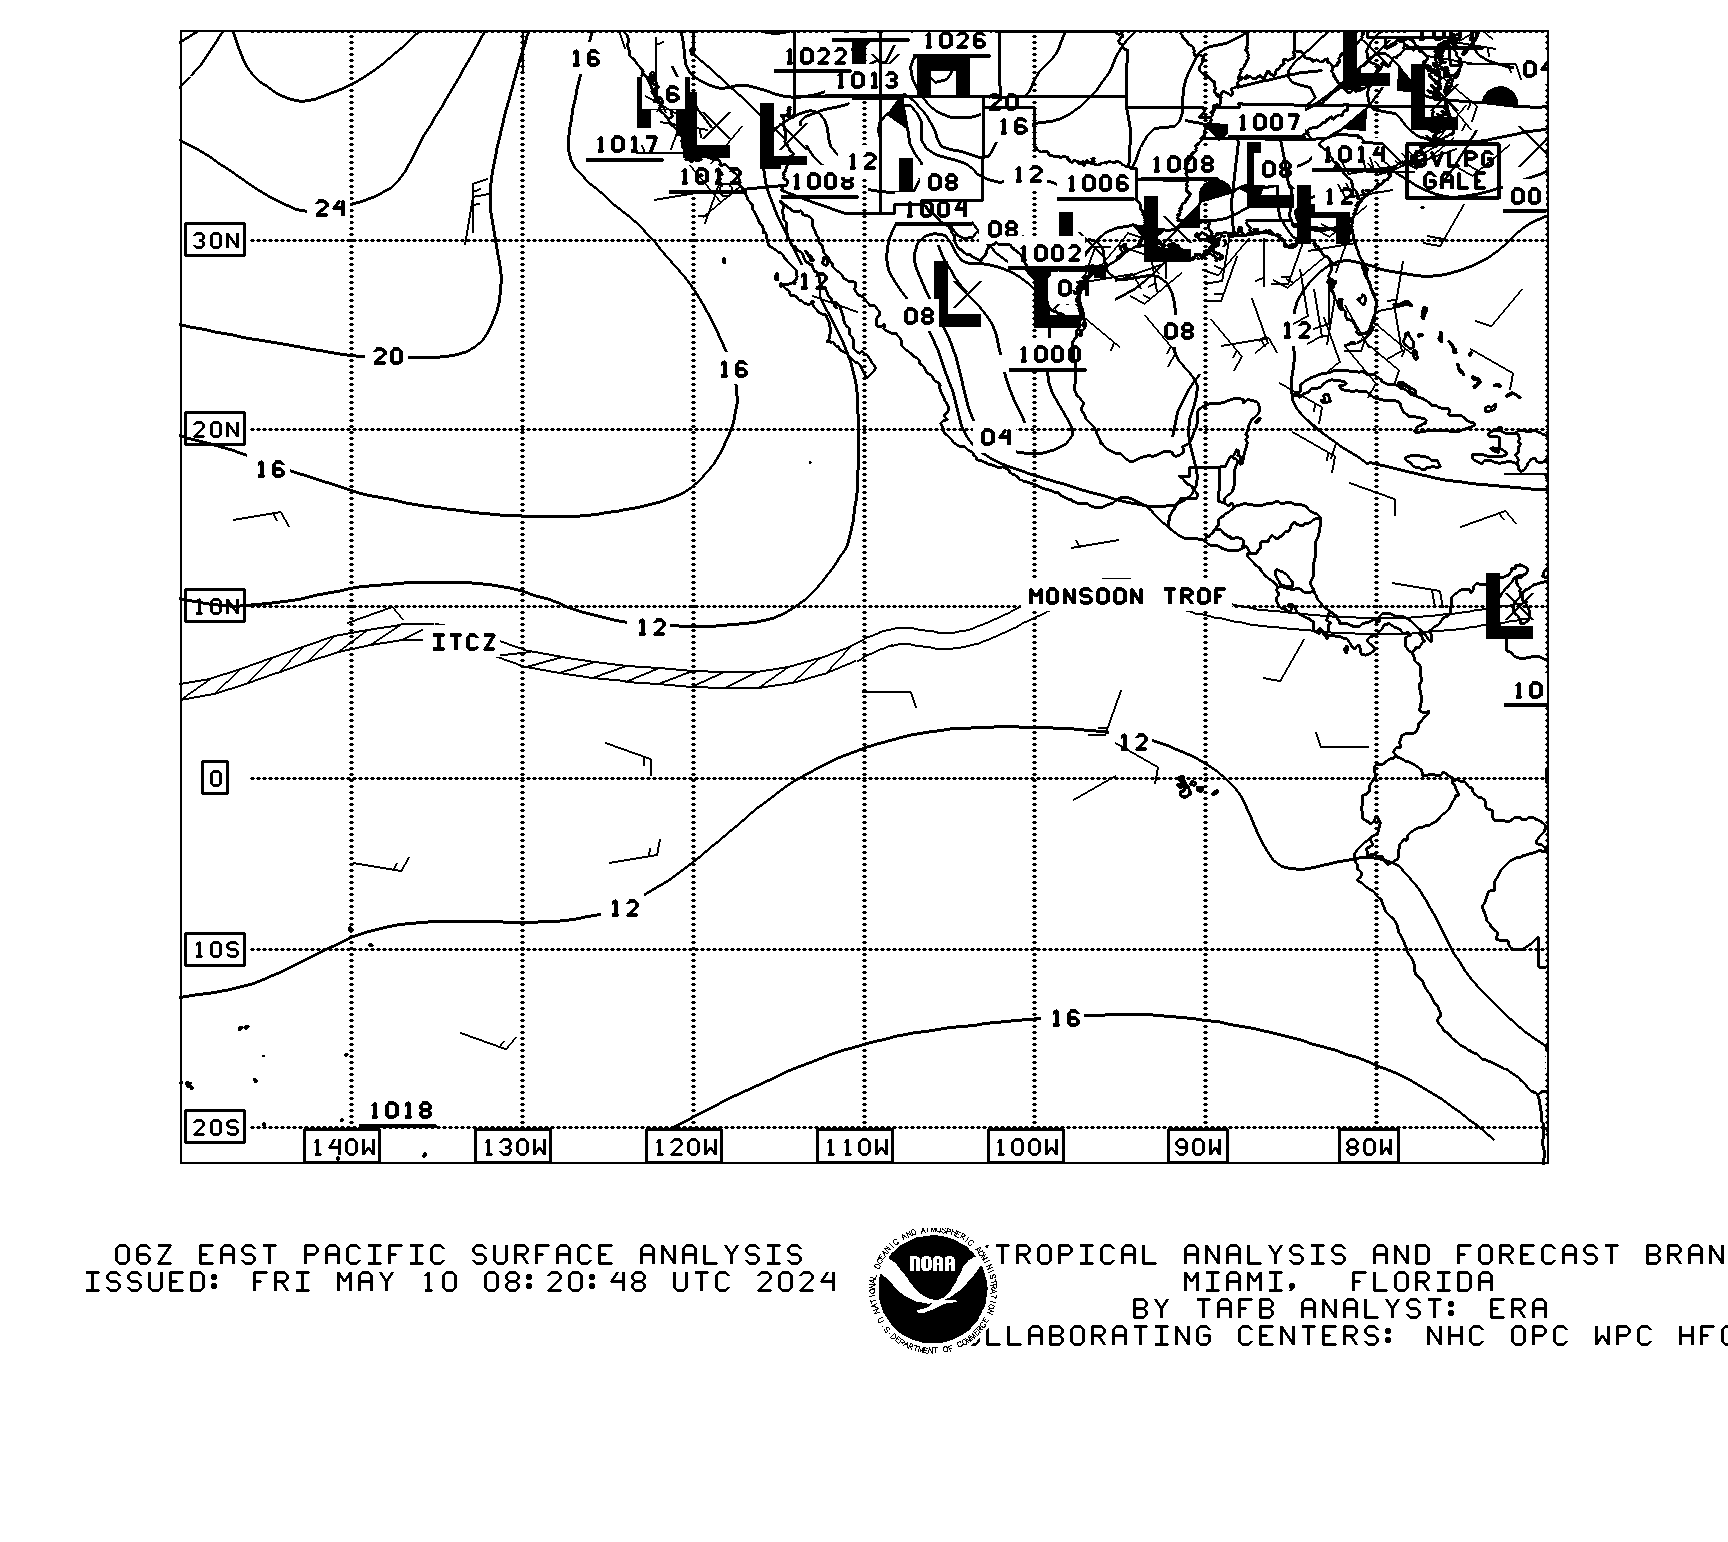 |
| East Pacific Surface Analysis VT12Z 20S-30N E of 145W | |
 |
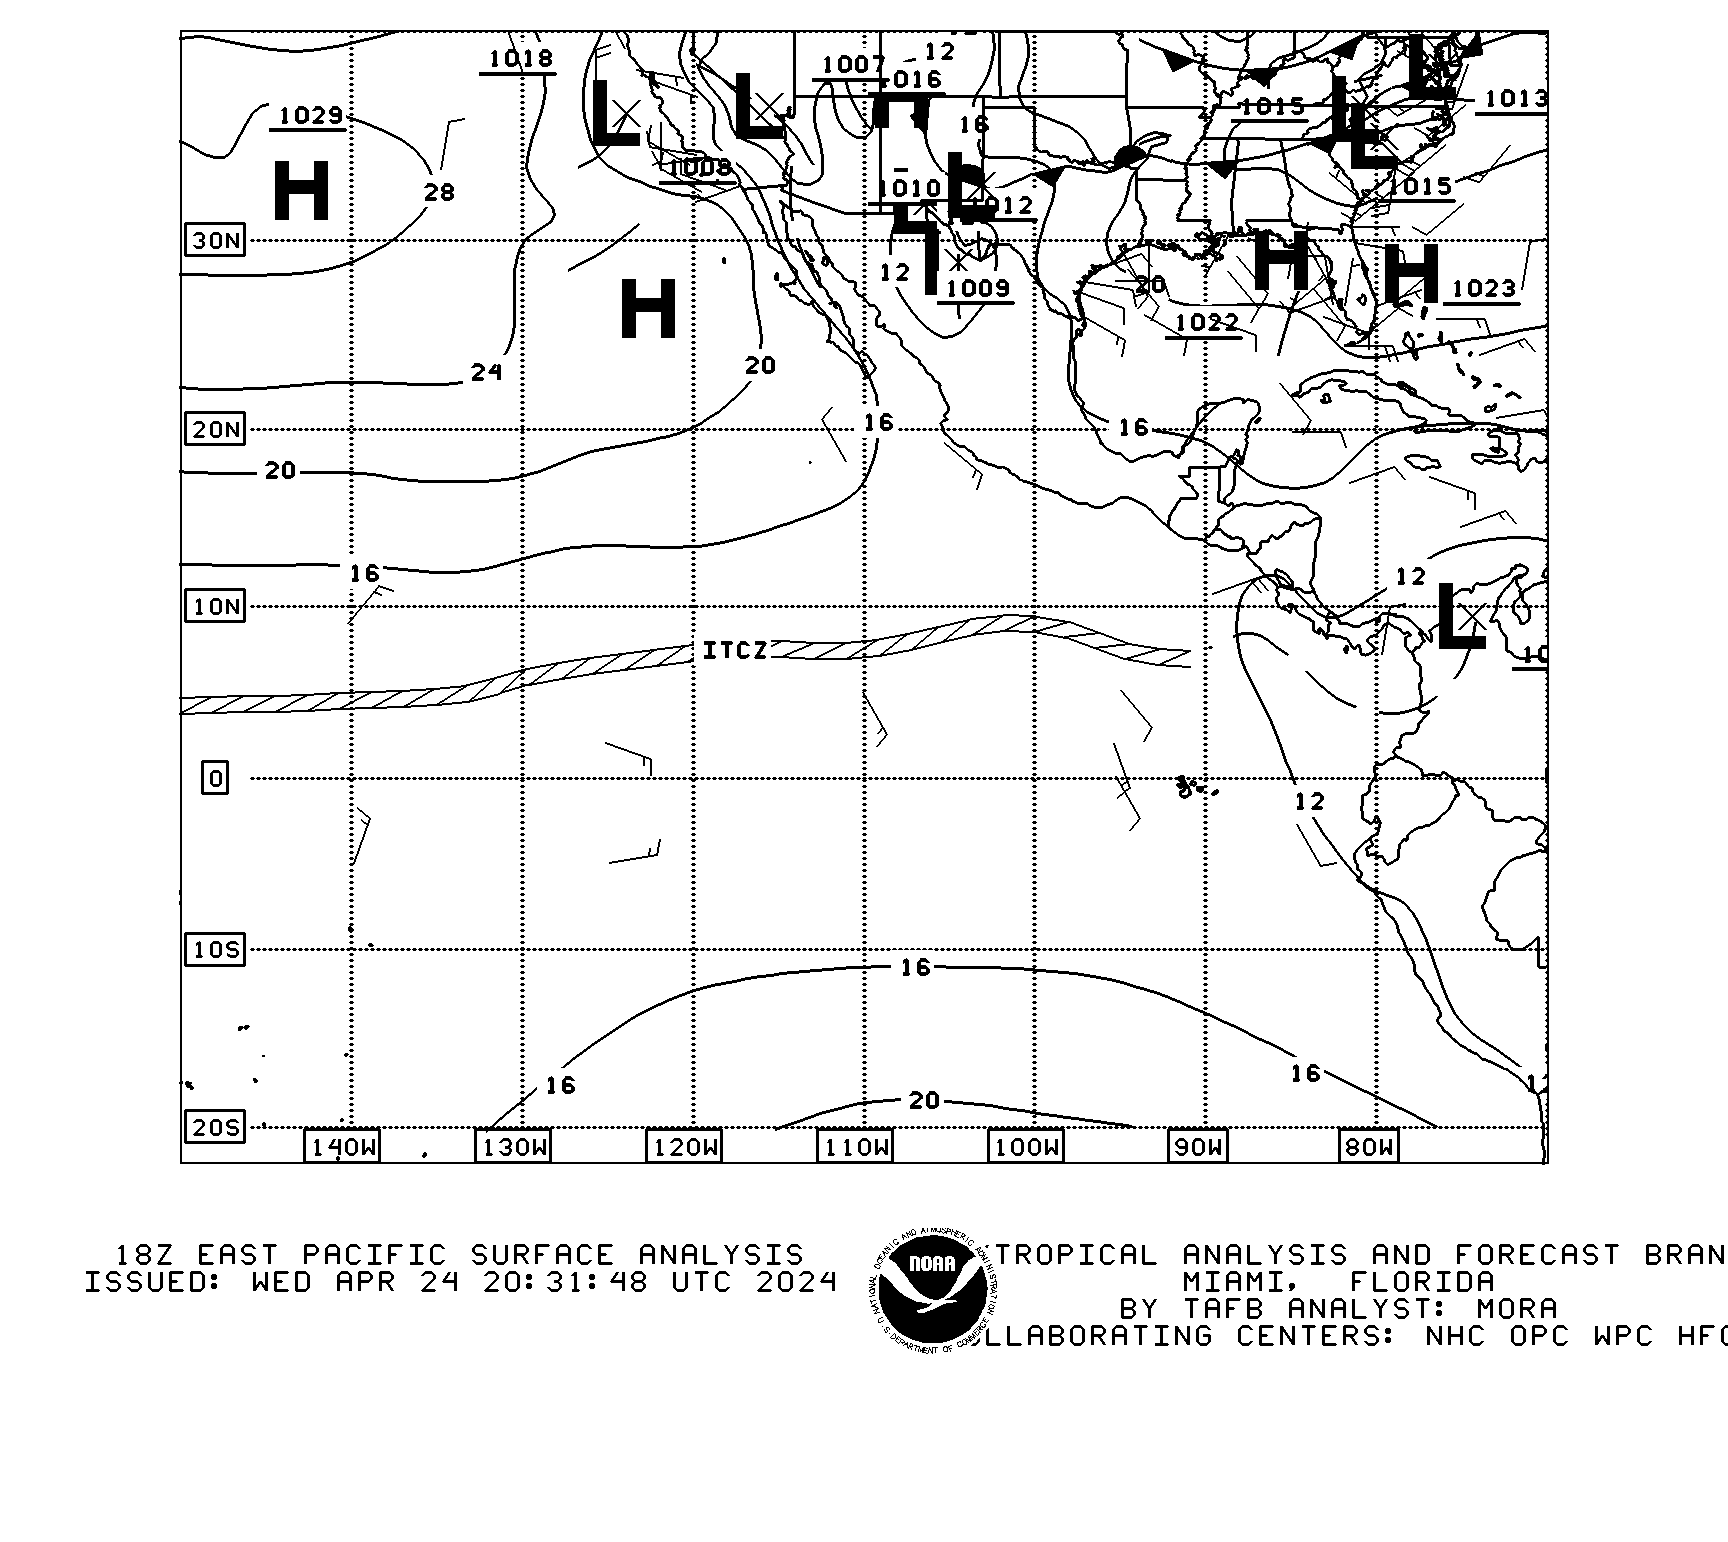
| East Pacific Surface Analysis VT18Z 20S-30N E of 145W | |
 |
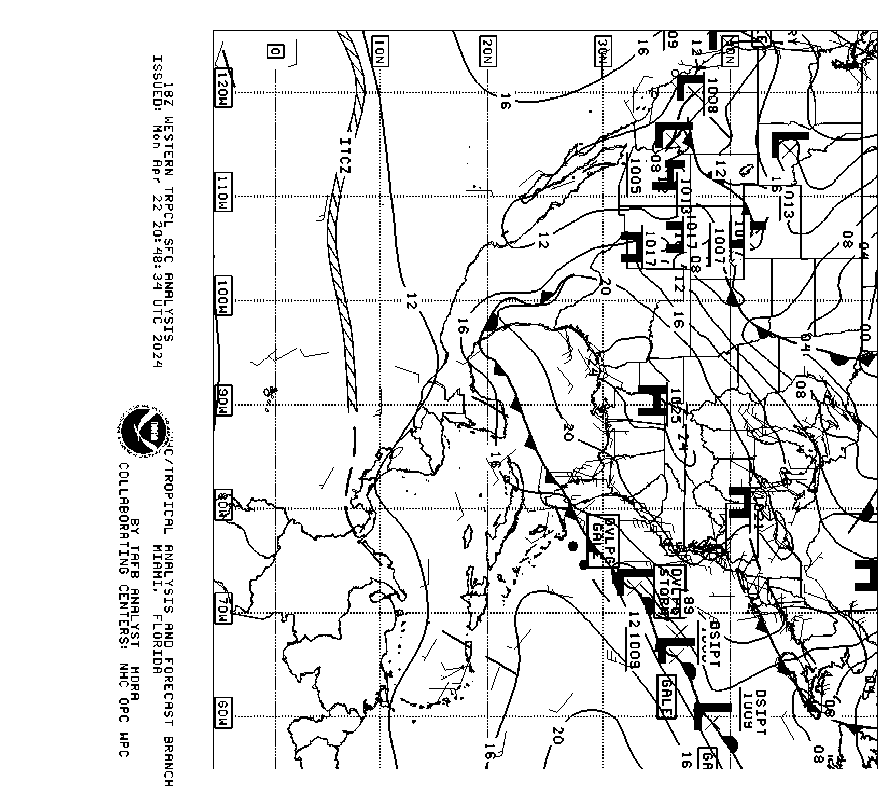
| U.S./Tropical Sfc Analysis VT00Z 5S-50N 55W-125W* | |
 |
| U.S./Tropical Sfc Analysis VT06Z 5S-50N 55W-125W* | |
 |
| U.S./Tropical Sfc Analysis VT12Z 5S-50N 55W-125W* | |
 |
| U.S./Tropical Sfc Analysis VT18Z 5S-50N 55W-125W* | |
 |
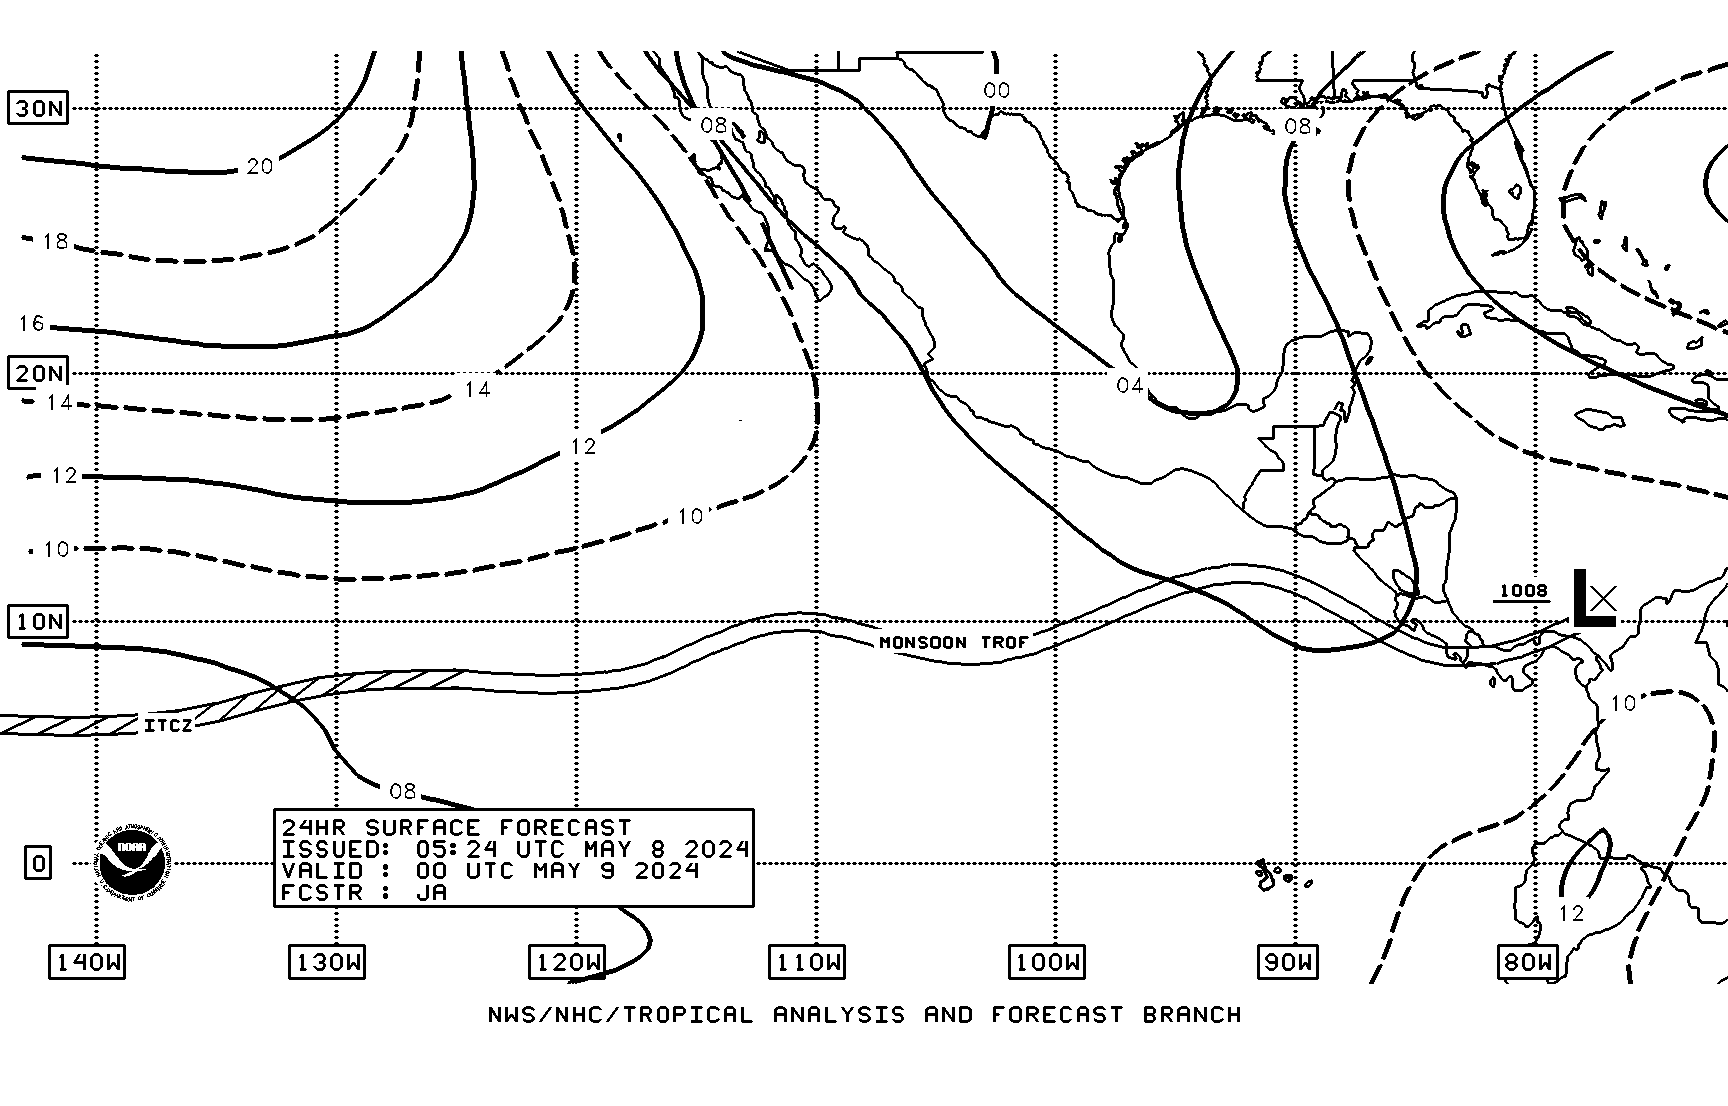
| 24HR Tropical Sfc Forecast VT00Z 20S-30N E of 145W | |
 |
| 24HR Tropical Sfc Forecast VT12Z 20S-30N E of 145W | |
 |
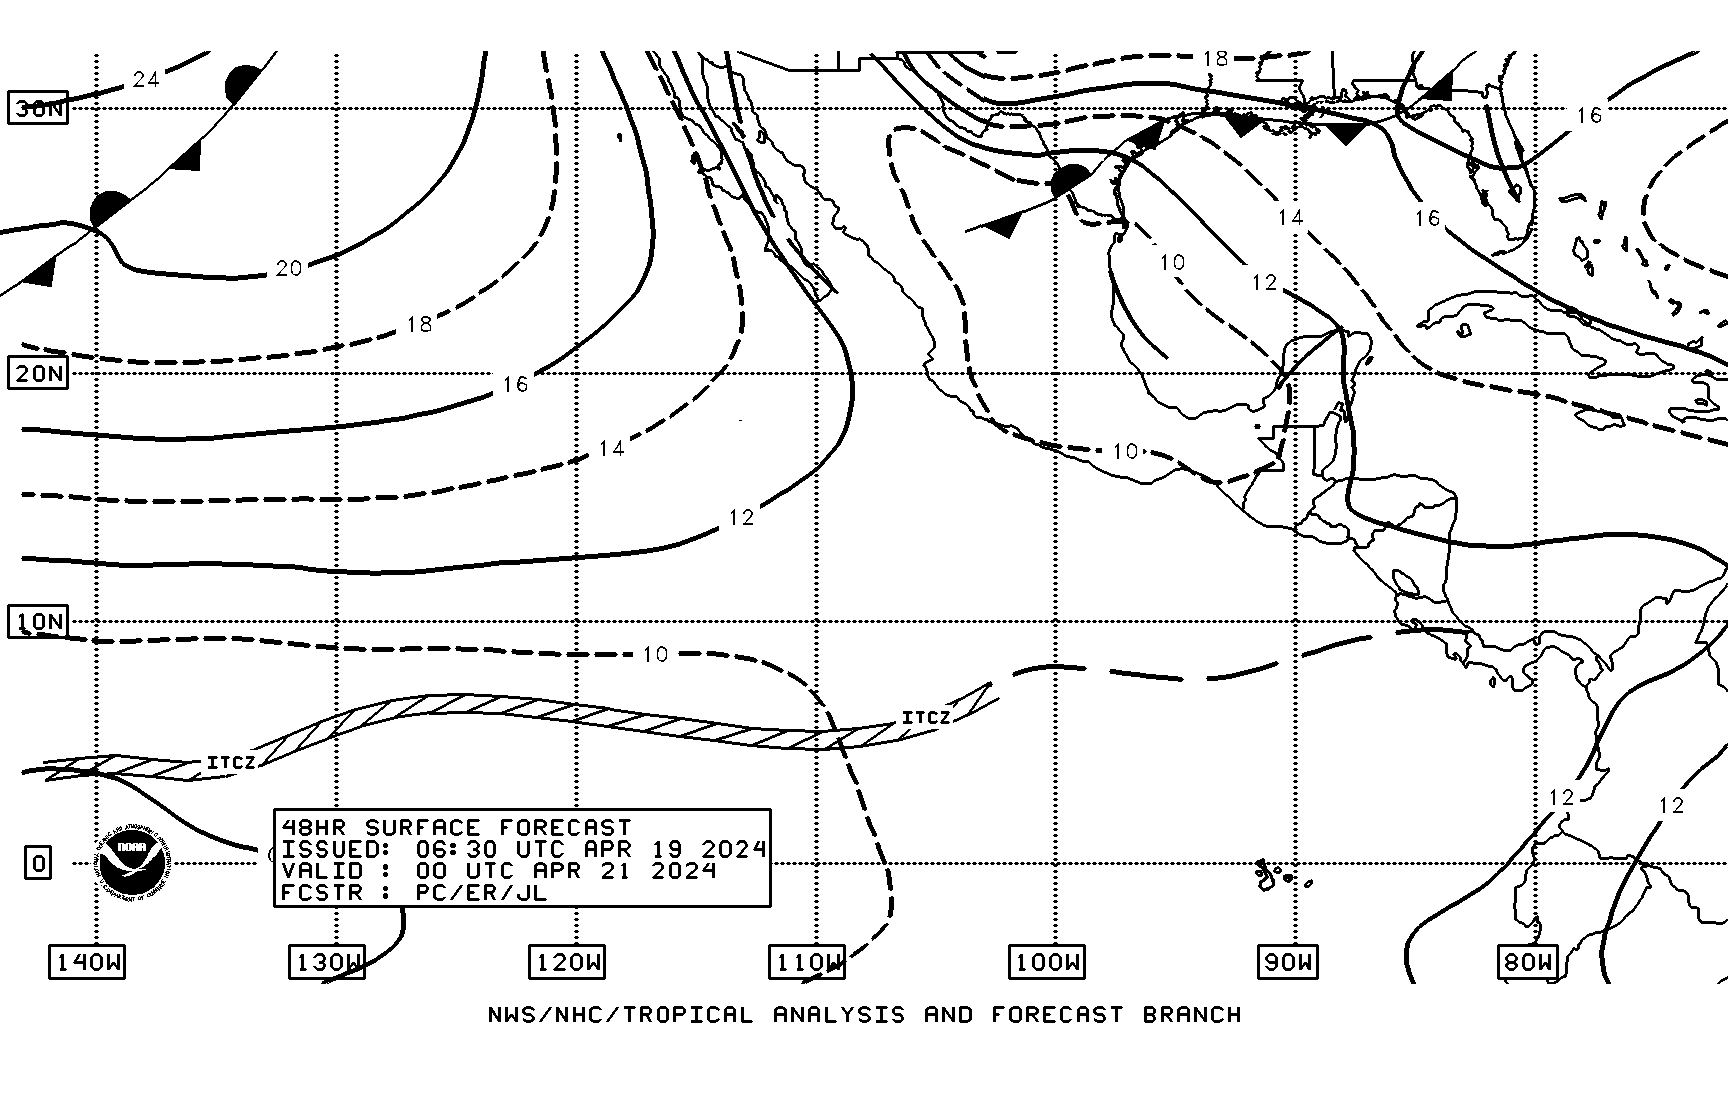
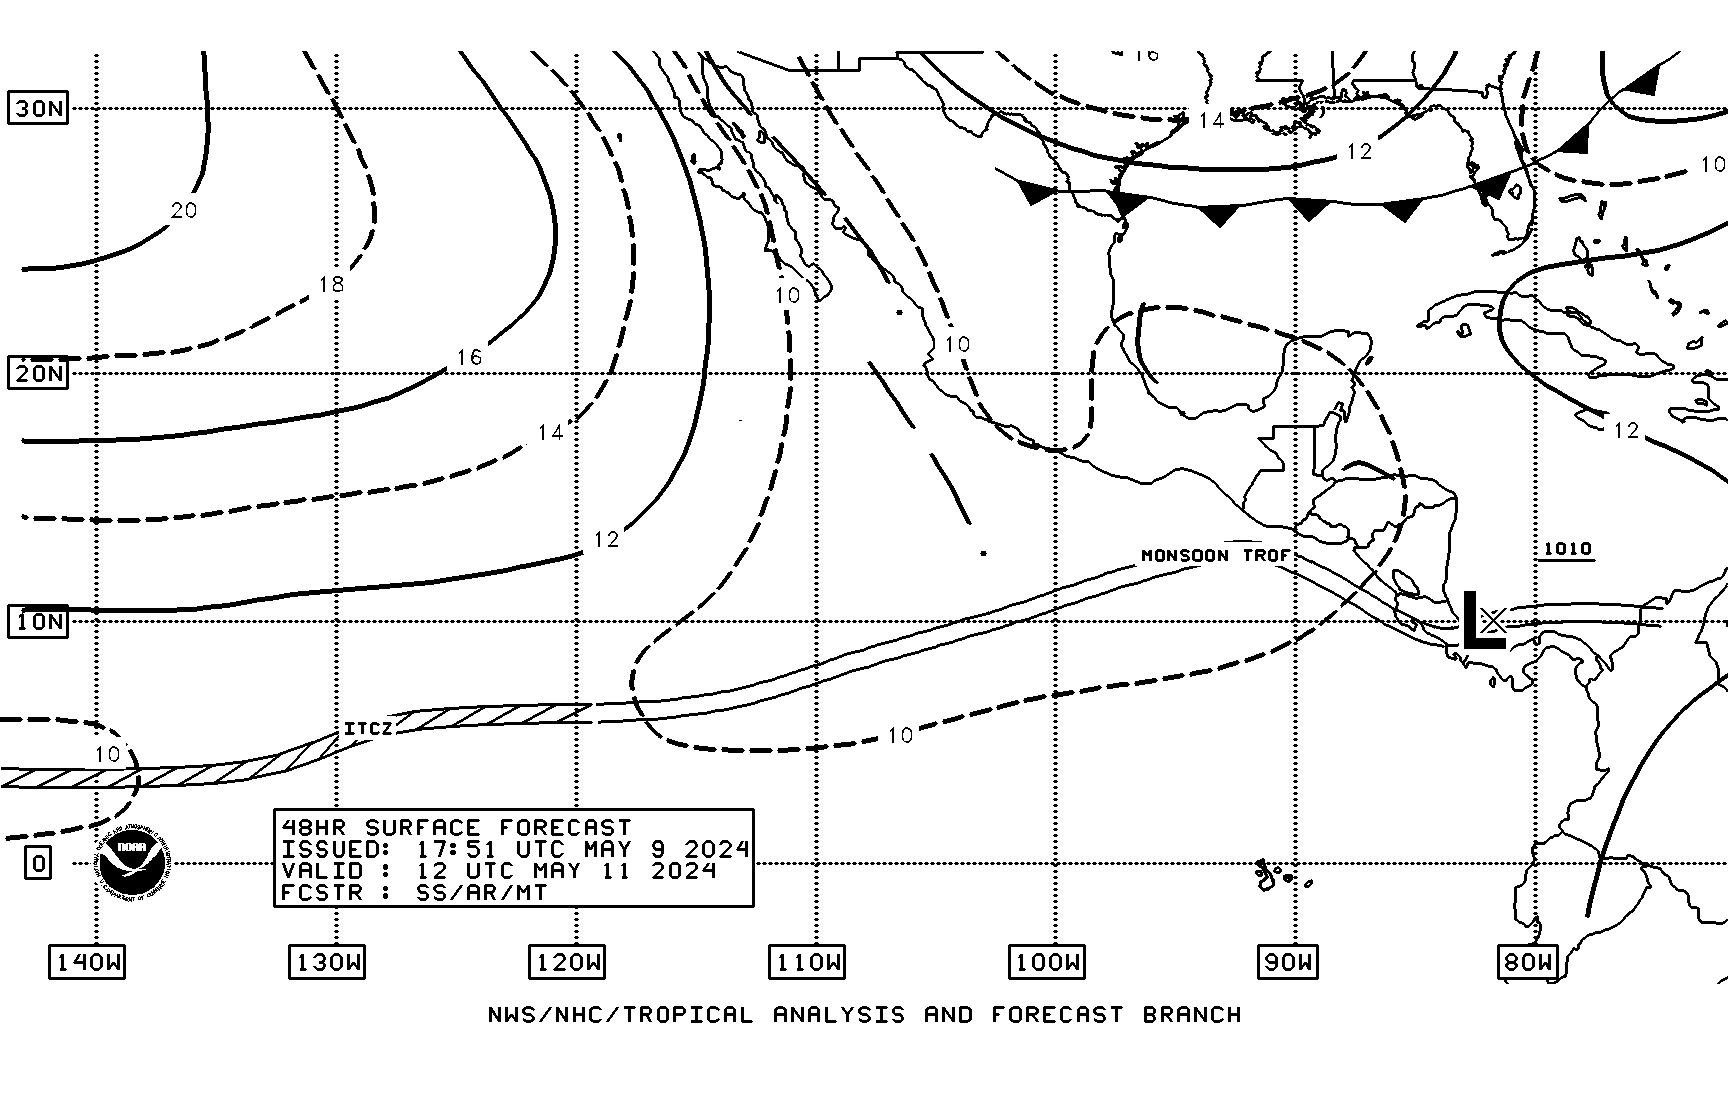
| 48HR Tropical Sfc Forecast VT00Z 20S-30N E of 145W | |
 |
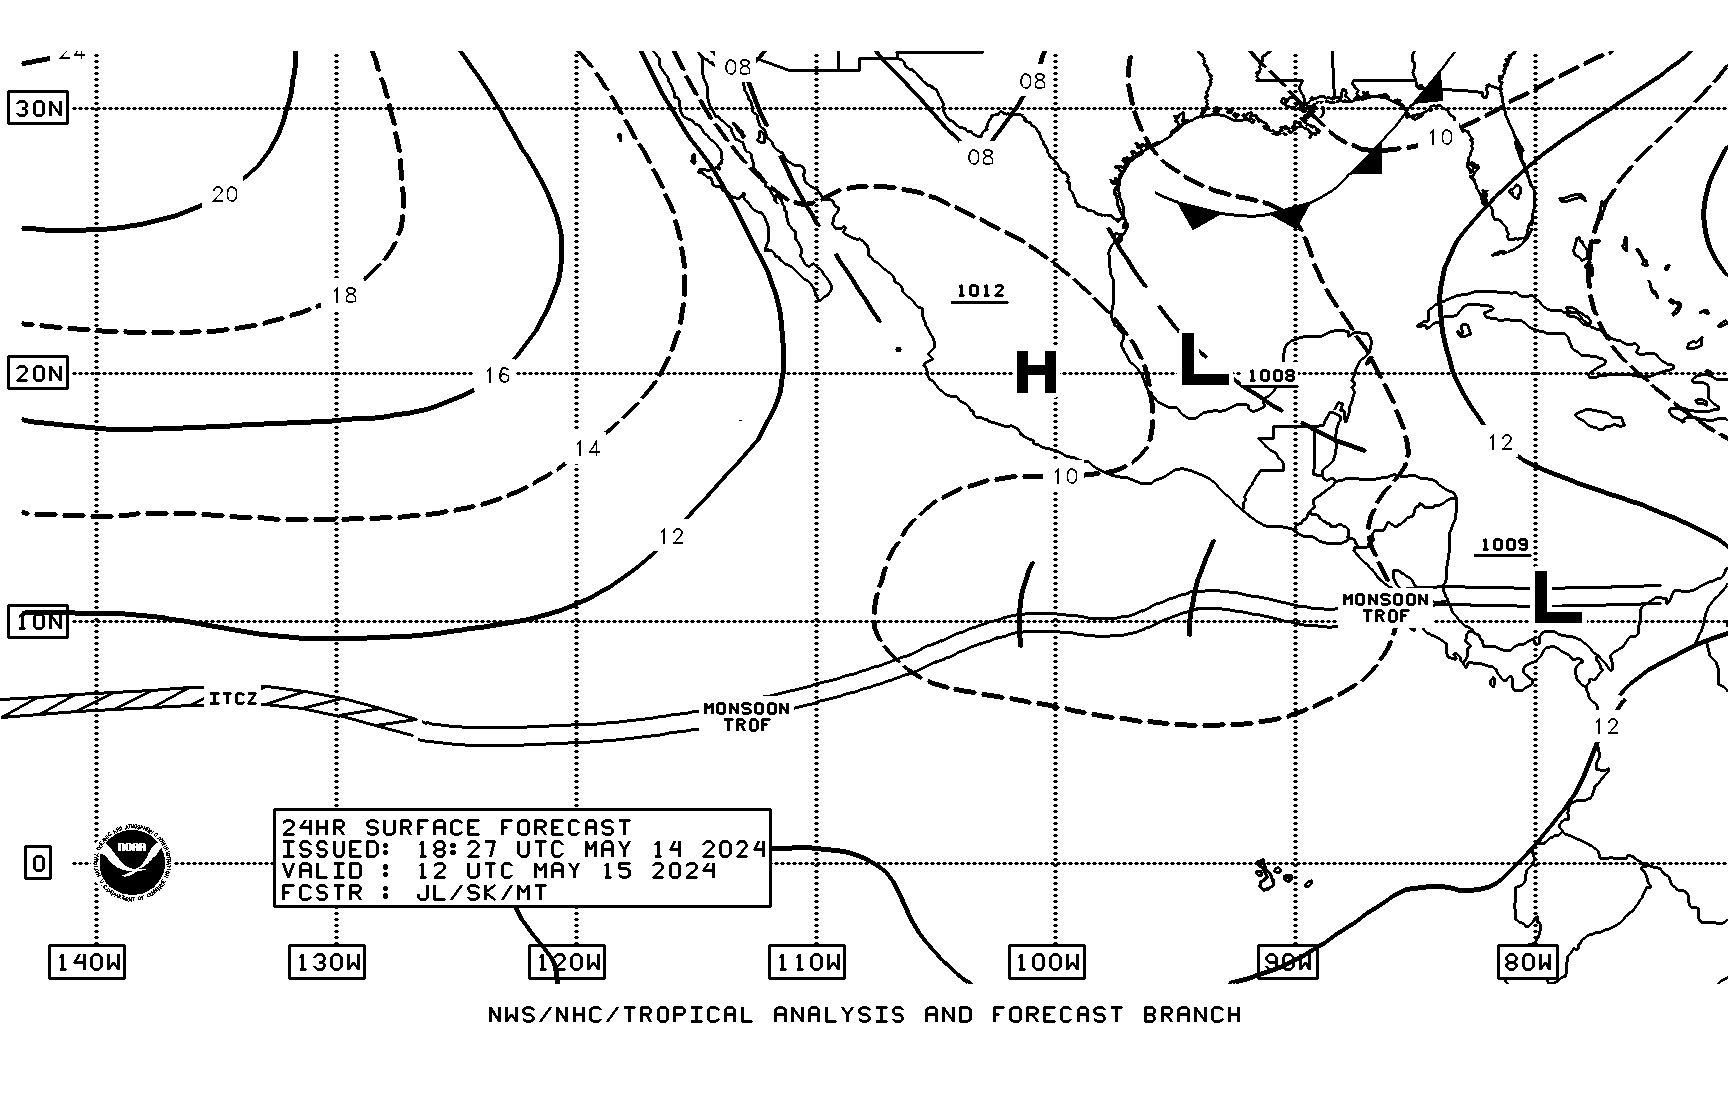
| 48HR Tropical Sfc Forecast VT12Z 20S-30N E of 145W | |
 |
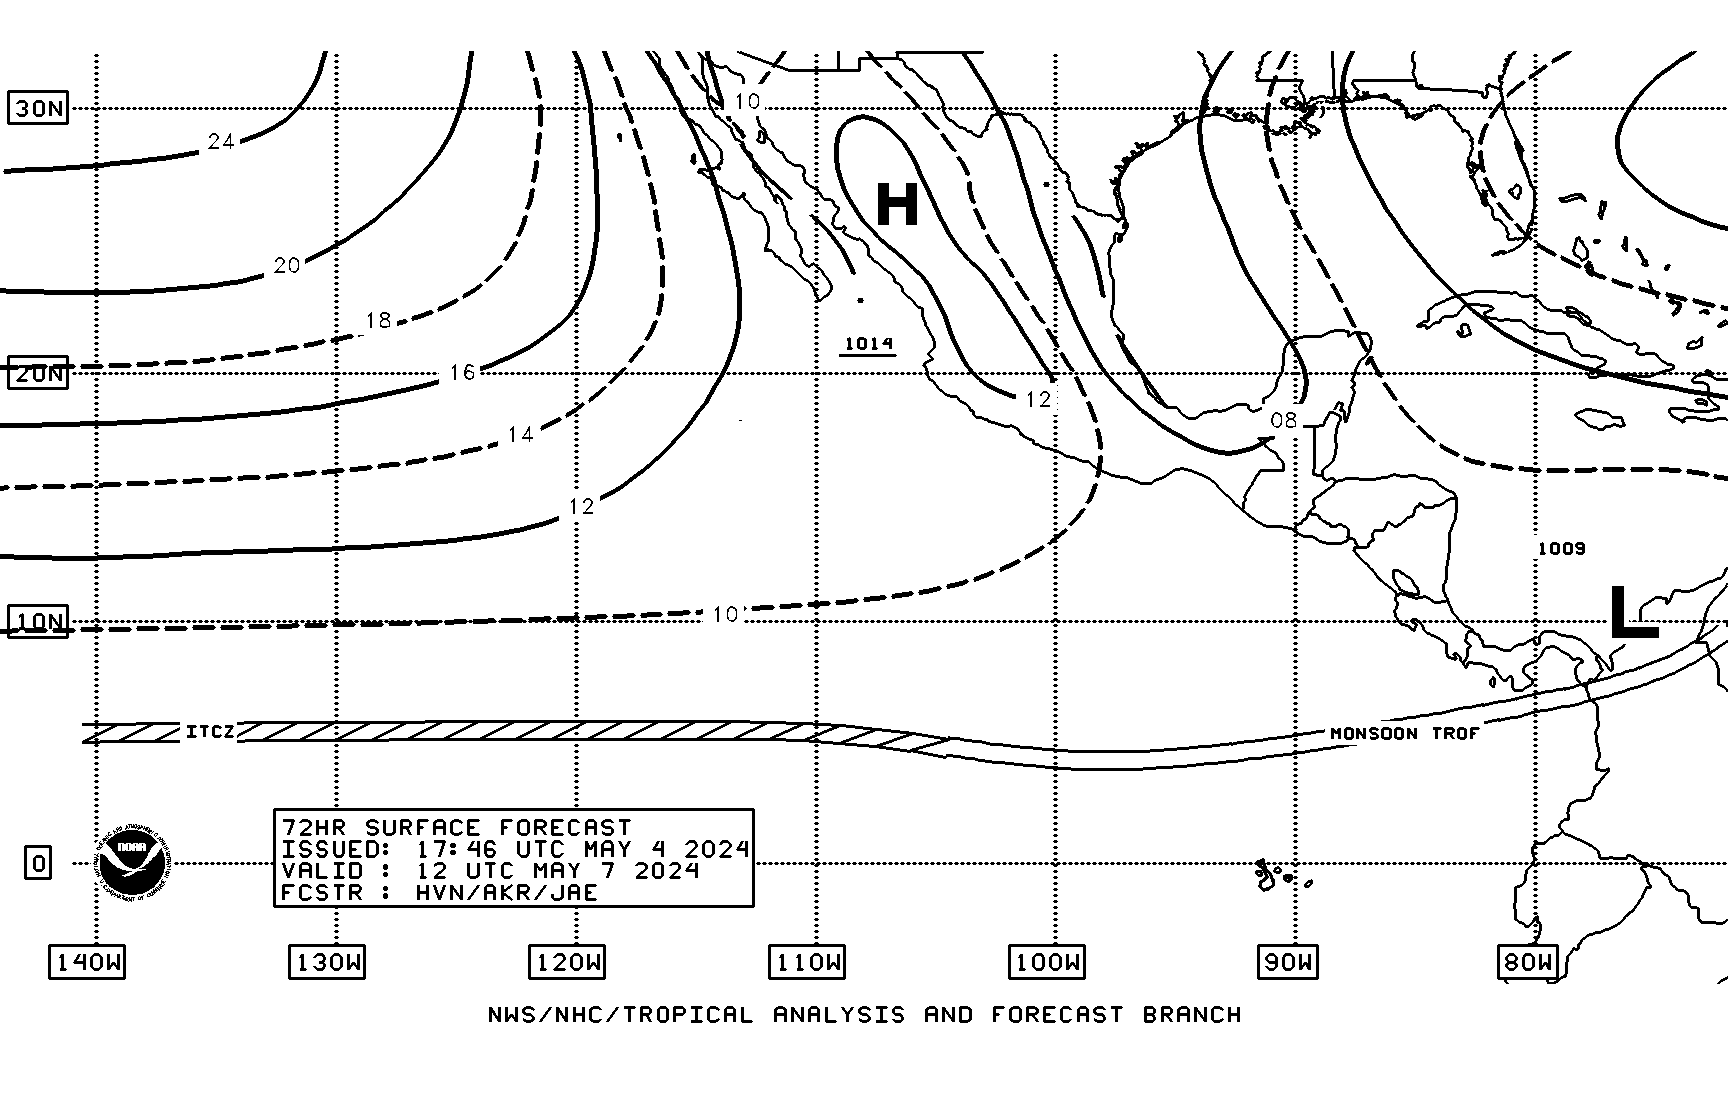
| 72HR Tropical Sfc Forecast VT00Z 20S-30N E of 145W | |
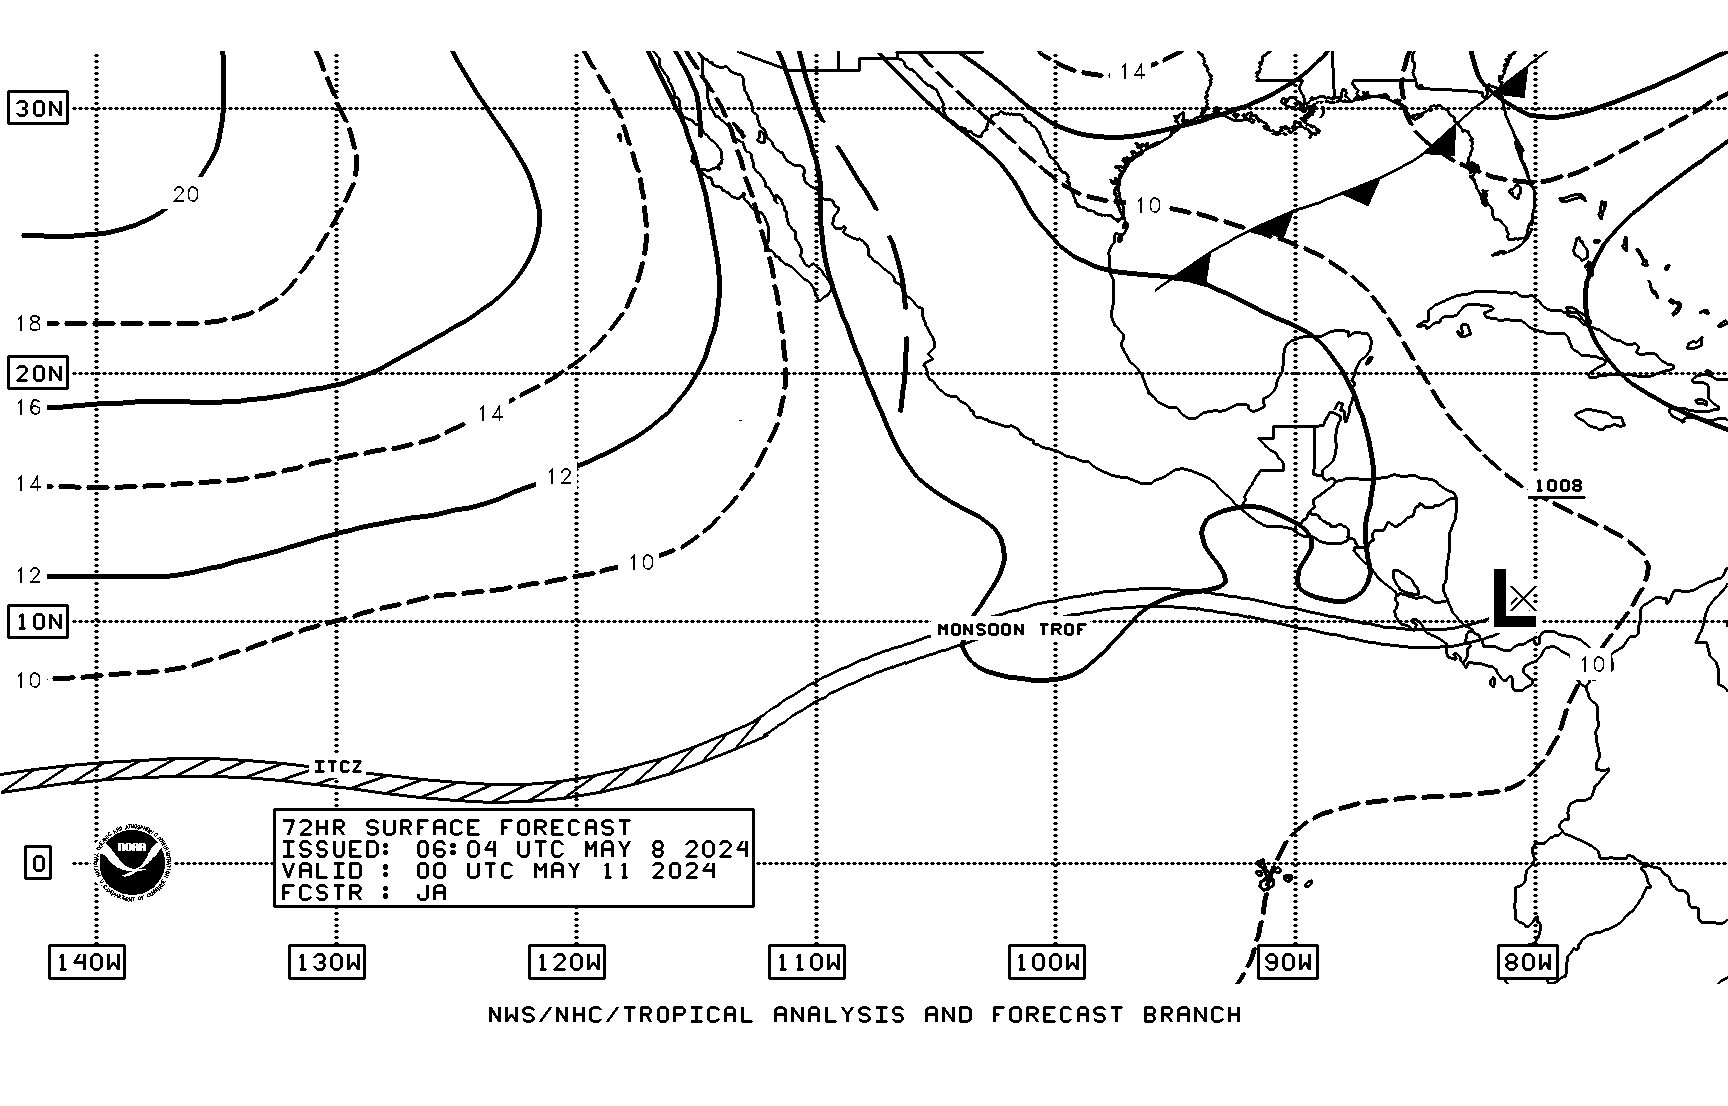 |
| 72HR Tropical Sfc Forecast VT12Z 20S-30N E of 145W | |
 |
| * Not transmitted via Honolulu radiofax but listed here for convenience | ||
| Surface Charts - North Pacific | |||
|---|---|---|---|
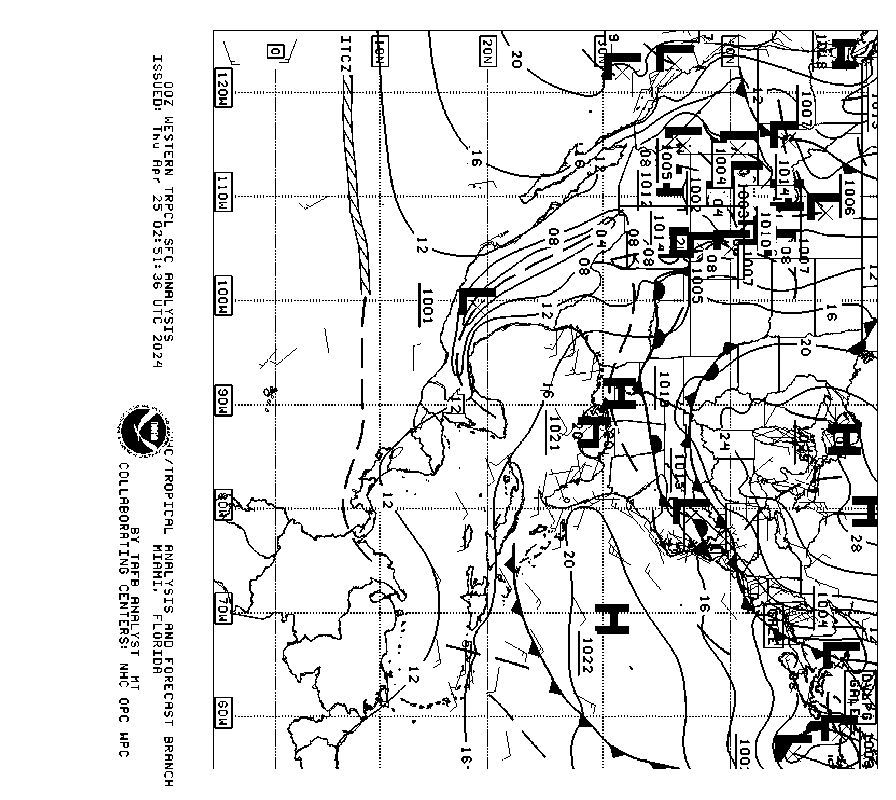
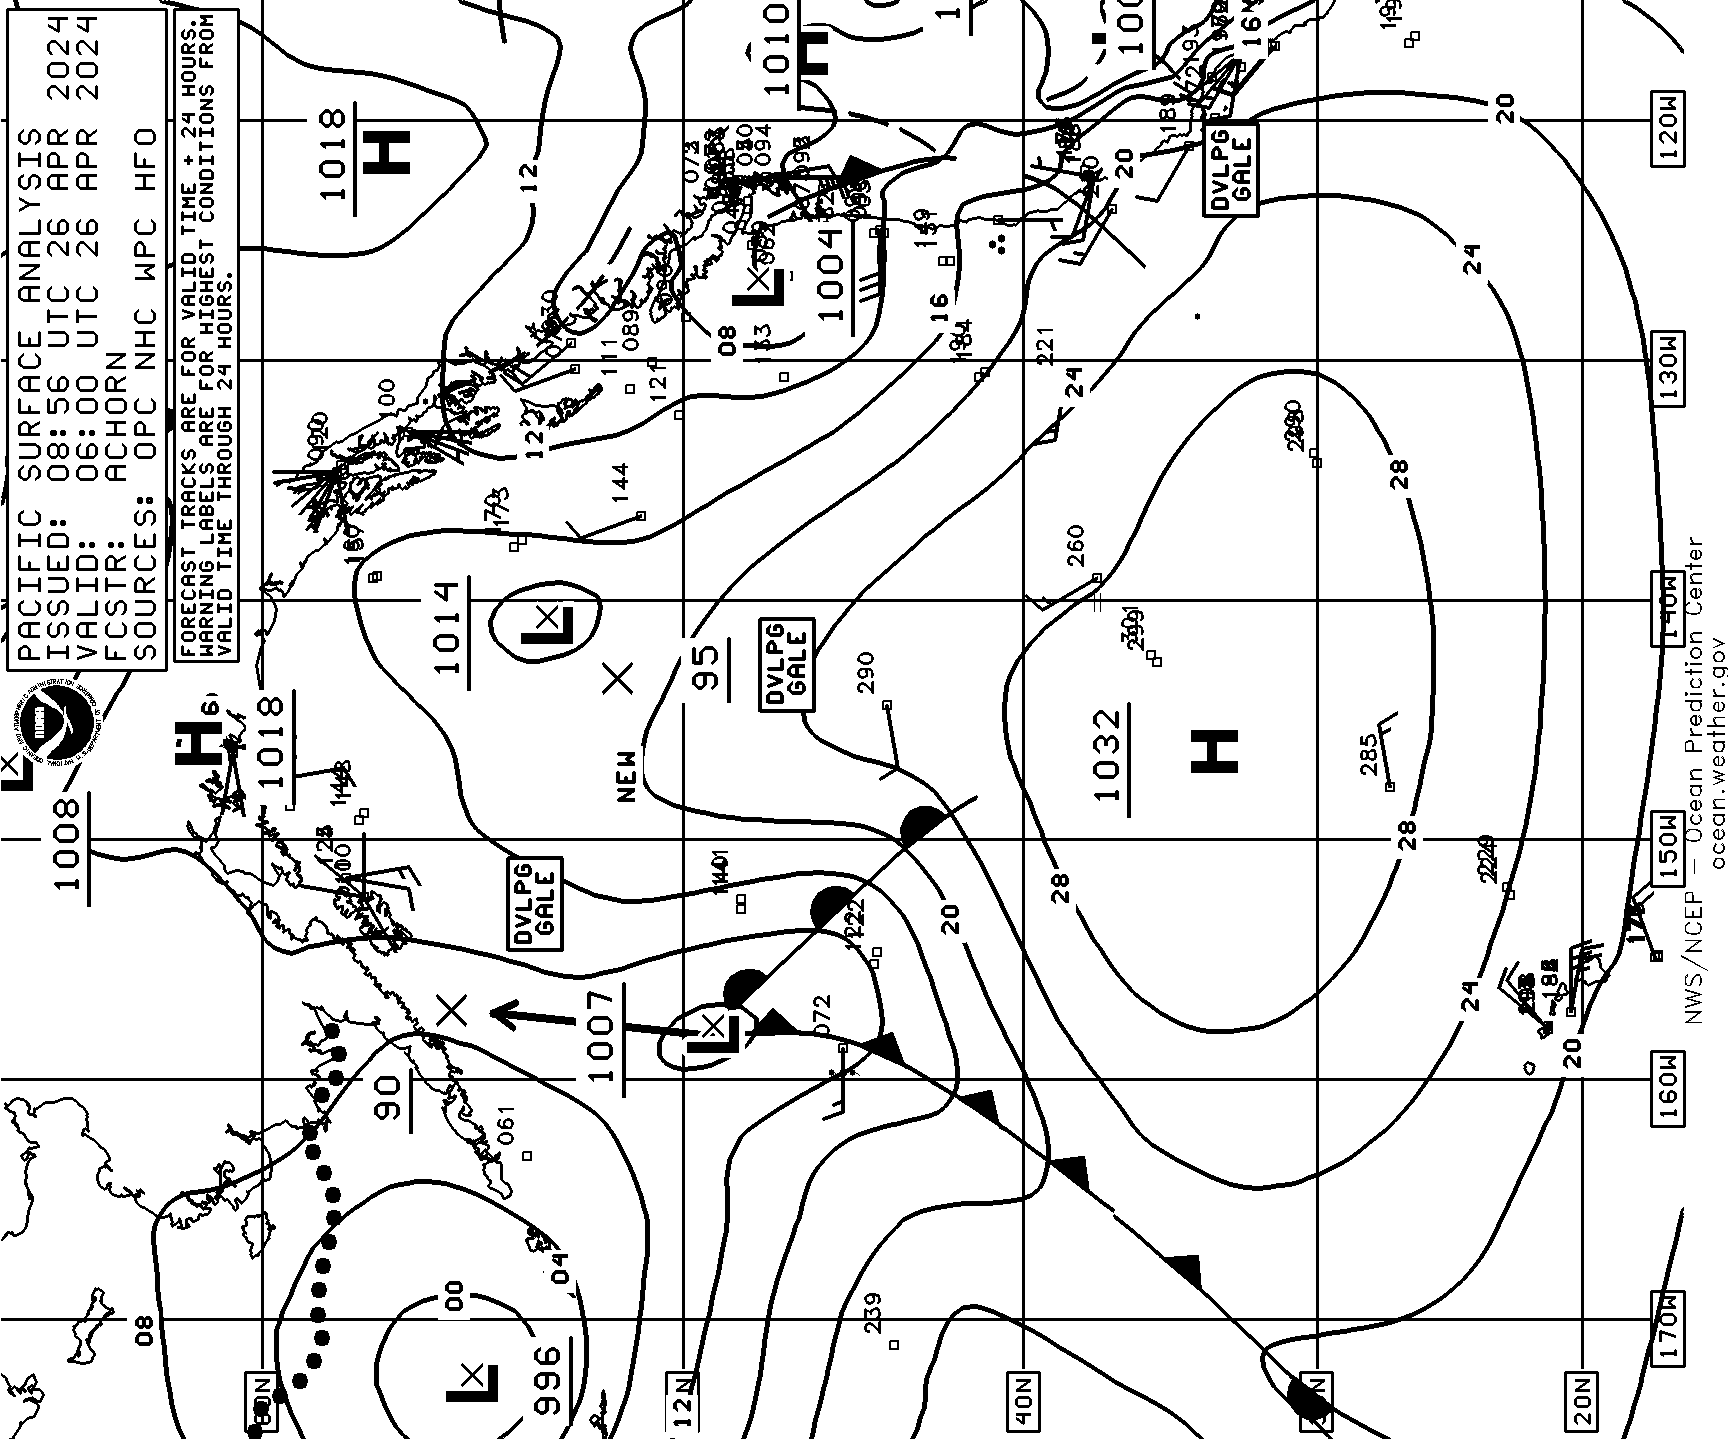
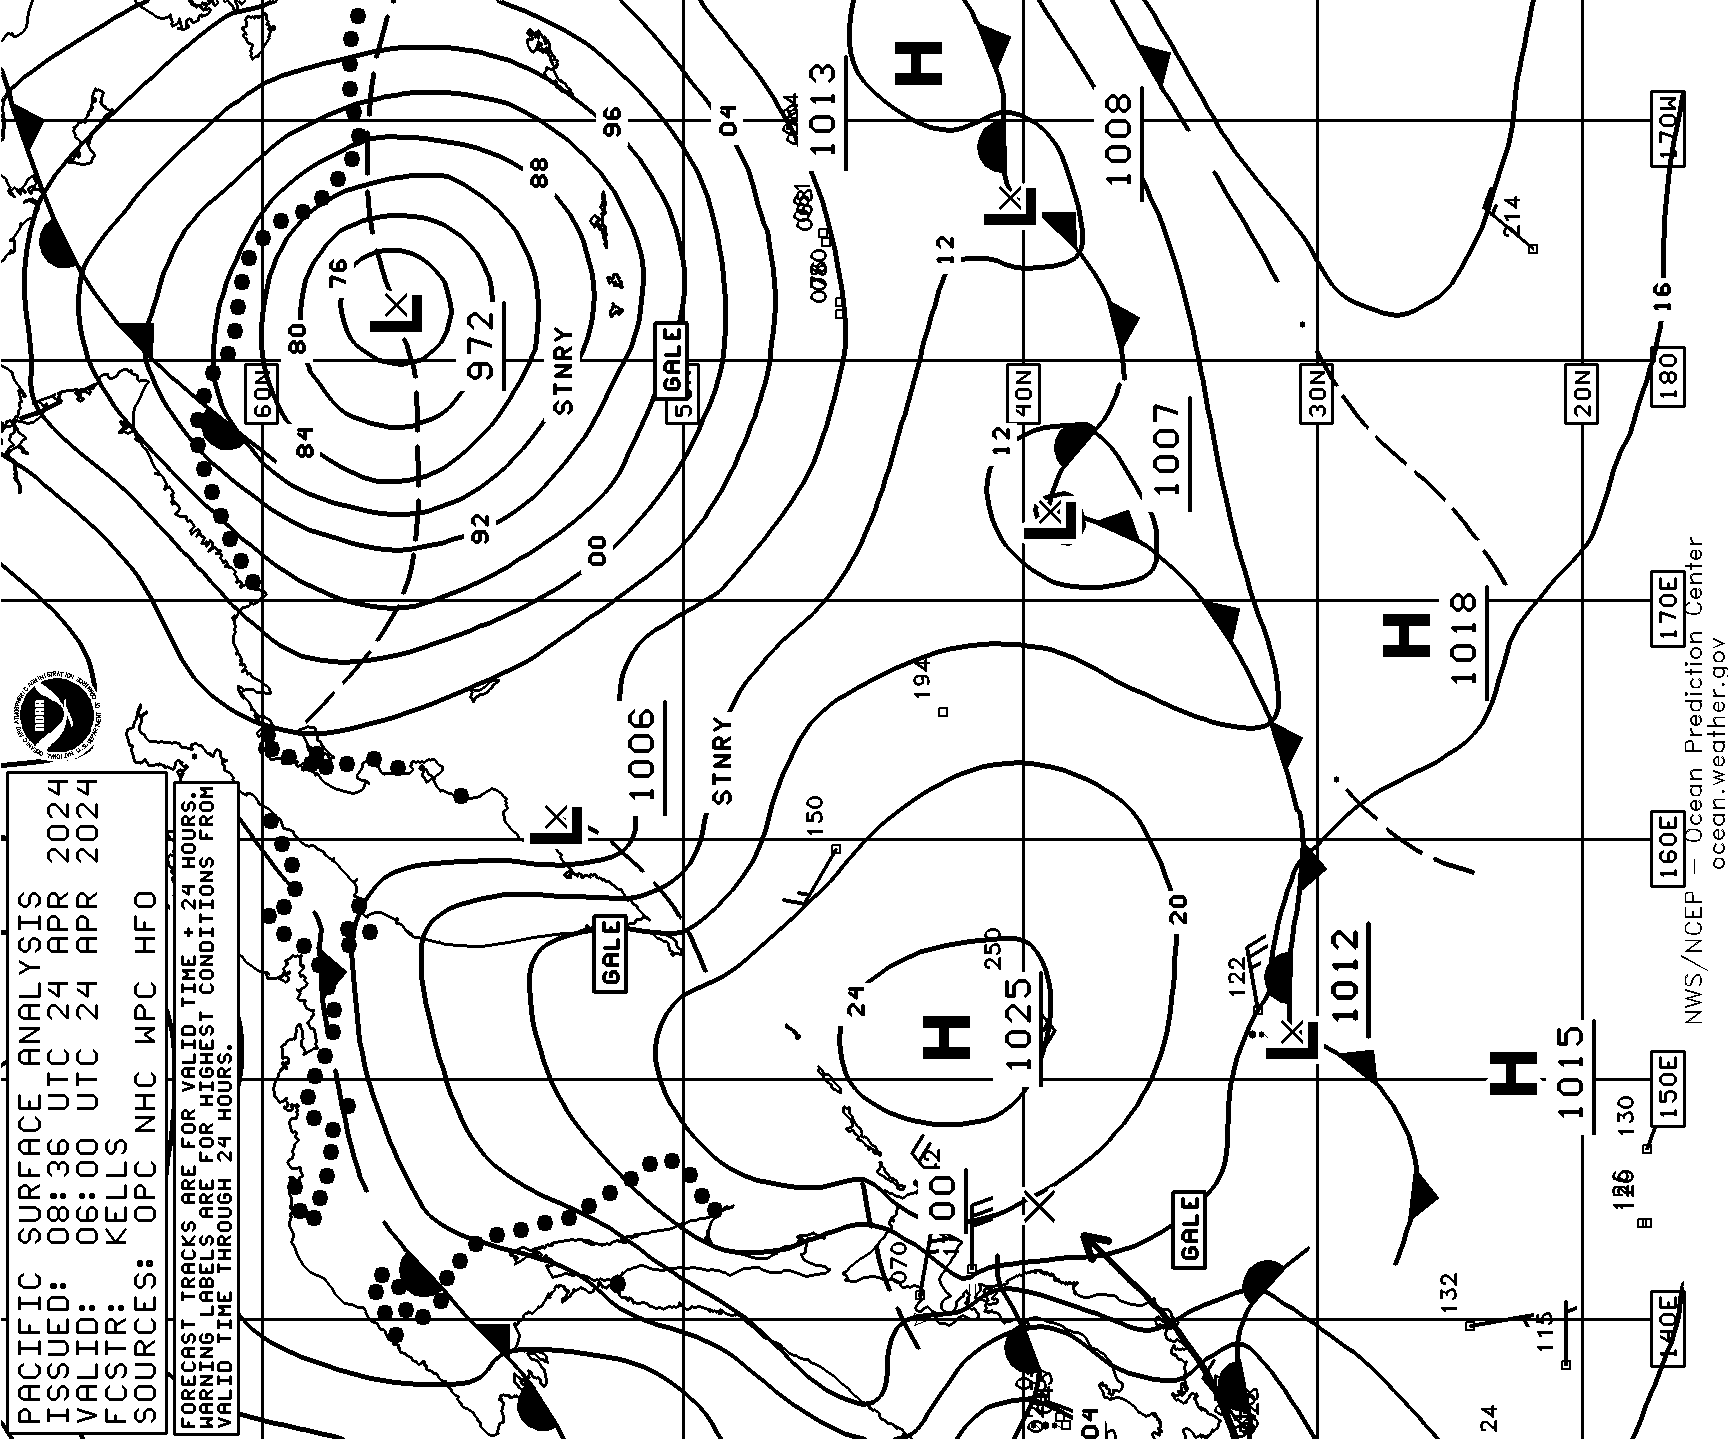
| 00Z Sfc Analysis NE Pacific (Part 1) 20N-70N 115W-175W | |
 |
 |
| 00Z Sfc Analysis NW Pacific (Part 2) 20N-70N 175W-135E | |
 |
 |
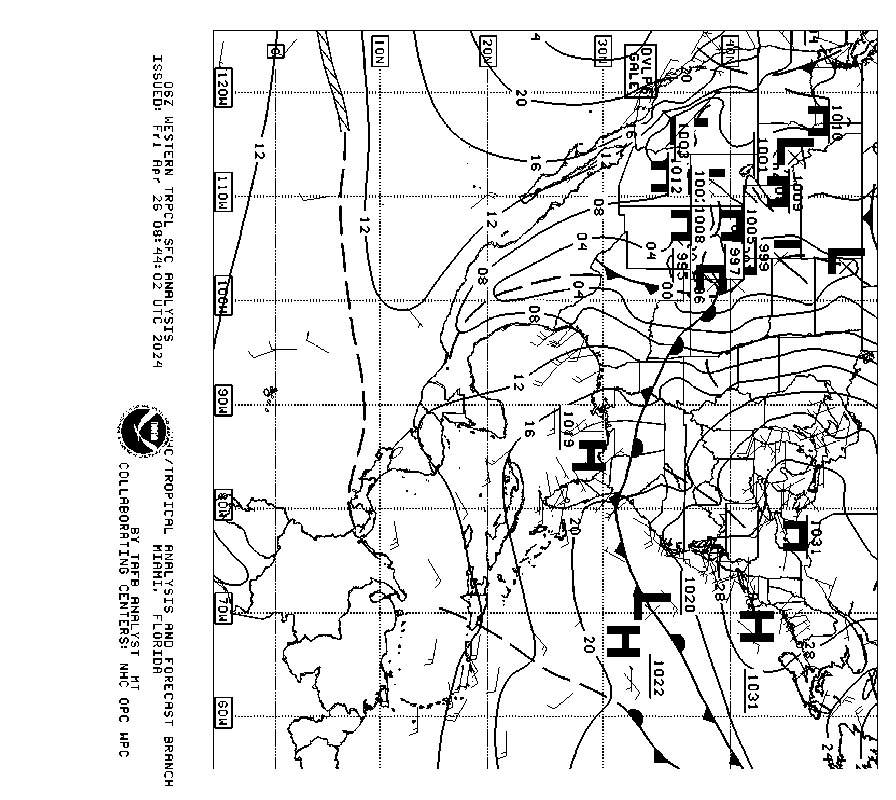
| 06Z Sfc Analysis NE Pacific (Part 1) 20N-70N 115W-175W | |
 |
 |
| 06Z Sfc Analysis NW Pacific (Part 2) 20N-70N 175W-135E | |
 |
 |
| 12Z Sfc Analysis NE Pacific (Part 1) 20N-70N 115W-175W | |
 |
 |
| 12Z Sfc Analysis NW Pacific (Part 2) 20N-70N 175W-135E | |
 |
 |
| 18Z Sfc Analysis NE Pacific (Part 1) 20N-70N 115W-175W | |
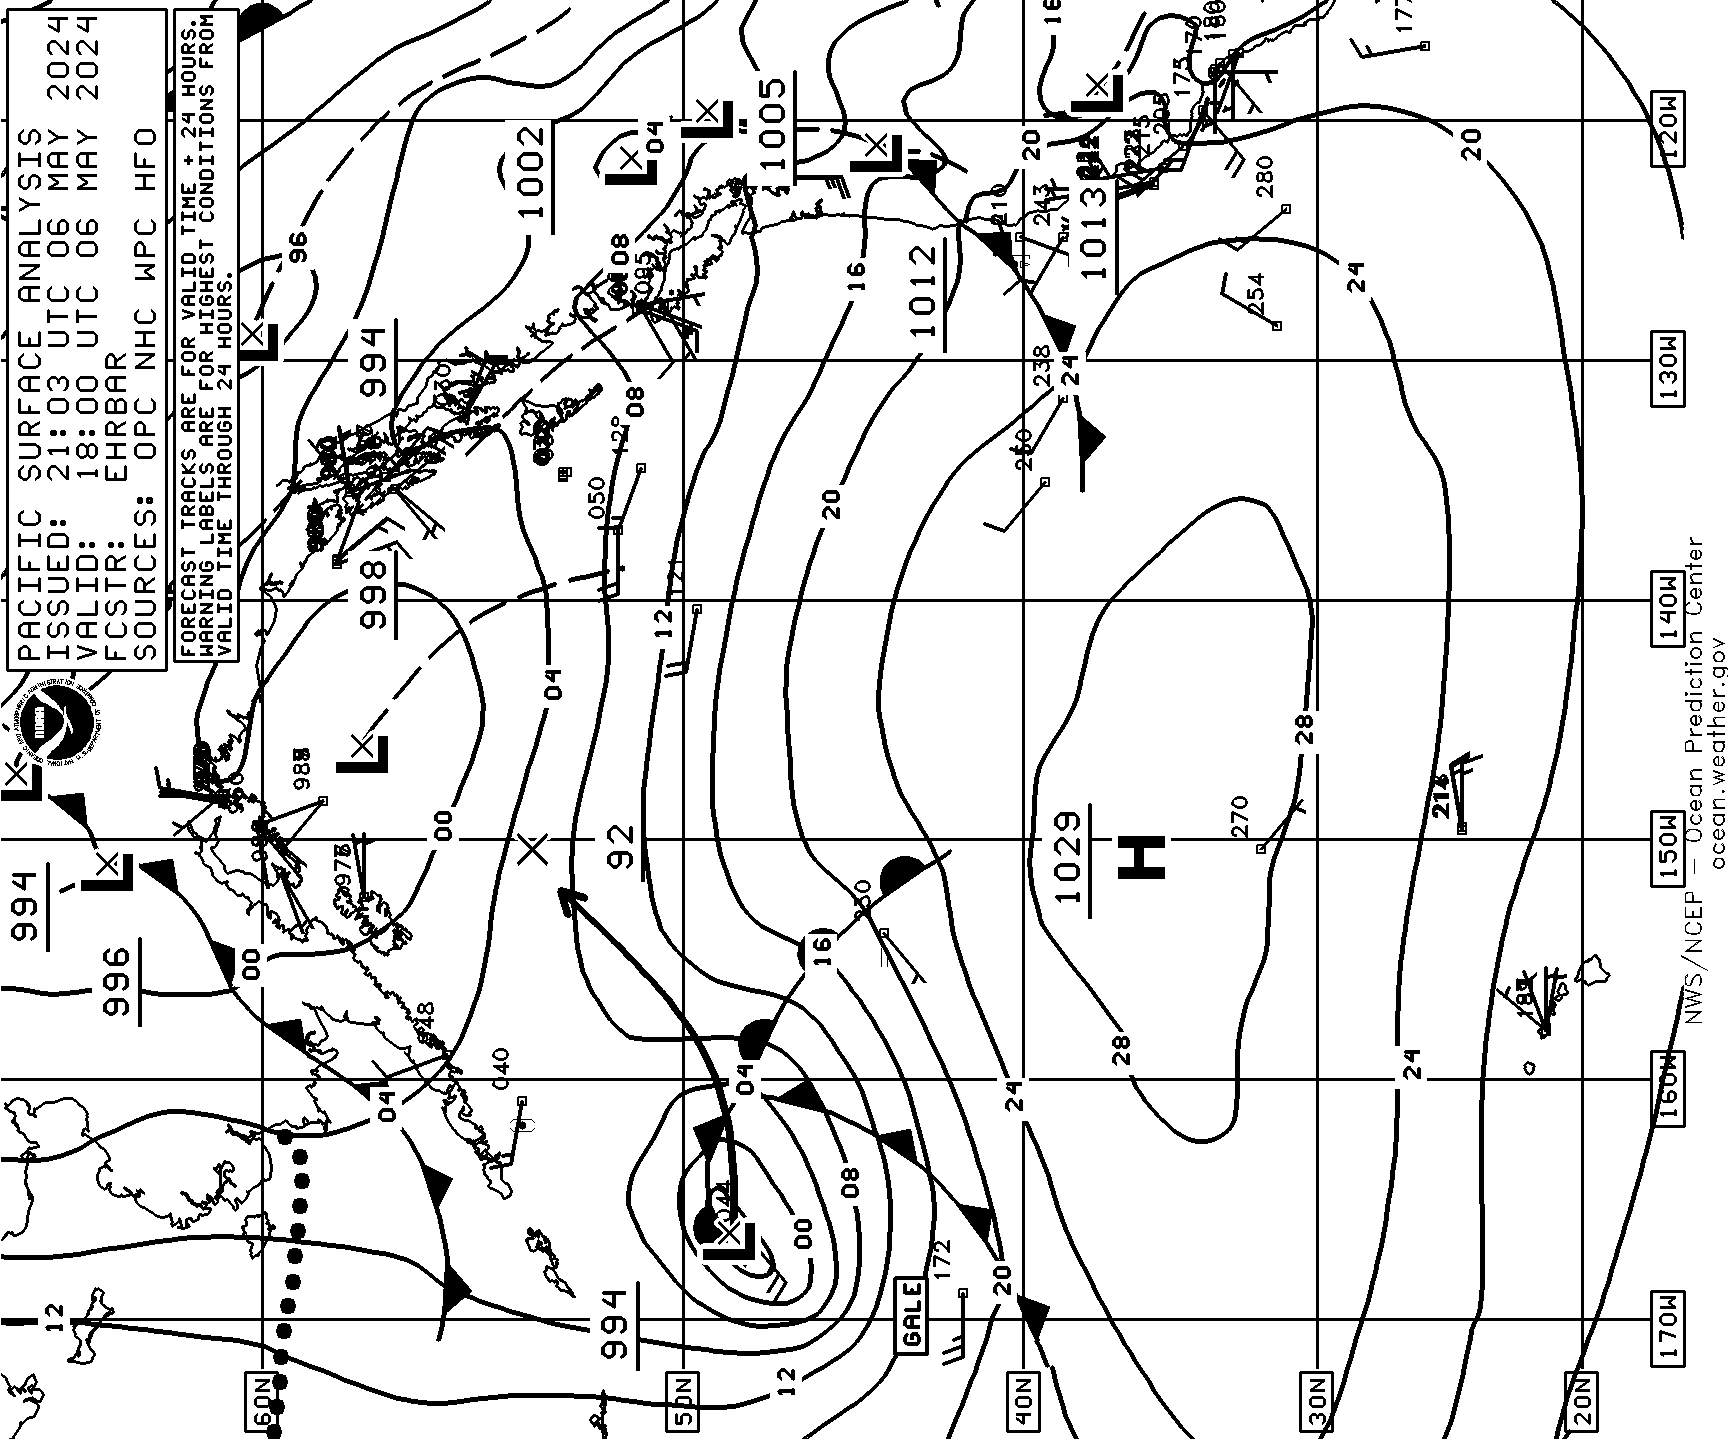 |
 |
| 18Z Sfc Analysis NW Pacific (Part 2) 20N-70N 175W-135E | |
 |
 |
| 24HR Sfc Forecast VT00Z 18N-62N E of 157W* | |
 |
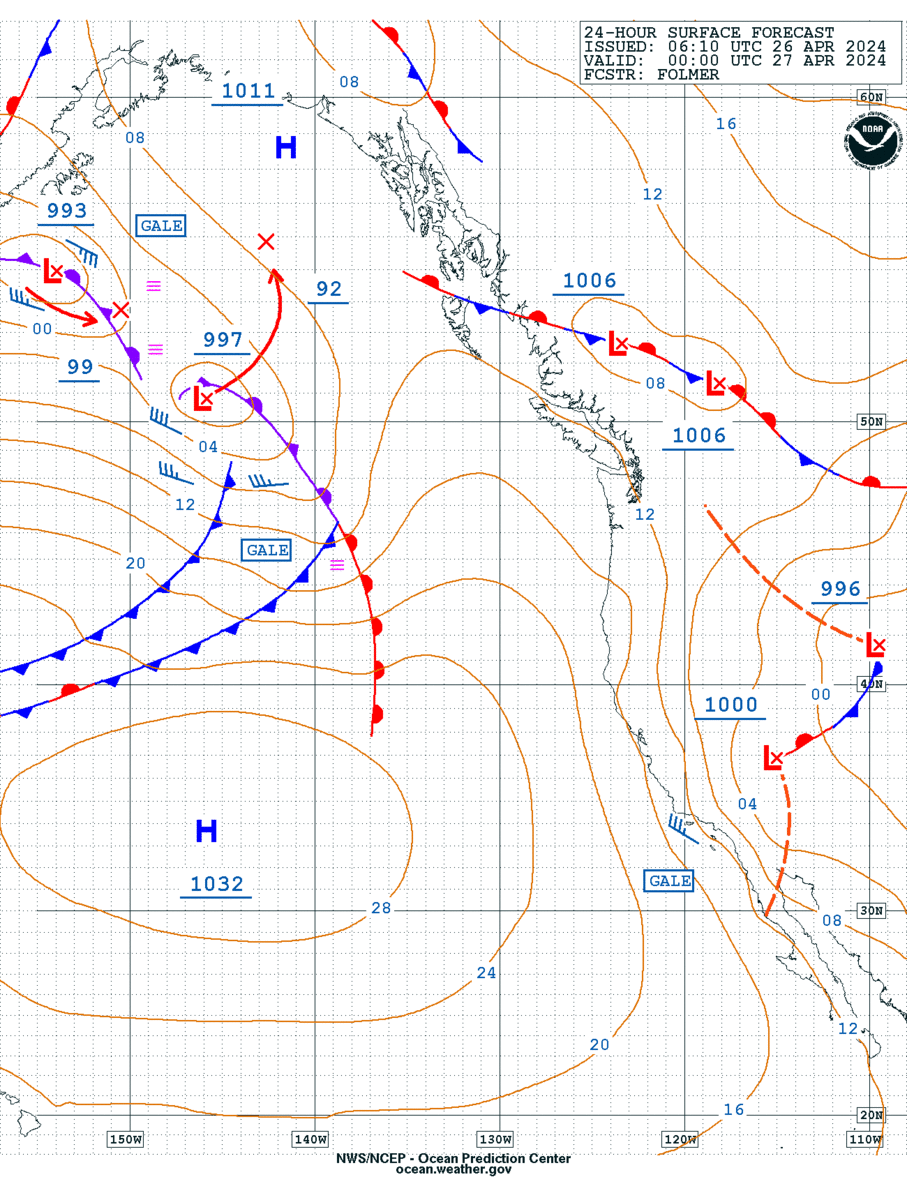 |
| 24HR Sfc Forecast VT12Z 18N-62N E of 157W* | |
 |
 |
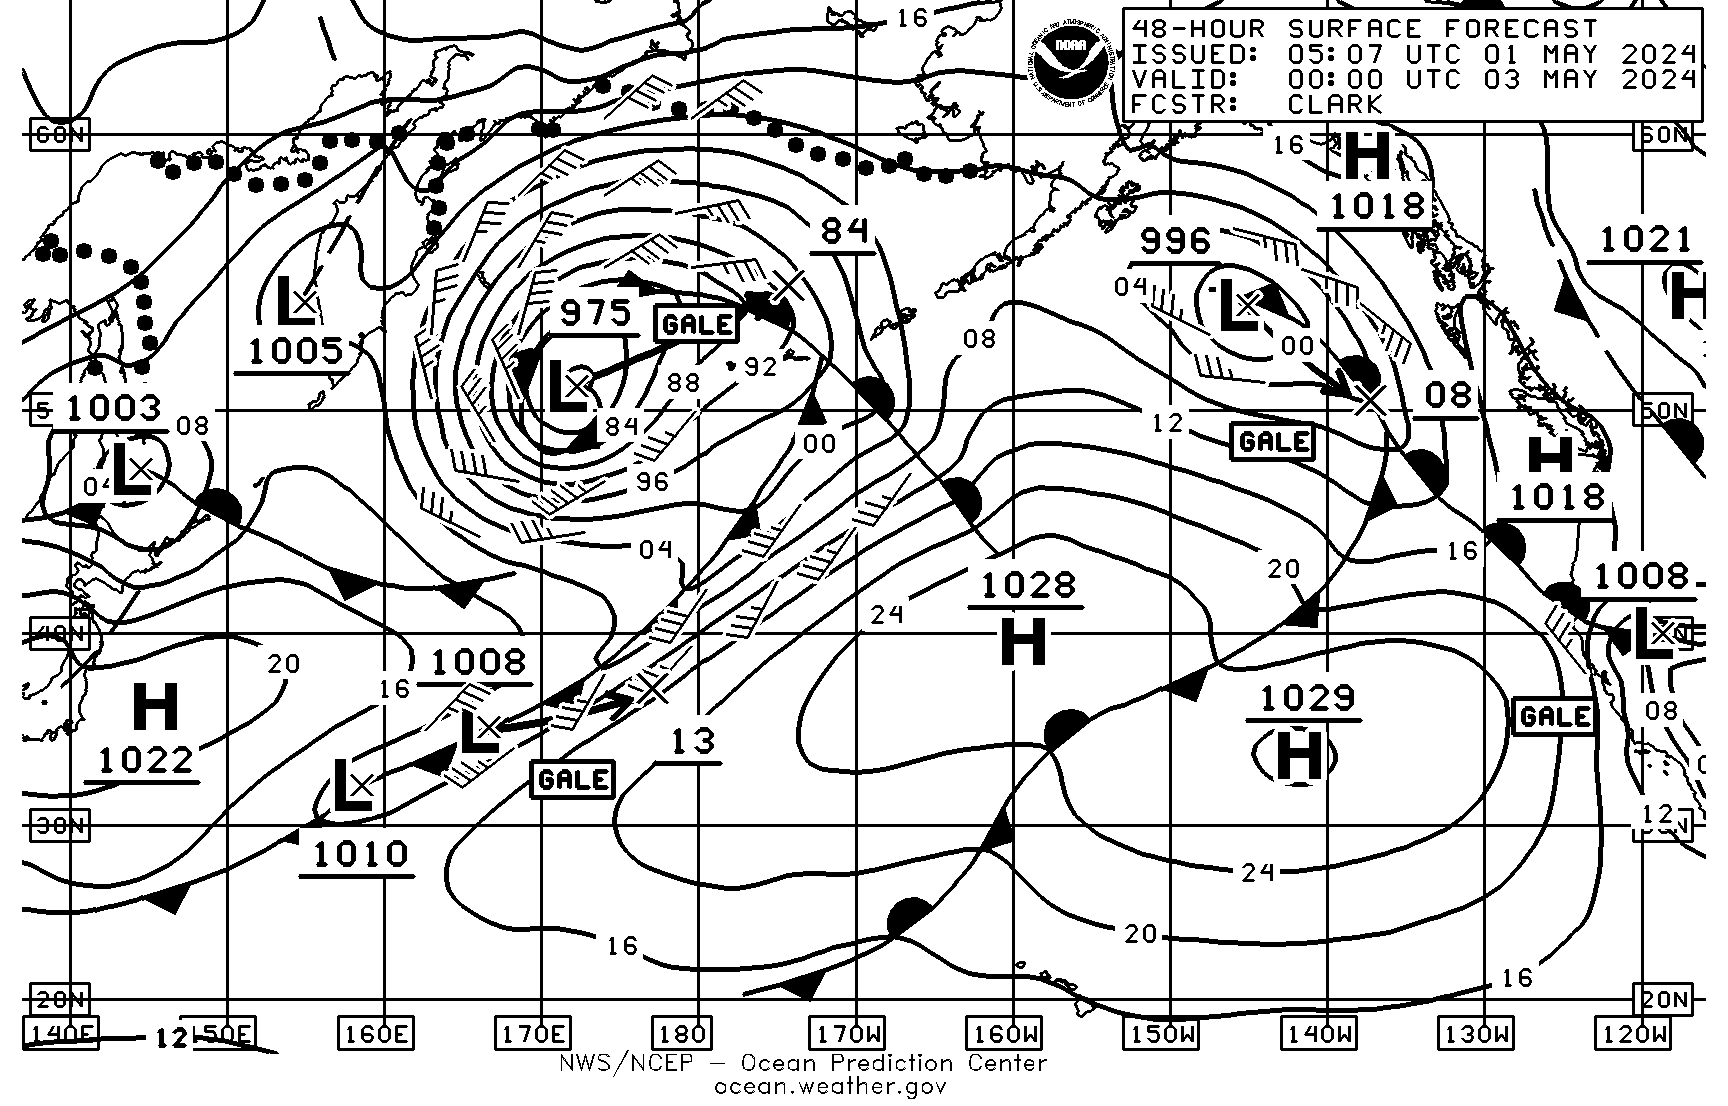
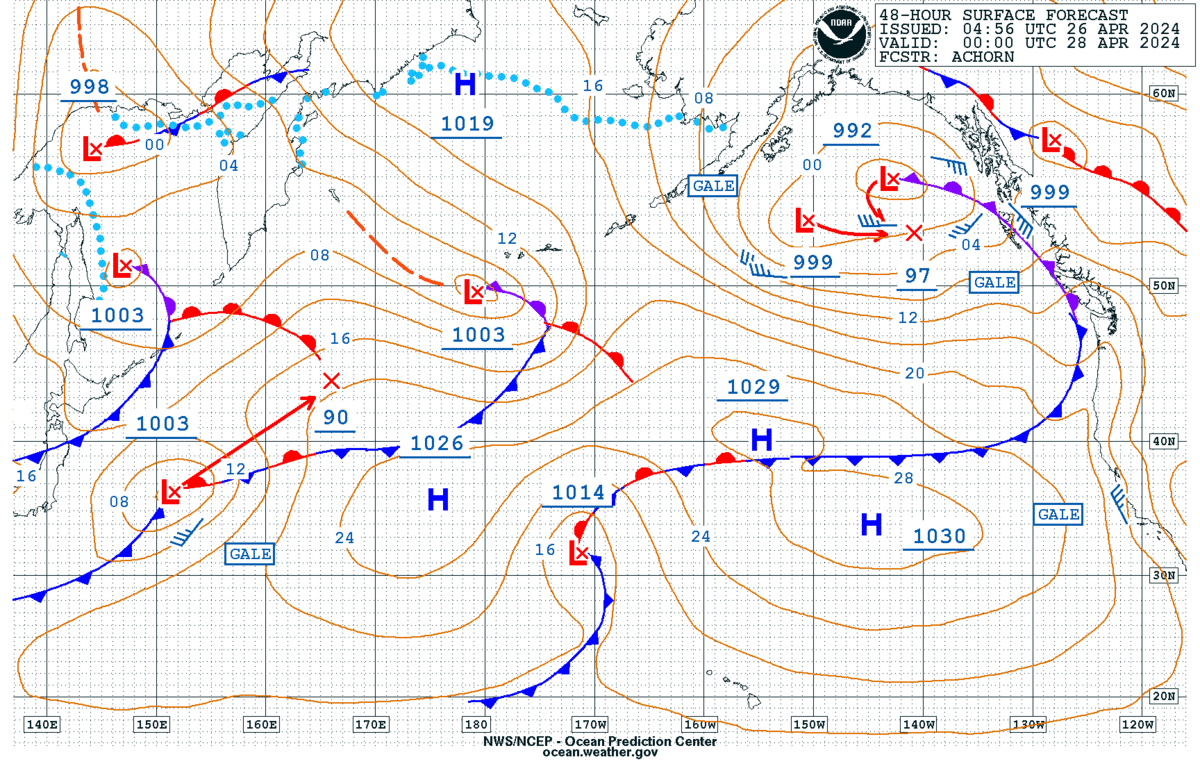
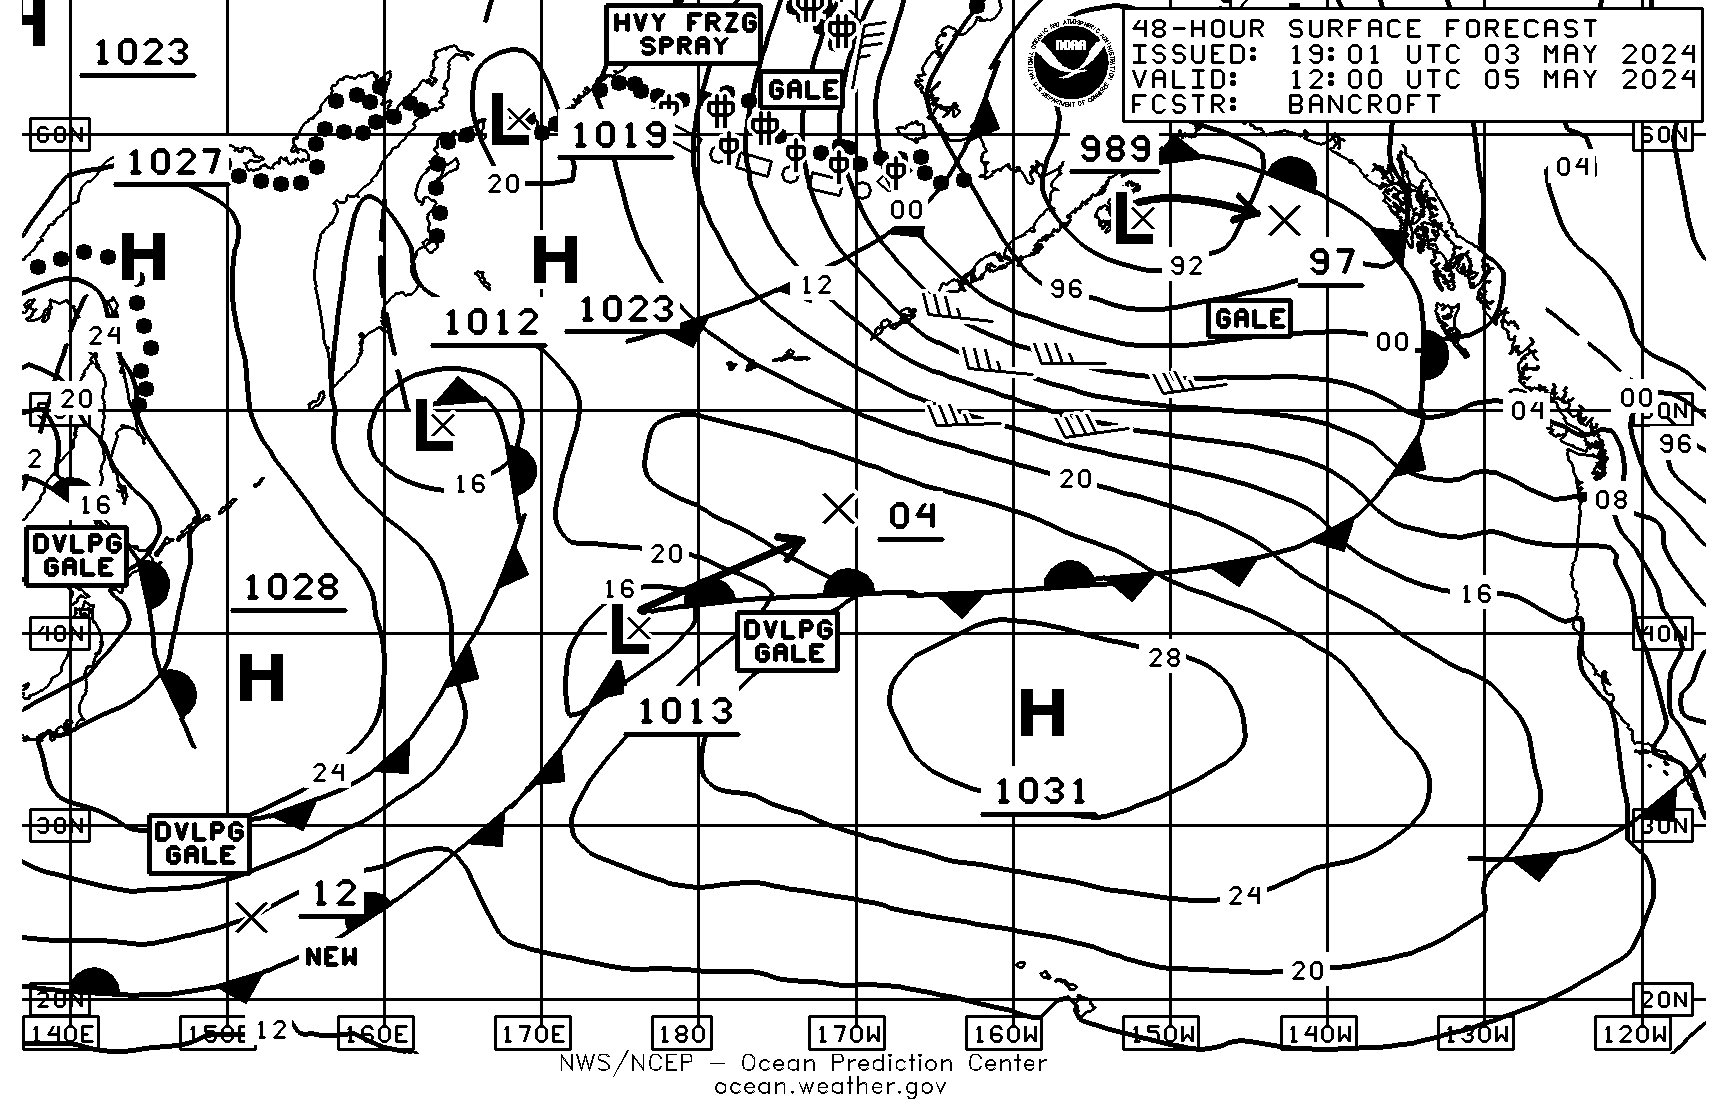
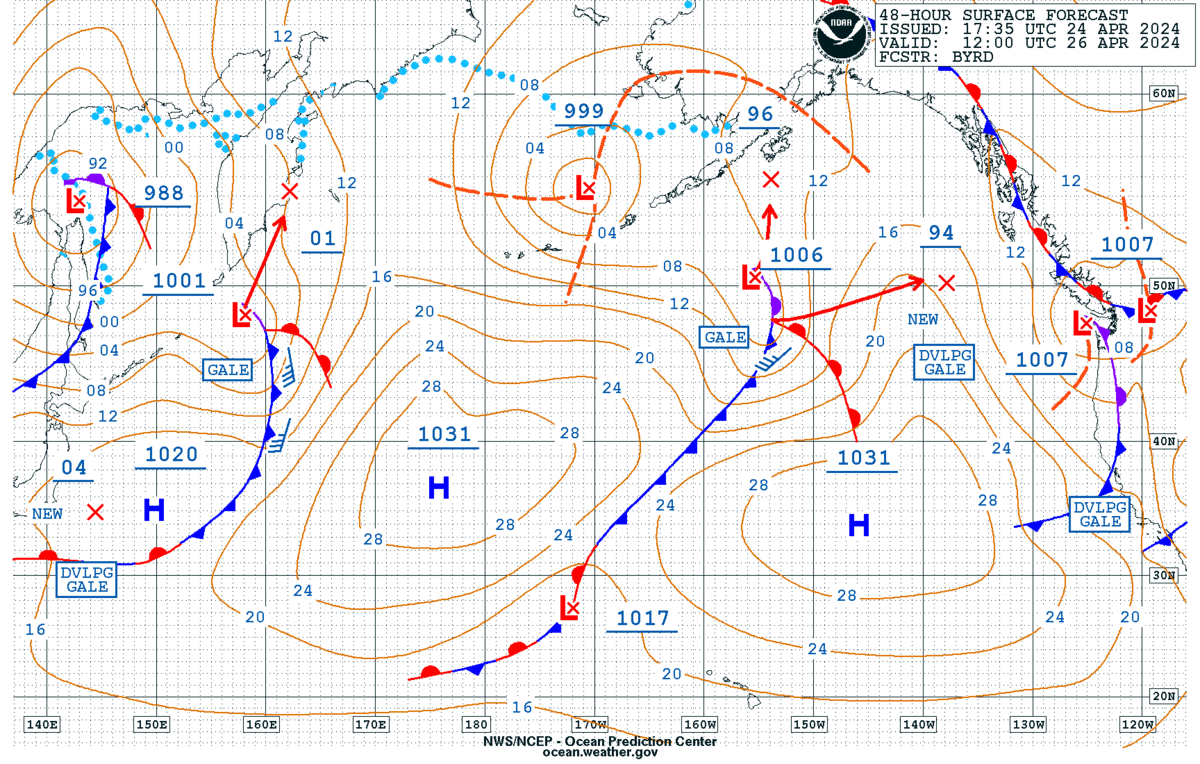
| 48HR Sfc Forecast VT00Z 20N-70N 115W-135E | |
 |
 |
| 48HR Sfc Forecast VT12Z 20N-70N, 115W-135E | |
 |
 |
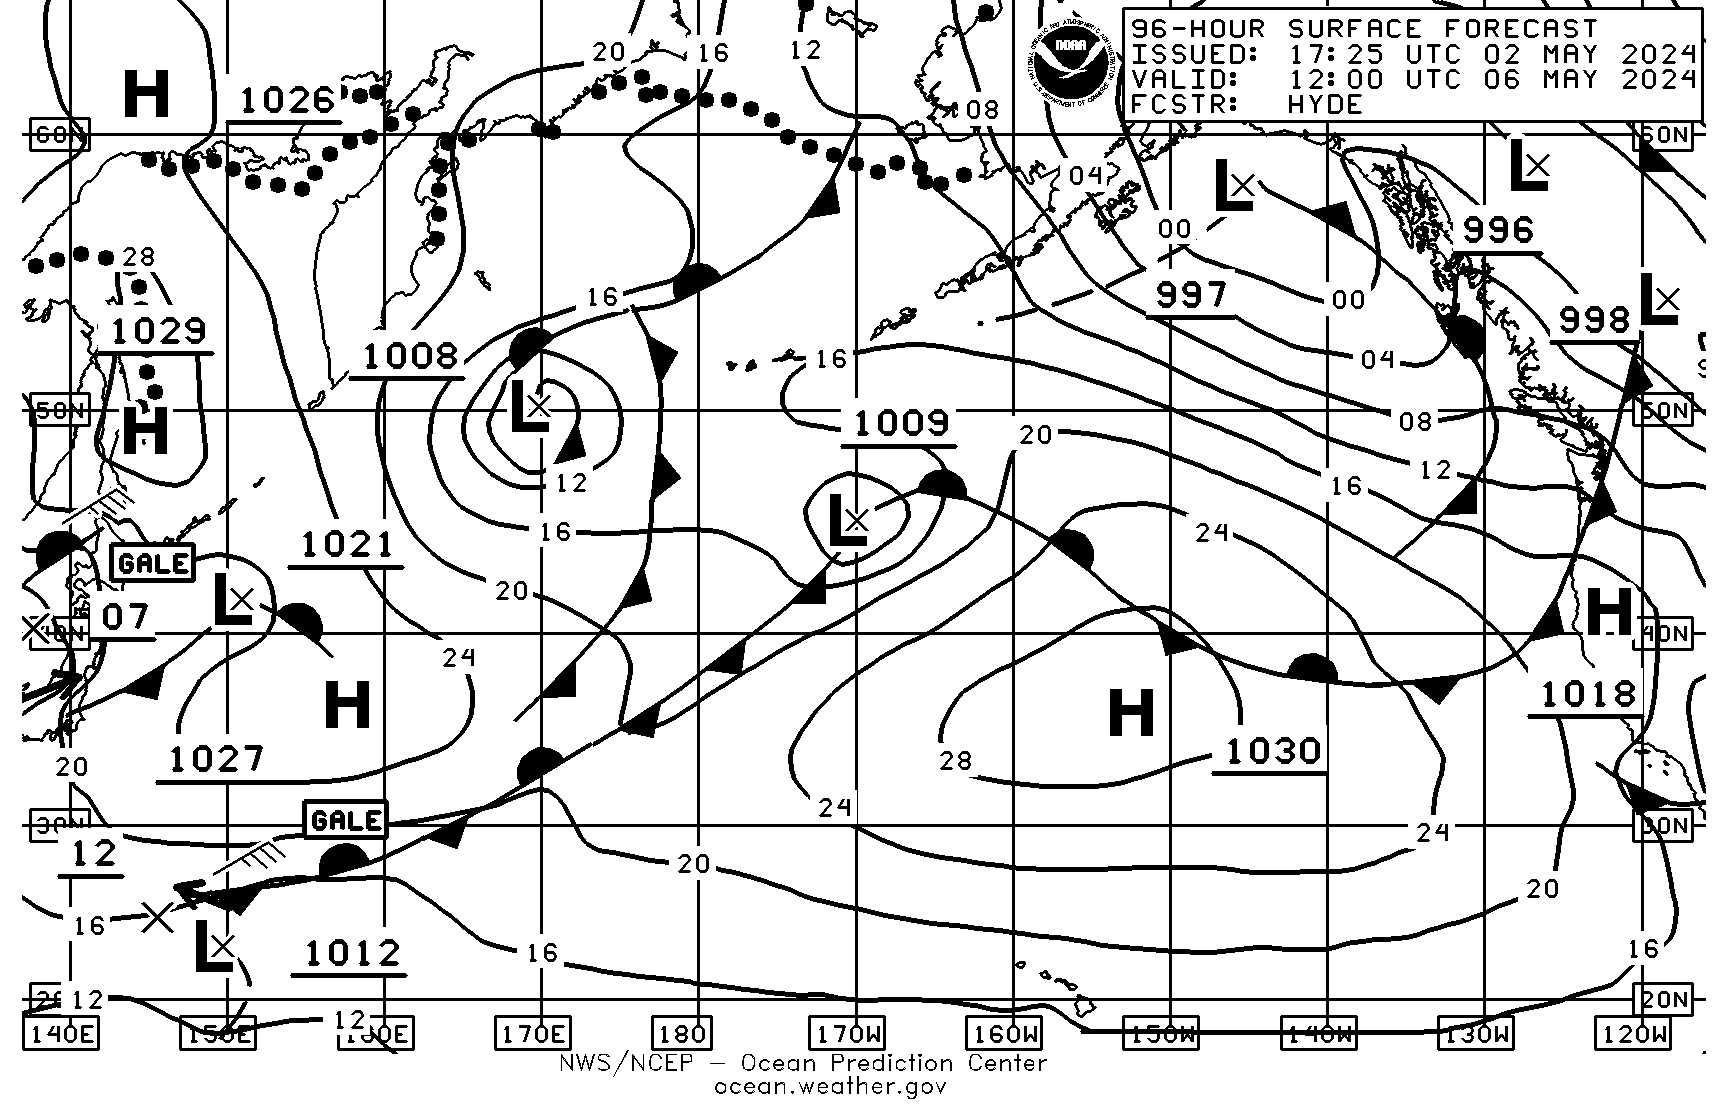
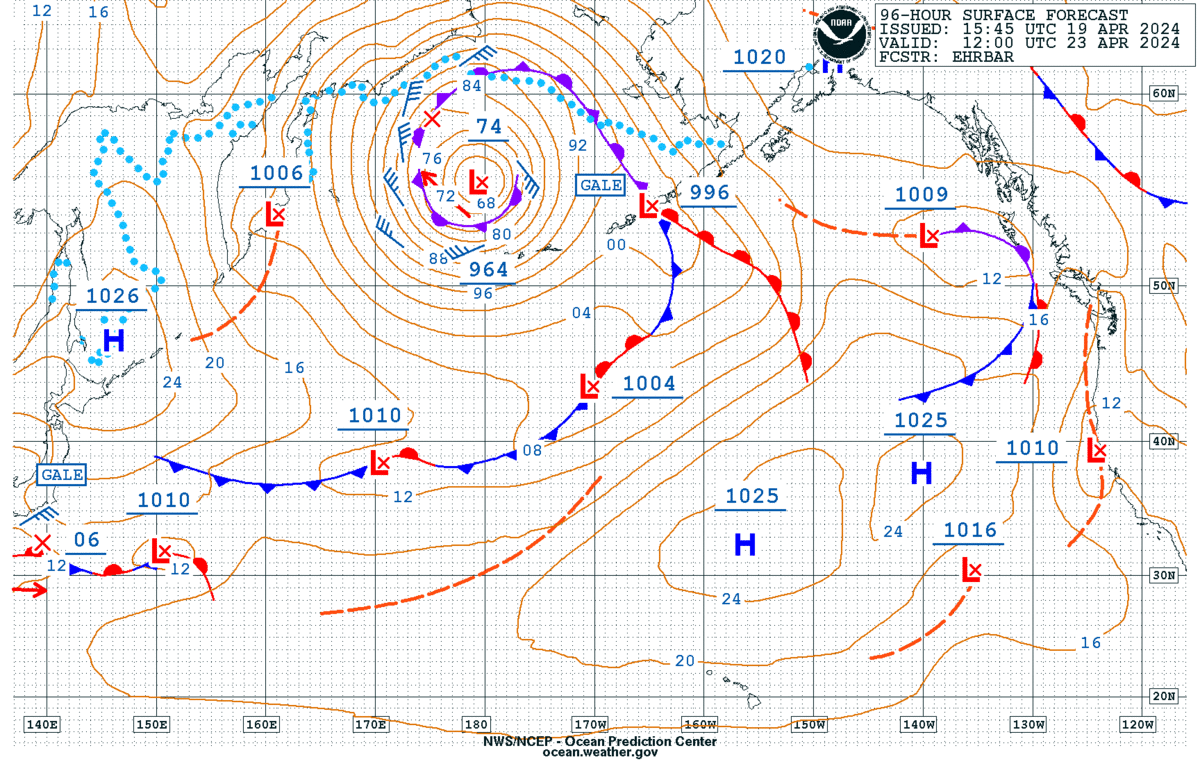
| 96HR Sfc Forecast VT12Z 20N-70N 115W-135E | |
 |
 |
| * Not transmitted via Honolulu radiofax but listed here for convenience | |||
| Upper Air Charts - North Pacific | |||
|---|---|---|---|
| 00Z 500 MB Analysis 20N-70N, 115W-135E* | |
 |
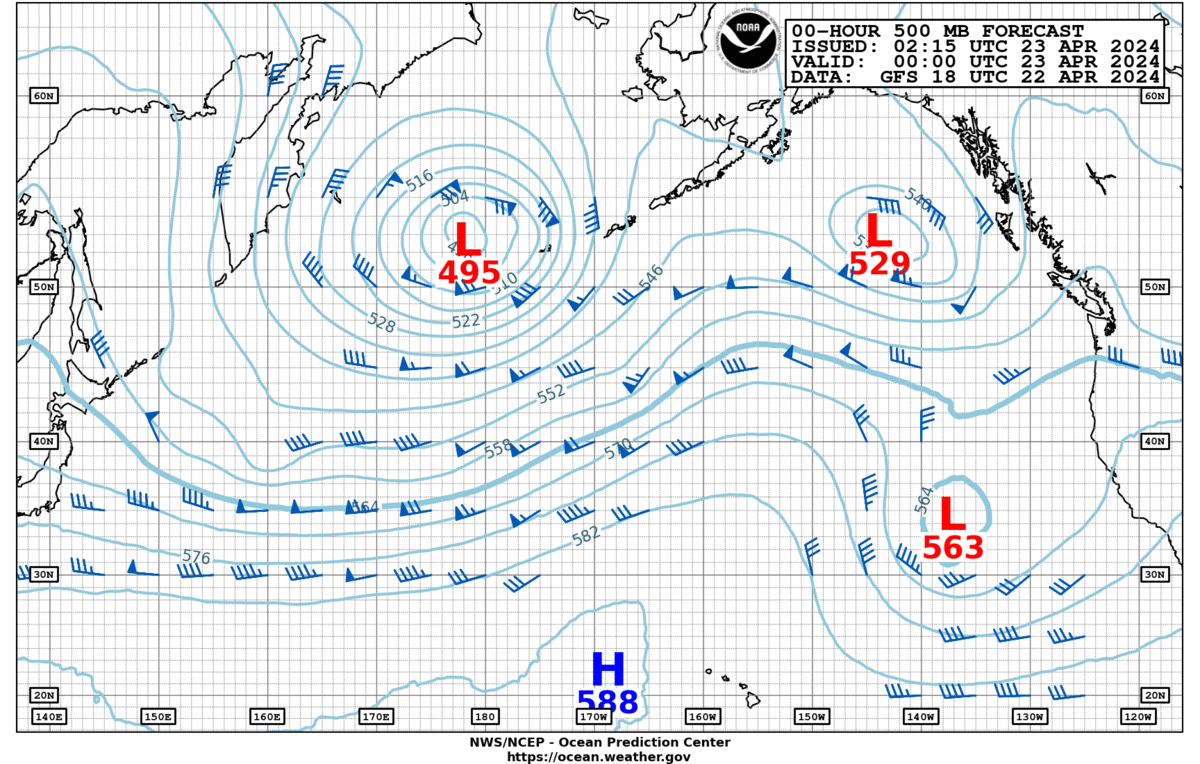 |
| 12Z 500 MB Analysis 20N-70N, 115W-135E* | |
 |
 |
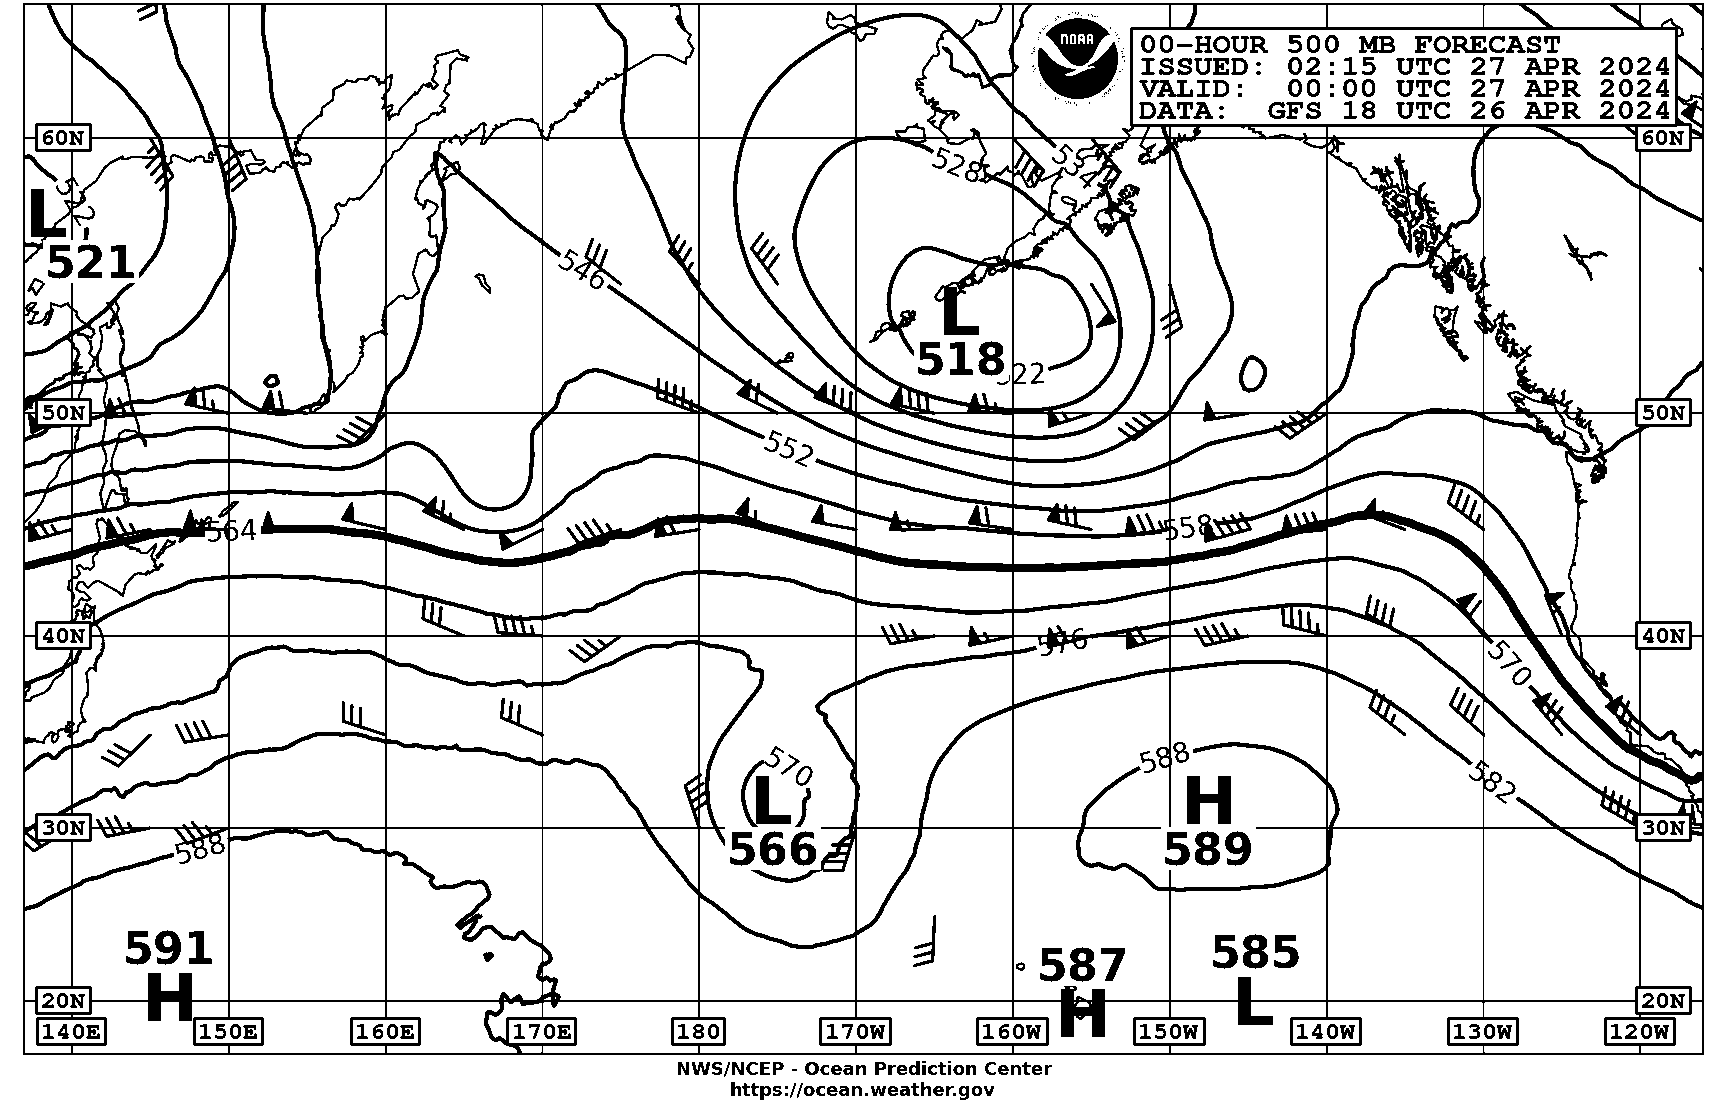
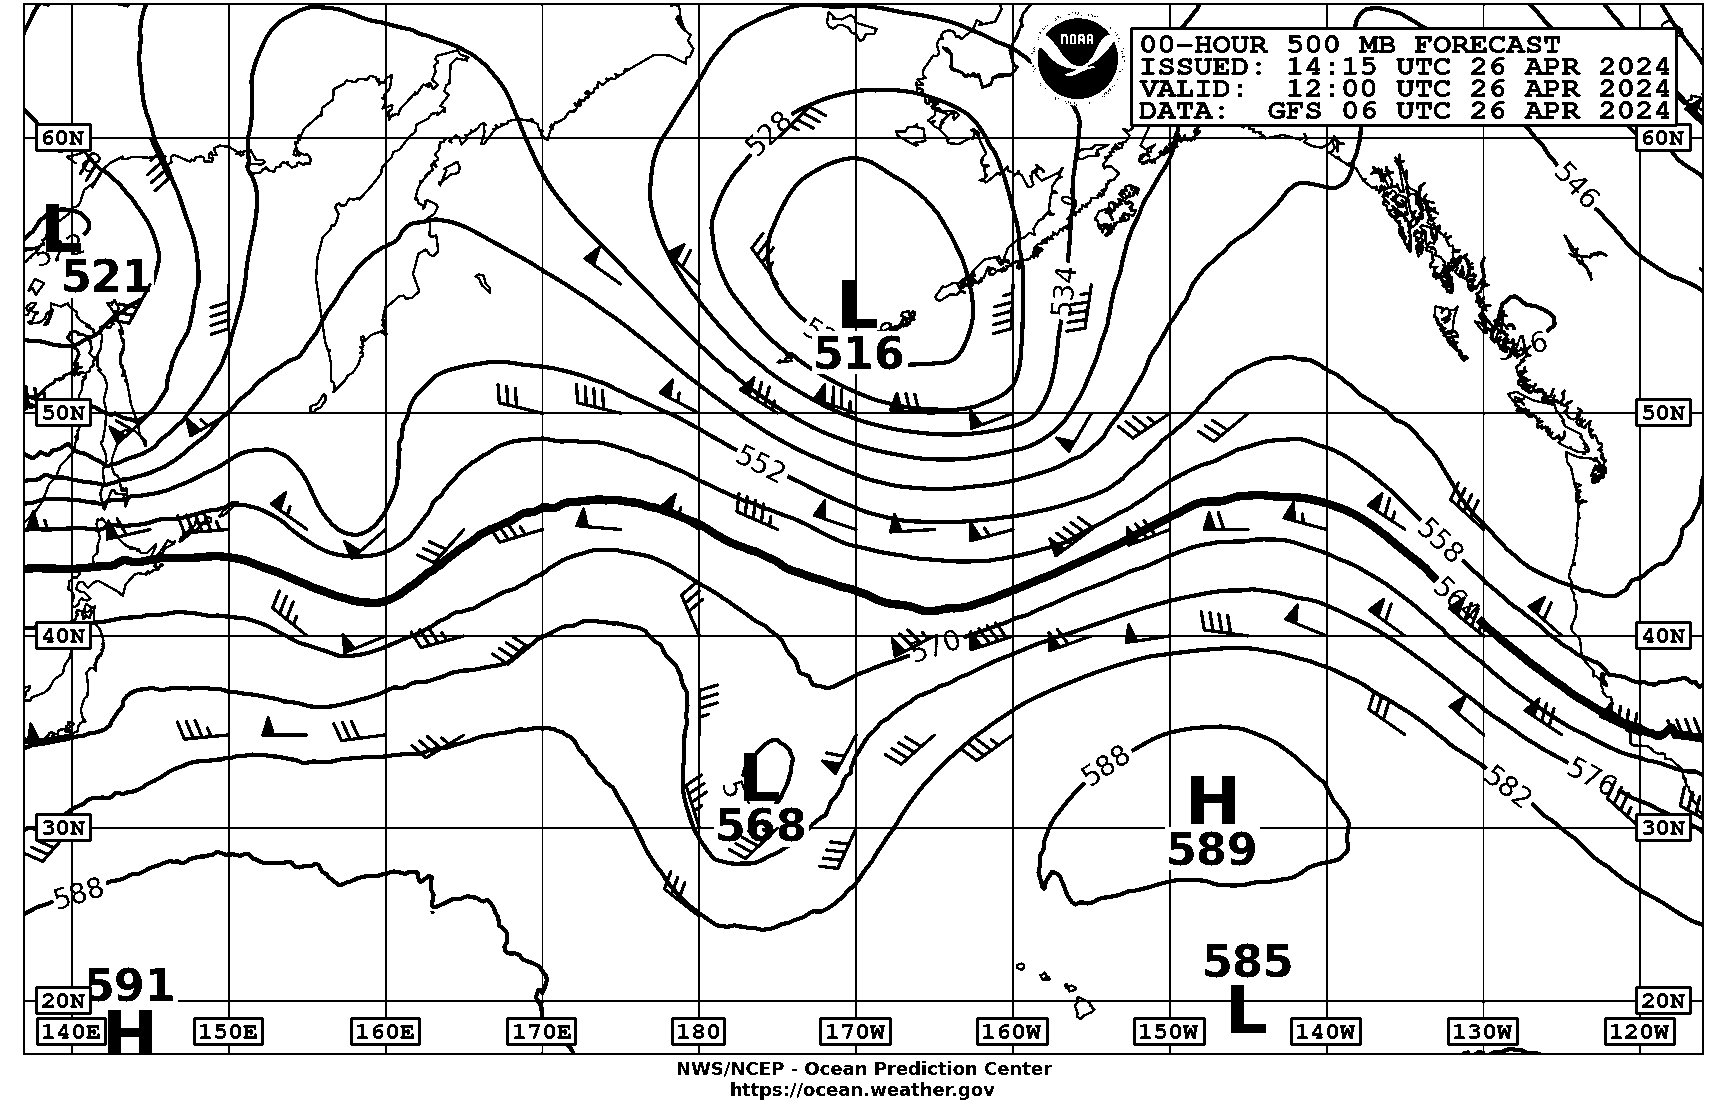
| 24HR 500MB Forecast VT00Z 20N-70N, 115W-135E* | |
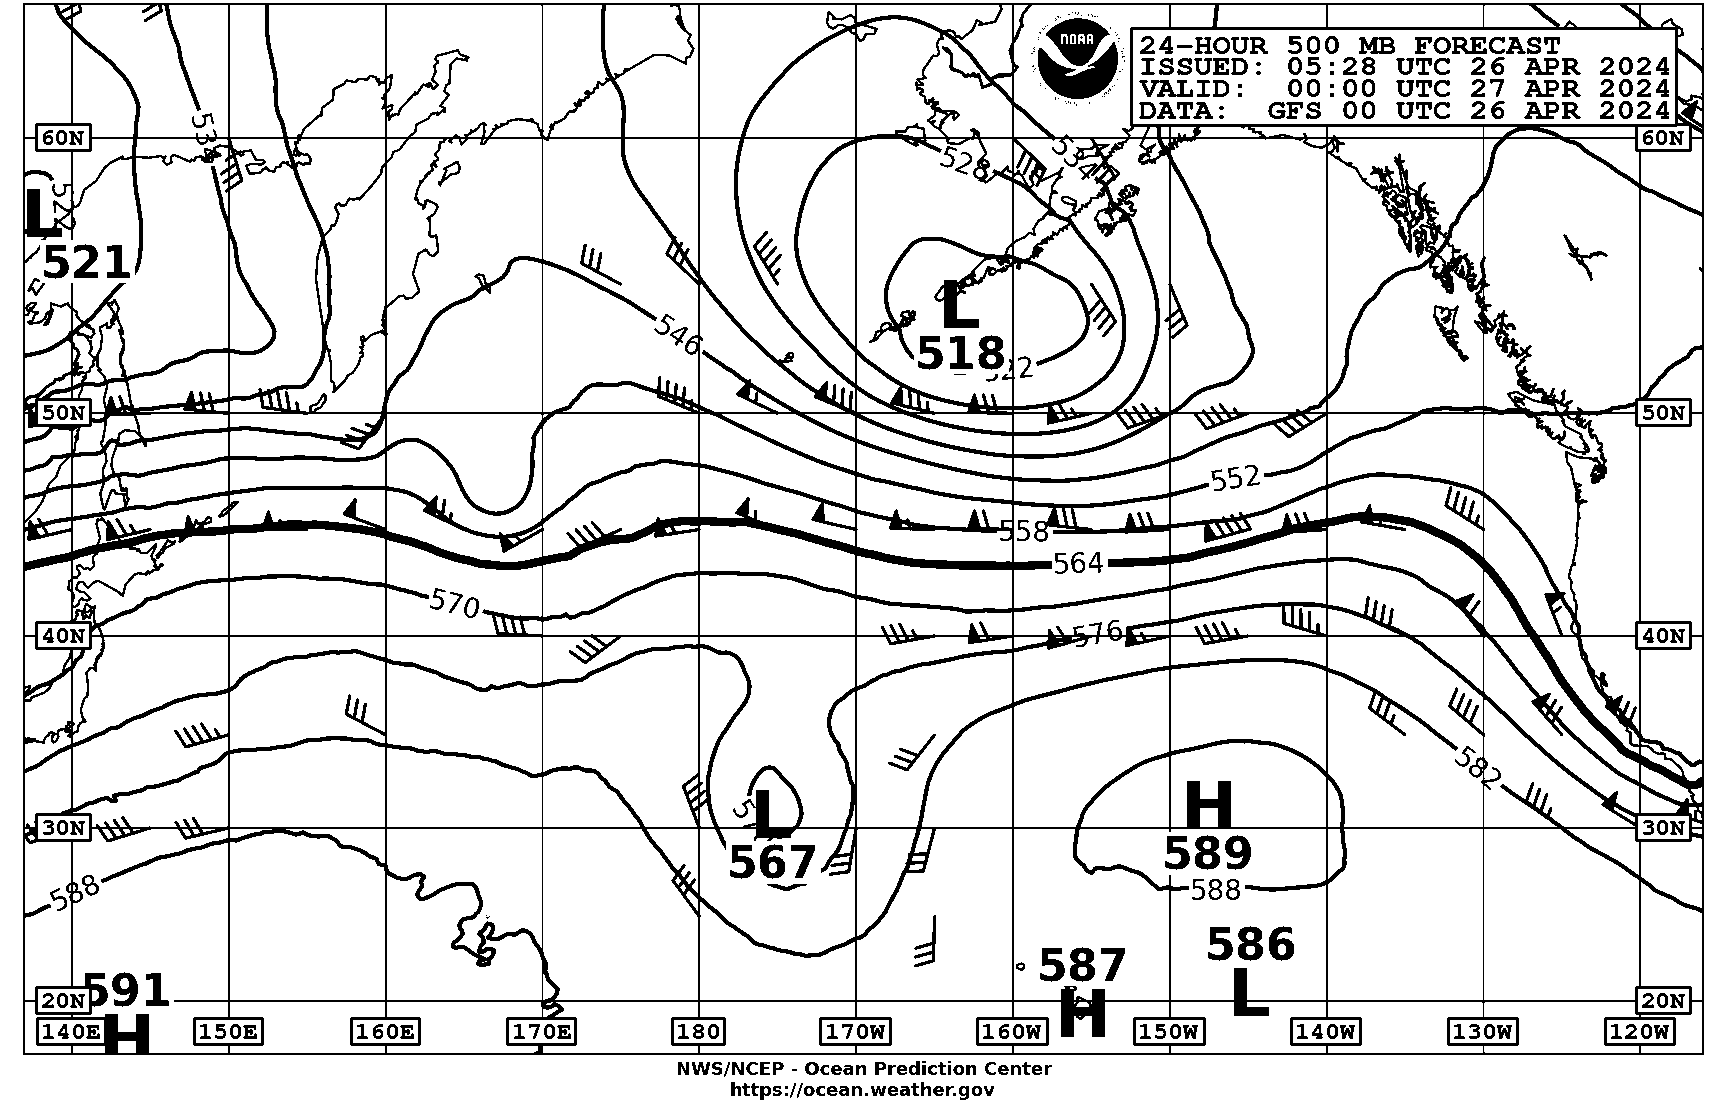 |
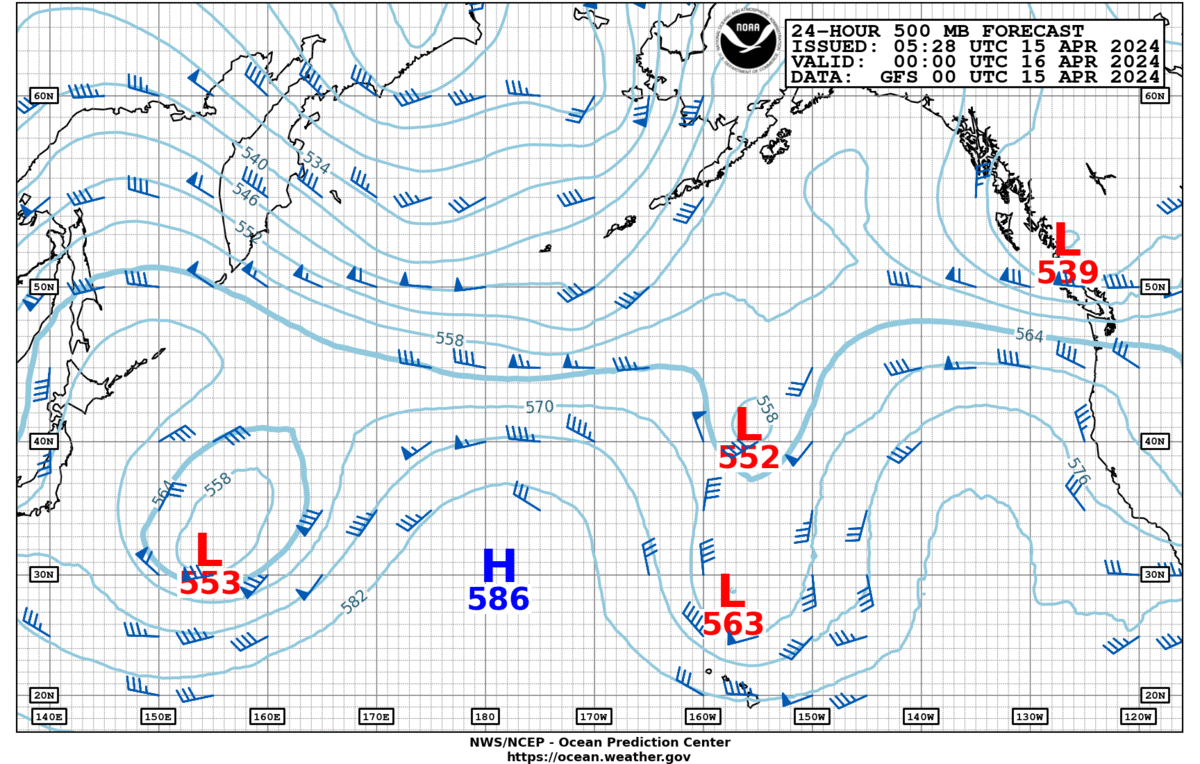 |
| 24HR 500MB Forecast VT12Z 20N-70N, 115W-135E* | |
 |
 |
| 48HR 500MB Forecast VT00Z 20N-70N, 115W-135E* | |
 |
 |
| 48HR 500MB Forecast VT12Z 20N-70N, 115W-135E* | |
 |
 |
| 96HR 500MB Forecast VT12Z 20N-70N, 115W-135E* | |
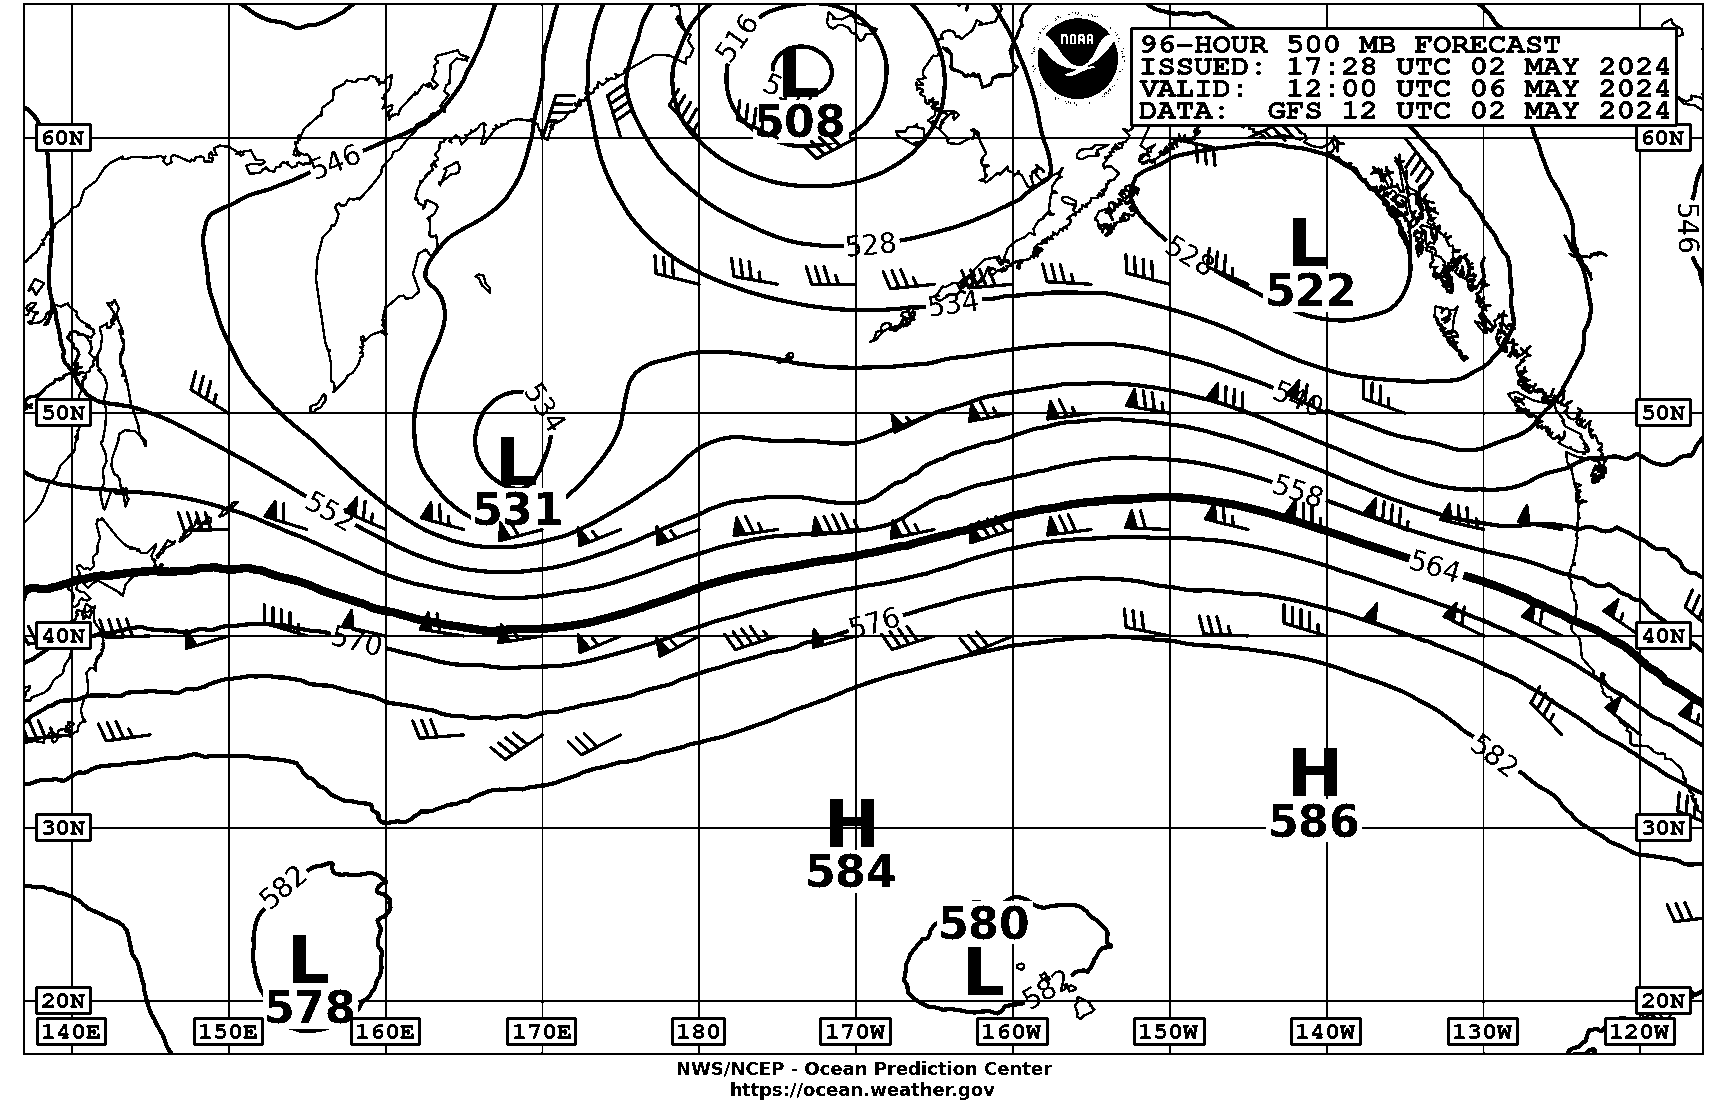 |
 |
| * Not transmitted via Honolulu radiofax but listed here for convenience | |||
| Tropical Cyclone Danger Area Charts - Pacific | ||
|---|---|---|
| Tropical Cyclone Danger Area VT03Z 0N-40N 80W-170E | |
 |
| Tropical Cyclone Danger Area VT09Z 0N-40N 80W-170E | |
 |
| Tropical Cyclone Danger Area VT15Z 0N-40N 80W-170E | |
 |
| Tropical Cyclone Danger Area VT21Z 0N-40N 80W-170E | |
 |
| Sea Surface Temperatures | |||
|---|---|---|---|
| Pacific Sea Surface Temp (VT Tue & Thu) 55N-EQ 110W-160E | |
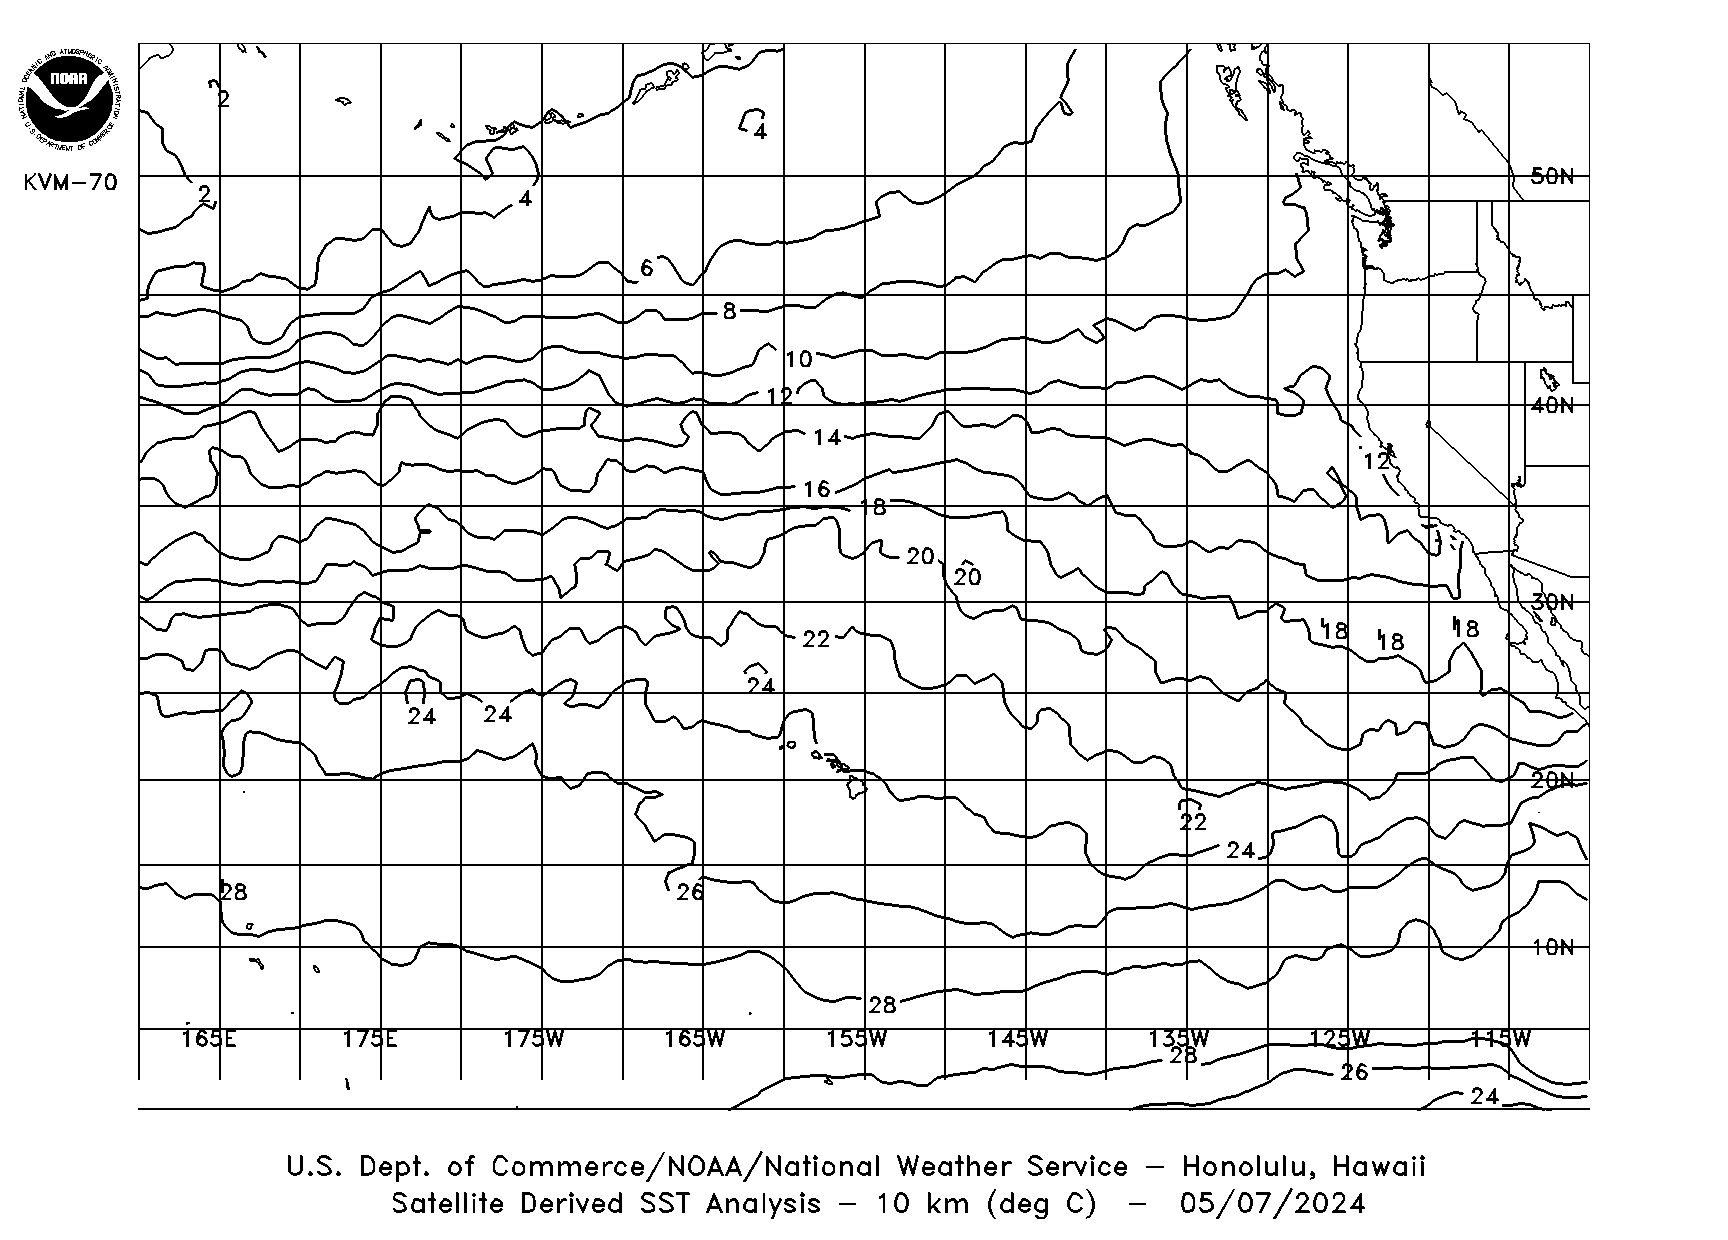 |
 |
| Satellite Imagery (GOES IR) | |
|---|---|
| 00Z Eastern Pacific Satellite Image 05S-55N, 110W-155E | 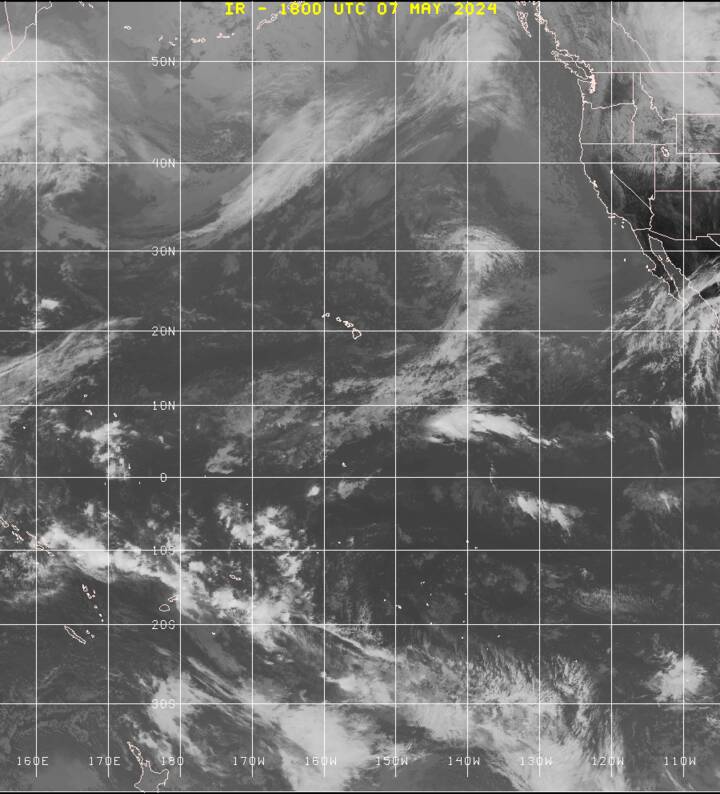 |
| 06Z Eastern Pacific Satellite Image 05S-55N, 110W-155E | 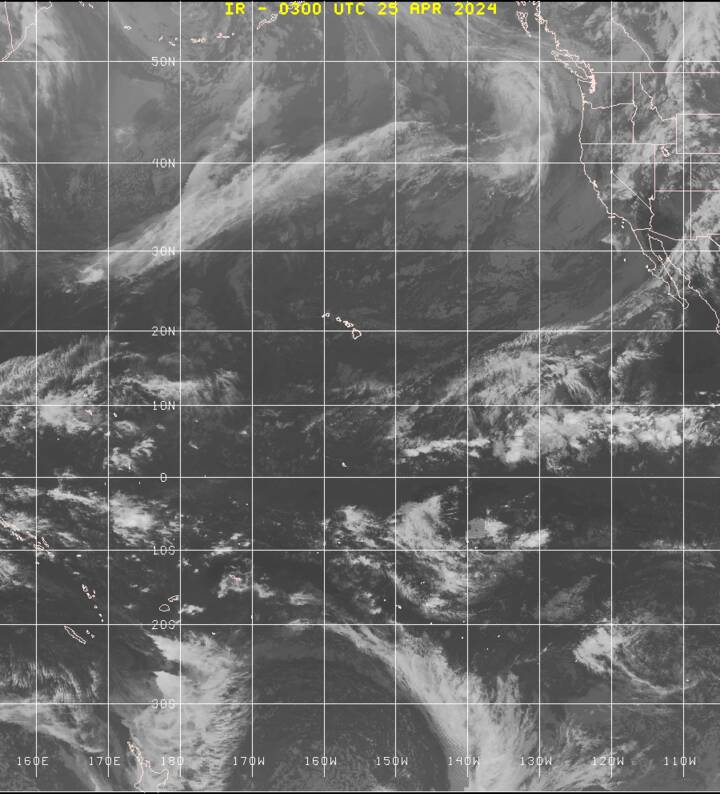 |
| 12Z Eastern Pacific Satellite Image 05S-55N, 110W-155E | 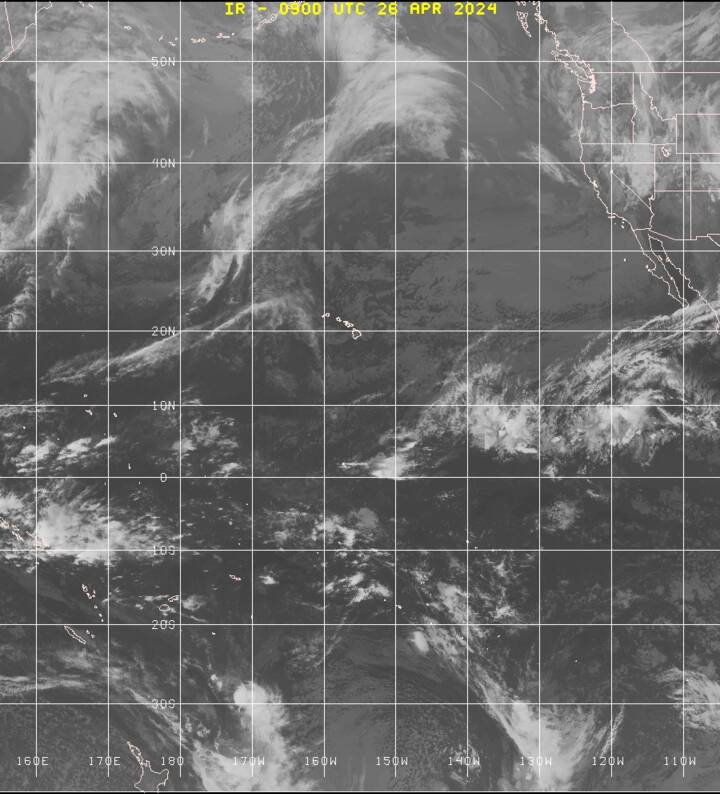 |
| 18Z Eastern Pacific Satellite Image 05S-55N, 110W-155E | 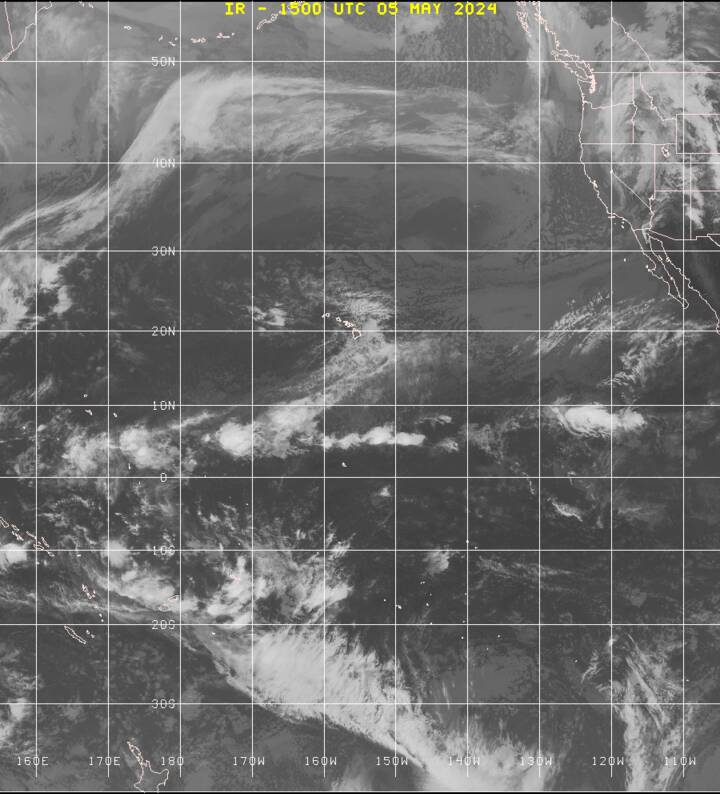 |
| 00Z Southwest Pacific Satellite Image 05N-40S, 130W-165E | 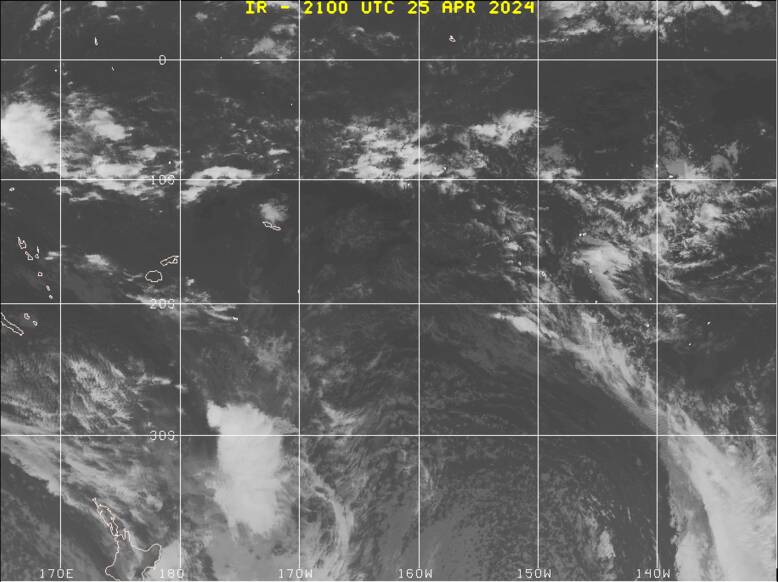 |
| 06Z Southwest Pacific Satellite Image 05N-40S, 130W-165E | 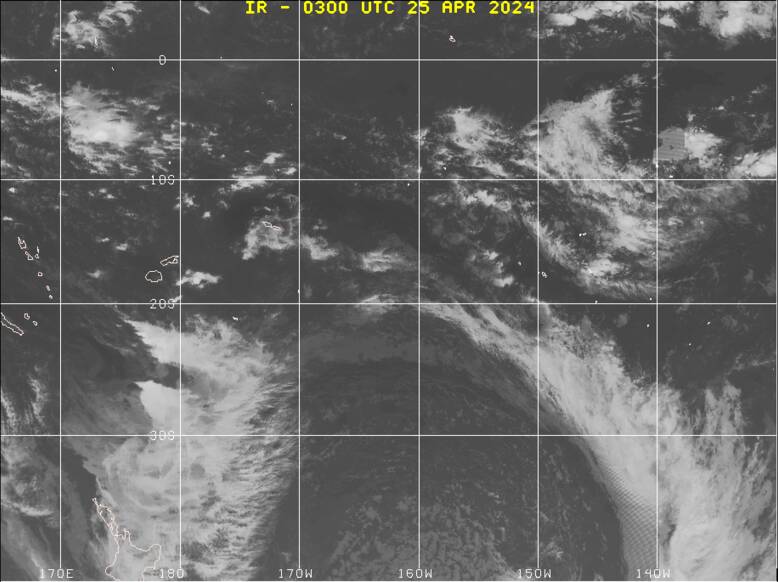 |
| 12Z Southwest Pacific Satellite Image 05N-40S, 130W-165E | 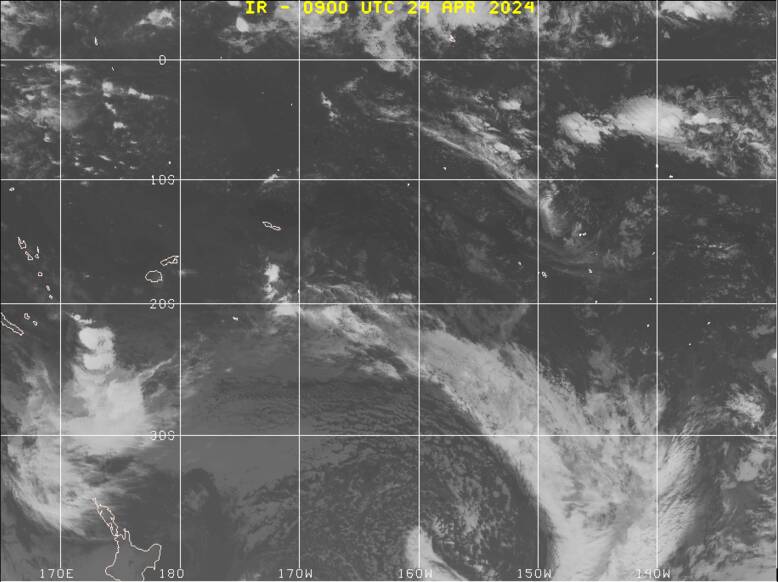 |
| 18Z Southwest Pacific Satellite Image 05N-40S, 130W-165E |  |
| 00Z Tropical East Pacific Satellite Image 05N-32N,E of 125W* | 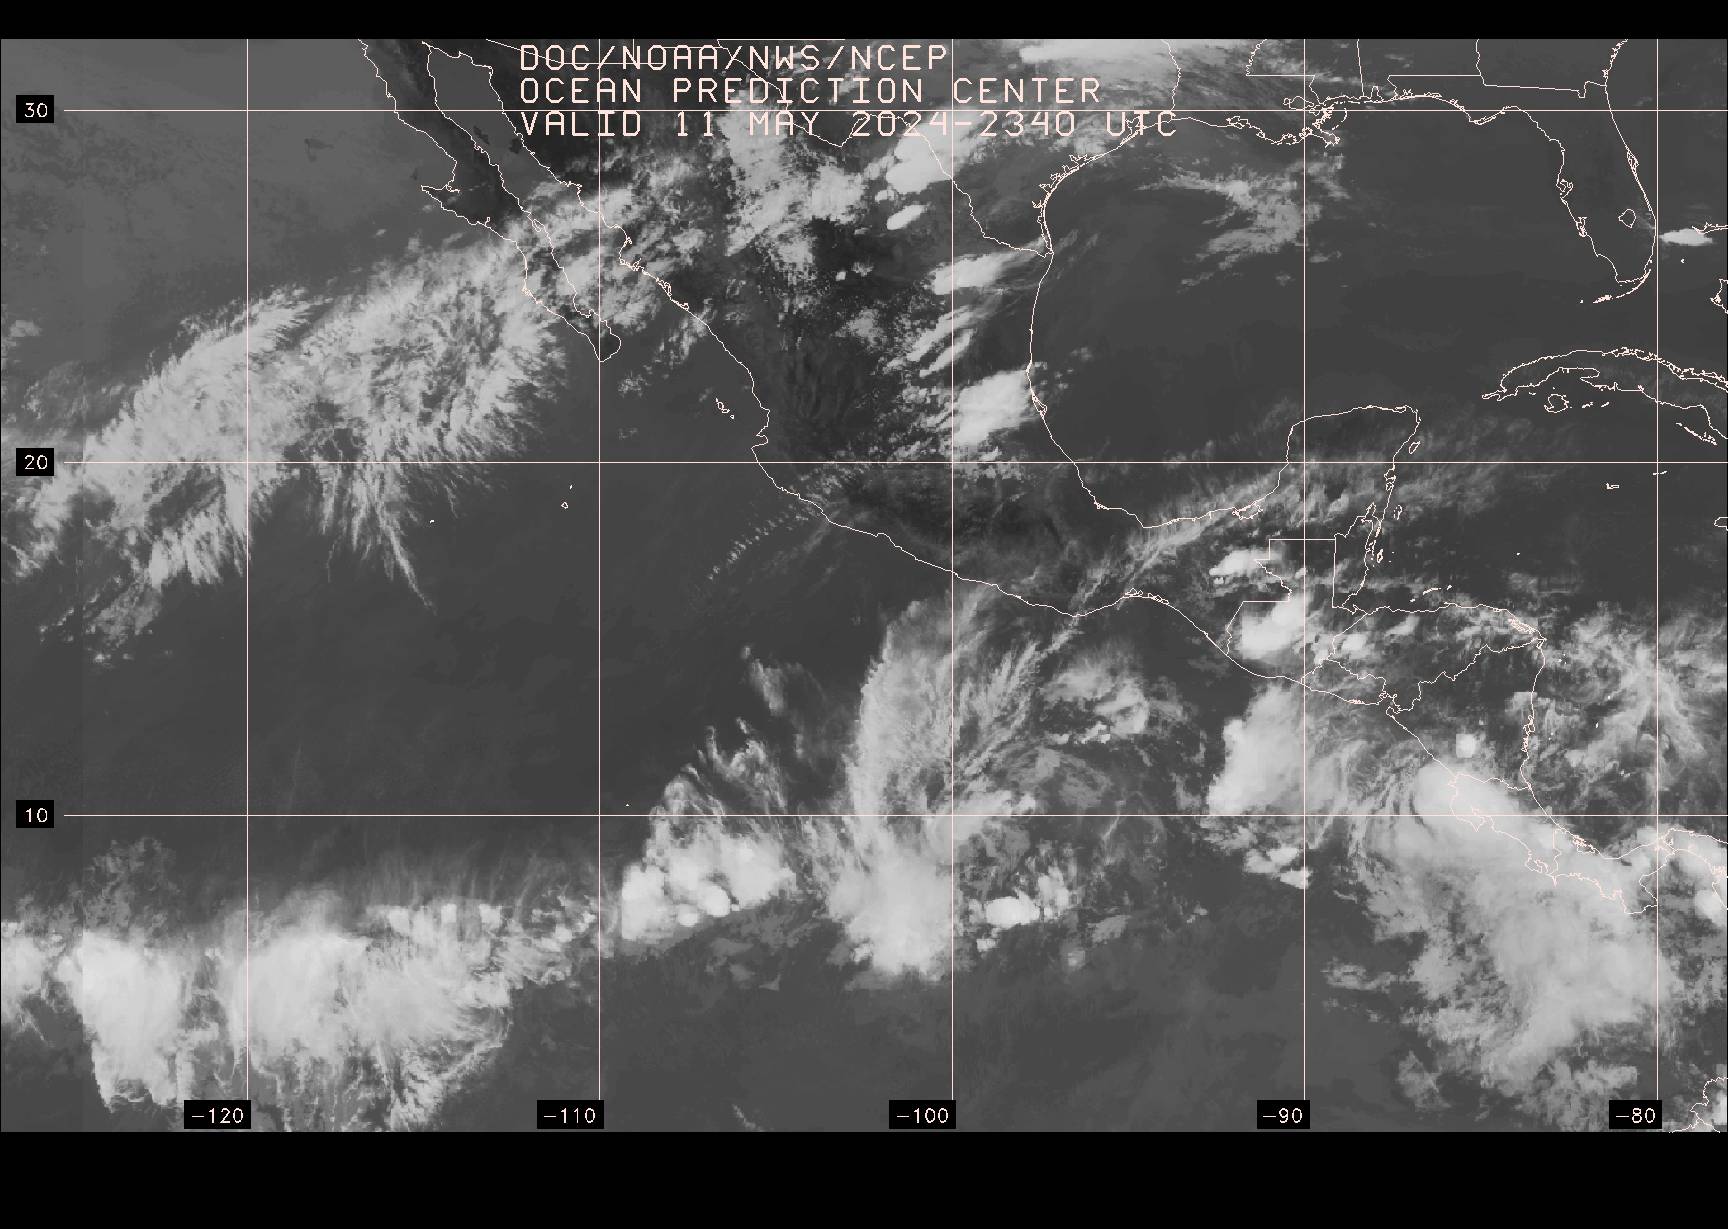 |
| 06Z Tropical East Pacific Satellite Image 05N-32N,E of 125W |  |
| 12Z Tropical East Pacific Satellite Image 05N-32N,E of 125W* | 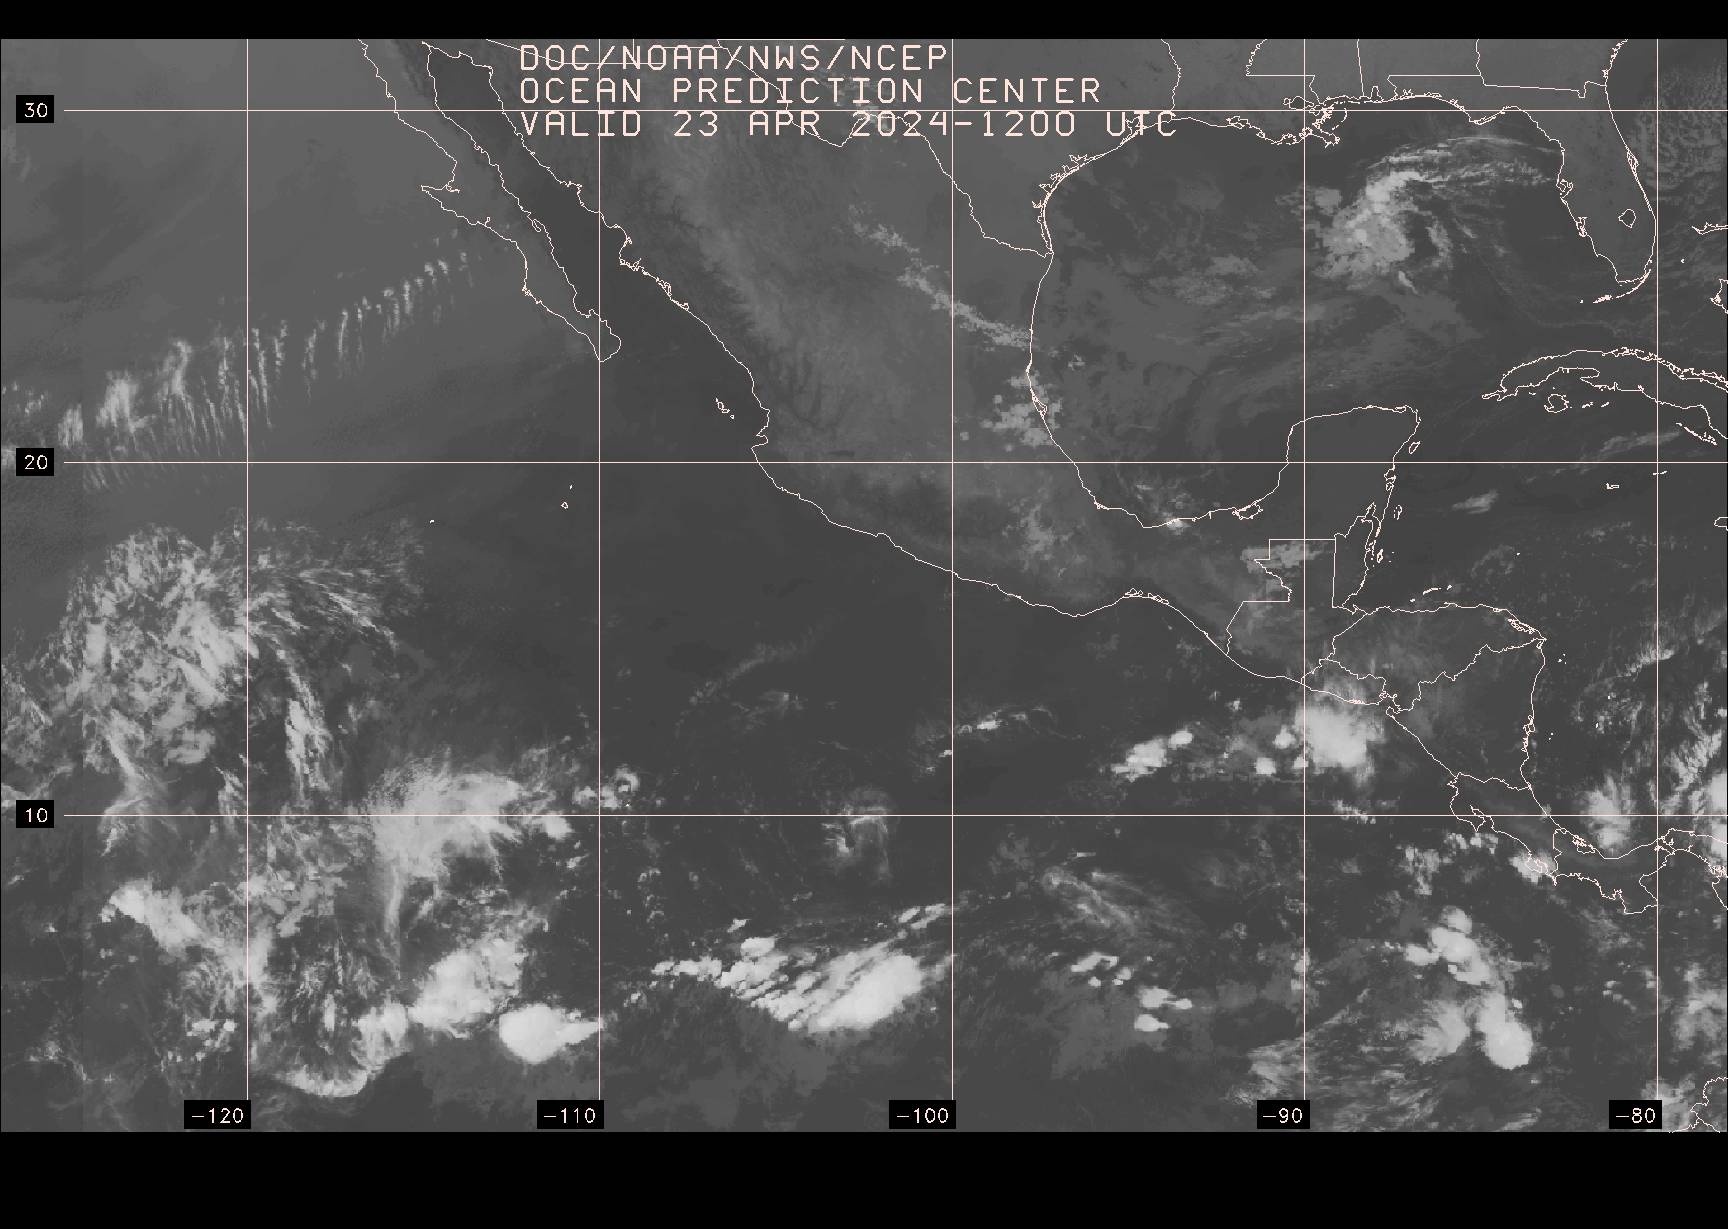 |
| 18Z Tropical East Pacific Satellite Image 05N-32N,E of 125W |  |
| 00Z Pacific Satellite Image 05N-55N, E of 180W* | 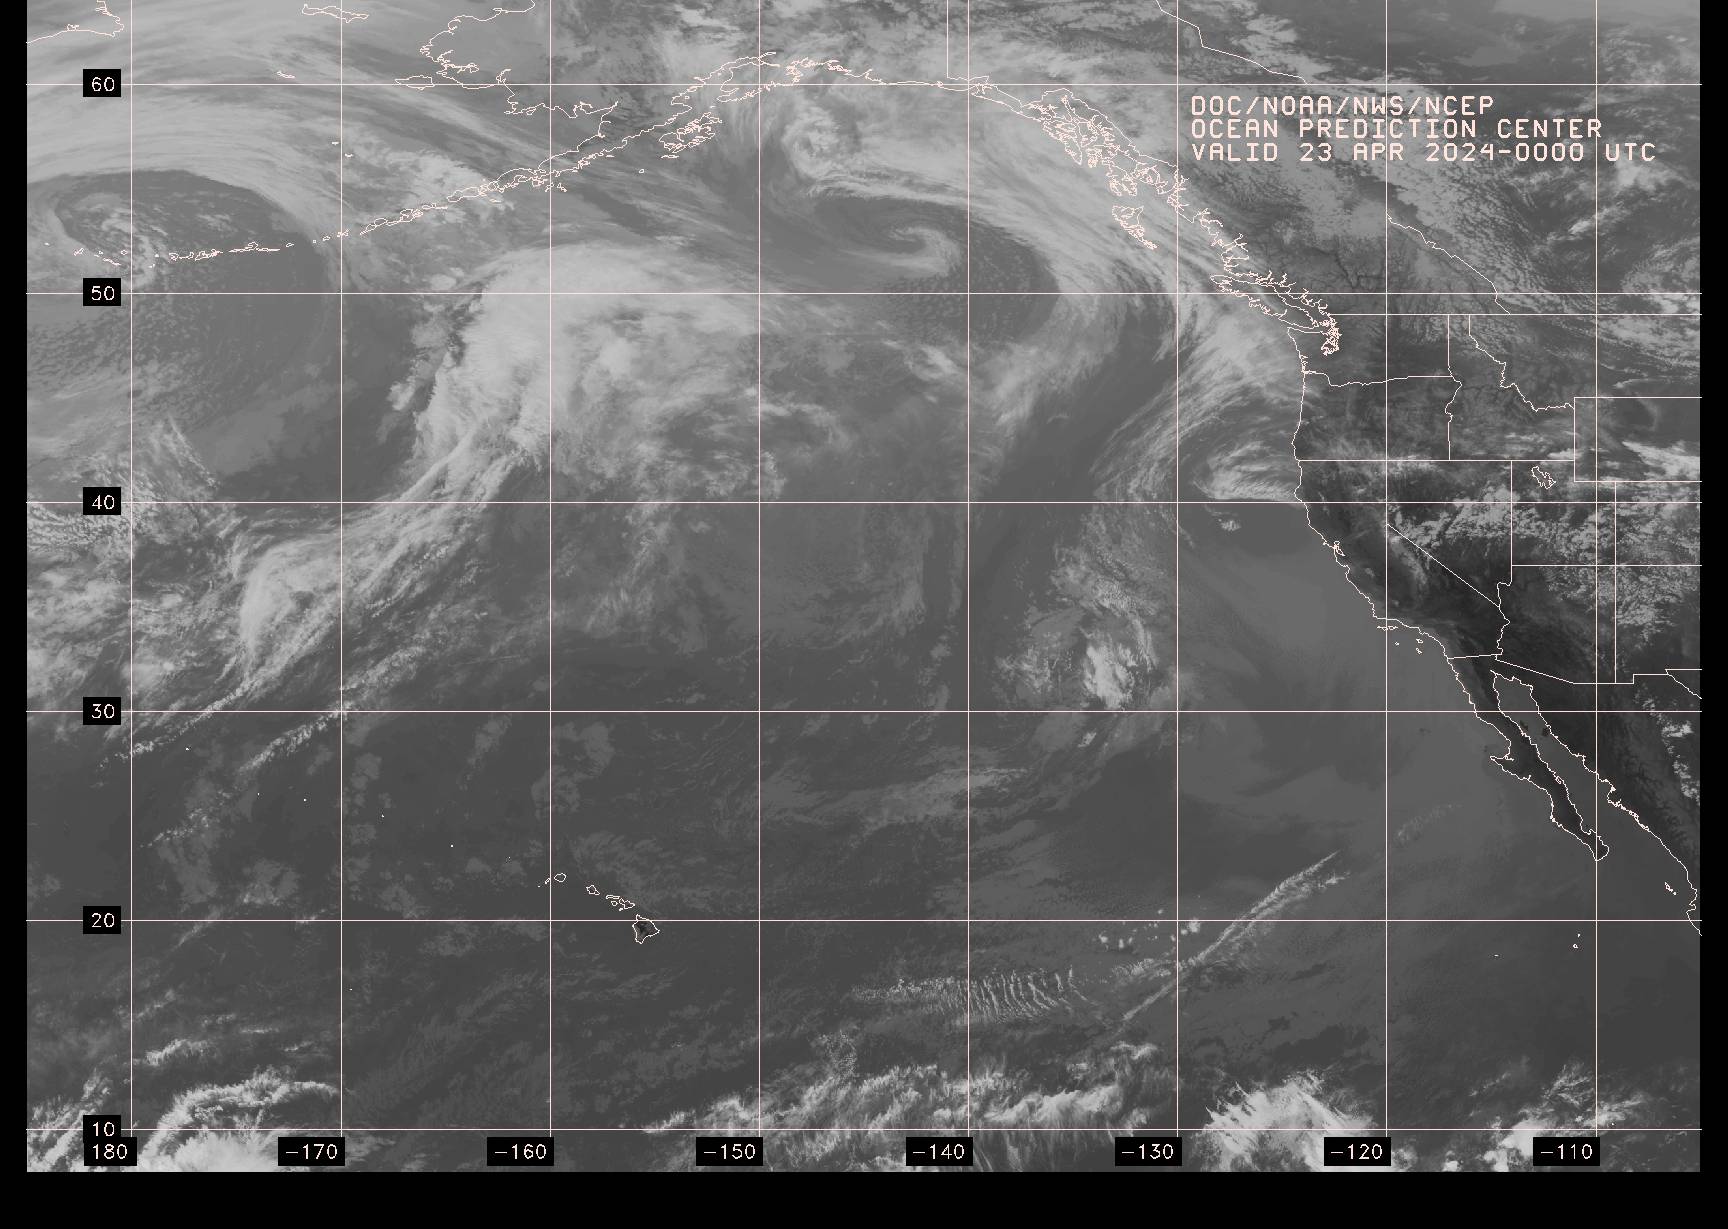 |
| 06Z Pacific Satellite Image 05N-55N, E of 180W | 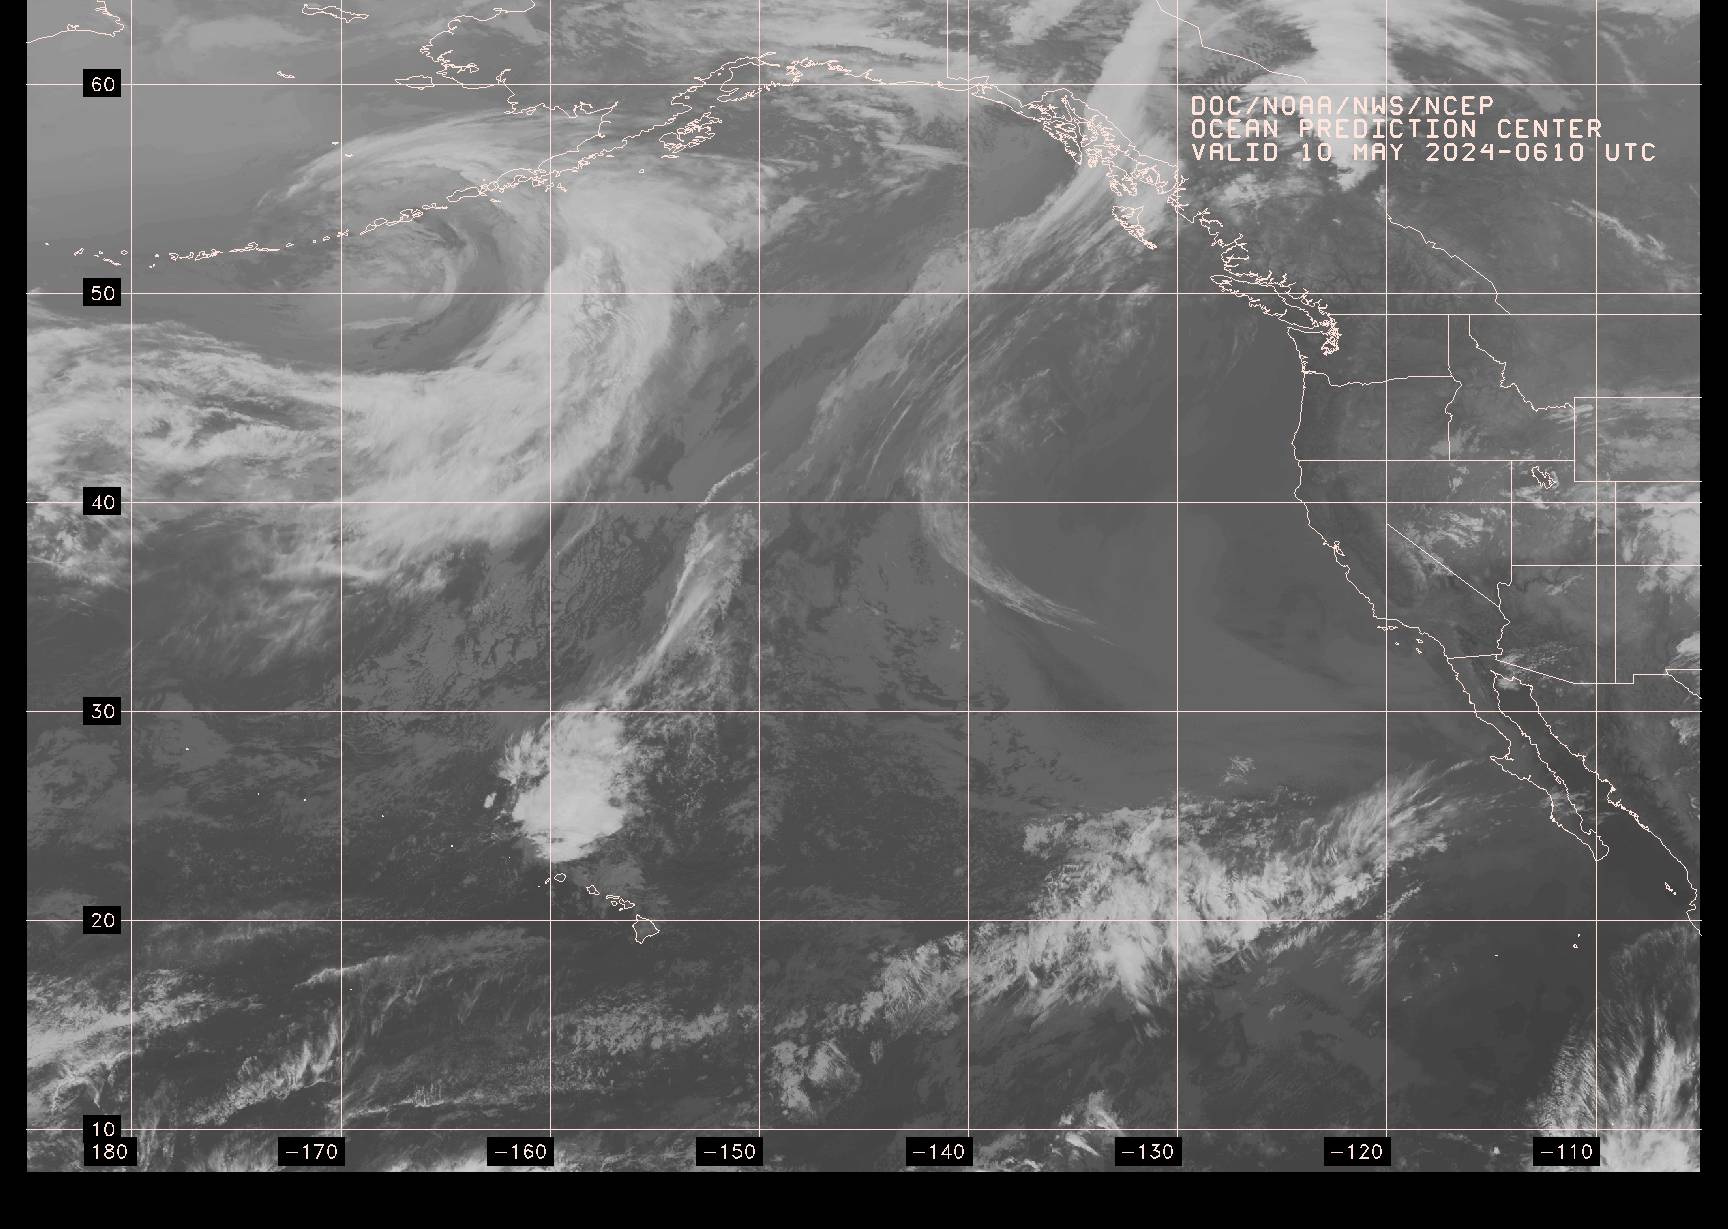 |
| 12Z Pacific Satellite Image 05N-55N, E of 180W* |  |
| 18Z Pacific Satellite Image 05N-55N, E of 180W | 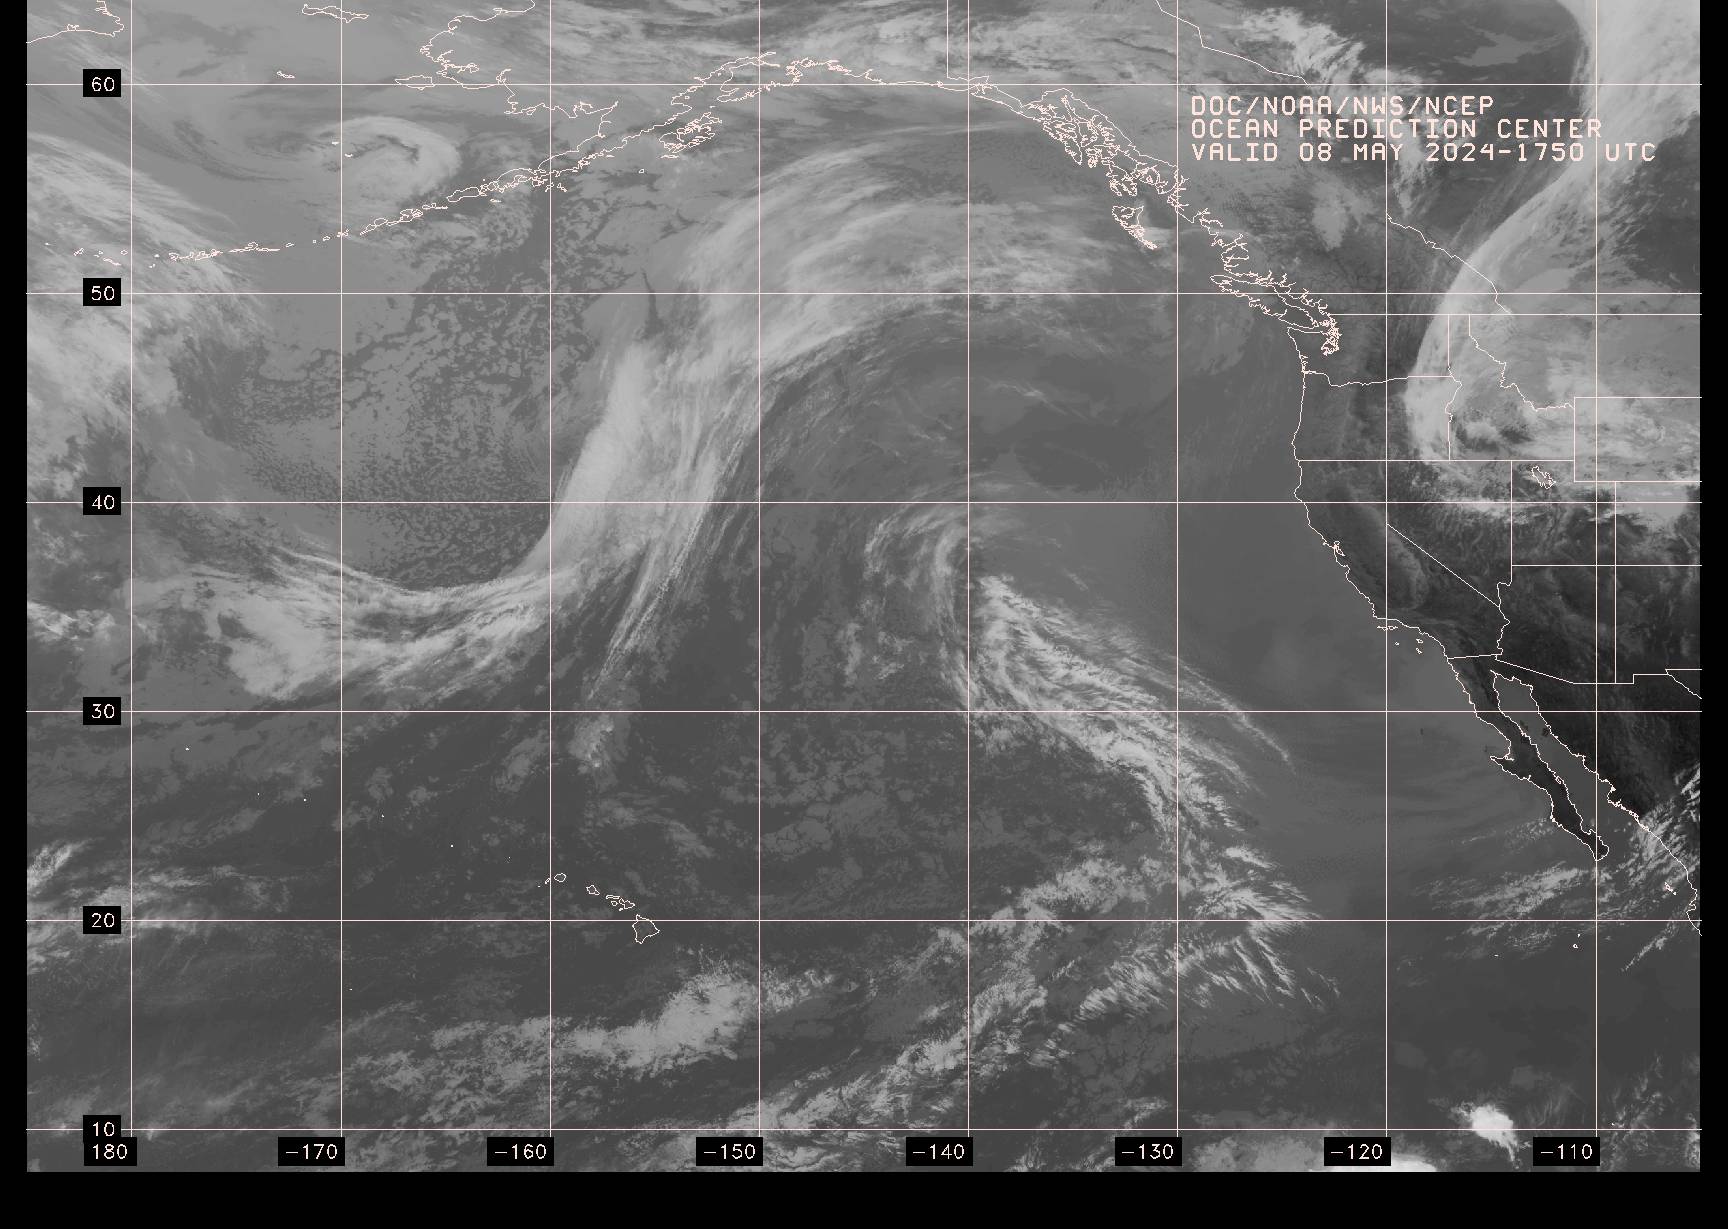 |
| * Not transmitted via Honolulu radiofax but listed here for convenience | |
| Schedule and Miscellaneous | ||
|---|---|---|
| Radiofax Schedule Honolulu, HI(DOS Text Format) |  |
|
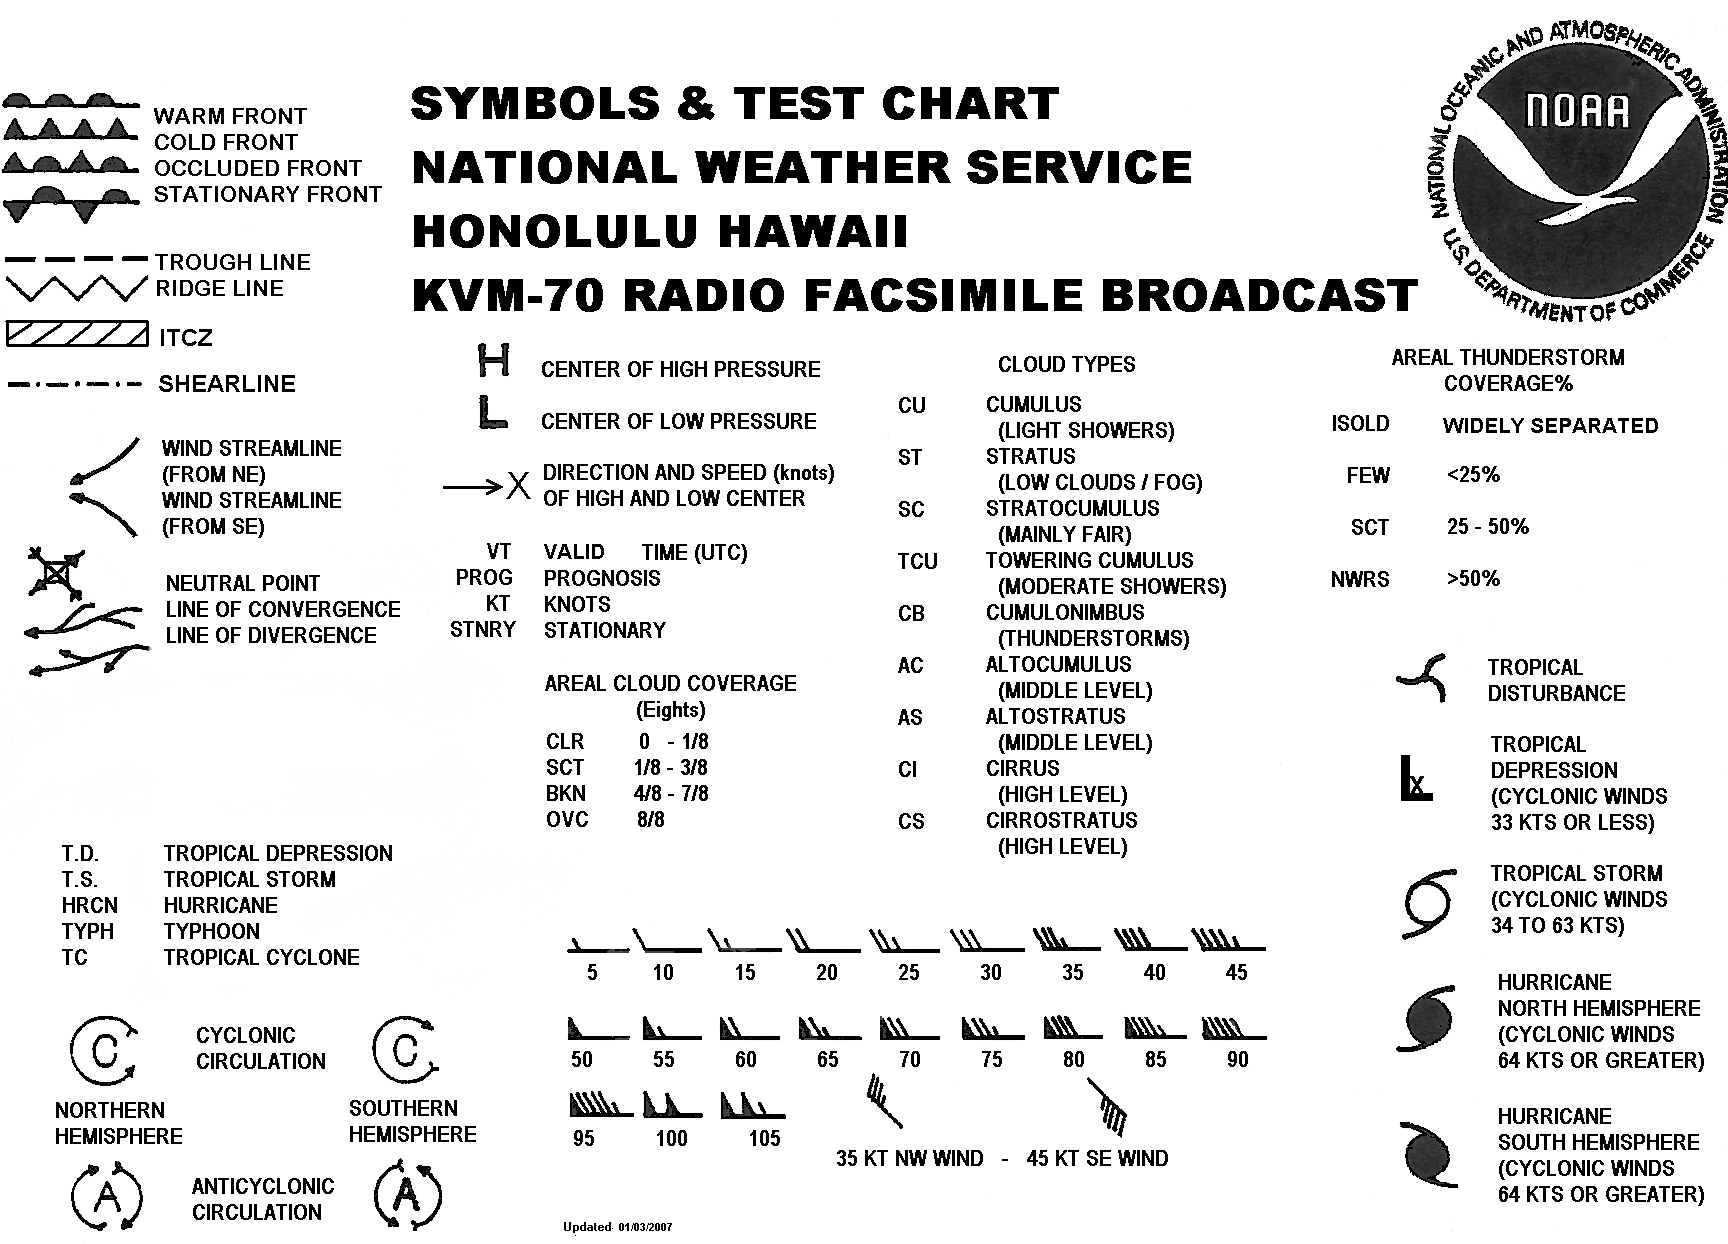
| Test/Symbols | |
 |
| Internet File Names | |
|

