
Dangerous and extreme heat will remain across portions of the Central U.S. this week, persisting across the Mid to Lower Mississippi Valleys, Gulf Coast, Southern Plains and portions of Texas. A heat wave over the Southwest will intensify late this week. Severe thunderstorms and flash flooding will spread from the Great Lakes/Ohio Valley to the Mid-Atlantic and Northeast the next few days. Read More >
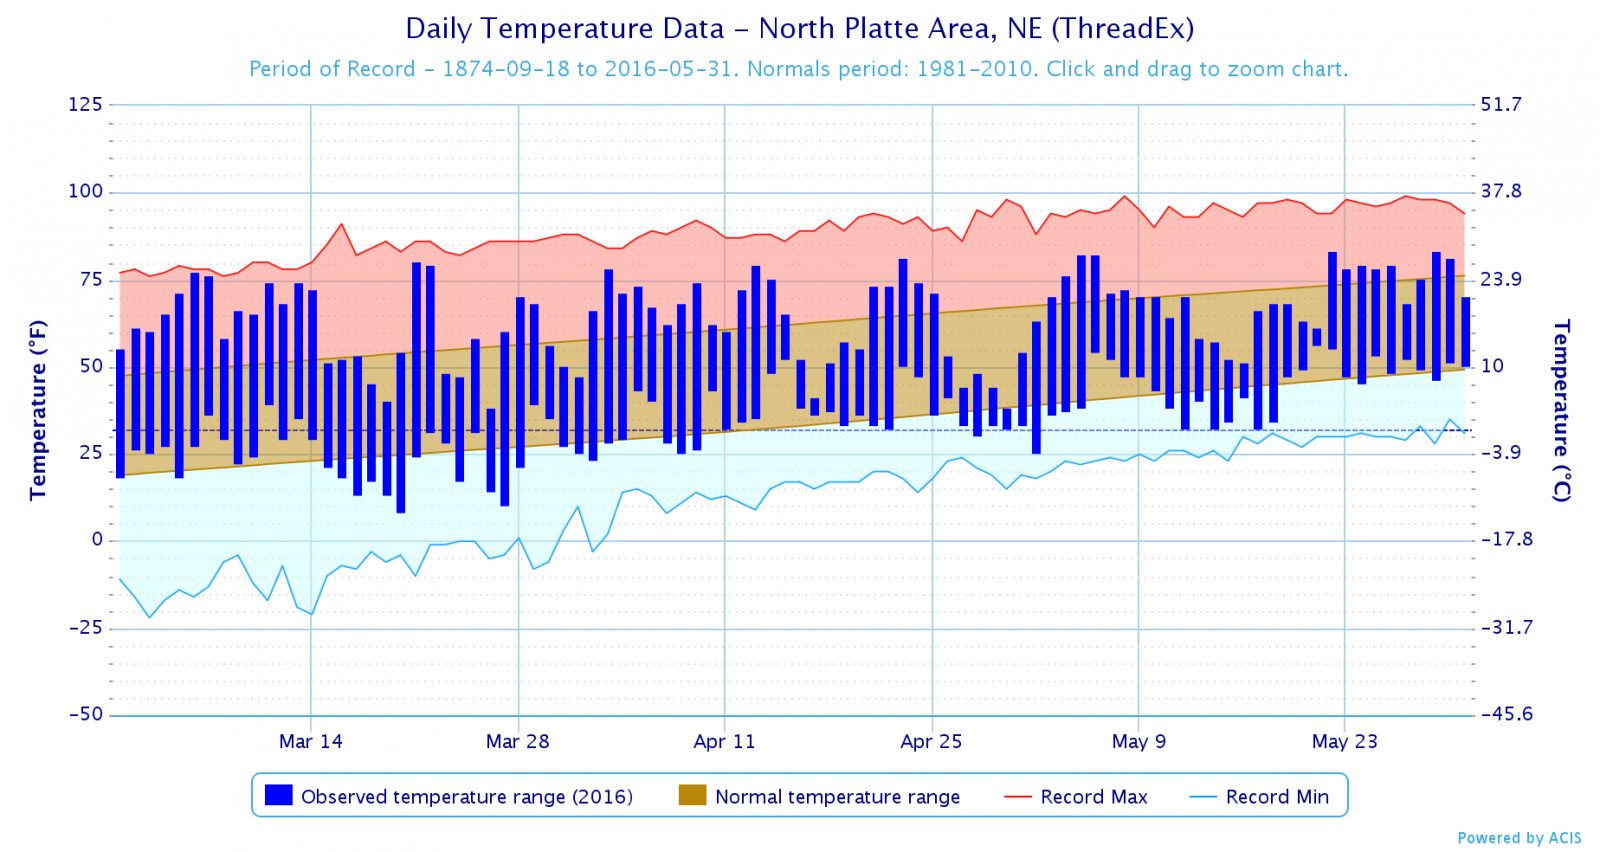
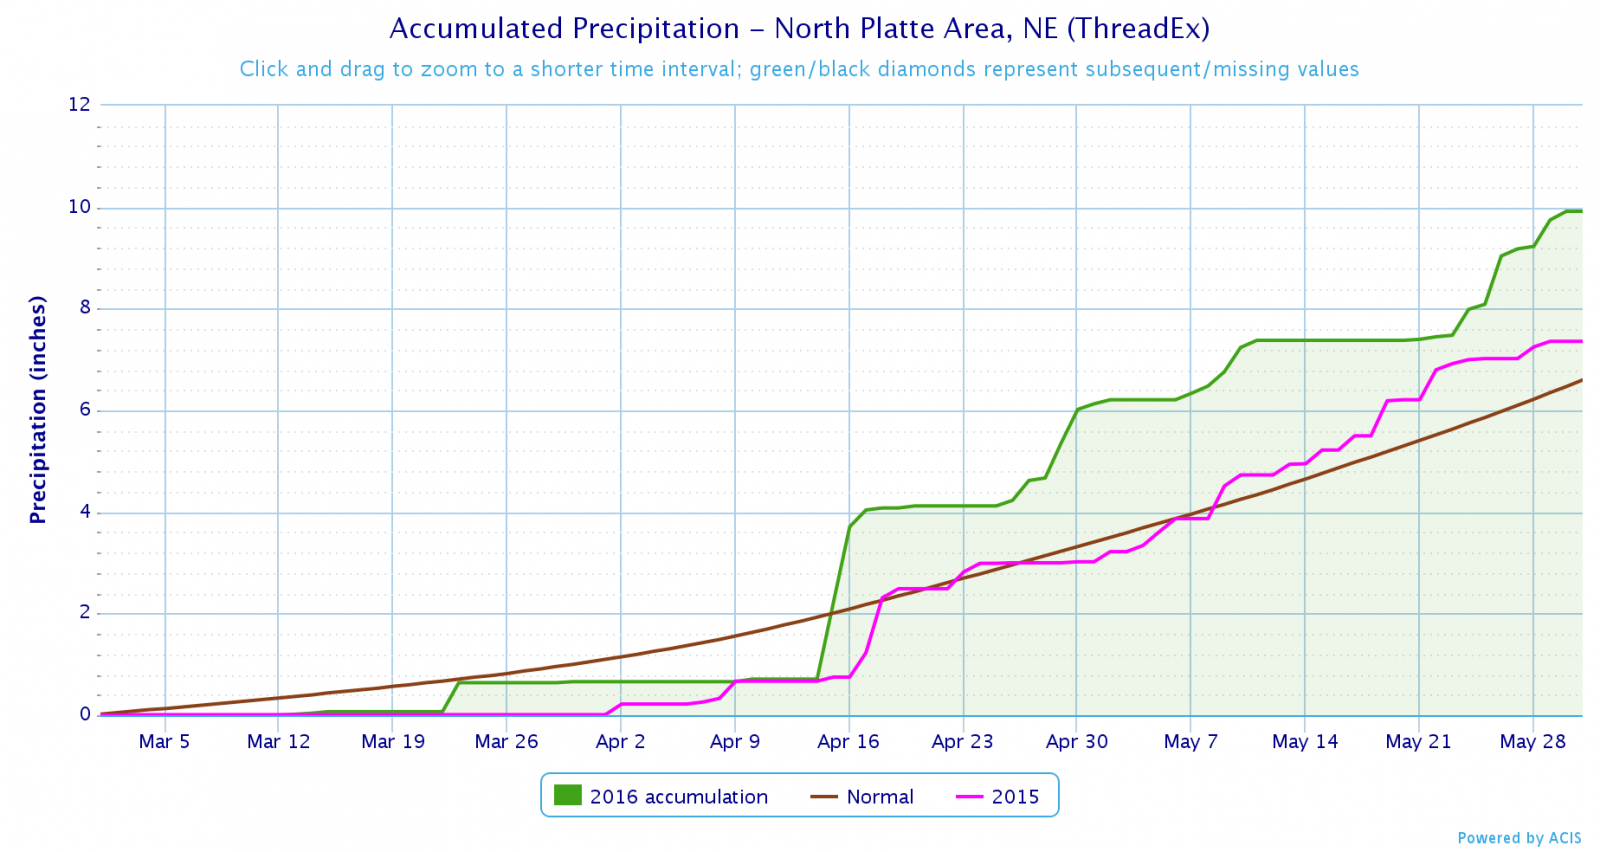
North Platte, NE
Spring Statistics
Facts for the 3 month period of March, April and May
(including the last 5 years)
| Ave High |
Ave Low |
Ave Temp |
Precip | Snowfall | Days Lows <20 |
Days Lows ≤32 |
Days Highs 70+ |
Days Highs 80+ |
|
| Average | 61.1 | 34.8 | 47.9 | 6.08 | 8.6 | 10.2 | 39.4 | 30.4 | 10.5 |
| Max | 71.2 | 39.5 | 54.6 | 14.87 | 33.0 | 25 | 57 | 52 | 26 |
| Year | 2012 | 1941 | 2012 | 1915 | 1961 | 1965 | 1907 | 2012 | 2012 |
| Min | 54.3 | 29.3 | 43.3 | 0.77 | Trace | 0 | 20 | 14 | 1 |
| Year | 1892 | 2002 | 1958 | 1897 | 1902 1914 2012 |
1878 1910 |
1925 | 1882 | 1957 1995 |
| Last 5 Years | |||||||||
| 2012 | 71.2 | 38.0 | 54.6 | 5.24 | Trace | 5 | 30 | 52 | 26 |
| 2013 | 60.8 | 31.5 | 46.1 | 4.88 | 10.3 | 16 | 56 | 31 | 12 |
| 2014 | 62.9 | 32.1 | 47.5 | 3.24 | 7.4 | 14 | 51 | 37 | 10 |
| 2015 | 65.1 | 34.4 | 49.7 | 7.36 | 2.4 | 6 | 41 | 37 | 6 |
| 2016 | 64.4 | 34.3 | 49.3 | 9.92 | 6.8 | 10 | 41 | 39 | 7 |
| No Top 10 Finishes for the 2015 Spring (Mar, Apr, May) for North Platte |
Temperature and Precipitation Records (1875 to current)
Snowfall Records (1893 to current)
Click on images above to zoom
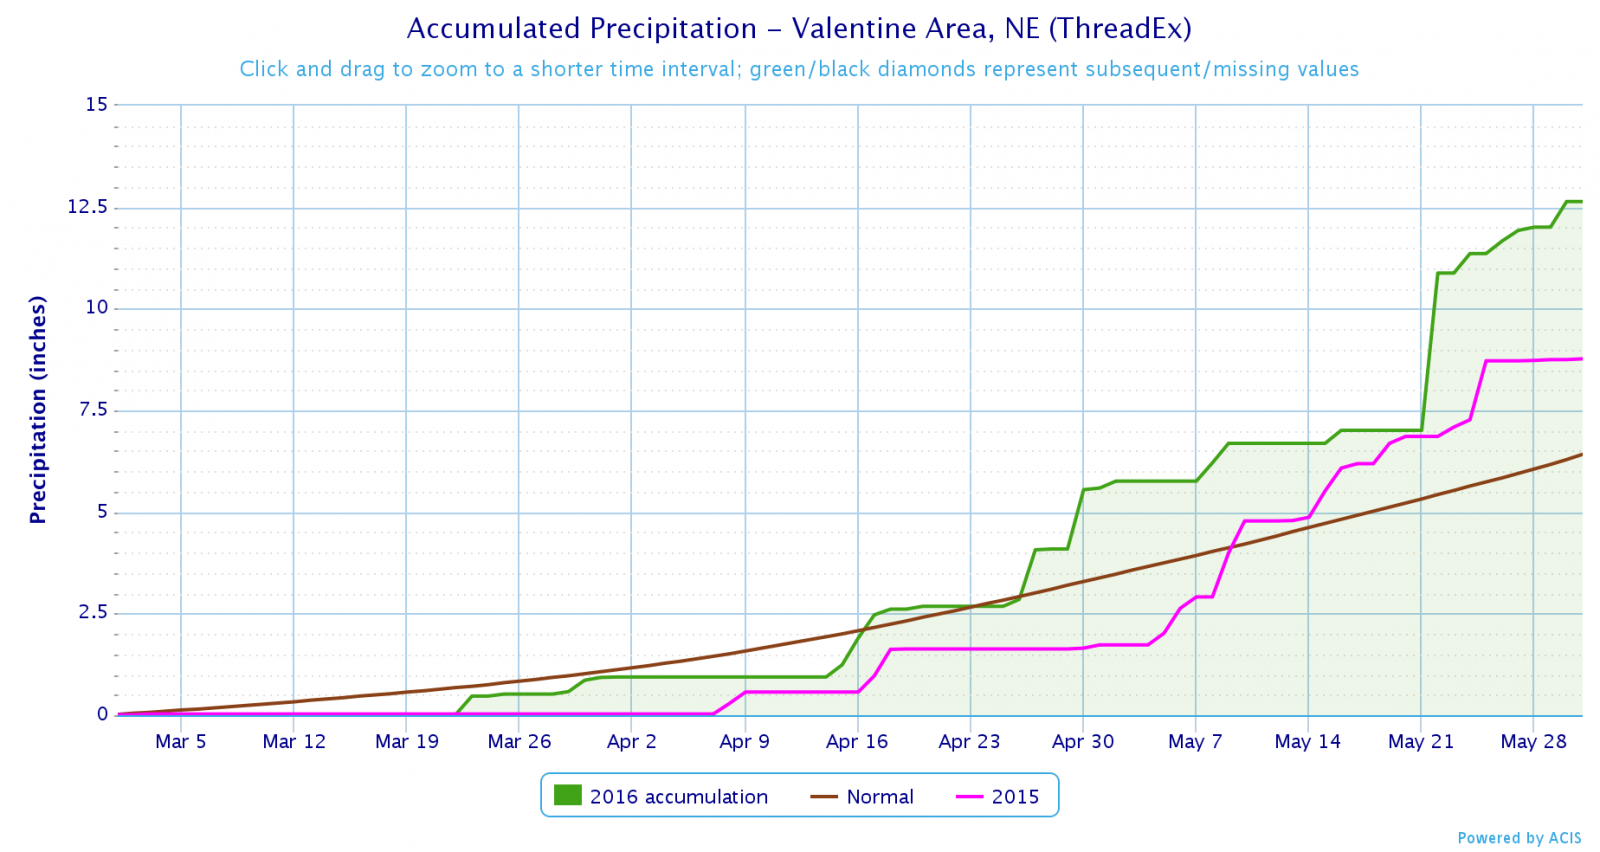
Valentine, NE
Spring Statistics
Facts for the 3 month period of March, April and May
(including the last 5 years)
| Ave High |
Ave Low |
Ave Temp |
Precip | Snowfall | Days Lows <20 |
Days Lows ≤32 |
Days Highs 70+ |
Days Highs 80+ |
|
| Average | 58.2 | 33.1 | 45.6 | 6.04 | 12.7 | 13.4 | 43.0 | 25.8 | 9.4 |
| Max | 68.4 | 38.5 | 53.4 | 13.91 | 53.5 | 29 | 59 | 42 | 24 |
| Year | 2012 | 2012 | 2012 | 1977 | 1977 | 1899 | 1909 1917 |
1994 | 1934 |
| Min | 49.7 | 28.3 | 39.6 | 1.90 | Trace | 1 | 20 | 9 | 0 |
| Year | 1892 | 1950 | 1950 | 1966 | 2012 | 1910 | 2012 | 1892 1917 |
1935 |
| Last 5 Years | |||||||||
| 2012 | 68.4 | 38.5 | 53.4 | 3.99 | Trace | 3 | 20 | 38 | 19 |
| 2013 | 56.9 | 31.4 | 44.1 | 8.17 | 26.4 | 19 | 57 | 25 | 10 |
| 2014 | 60.3 | 33.0 | 46.7 | 6.55 | 9.3 | 15 | 43 | 35 | 10 |
| 2015 | 63.4 | 34.9 | 49.2 | 8.77 | 0.8 | 9 | 40 | 29 | 4 |
| 2016 | 63.4 | 34.7 | 49.0 | 12.64 | 7 | 11 | 40 | 36 | 11 |
| Top 10 Finishes for the 2014 Spring (Mar, Apr, May) for Valentine | |||
| Precipitation (Wettest) |
Days Highs 70+ (Most) |
||
| 1 | 13.91 (1977) | 1 | 42 (1994) |
| 2 | 13.67 (1920) | 2 | 41 (1987) 41 (1985) |
| 3 | 13.59 (1892) | ||
| 4 | 12.64 (2016) | 4 | 38 (2012) 38 (1977) 38 (1934) |
| 5 | 11.70 (1949) | ||
| 6 | 11.05 (1942) | ||
| 7 | 10.75 (1995) | 7 | 37 (1910) 37 (1895) |
| 8 | 10.66 (1927) | ||
| 9 | 10.33 (1962) | 9 | 36 (2016) 36 (2003) 36 (1955) 36 (1939) |
| 10 | 10.26 (2007) | ||
Temperature and Precipitation Records (1890 to current - missing 1893)
Snowfall Records (1900 to current)

Click on images above to zoom
 |
Page composition by Matt Masek Updated 2016 |
 |

