
Tropical Depression Two is expected to gradually strengthen and could bring tropical storm conditions to the Florida Panhandle beginning late Monday. Areas of flash flooding will be possible through Thursday along the eastern and central Gulf Coast. Severe thunderstorms will develop and move along a cold front crossing the Upper Midwest Monday, and through the Ohio Valley/Mid-Atlantic on Tuesday. Read More >
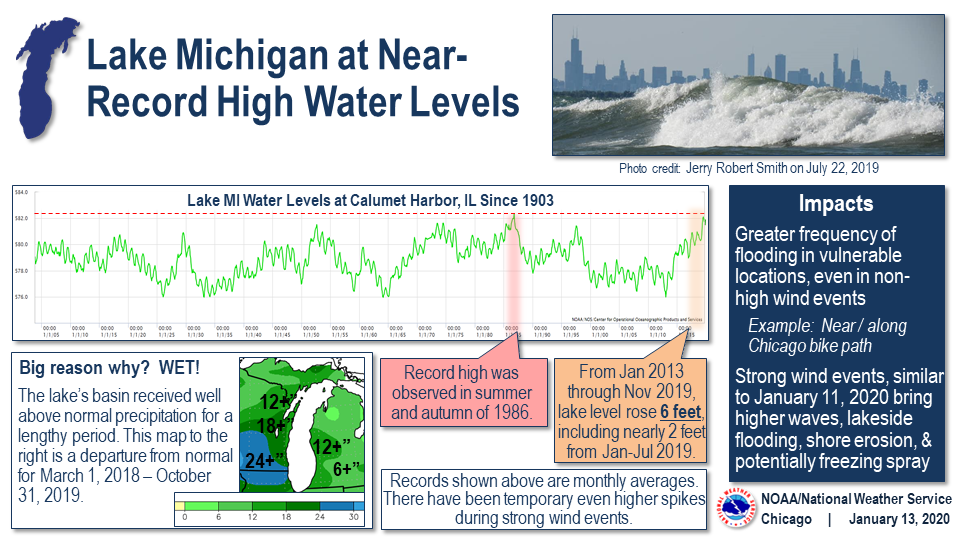 |
| Lake Michigan High Water Infographic |
Summary
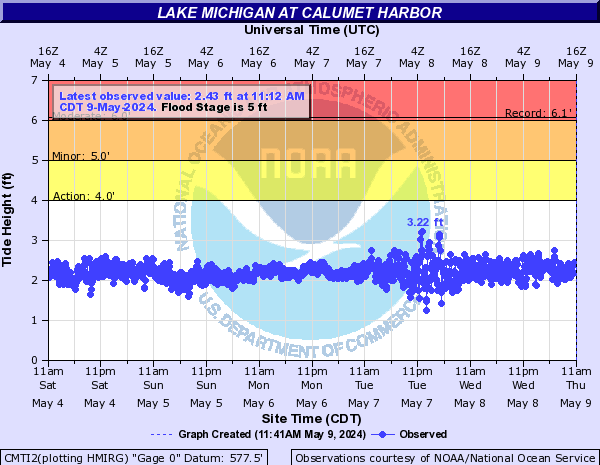
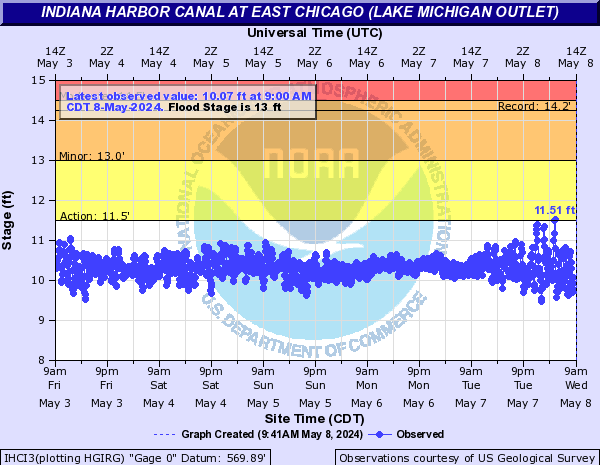
Recent Observations
| Chicago | Calumet Harbor | Indiana Harbor | Portage |
 |
 ​ ​ |
 ​ ​ |
 ​ ​ |
More water level information from water.weather.gov
​
Forecasts
Flooding impacts along the immediate shore are typically closely tied to wave height. For more inland areas such as marinas, protected harbors, and the lower reaches of some rivers, the average lake level plus storm surge is important.
Waves
Surge
Lake Levels
Past Water Levels and Precipitation
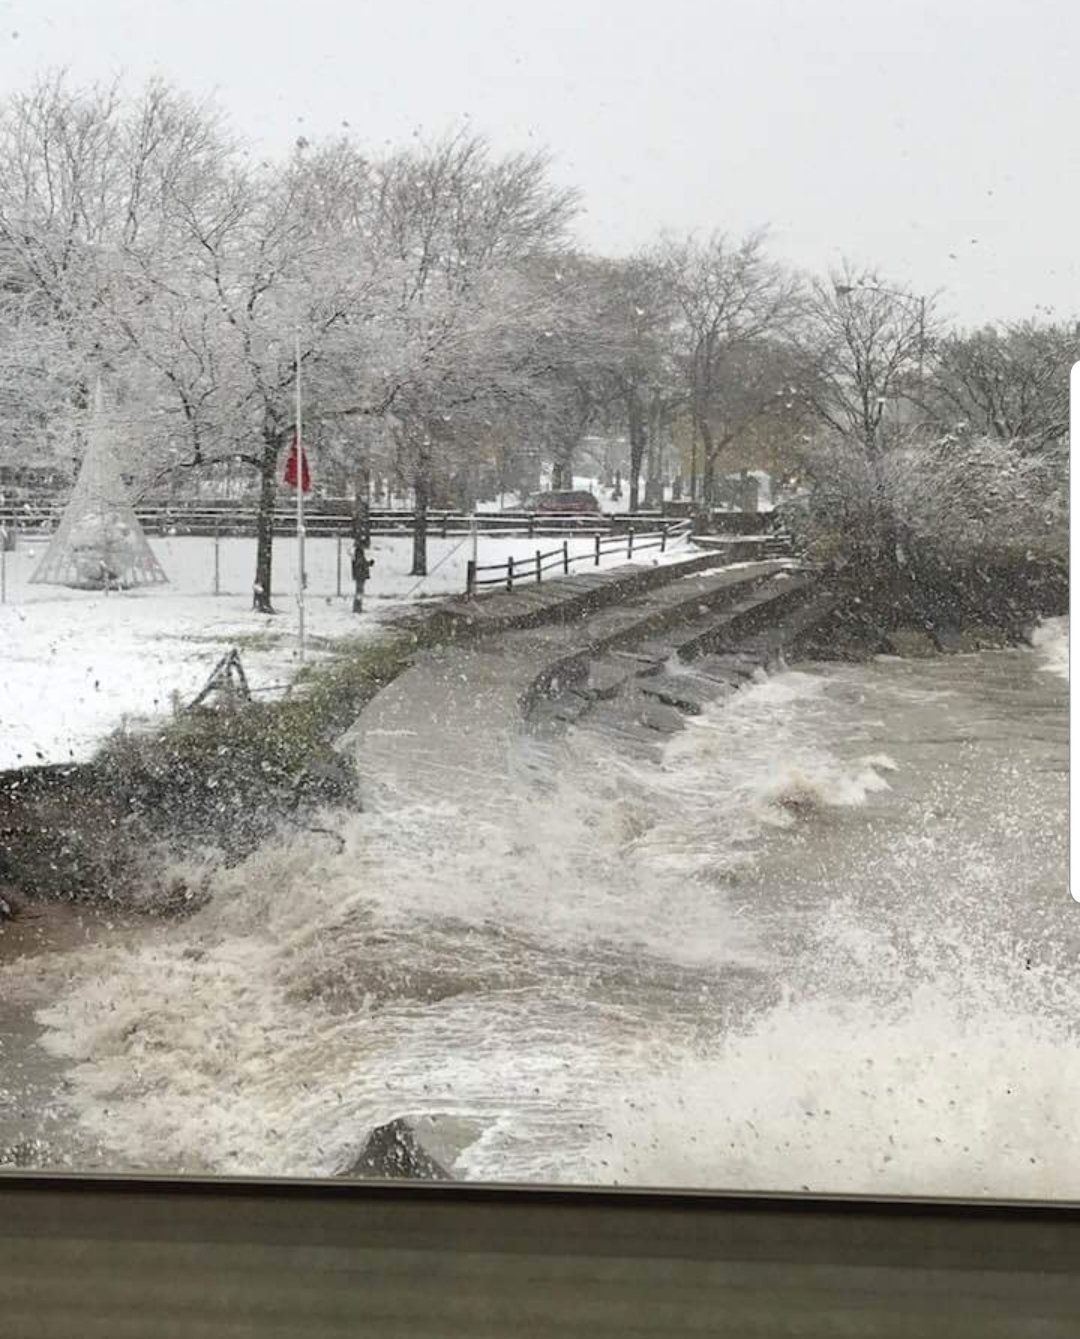
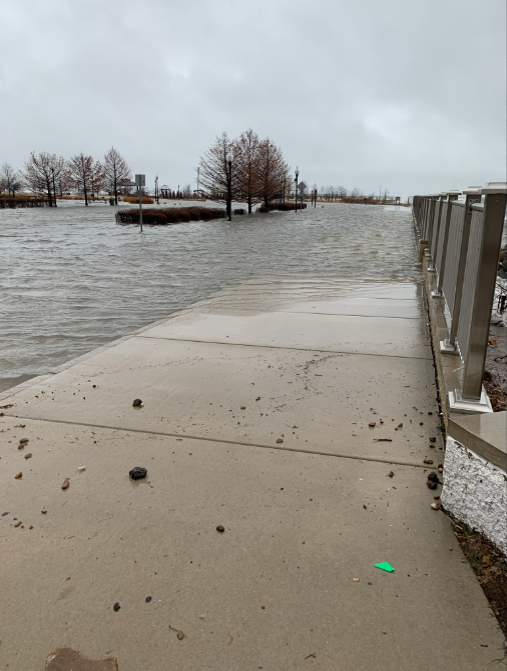
Documented Impacts
Photos
 |
 |
 |
||||
| Photos of Juneway Beach in Rogers Park, IL (Cook County, north side of Chicago) from David Seal on Oct 31, 2019 | ||||||
 |
 |
 |
||||
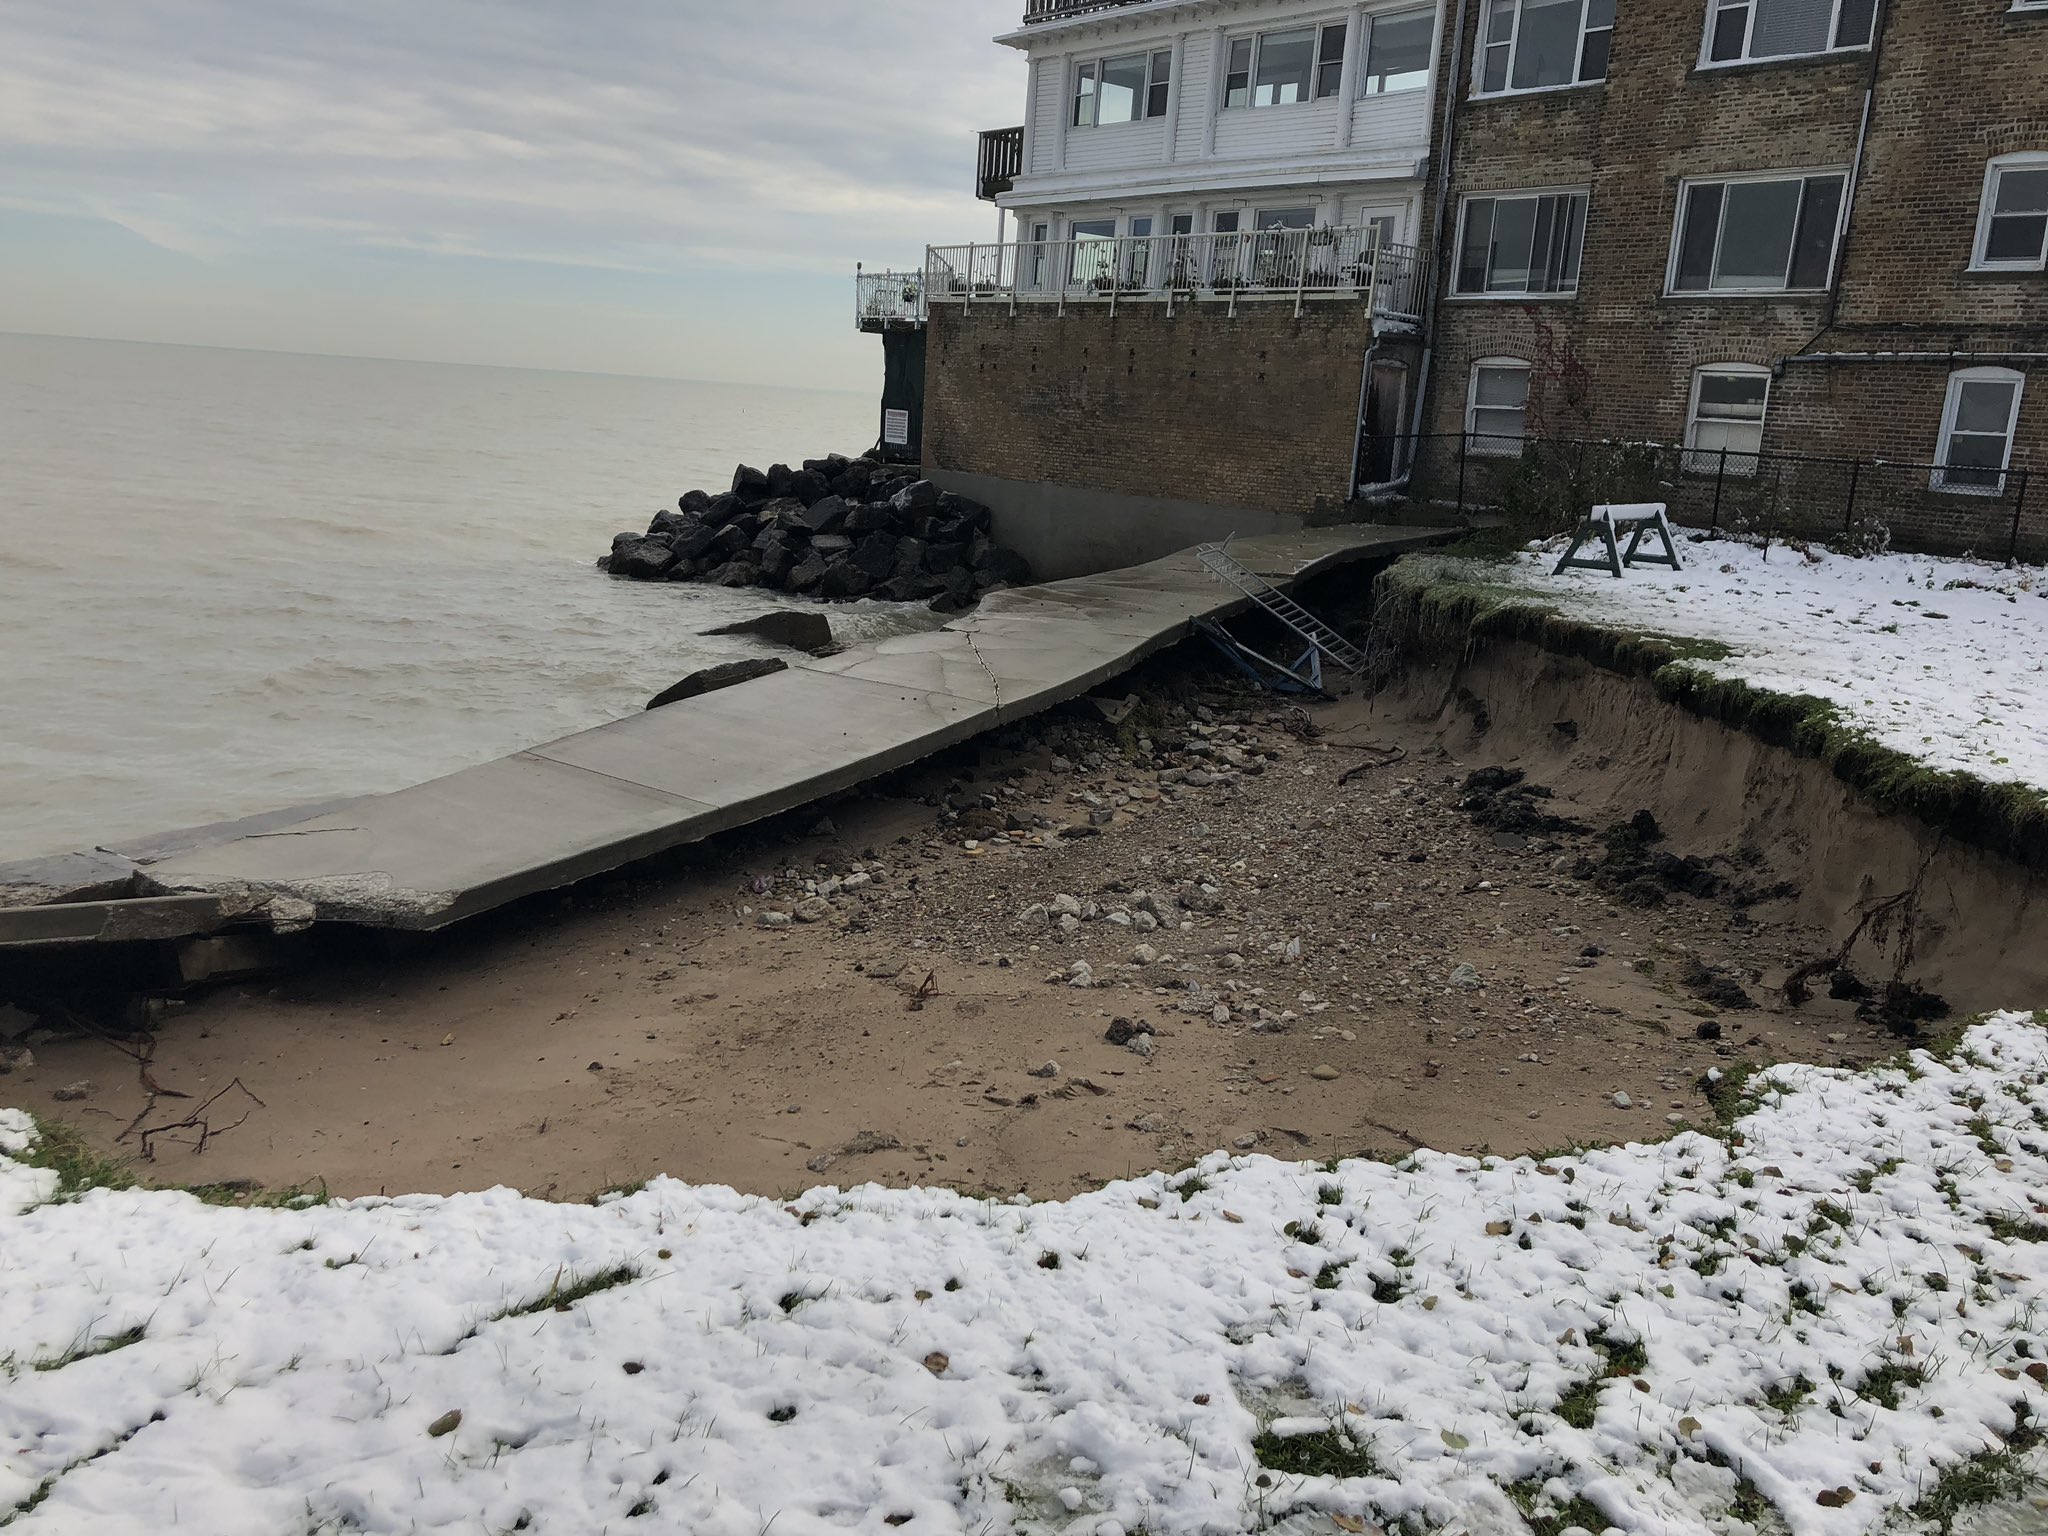
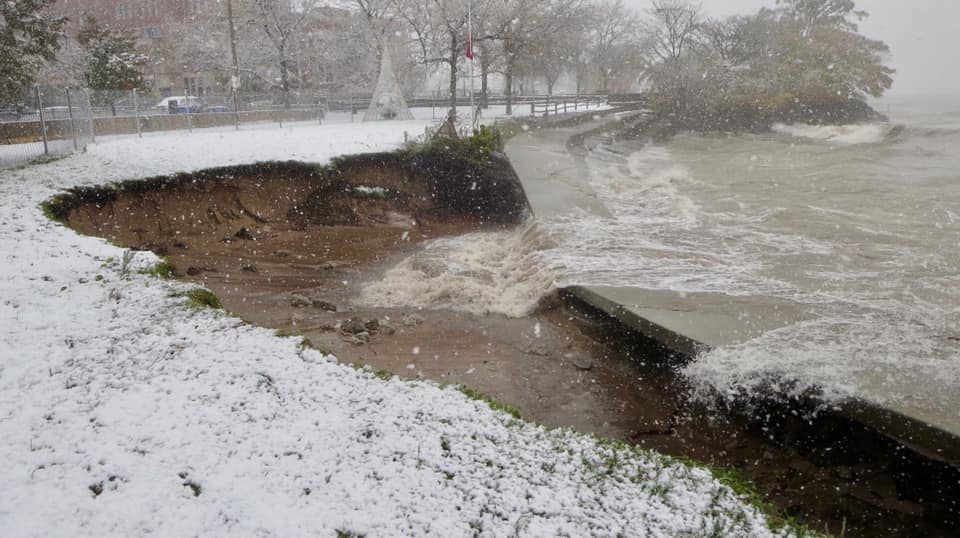
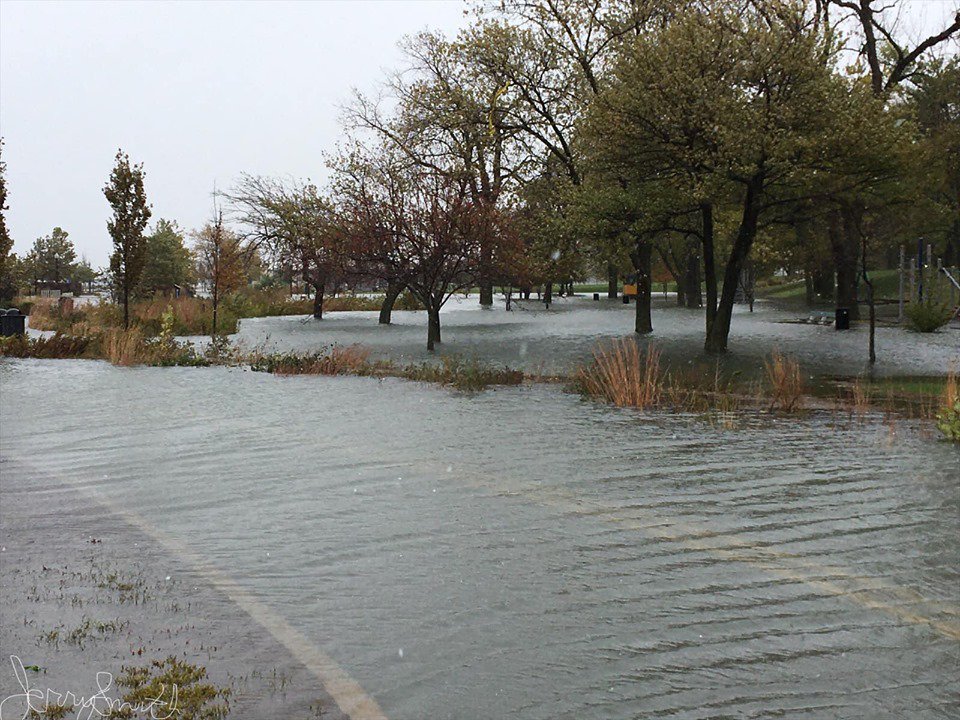
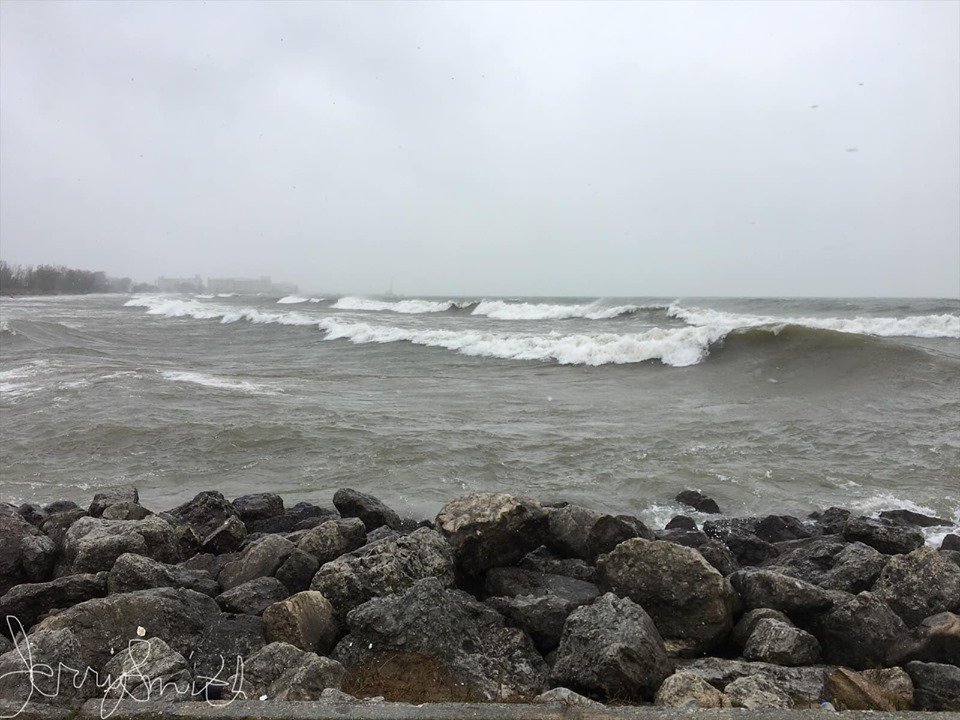
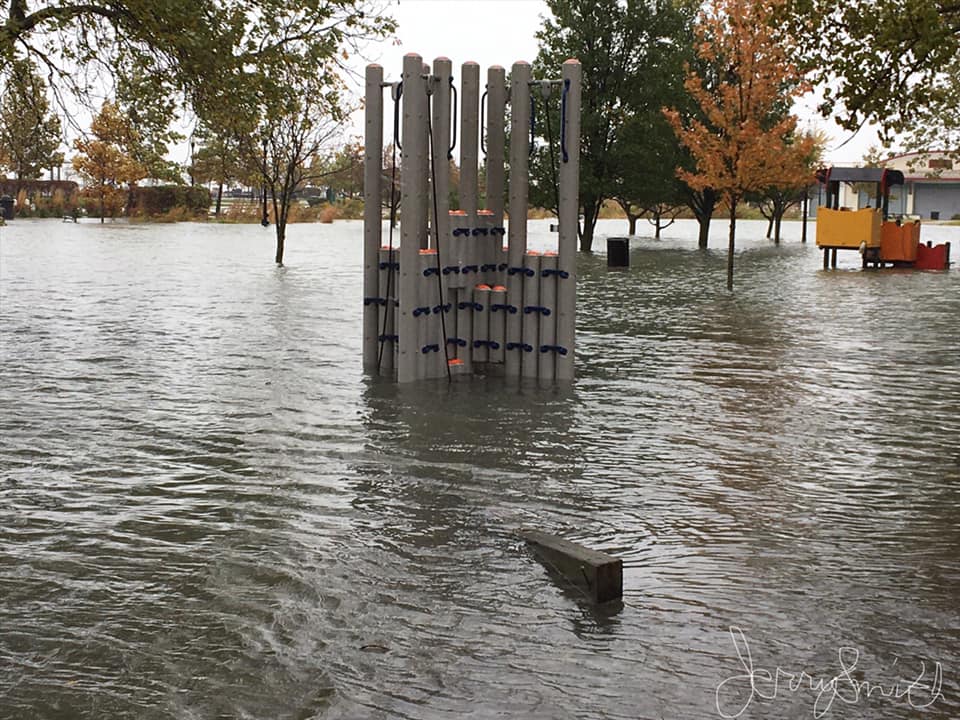
| Photos of Whiting, IN from Jerry Robert Smith on Oct 31, 2019 | ||||||
 |
 |
 |
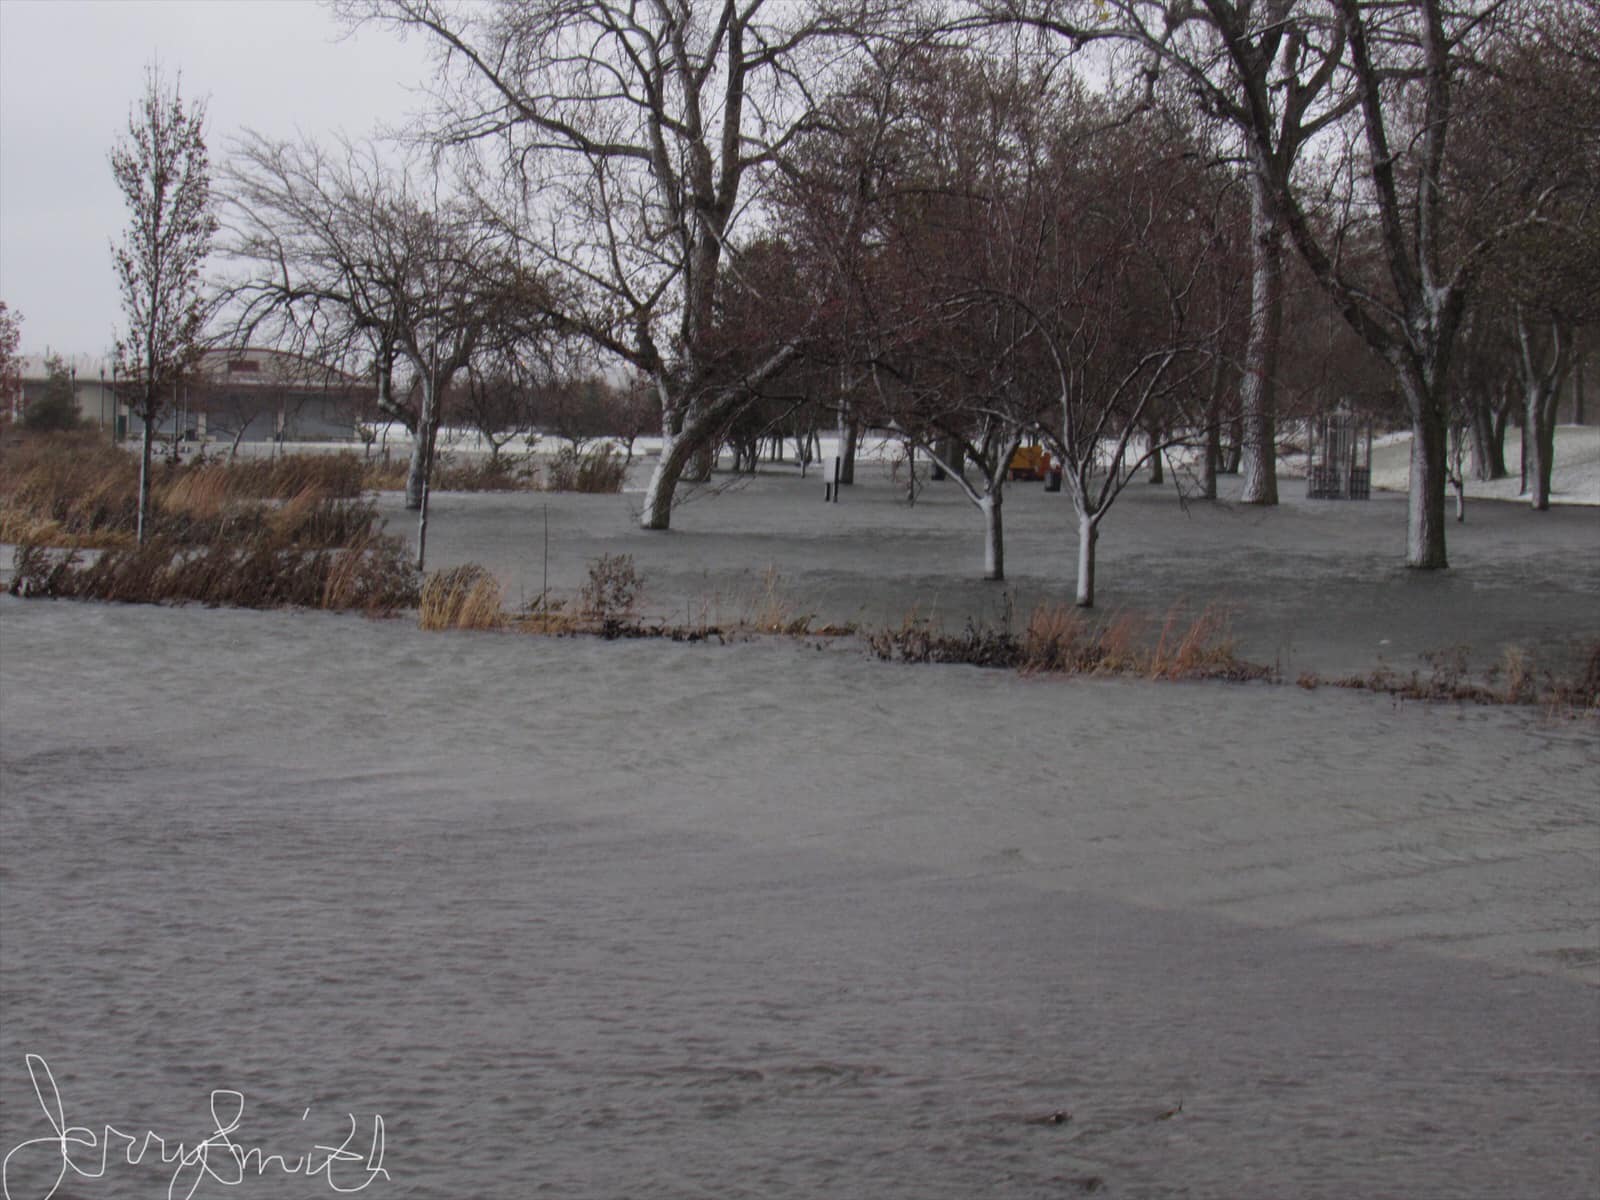
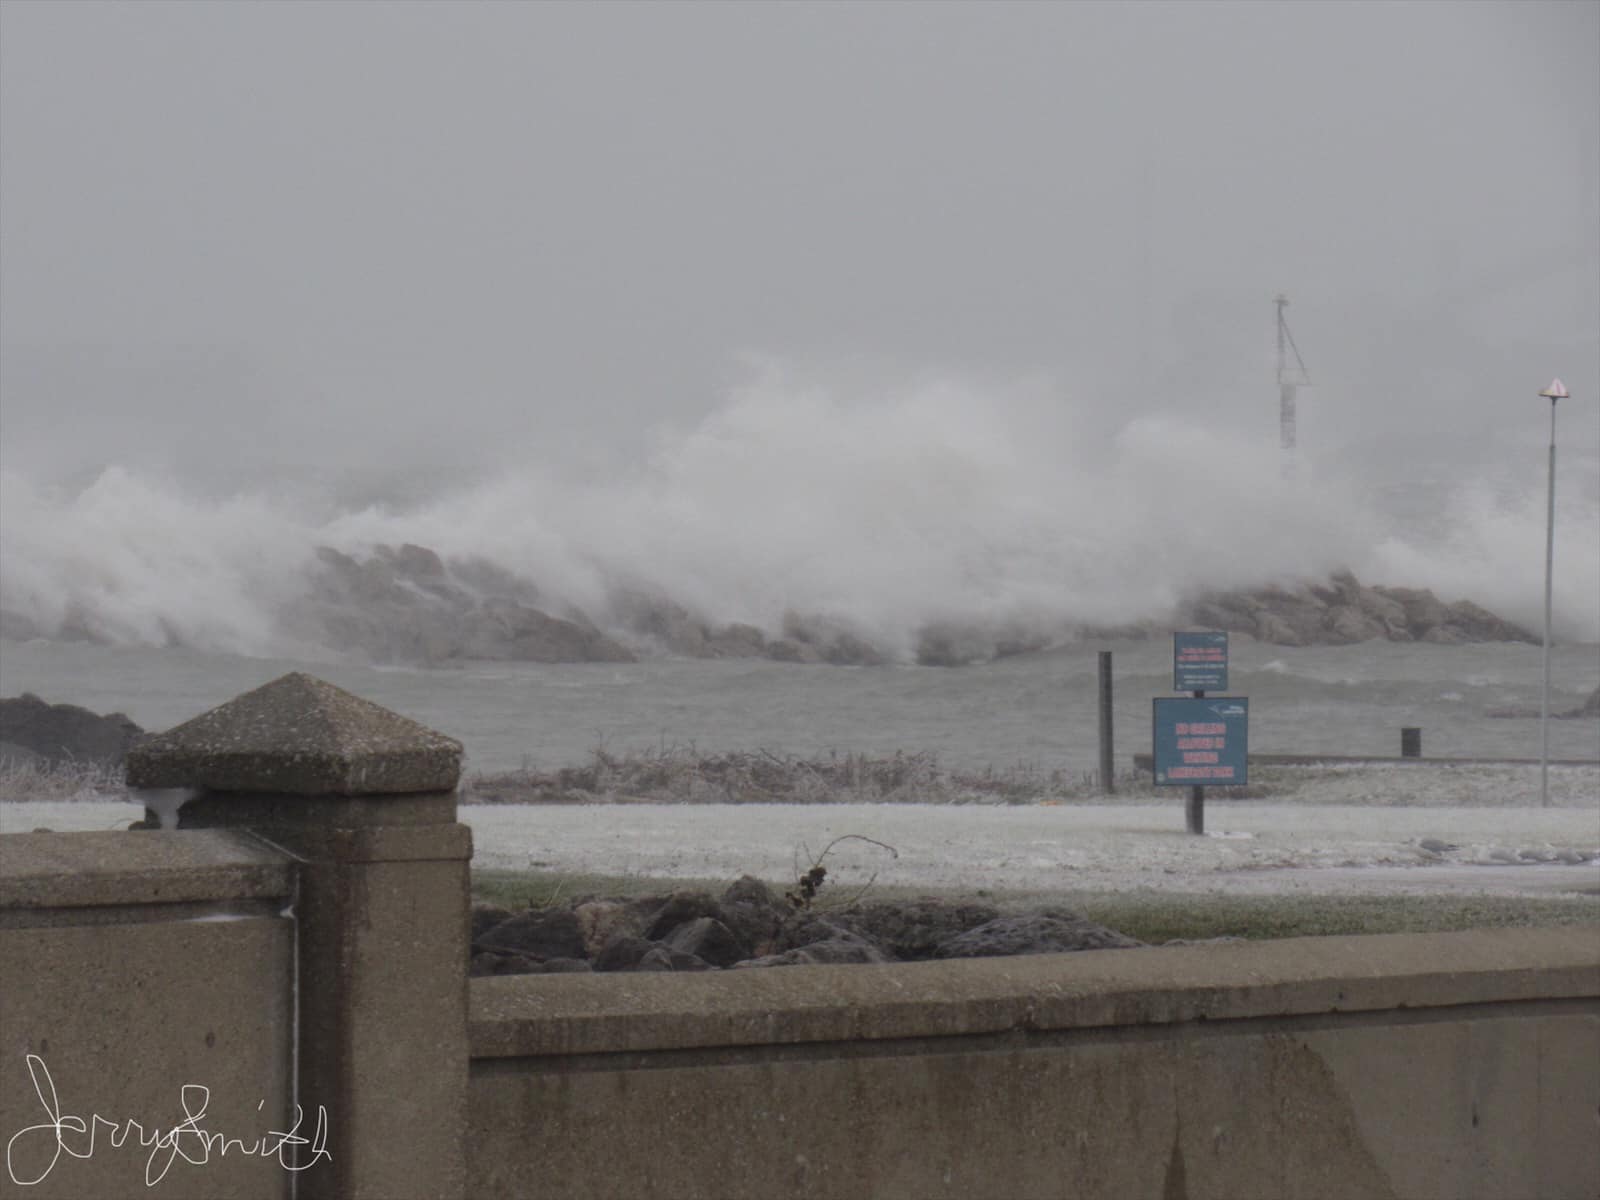
| Photos of Whiting, IN from Jerry Robert Smith on Nov 11, 2019 | ||
.jpg) |
%20(1).png) |
%20(1).png) |
| Webcam view of wave action during Nov 30, 2019 | Lakefront Bike Path at Schiller looking South Nov 30, 2019 | Lakefront Bike Path at Schiller looking North on Nov 30, 2019 |
| Two right photos of Chicago, IL from Chicago Office of Emergency Management and Communications on Nov 30, 2019 | ||
 |
 |
 |
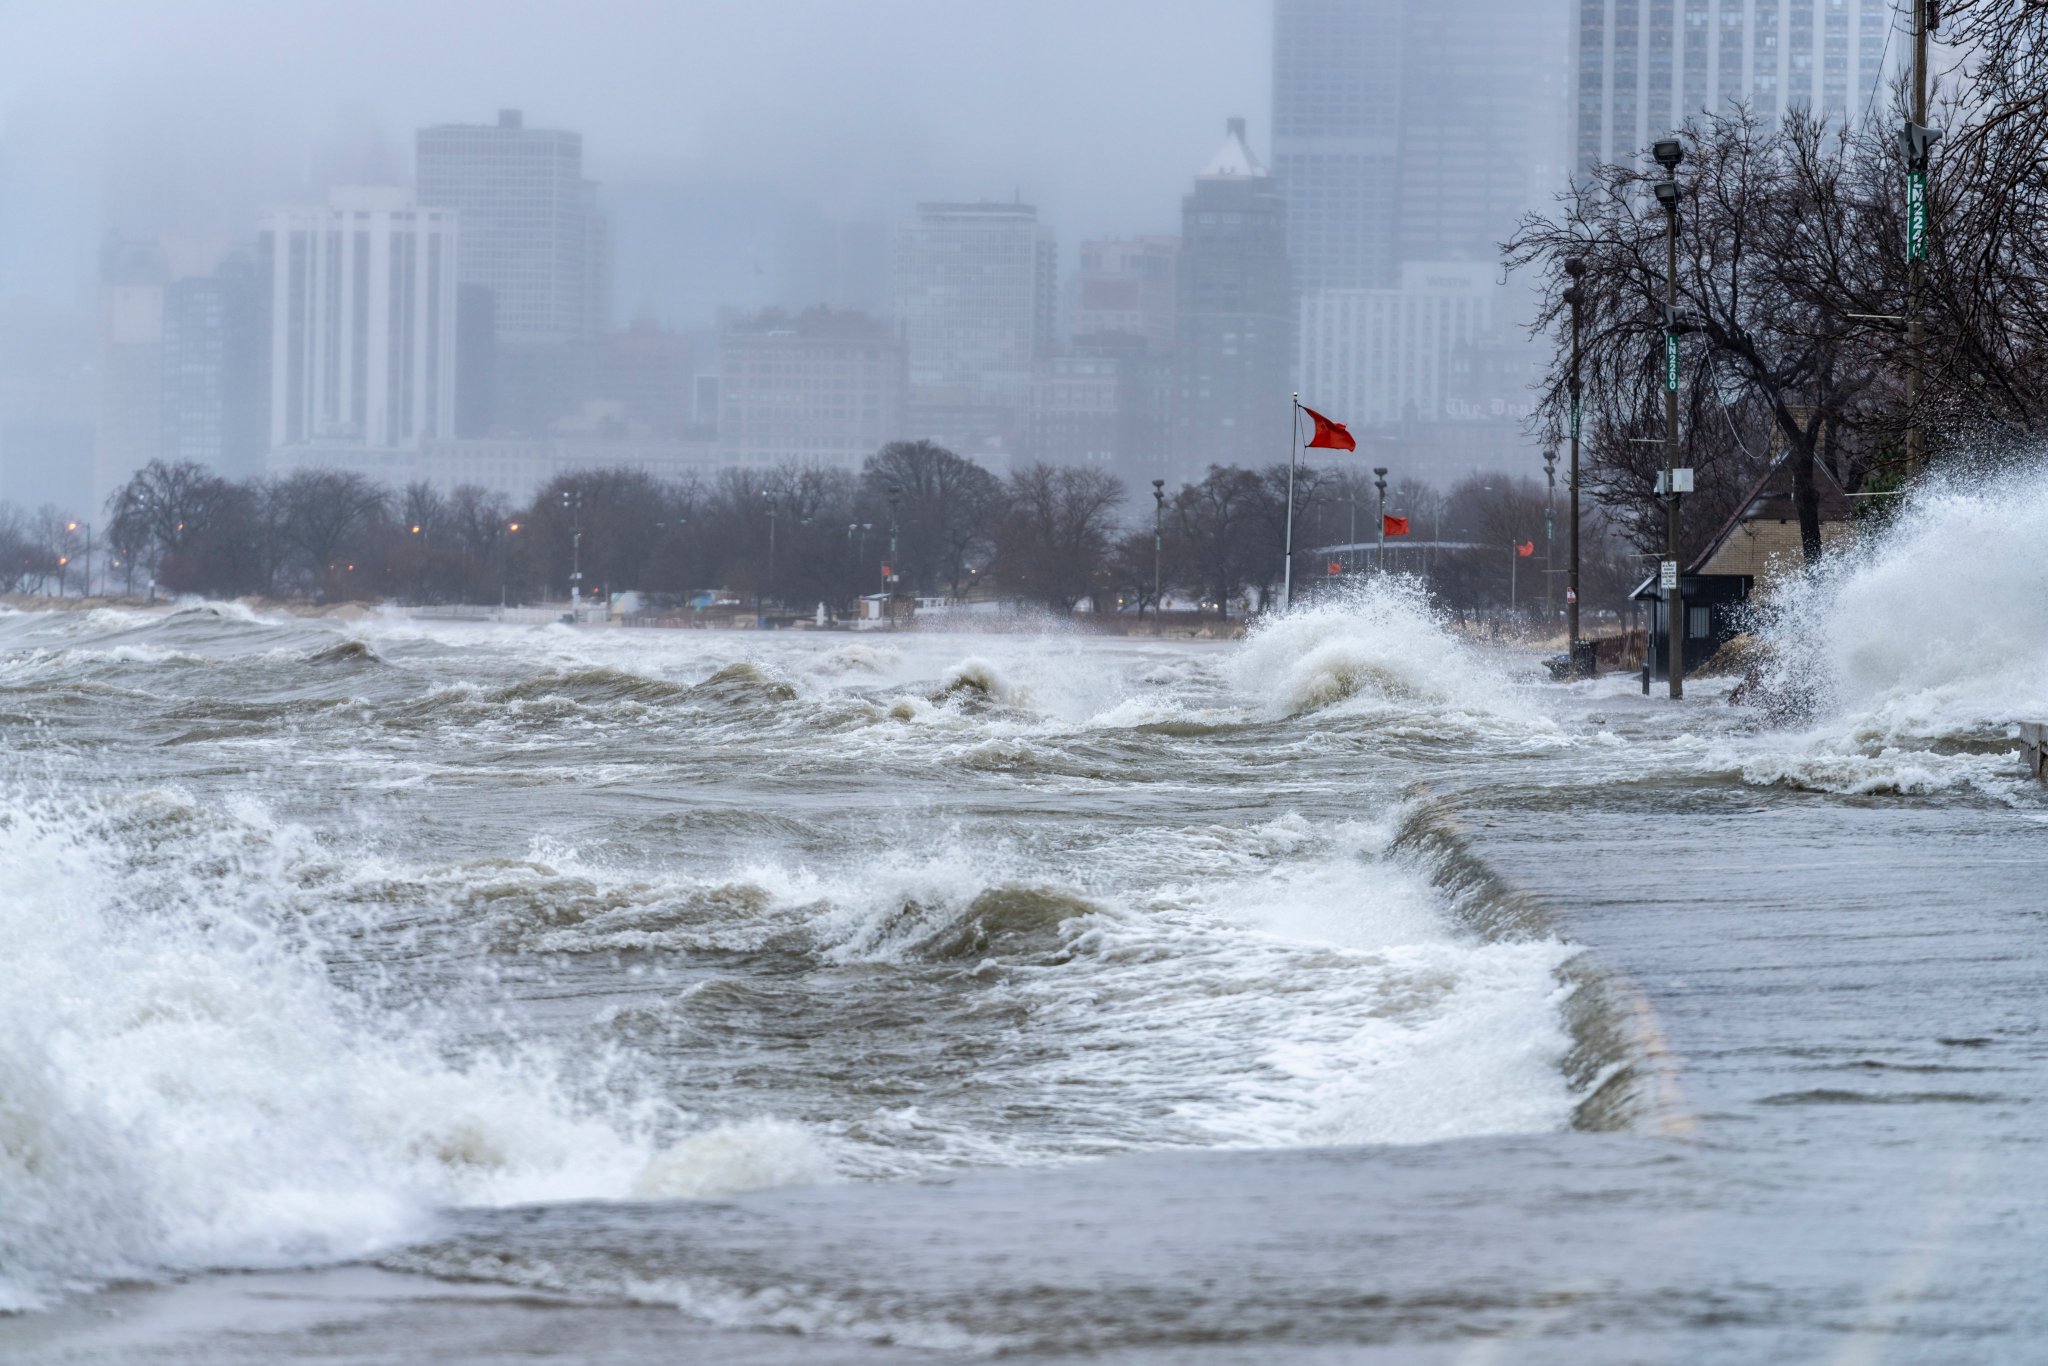
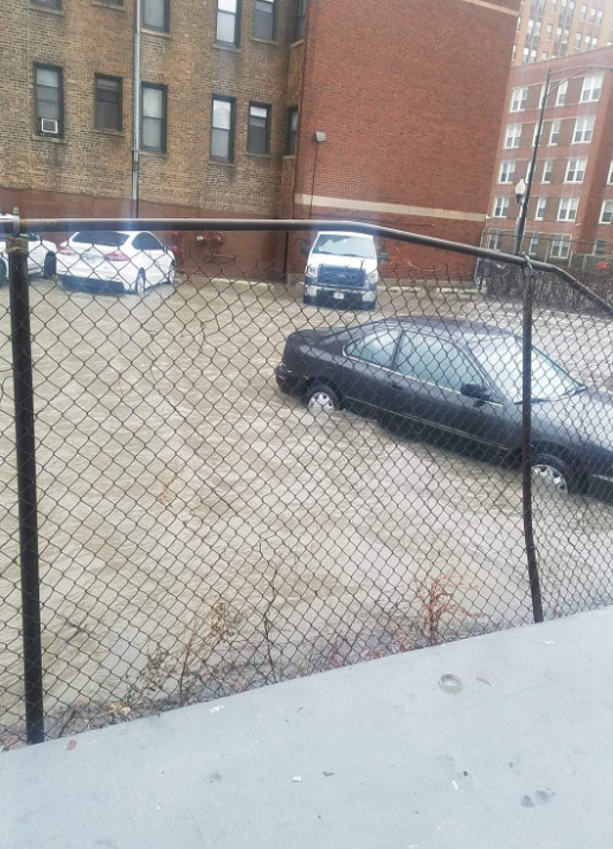
| Chicago, IL on Jan 11. Photo courtesy of Matt Zuro. | Near South Shore Drive in Chicago, IL on Jan 11. Photo courtesy of Bill Snyder. | Whihala Beach in Whiting, IN. Photo courtesy of Deb Mann. |
| Photos from January 11, 2020. | ||
Videos
| Video 1 | Video 2 | |
| From Whiting Lakefront Park on November 11, 2019, courtesy of Jerry Robert Smith. | ||
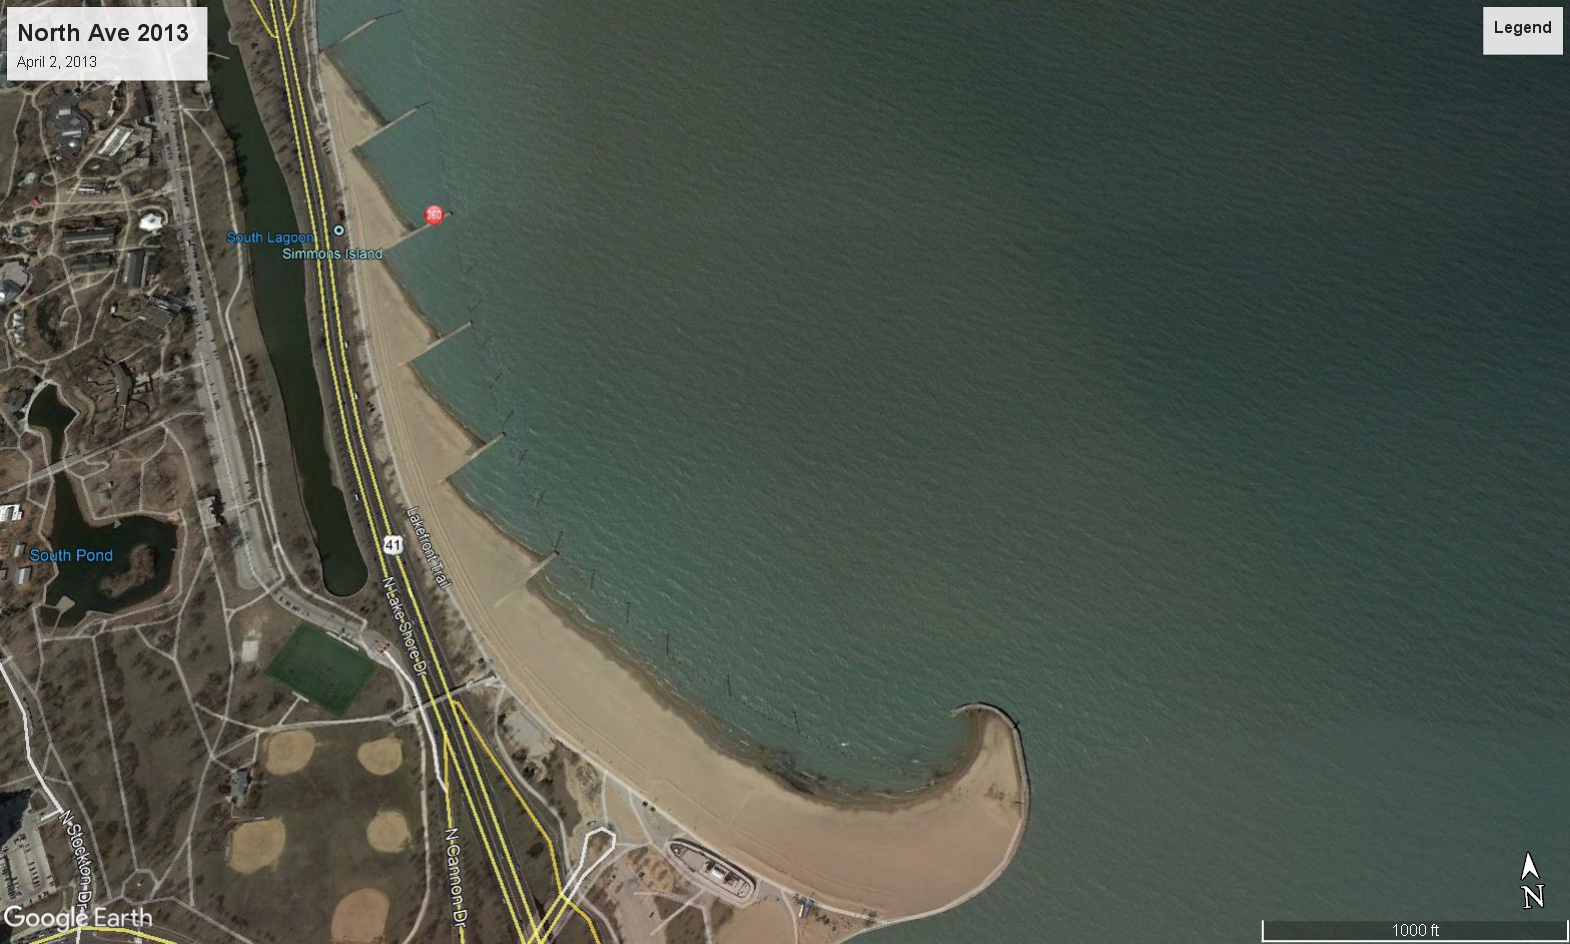
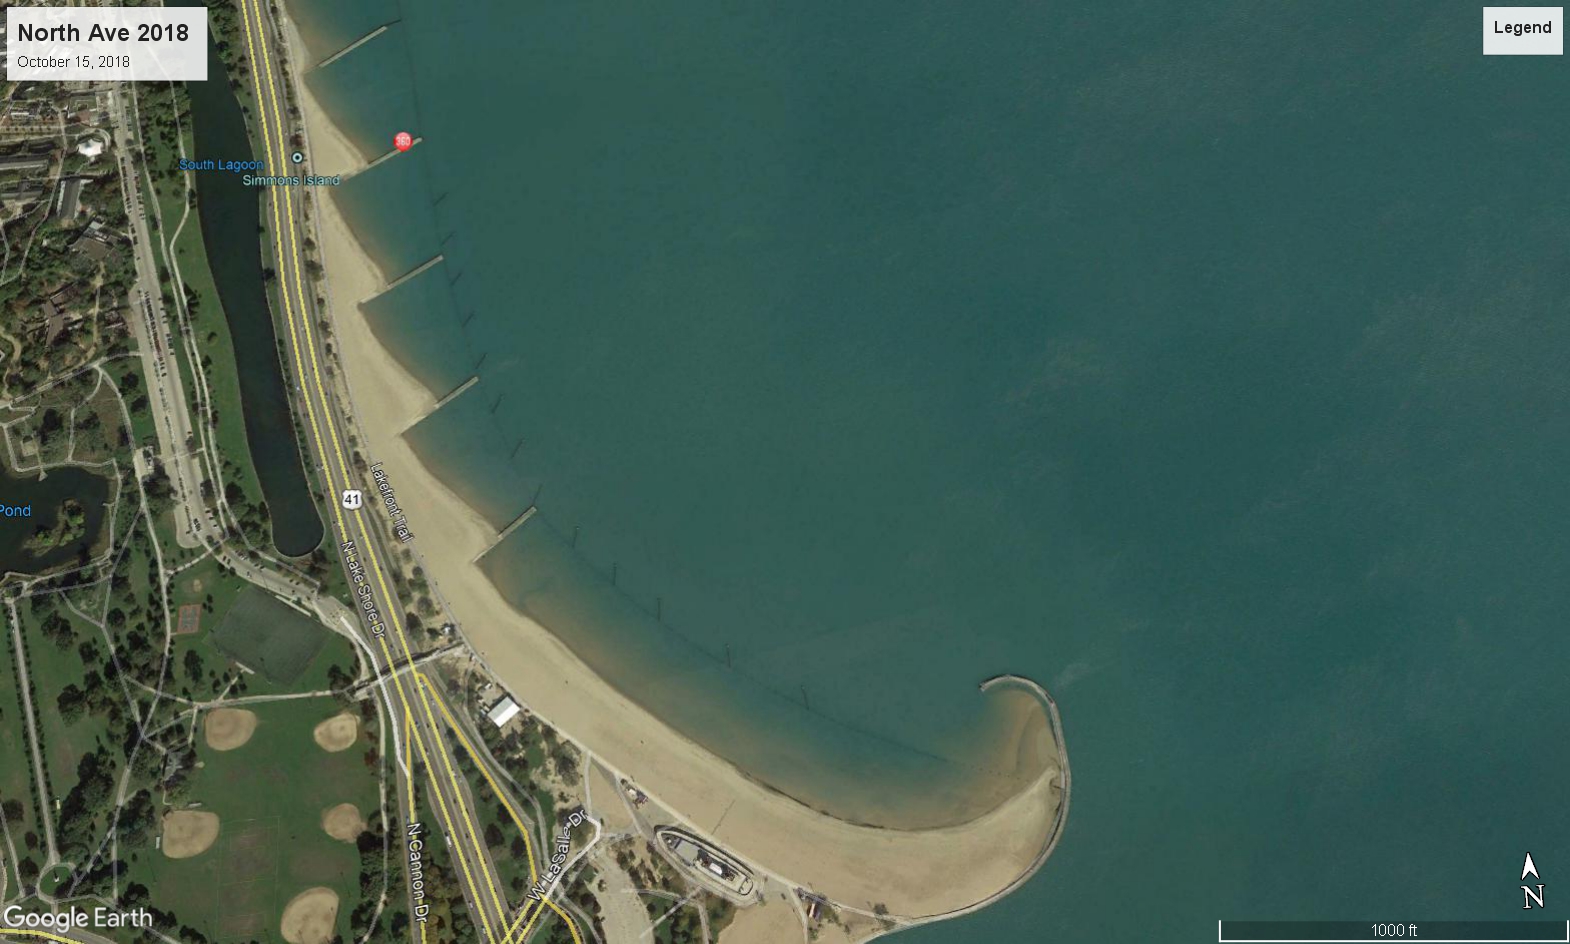
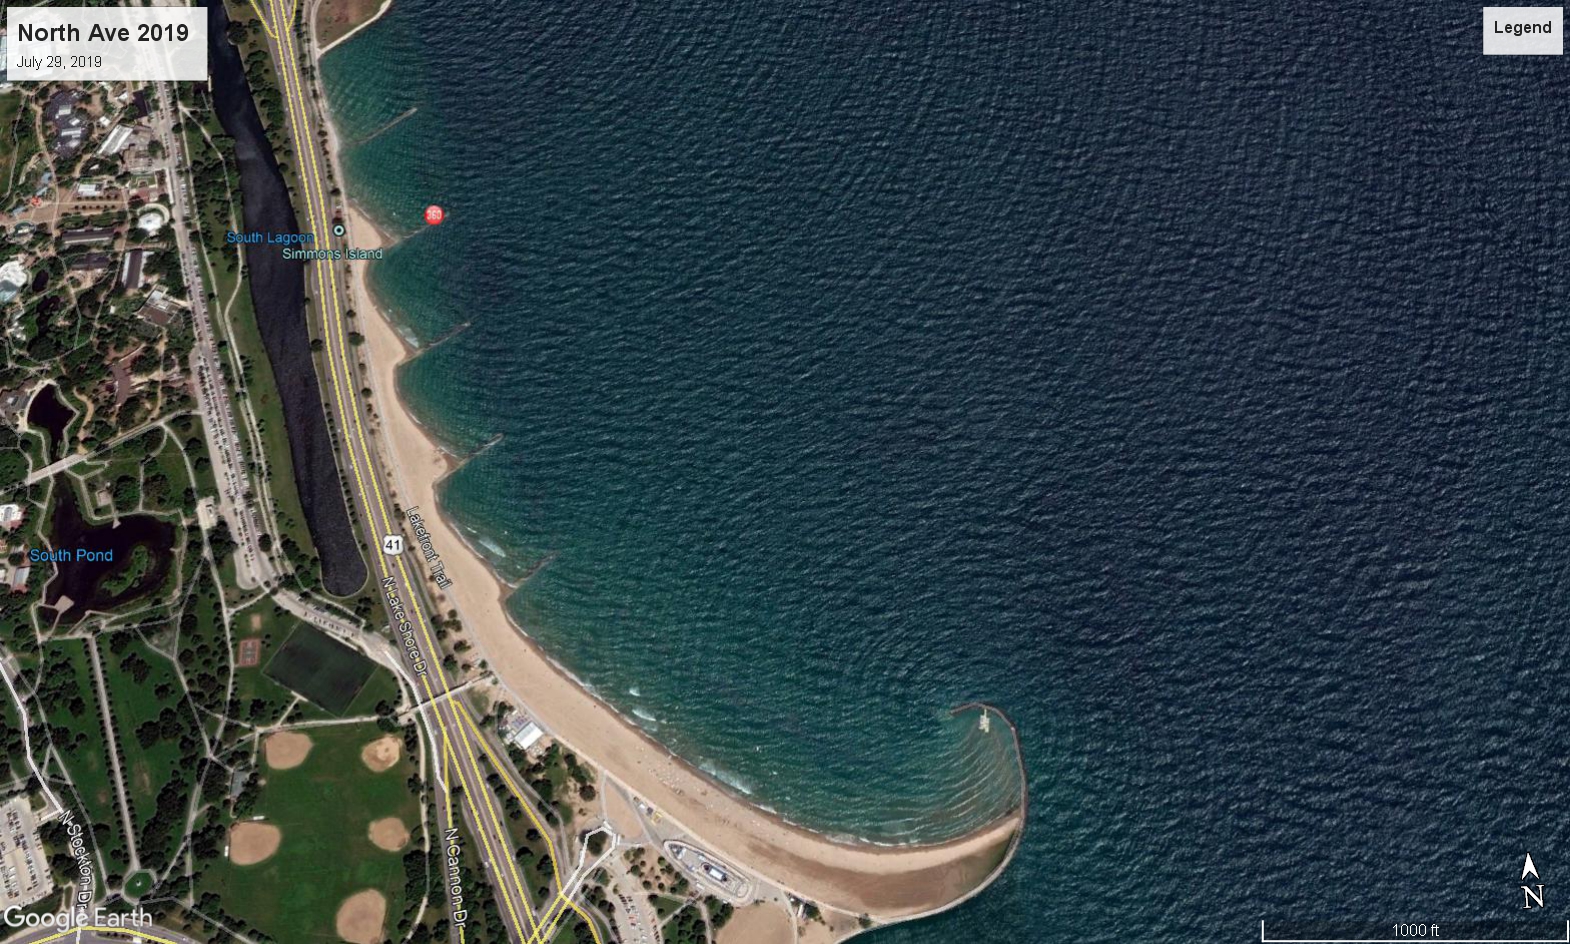
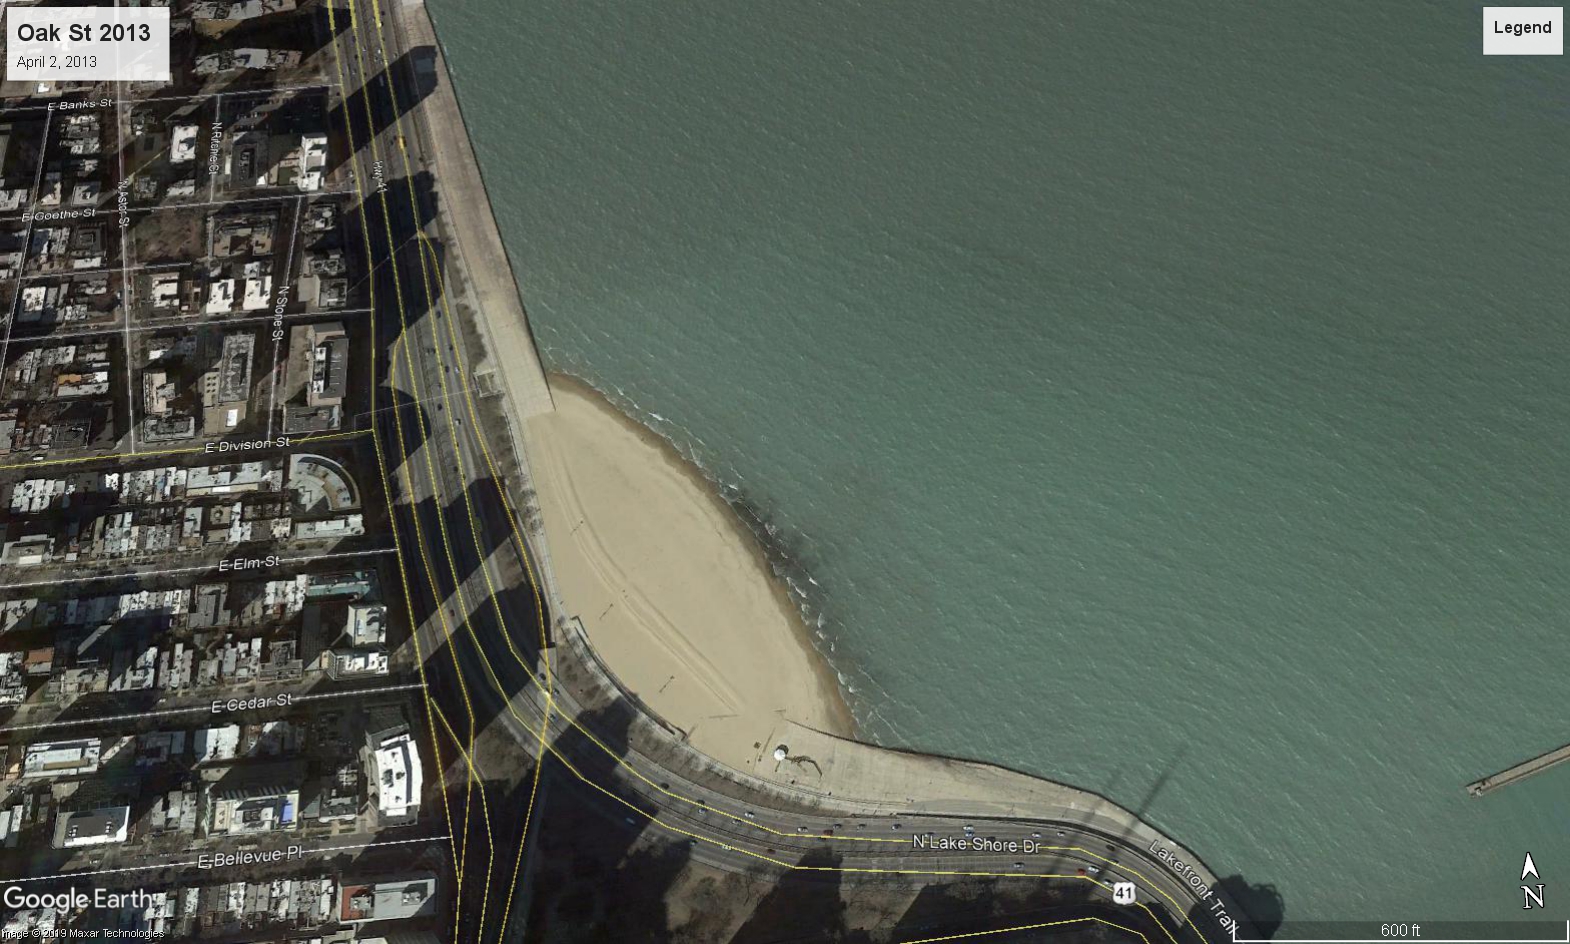
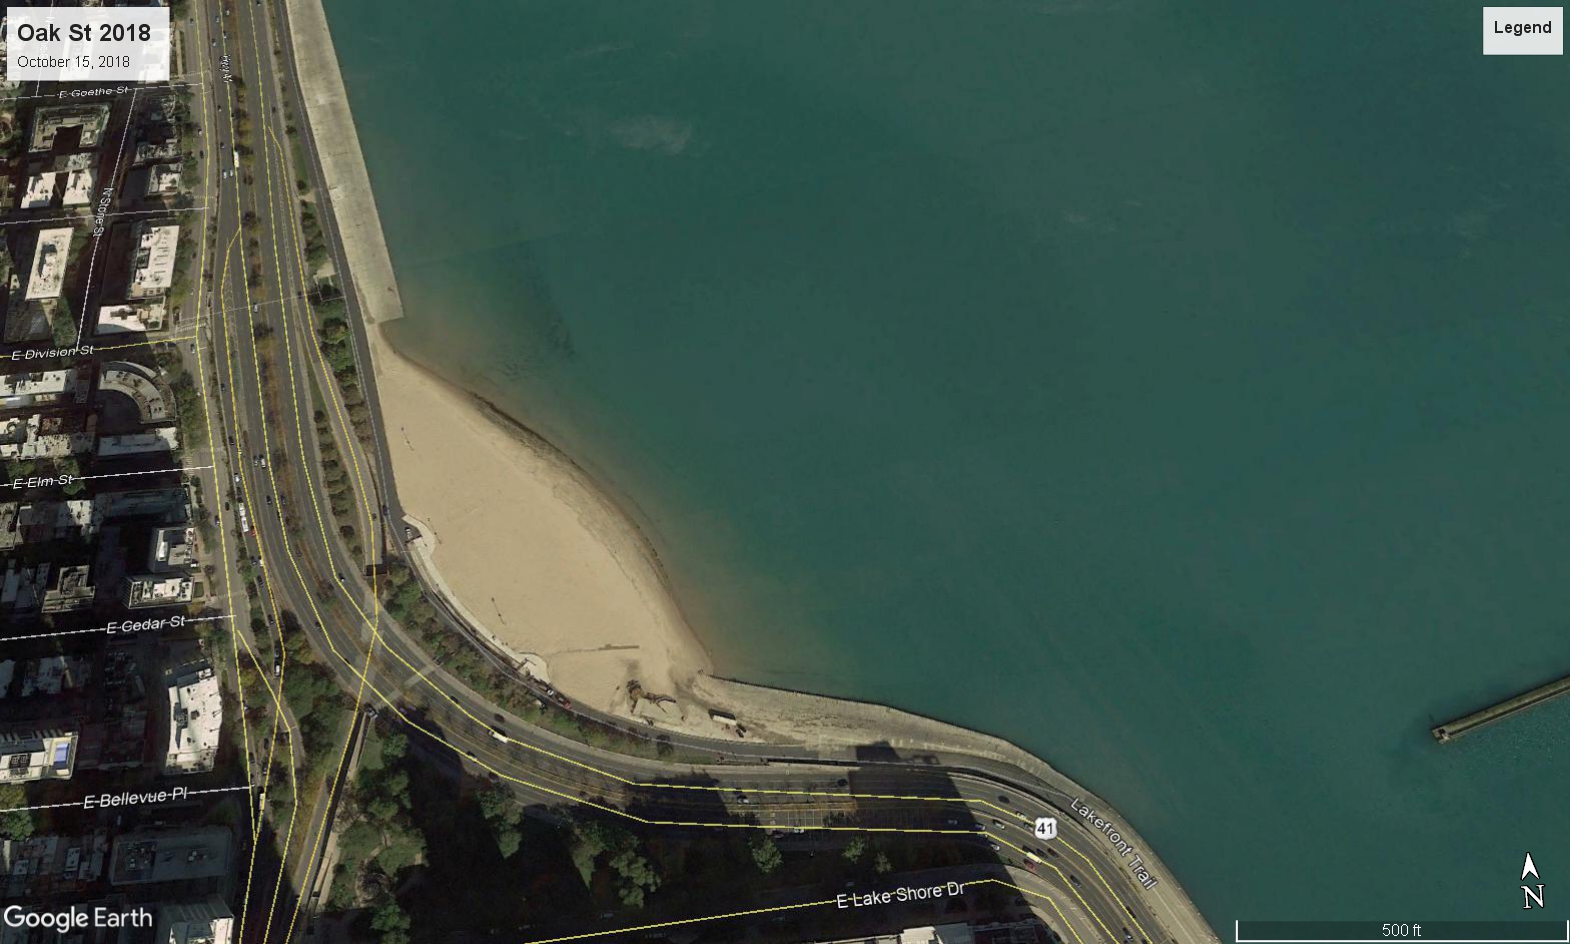
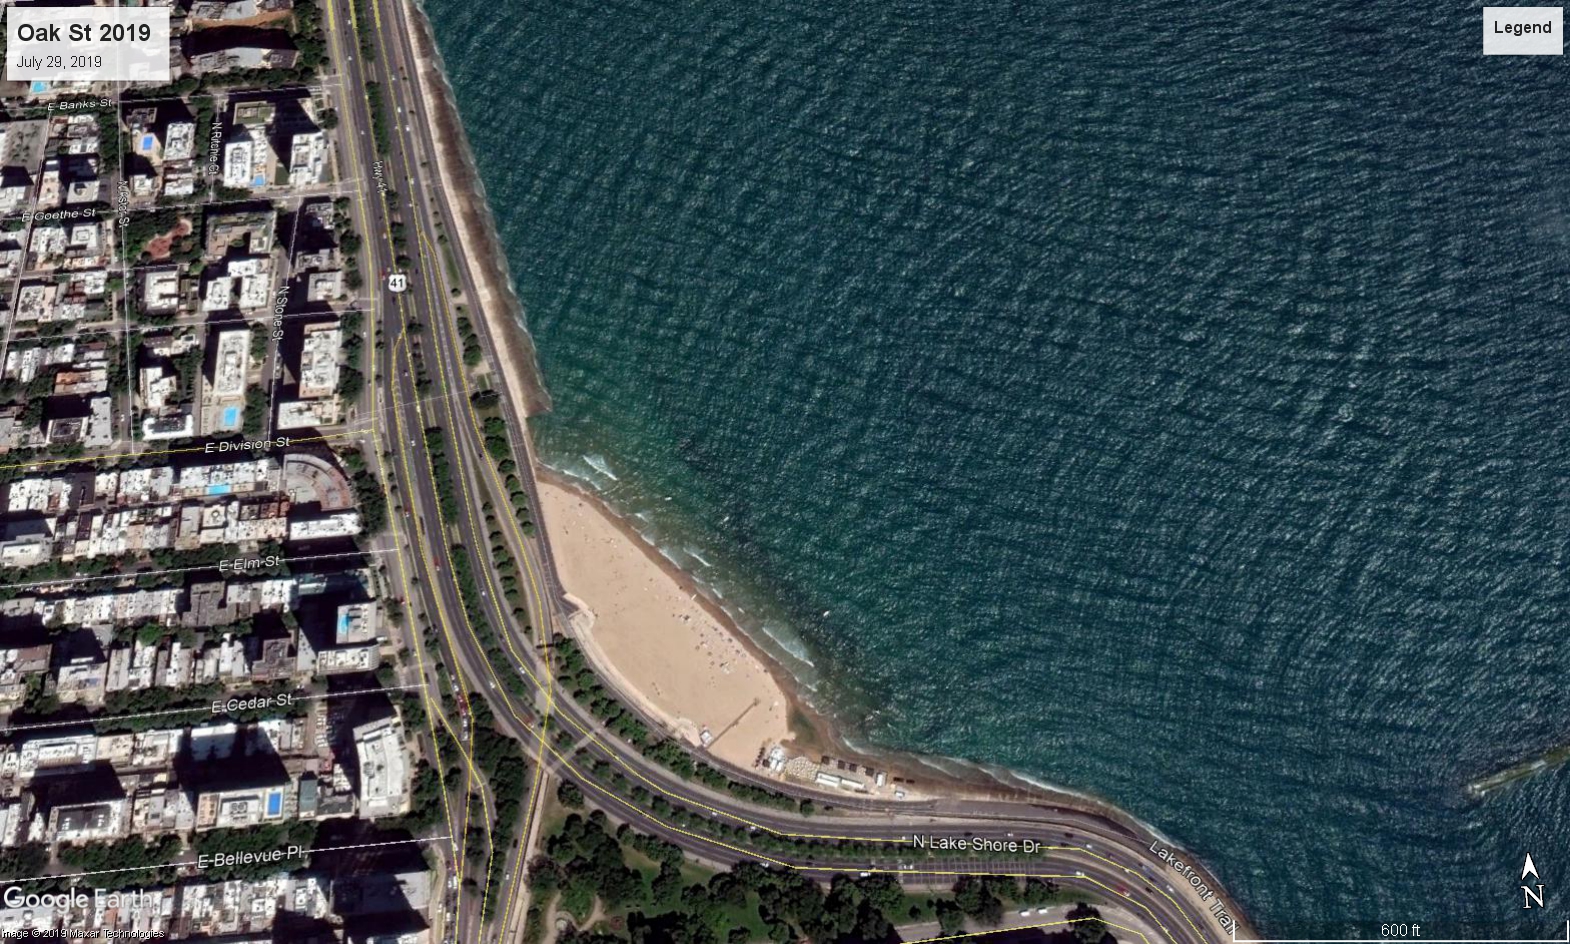
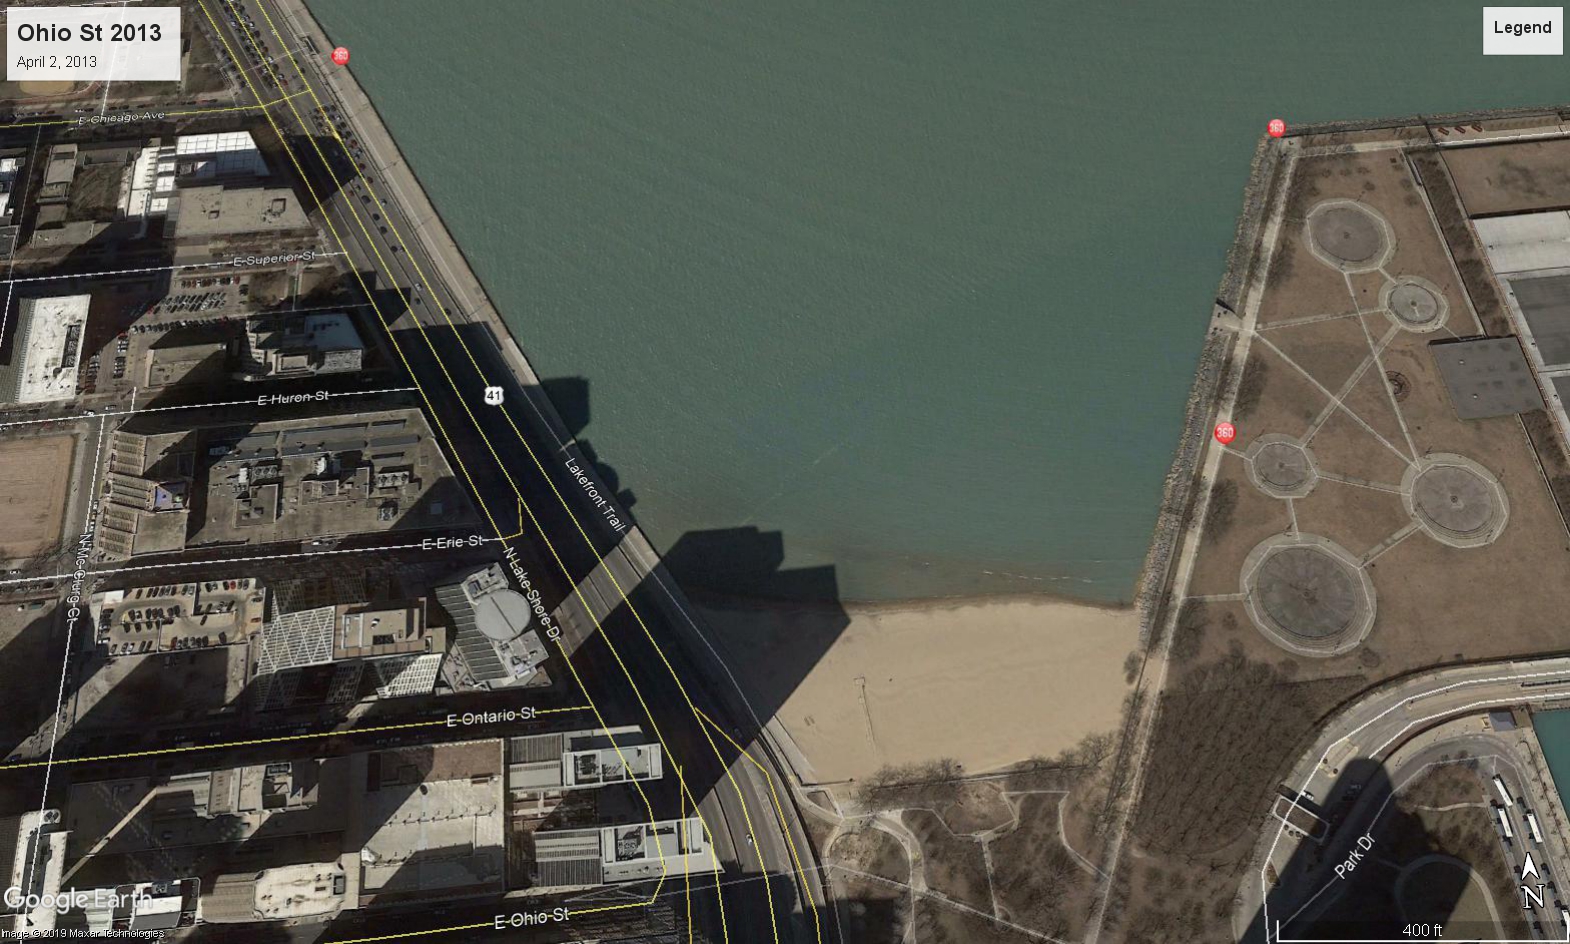
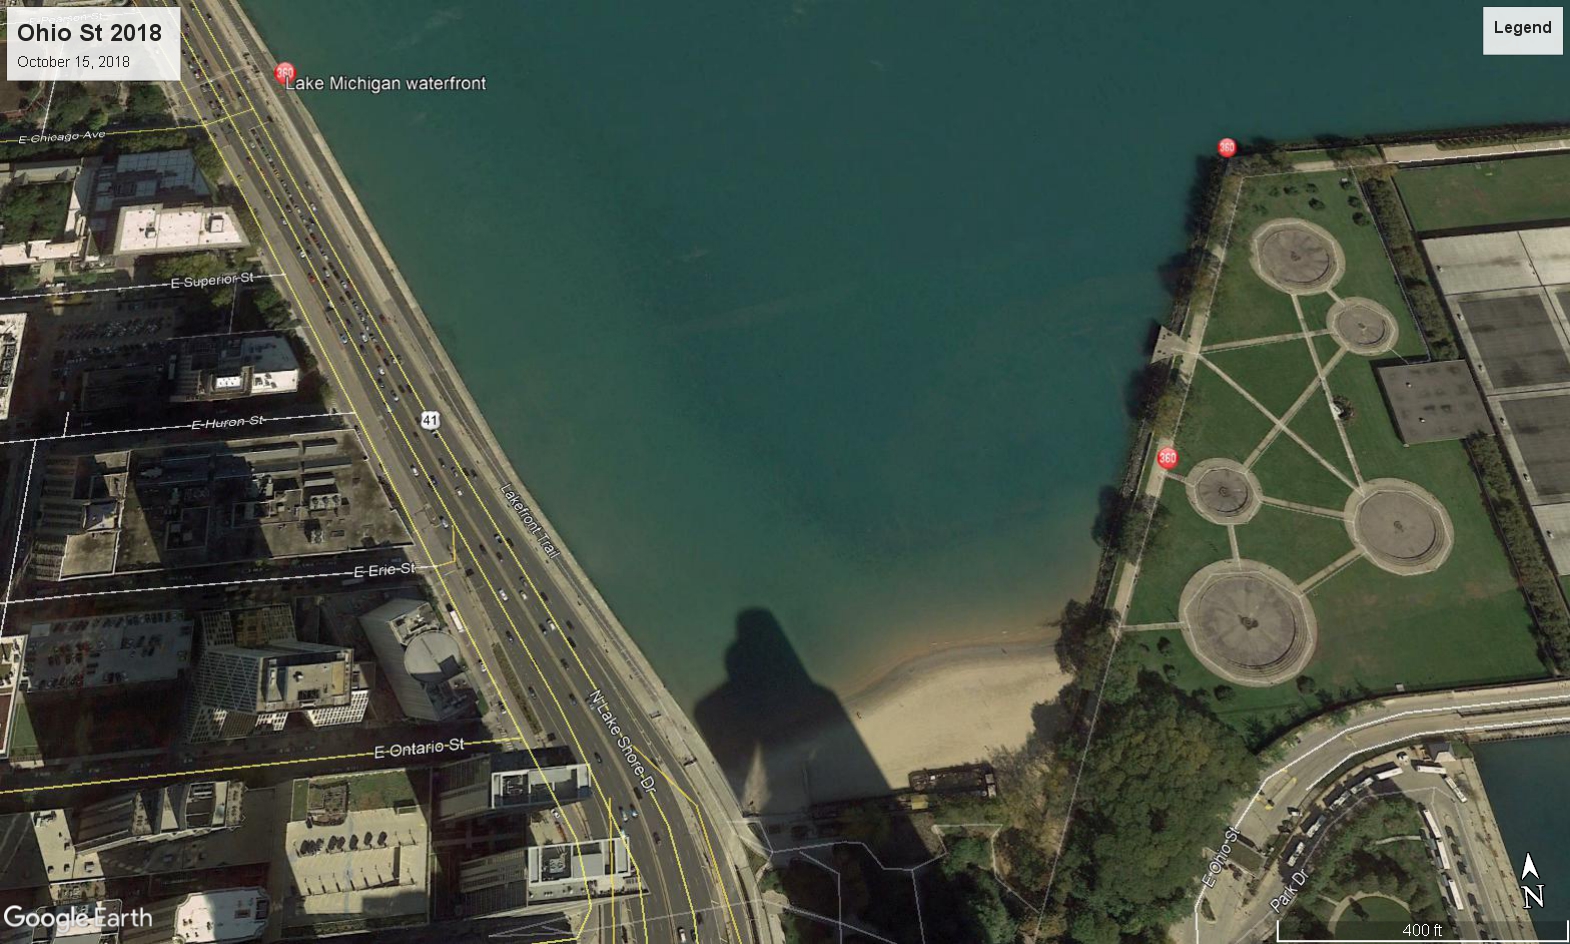
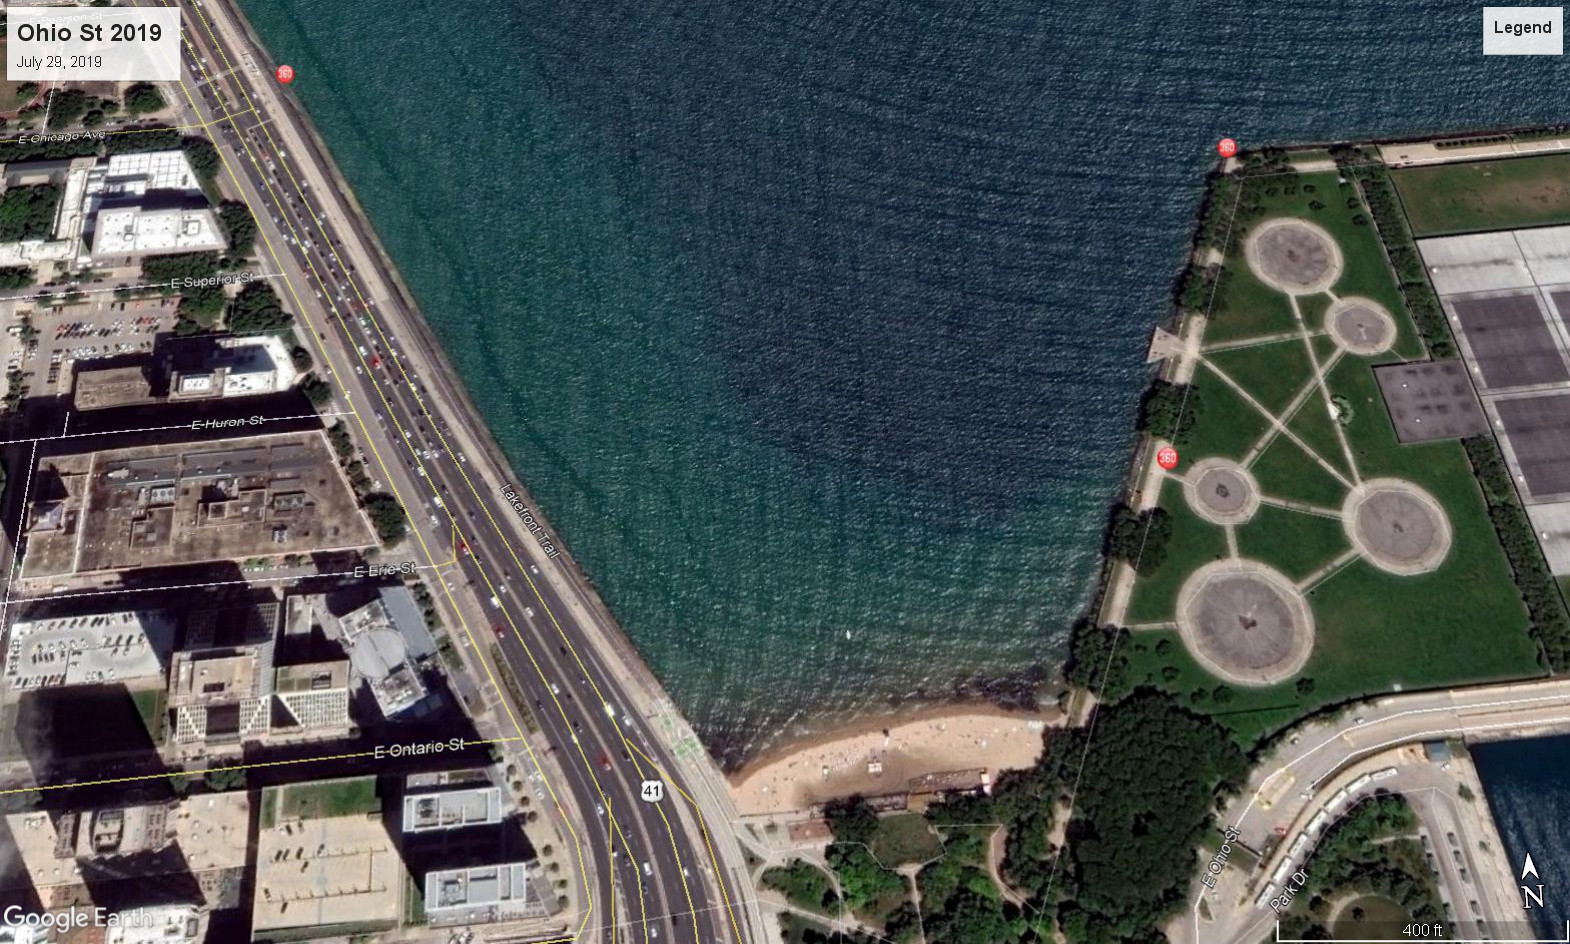
Satellite Imagery
 |
 |
 |
||||
| North Avenue Beach | ||||||
 |
 |
 |
||||
| Oak Street Beach | ||||||
 |
 |
 |
||||
| Ohio Street Beach | ||||||
Potential Inland Inundation
More Lake Michigan water level impacts can be found in our past news stories
Factors Affecting Lake Levels
Great Lakes water levels are based upon a combination of multiple factors, including precipitation, evaporation, river flow into the lakes, river flow out of the lakes, and other diversions. The primary driver of water levels are precipitation, evaporation, and river flow into the lakes, also referred to as "net basin supply." The long term trend for both precipitation and evaporation has been upward over the last several decades.
More information about factors affecting lake levels is available from the US Army Corps of Engineers.
 |
Media use of NWS Web News Stories is encouraged! Please acknowledge the NWS as the source of any news information accessed from this site. |
|

