|
 |
To determine the relative risk of spring flooding, numerous factors are considered including snow cover, soil moisture, and current river conditions. A significant snow cover with high water content can increase the chances of flooding once warmer weather melts the snow. Elevated soil moisture conditions reduce the amount of rainfall that is soaked up by the ground and increase the amount of water that then runs off into area streams. Above average river levels reduce the river rise required to reach flood stage, while below average river levels would require an increased amount of river rise to reach flood stage.
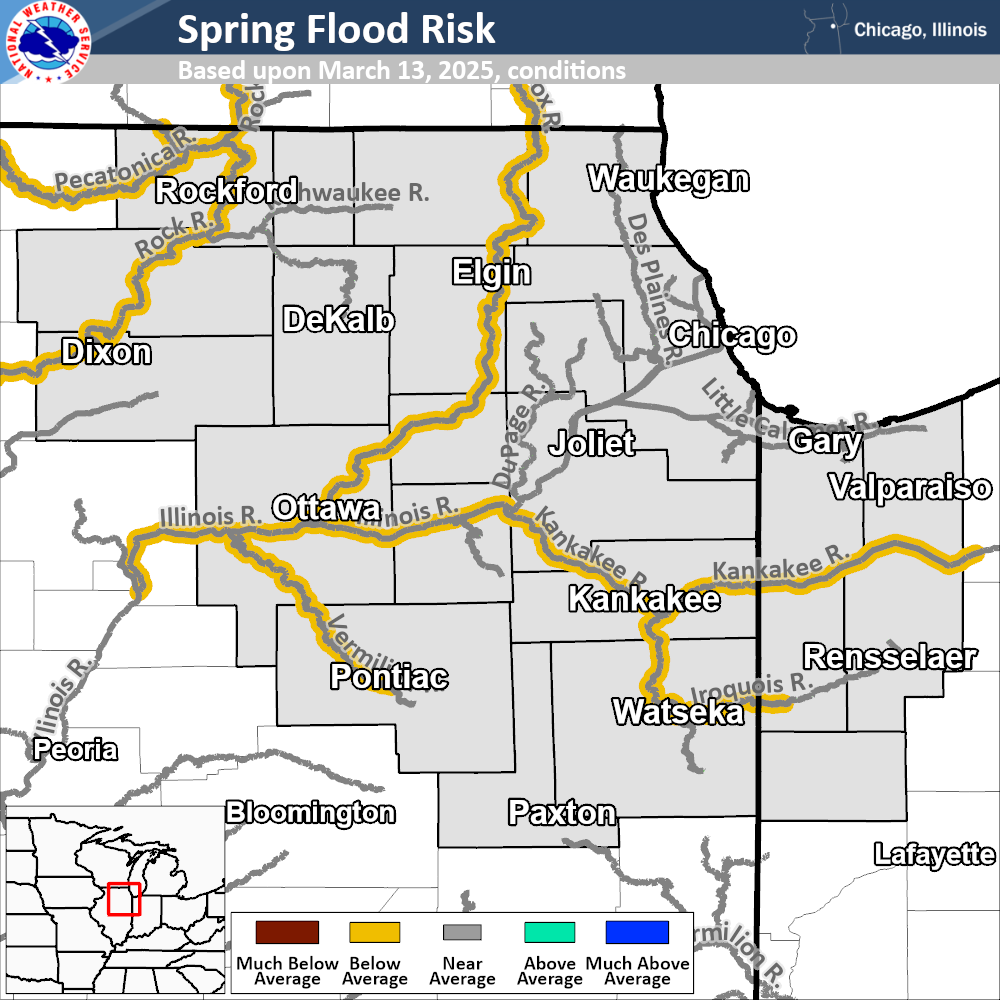
Here is a general overview of spring flood risk factors across northeast Illinois and northwest Indiana river basins.
| Risk Factor | Has effect on... | Current Condition | Effect on Flood Risk |
| Fall & Winter River Levels | Space in river for additional streamflow. | Below Average to Near Average | Decrease |
| Soil Moisture | Space in soil for additional infiltration. | Below Average to Near Average | Decrease/No Effect |
| Soil Frost Depth | Frost depth, the possibility that infiltration could be blocked by frozen ground. | None | No Effect |
| River Ice Conditions | Possibility of break-up ice jam flooding. | No Ice Cover | No Effect |
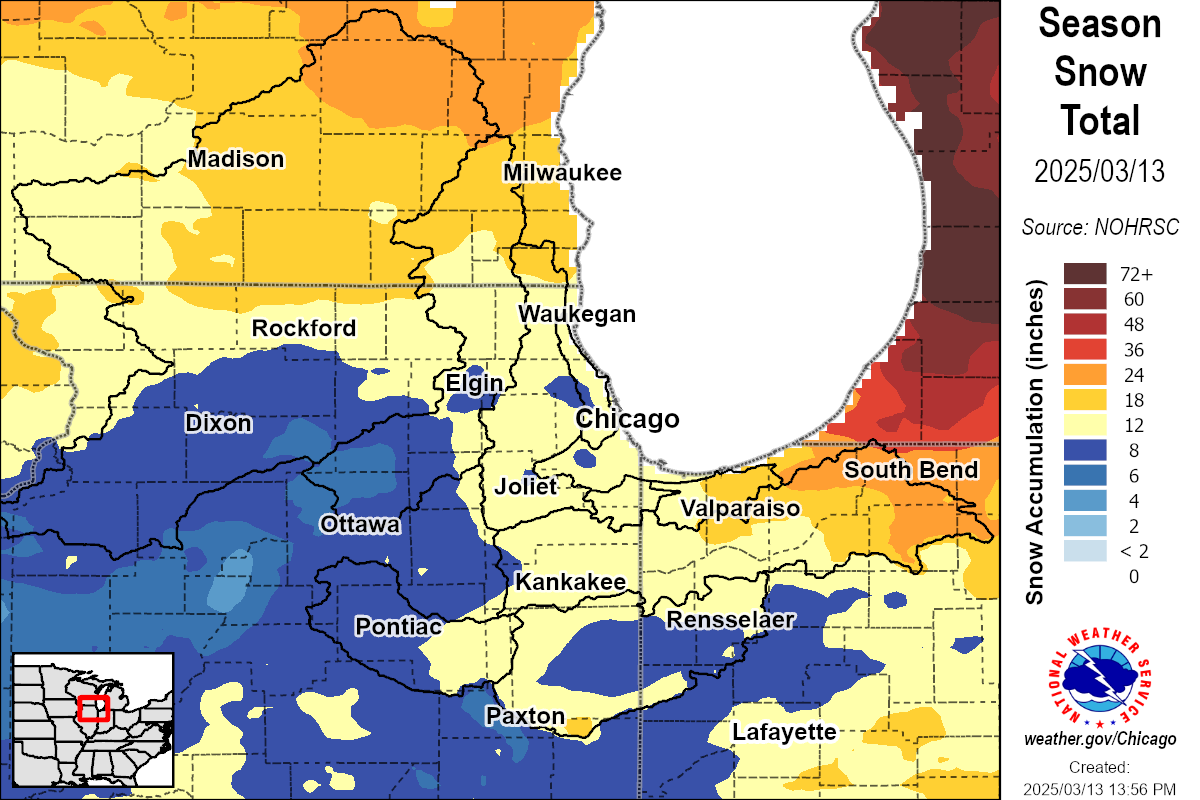
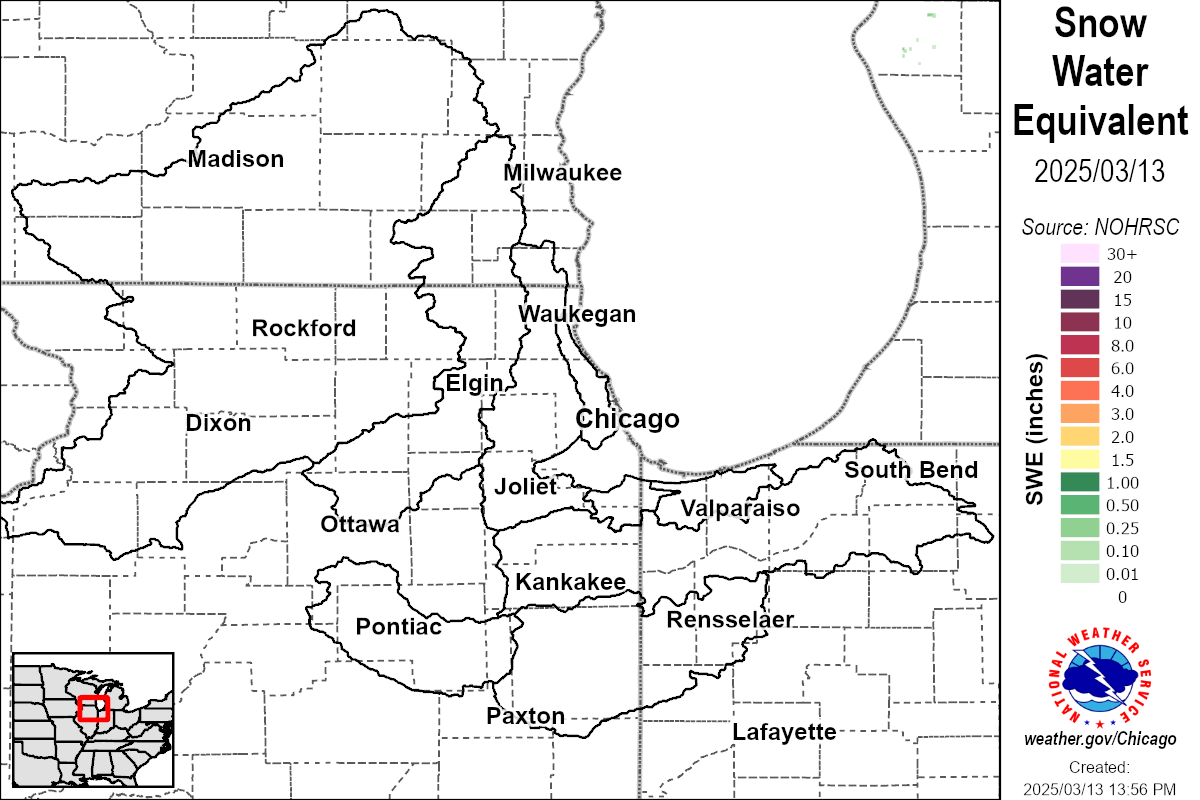
| Snow Cover | The amount of water available for spring melt. | Little to None | Decrease |
| Spring Precipitation |
Amount of water headed to area rivers. | - | TBD |
| Spring Temperatures | Rate of melt for snow cover. | - | TBD |
Valid March 12, 2026.
Little to no snow cover exists across area river basins. Snowfall may still occur in March and April, which could affect future flood risk.

Valid March 12, 2026. Click here for the latest snow cover information.
Modeled soil moisture values across the area range from near average to much below average.
No frozen ground is present across the area.
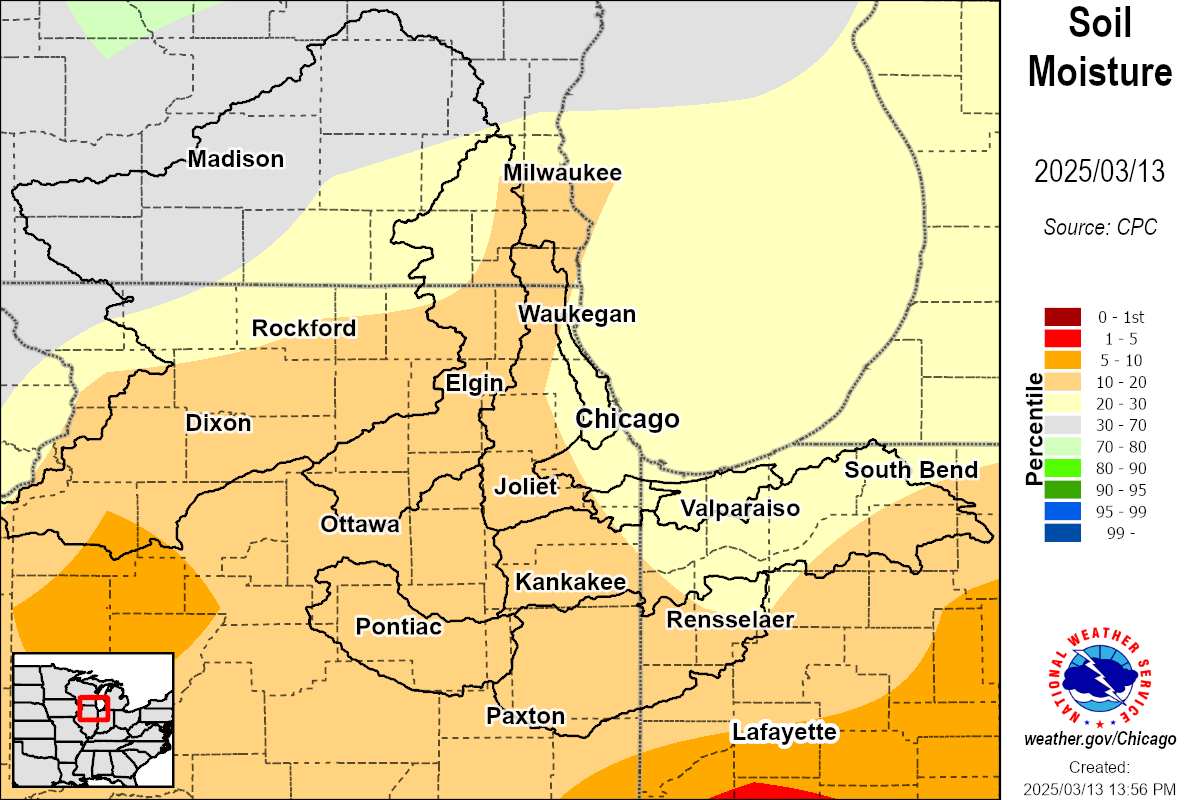
Valid March 12, 2026. Click here for the latest soil moisture information from the Climate Prediction Center.
River streamflow across the area ranges from below average to near average.
River ice spotters, river gauges, and satellite imagery indicate no ice cover on area rivers.
Valid March 12, 2026. Graphics update daily. Click here for the latest streamflow conditions from the USGS. Click here for the latest river ice spotter reports.
The long term (next several weeks) outlook from the Climate Prediction Center indicates no strong signal for above or below average precipitation.
Although snow cover, soil moisture, and recent river levels can provide some indication of the relative risk of spring flooding, any weather system that produces heavy rainfall could cause flooding. Spring flood outlooks are not able to assess the risk of flooding due to heavy rainfall more than a week or so in advance.
Relative flood risk for river forecast locations can be viewed on the National Water Prediction Service (NWPS) page for our area.
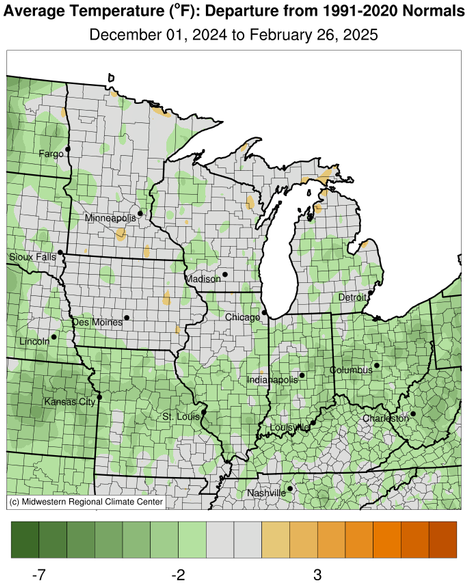
Temperature
|
 |
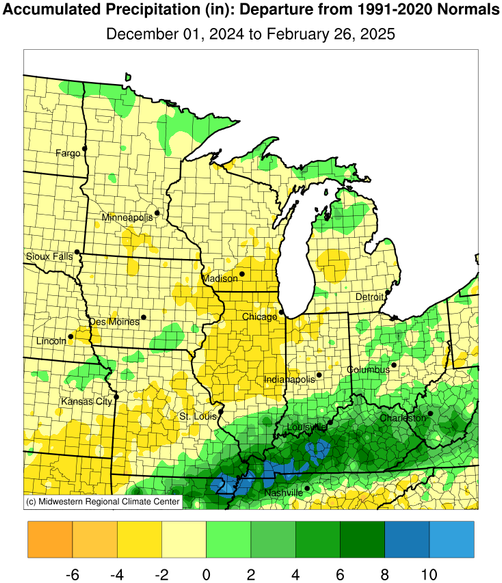
Precipitation
|
 |
Snowfall
|
|