
Numerous severe thunderstorms are expected across a broad region from the Ohio Valley to the Mid-Atlantic and Northeast States today into tonight. Swaths of damaging wind gusts are expected and some tornadoes are possible. Bertha is expected to bring tropical storm conditions to portions of the Gulf Coast from the Florida Panhandle westward to southeastern Louisiana later today and Wednesday. Read More >
Lubbock, TX
Weather Forecast Office
|
|
|||||
|
|
|
|
|
|
|
|
|
Days
|
Hours
|
Minutes
|
Seconds
|
|
|
Countdown to a Record 2011 |
|
|
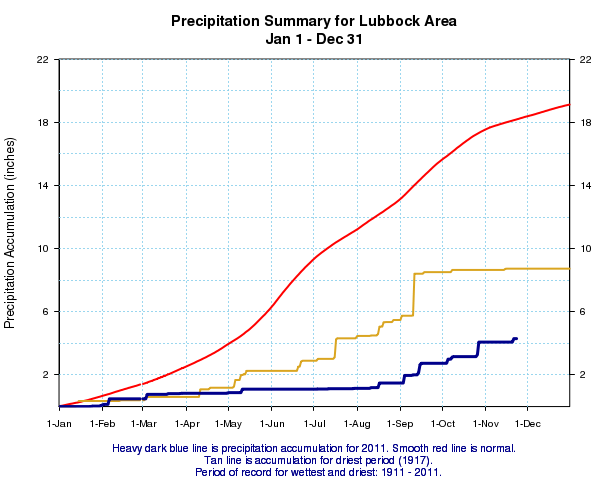
| Plot of precipitation accumulation at Lubbock through November 23rd, 2011 (blue). Also plotted is the normal yearly precipitation distribution (red) and the driest year (brown) ever on record for Lubbock. |
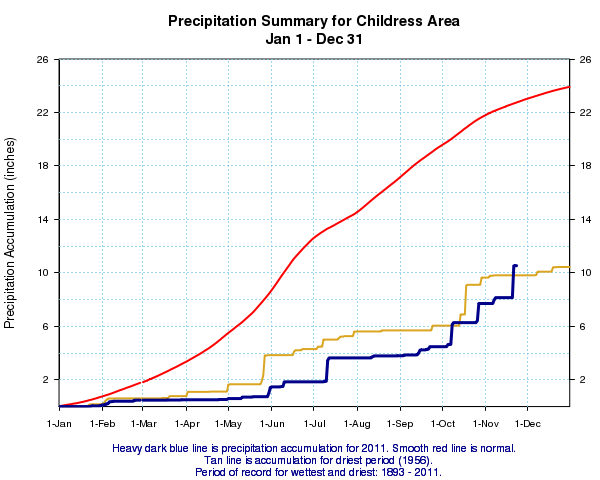 |
| Plot of precipitation accumulation at Childress through November 23rd, 2011 (blue). Also plotted is the normal yearly precipitation distribution (red) and the driest year (brown) ever on record for Childress. |
|
|
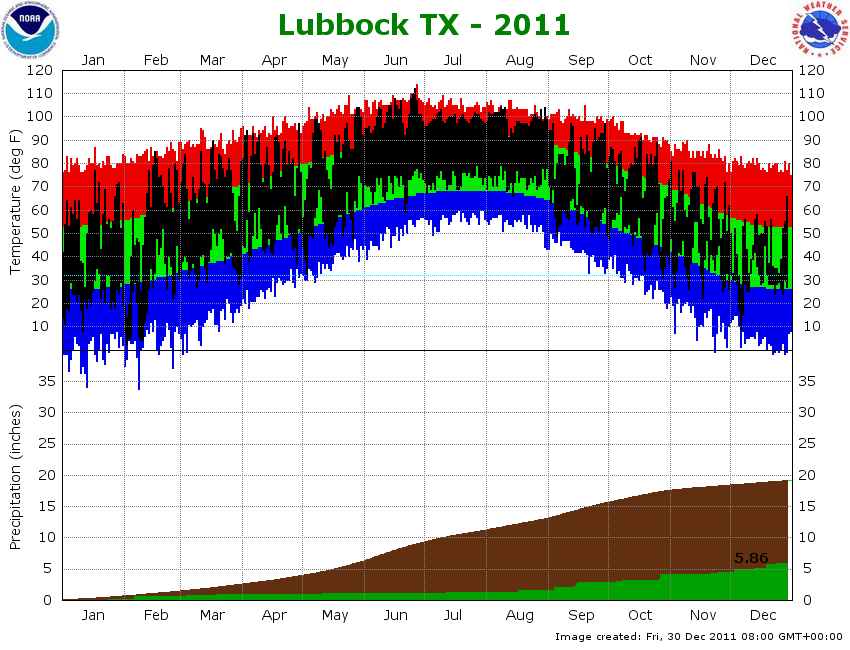
| Graphs displaying the observed temperature (black) and precipitation (green) at Lubbock so far this year. Also plotted are the normal temperatures (green), record highs (red), record lows (blue) and normal precipitation (brown). Click on the graph for a larger view. |
|
|
| Graphs displaying the observed temperature (black) and precipitation (green) at Childress so far this year. Also plotted are the normal temperatures (green), record highs (red), record lows (blue) and normal precipitation (brown). Click on the graph for a larger view. |
US Dept of Commerce
National Oceanic and Atmospheric Administration
National Weather Service
Lubbock, TX
2579 S. Loop 289
Suite 100
Lubbock, TX 79423-1400
806-745-4260
Comments? Questions? Please Contact Us.


