
A significant heat wave continues for the Rockies, Northern Plains, and Great Lakes into the Mid-Atlantic, peaking in intensity through midweek and lingering across parts of the Northern Plains and Midwest until this weekend. Excessive rainfall my bring life-threatening and locally catastrophic flash and urban flooding across portions of southwestern Texas through early Friday. Read More >
|
HYDROLOGY |
HYDROLOGY
Although weather may be the main focus of our attention, it is not our only area of responsibility. There is a Service Hydrologist (SH) position on staff at this office, who directs our local hydrology operations. The SH works in conjunction with our partners, customers, and servicing
Hydrology activities on station include collecting daily observations, monitoring river stages, and issuing river flood warnings or statements if needed. Hydro obs generally consists of high/low temperatures and amount of rainfall (if any). During the winter season, observations also include the amount of snowfall, snow depth, and the water equivalent of the snow pack.
|
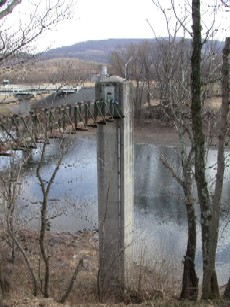
(Left: River gage at Paw Paw, WV)
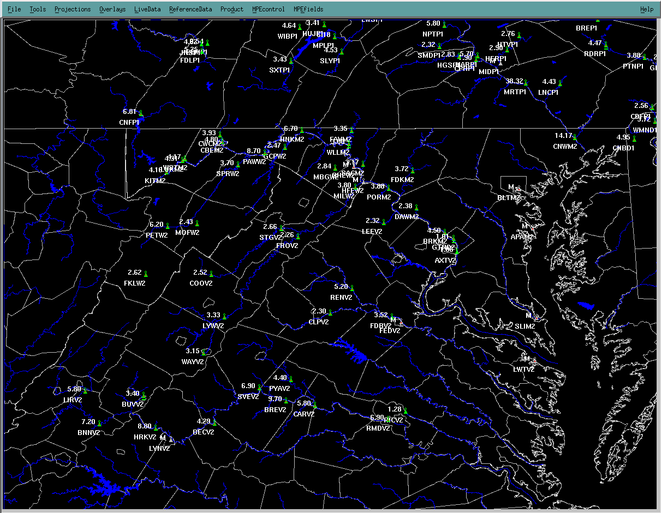
The AWIPS workstation has software for hydrology surveillance and automated product preparation. Included in this software is the ability to view river gage data, dial up precipitation gages, view flash flood guidance, and integrate this information with records and station histories to prepare statements. For instance, some of the details included could compare the river stage forecast to a previous flood event, or detail what this stage may inundate. An example of the main display screen can be seen below. Each triangle represents a river gage in our Hydrologic Service Area (HSA). The stations in green report levels below flood stage. The triangle turns yellow when action stage is reached; the station is not yet in flood, but is threatening. When a station exceeds flood stage, the triangle turns red.
|


 Coastal Flood
 FAQ
FAQ