
Scattered strong to severe storms capable of sporadic large hail and severe winds are expected this afternoon and evening across portions of western Texas. Widespread showers and thunderstorms may produce isolated flash flooding across the Ozarks today and the Southeast into next week. Read More >
| Snow Accumulation Potential
Experimental - Leave feedback
|
||
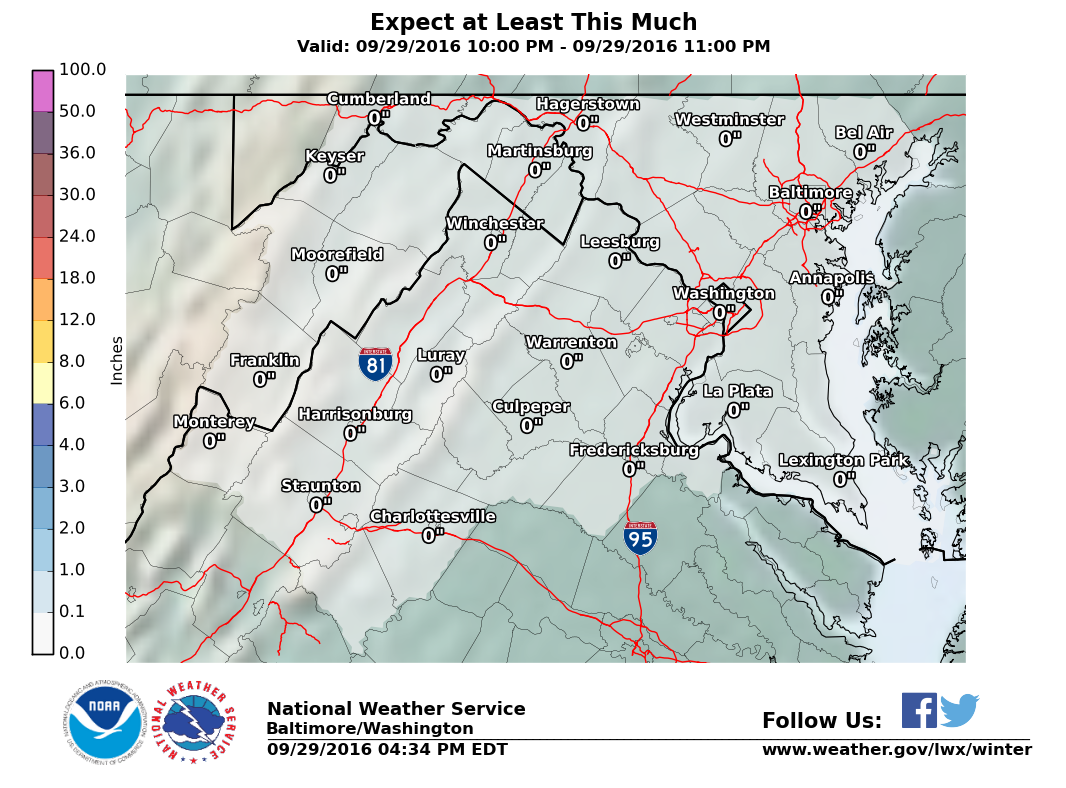
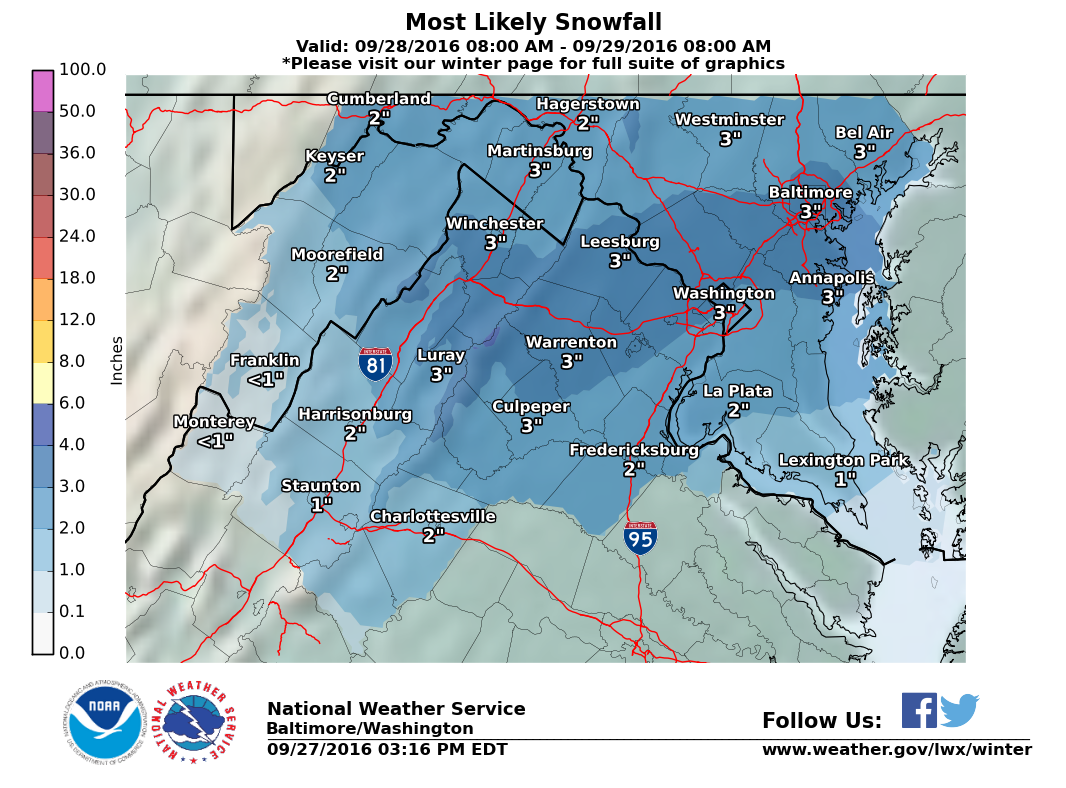
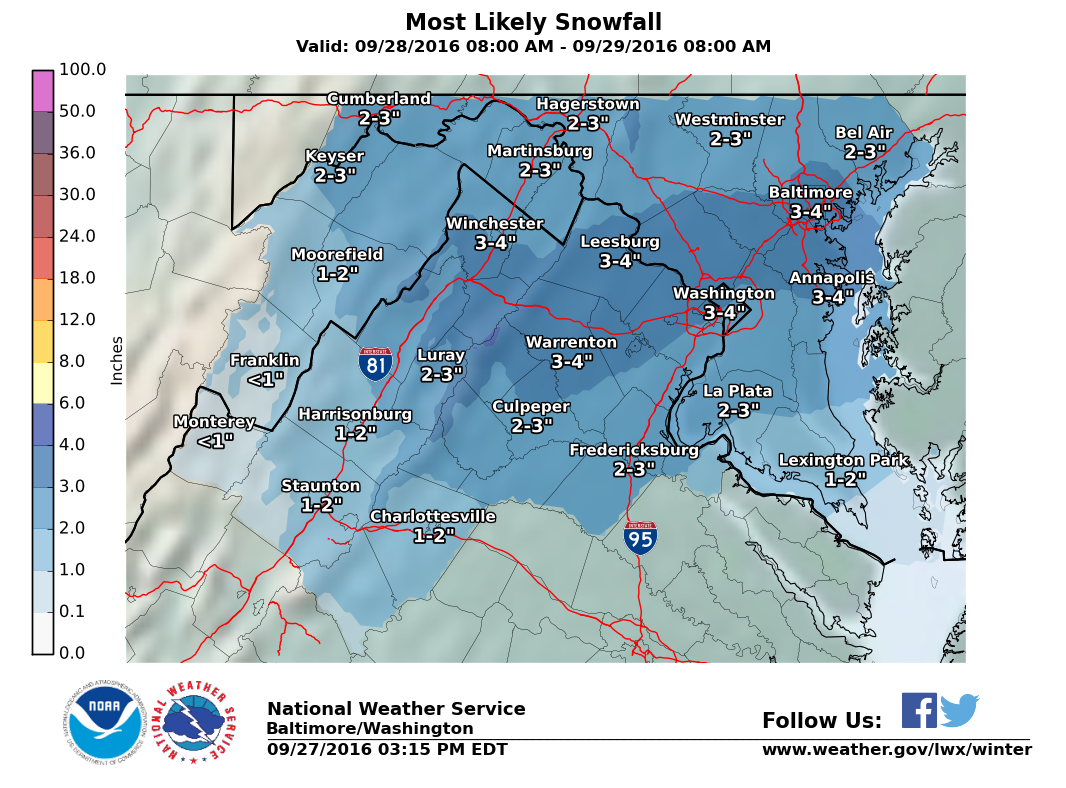
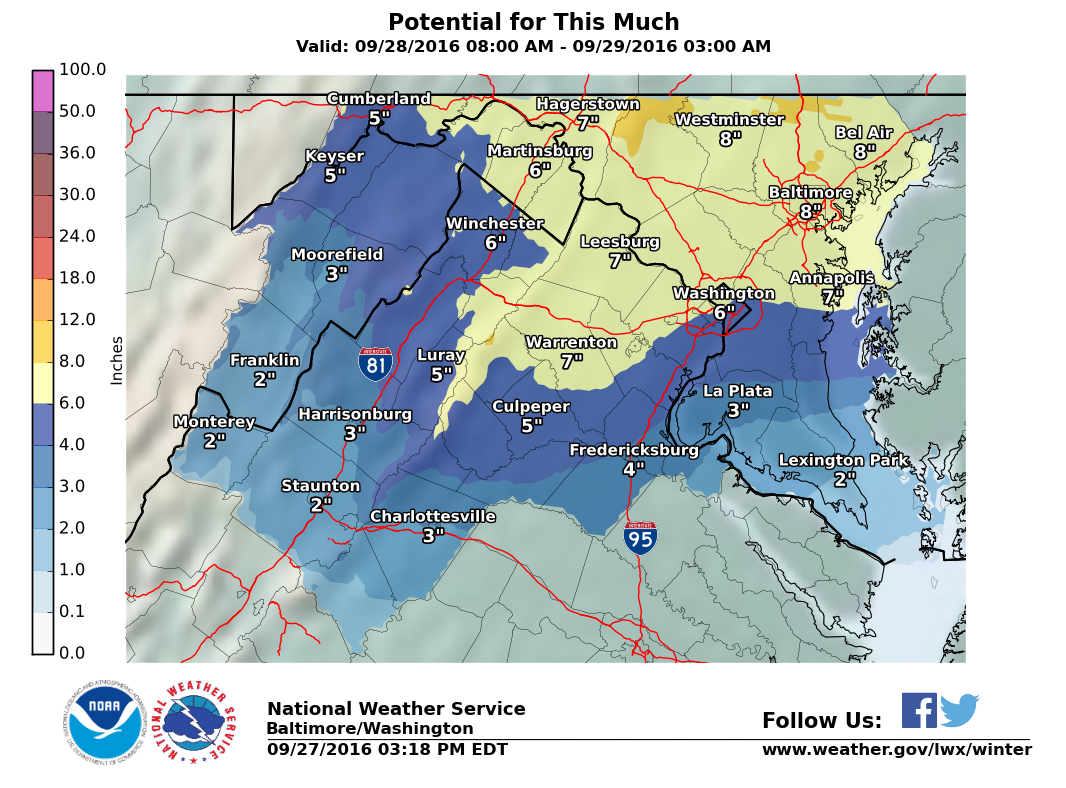
| EXPECT AT LEAST THIS MUCH | MOST LIKELY SNOWFALL | POTENTIAL FOR THIS MUCH |
|---|---|---|
 |
  |
 |
| What's this? | What's this? | What's this? |
| Ice Accumulation Potential | ||||||||||||||||||||||||||||||||
| MOST LIKELY ICE GLAZE | ||||||||||||||||||||||||||||||||
|---|---|---|---|---|---|---|---|---|---|---|---|---|---|---|---|---|---|---|---|---|---|---|---|---|---|---|---|---|---|---|---|---|
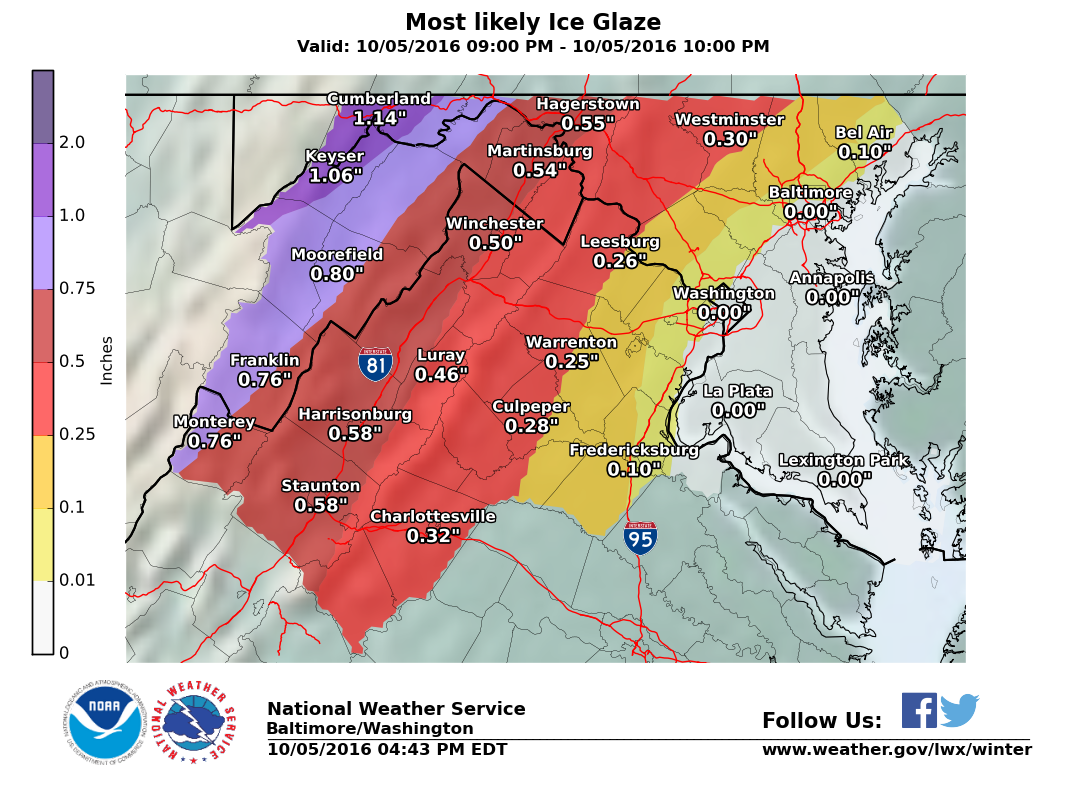 What's this? |
|
|||||||||||||||||||||||||||||||
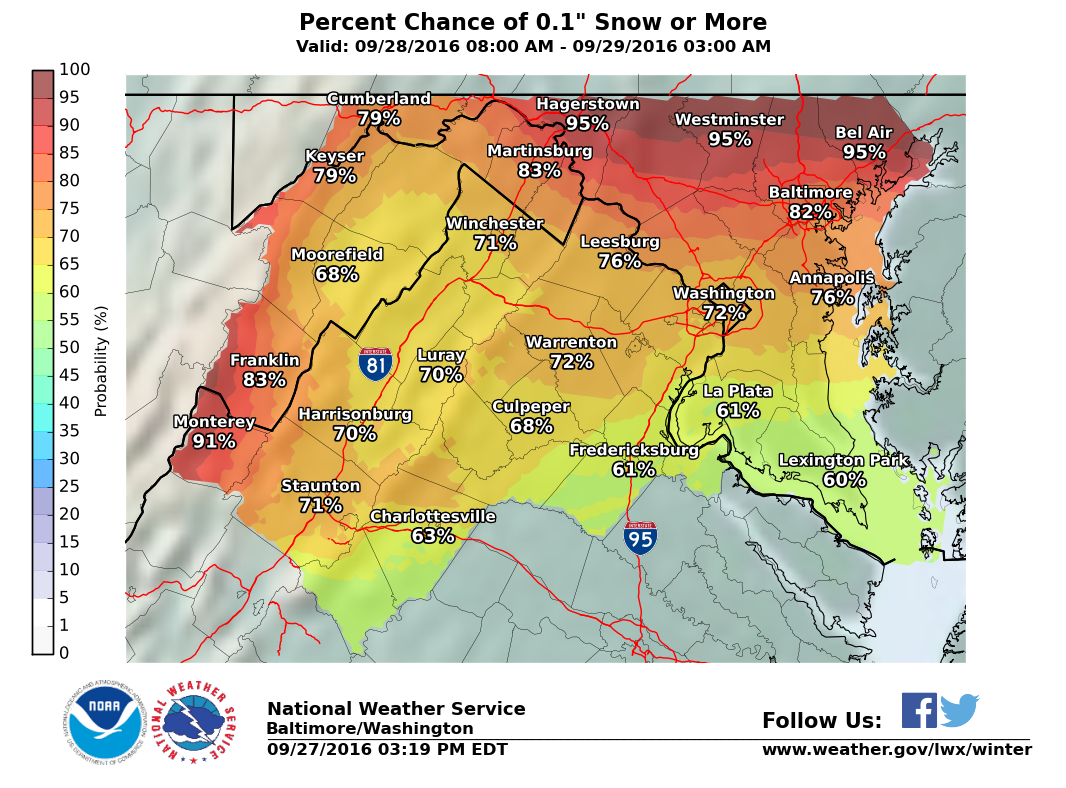
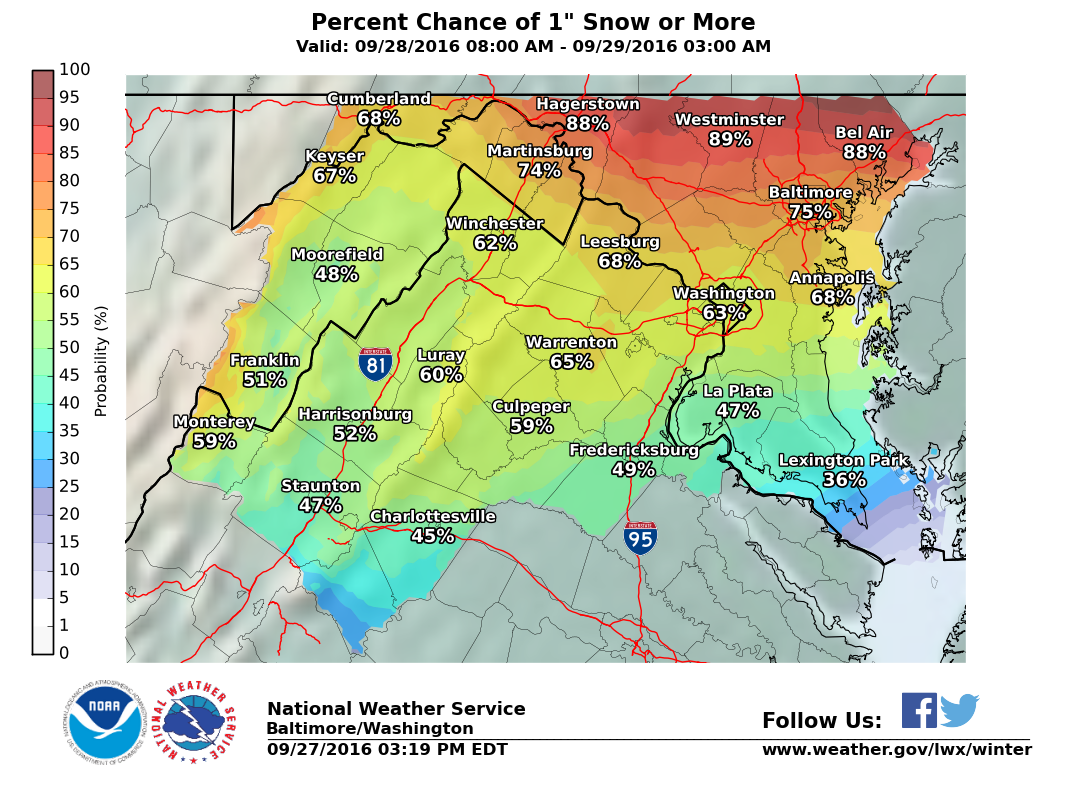
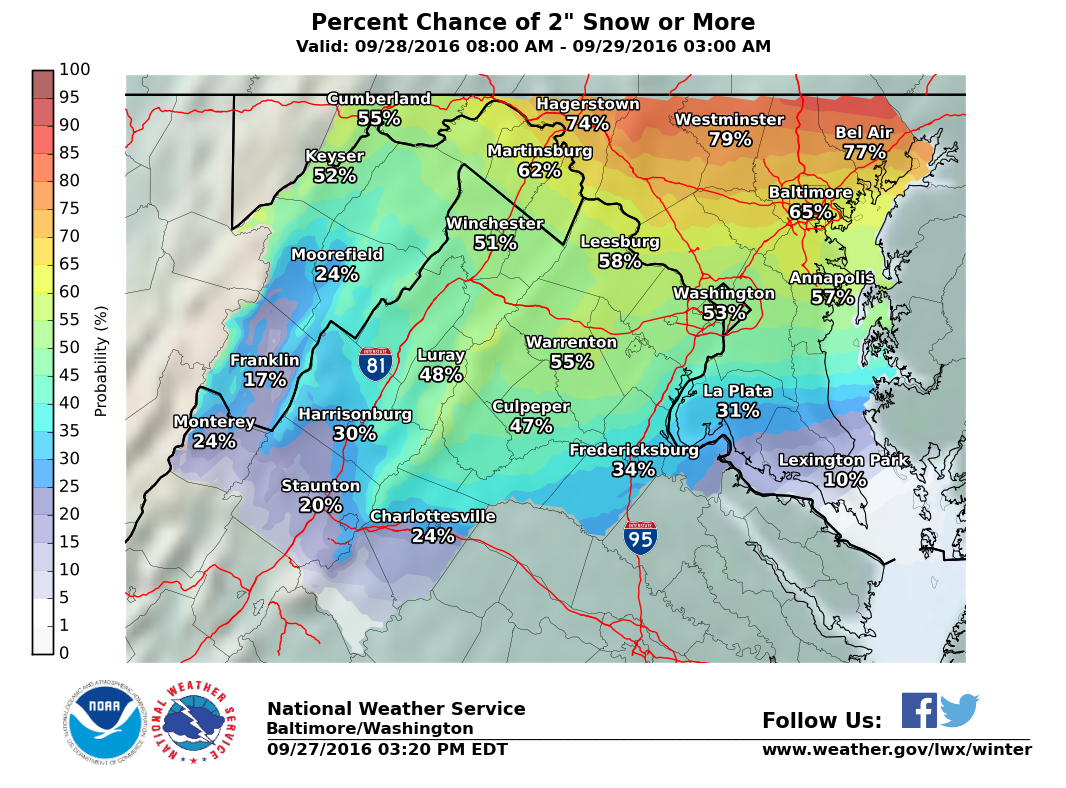
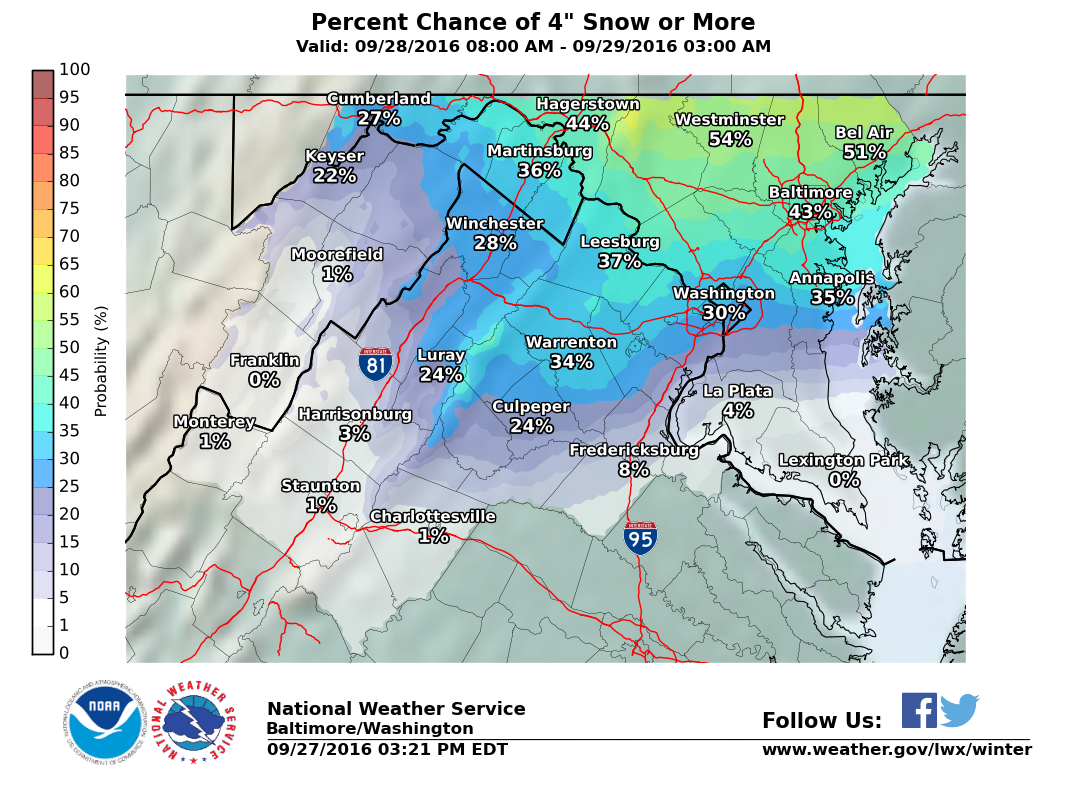
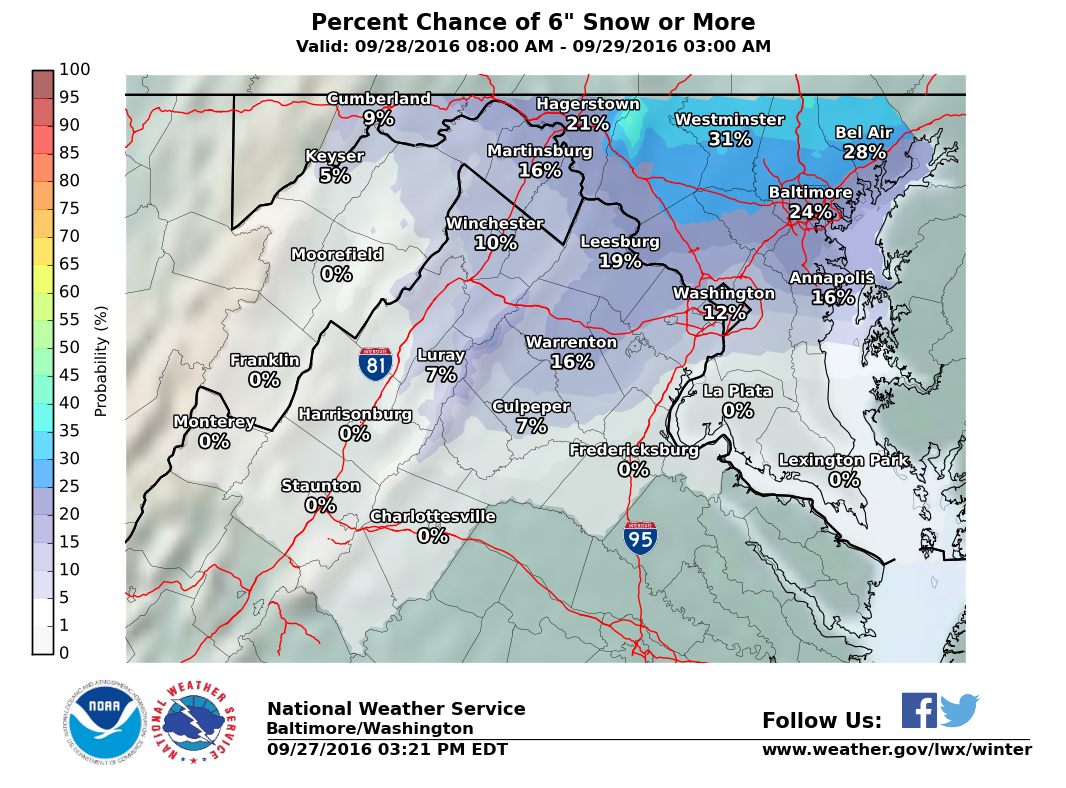
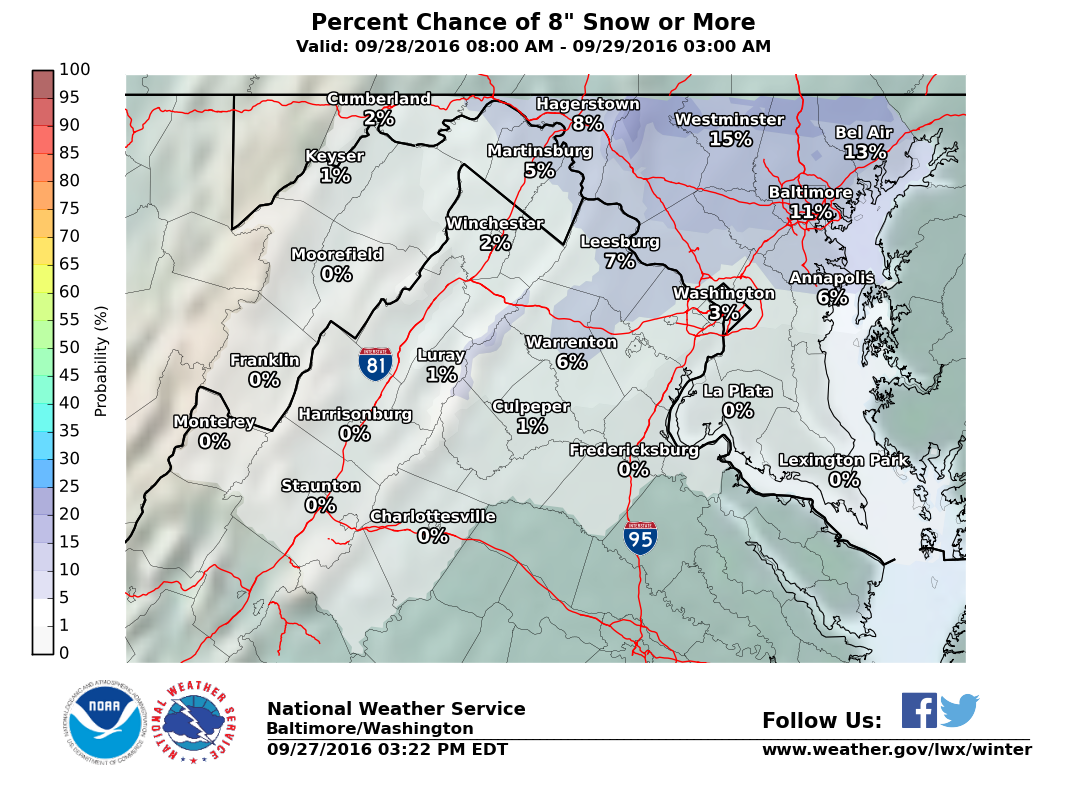
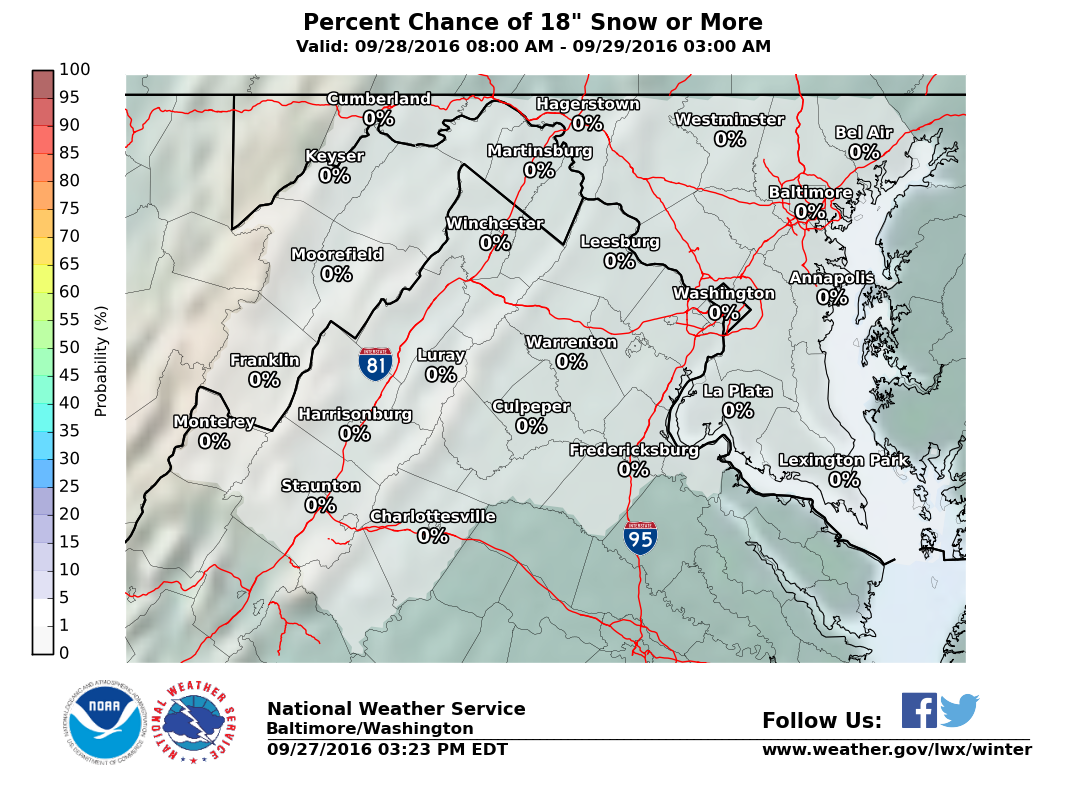
| Percent Chance That Snow Accumulation Will Be Greater Than...
Experimental - Leave feedback
What's this?
|
||||||||||||||||
|
||||||||||||||||
| Chance of Snow Accumulation
Experimental - Leave feedback
What's this?
|
|
|
| Other Snow/Ice Information | ||
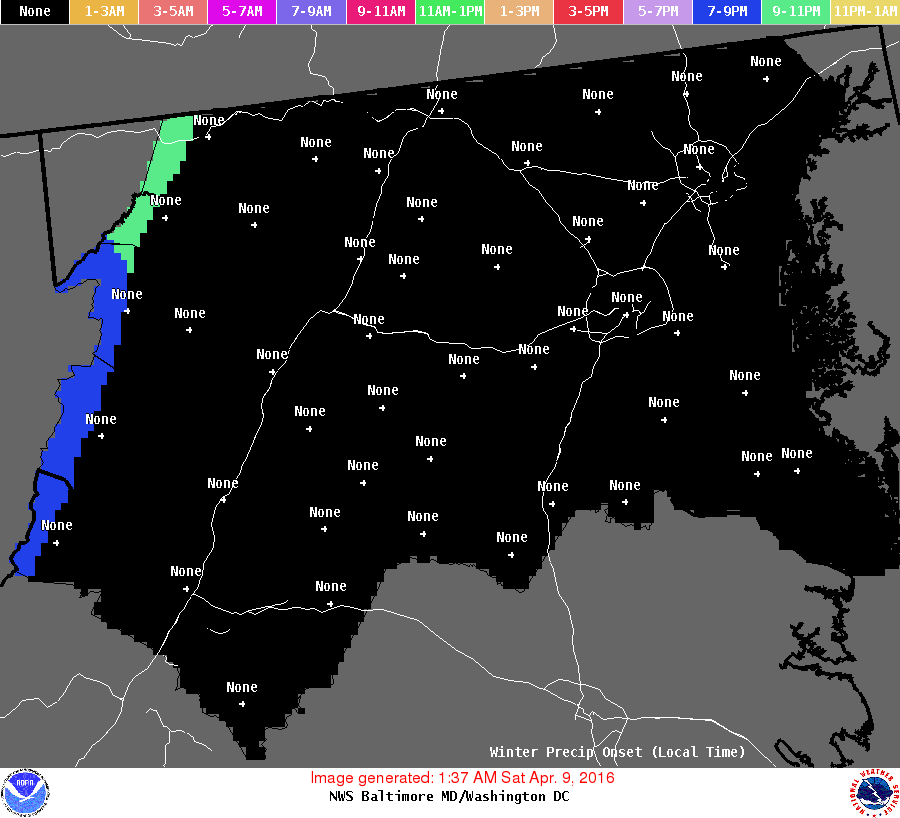
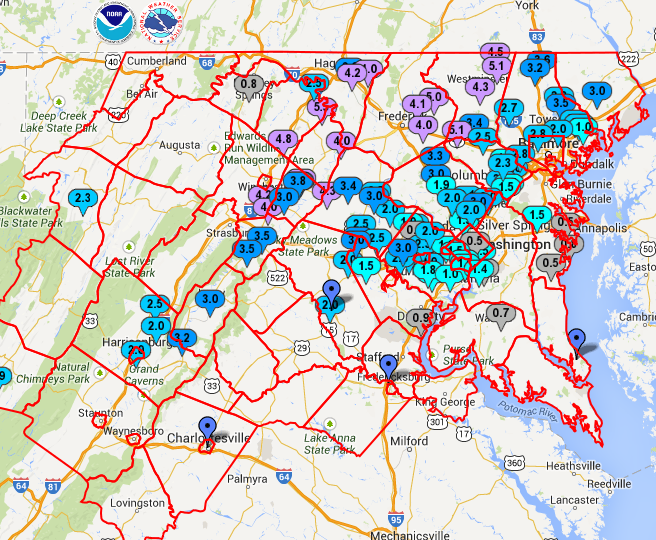
| Storm Track | Onset of Wintry Precipitation | Reported Snow/Ice Totals |
|---|---|---|
 |
 |
 |
| What's this? | What's this? | What's this? |
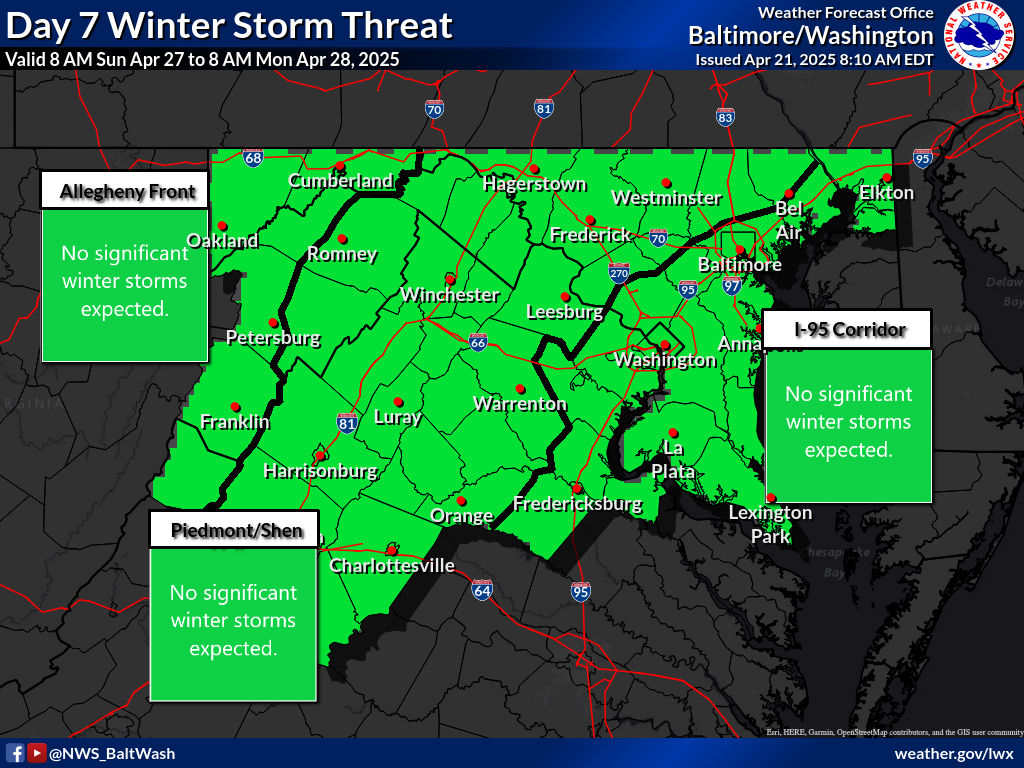
| Winter Storm Threat: 3-7 Days From Now...
Experimental - Leave feedback
Click on maps to see daily Confidence vs. Potential Impact graphic.
|
|||||||||||||
| Long-Range Forecast | |
| Days 4-5 Forecast Precipitation | Days 6-7 Forecast Precipitation |
 |
 |
|
Days 6-10 |
|
| Temperature | Precipitation |
 |
 |
|
Days 8-14 |
|
| TEMPERATURE | PRECIPITATION |
 |
 |
|
Week 3-4 |
|
|
TEMPERATURE |
PRECIPITATION |
 |
 |
| Useful Winter Weather Information | ||
| Historic Mid-Atlantic Winter Storms |
Winter/Snowfall Statistics |
El Niño and DC/Baltimore Winters |
| Watches, Warnings, & Advisories |
How to Measure Snow |
La Niña and DC/Baltimore Winters |
|
|
||
| At Home | On the Road | Outside in the Cold |


 Coastal Flood
 FAQ
FAQ