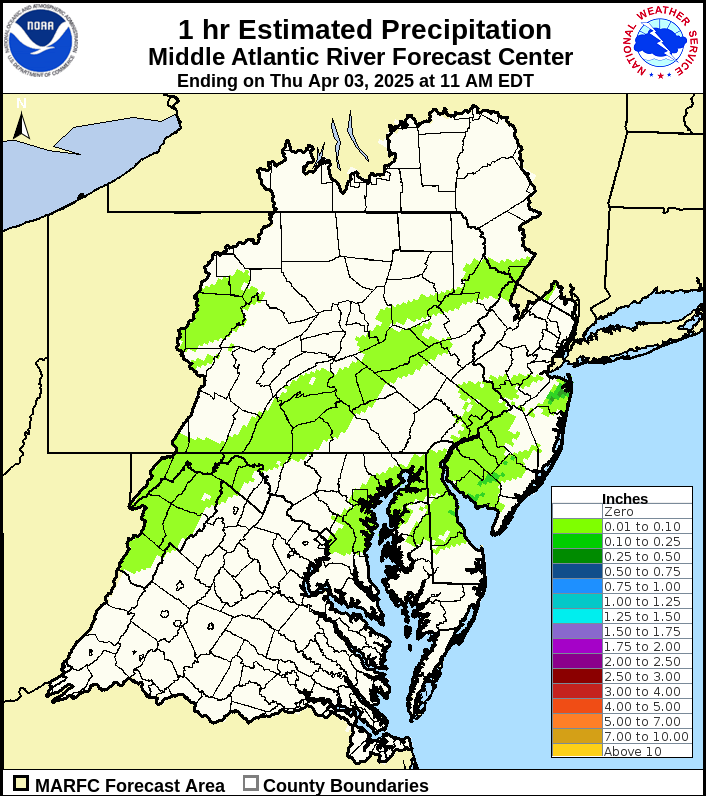
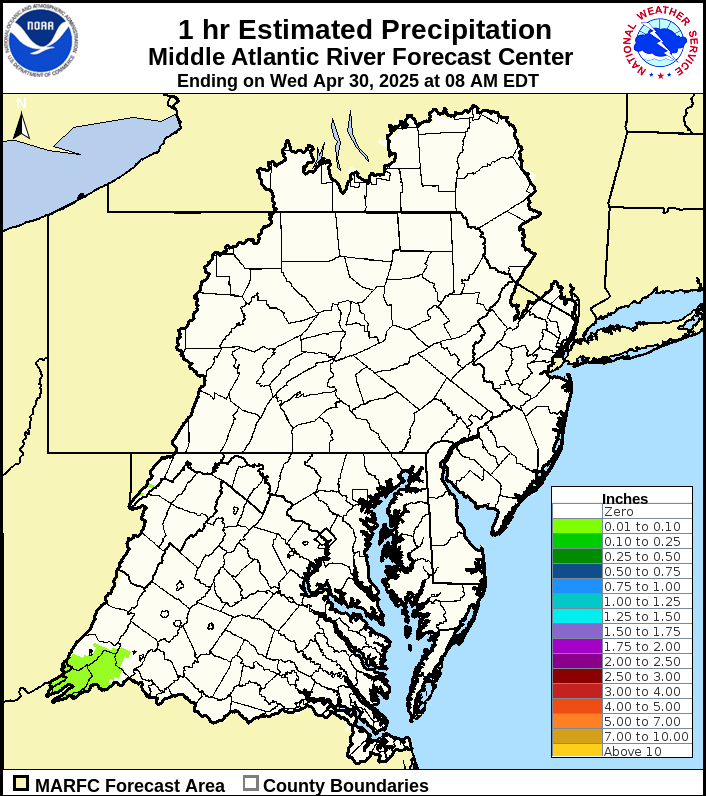
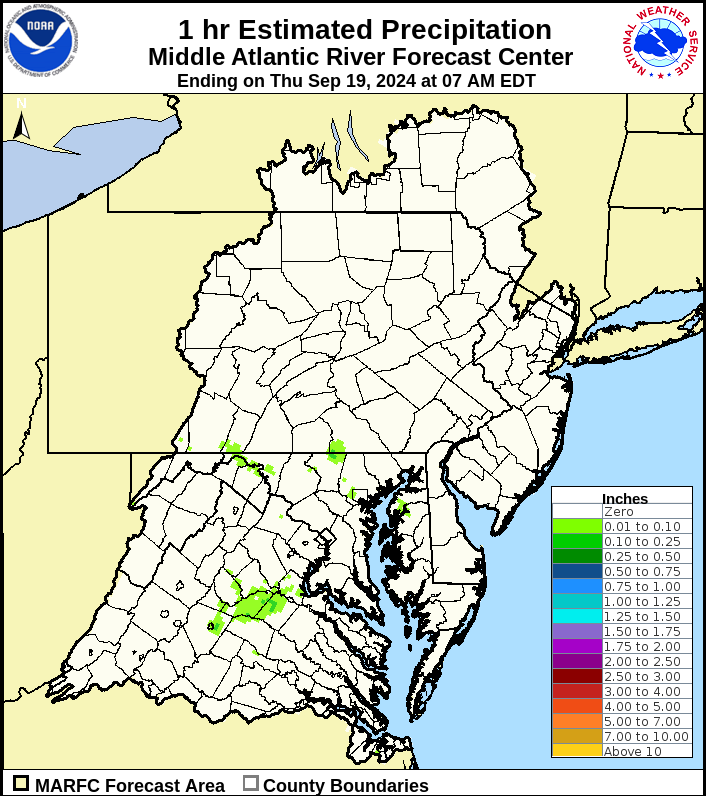
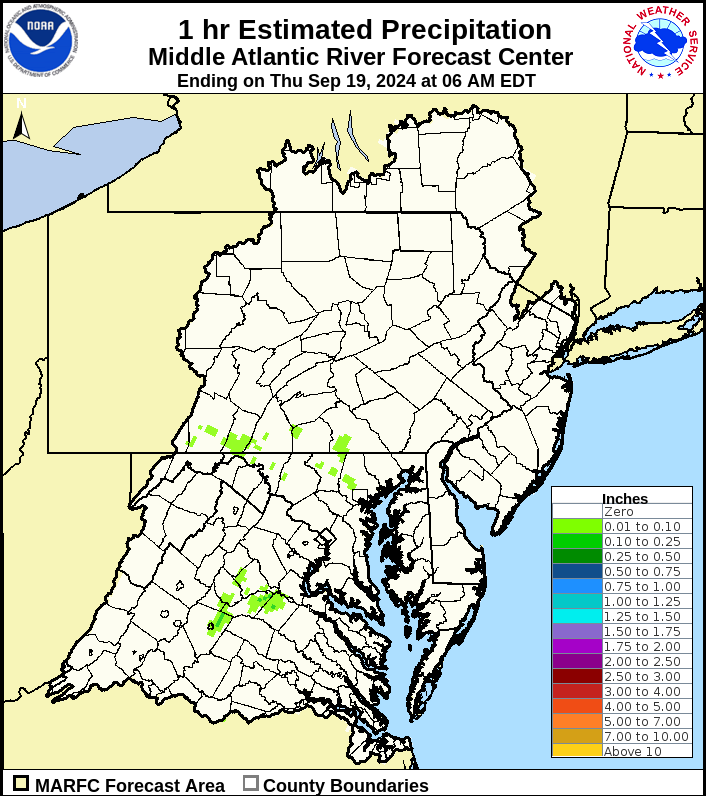
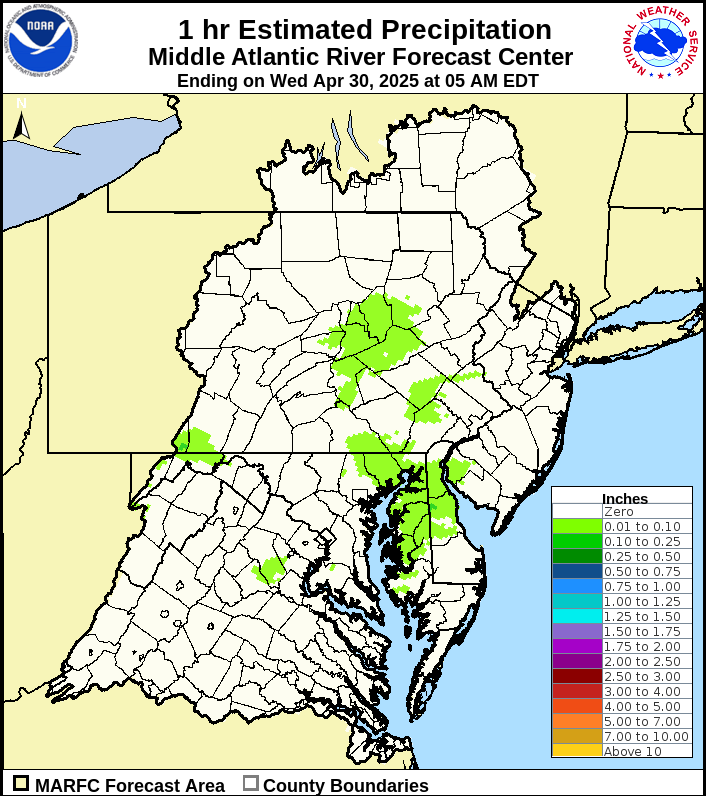
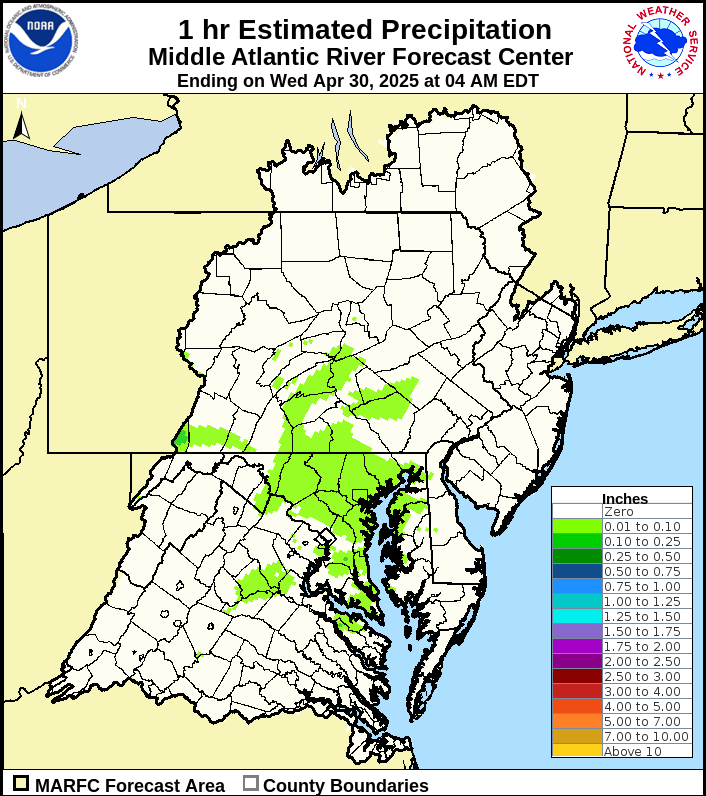
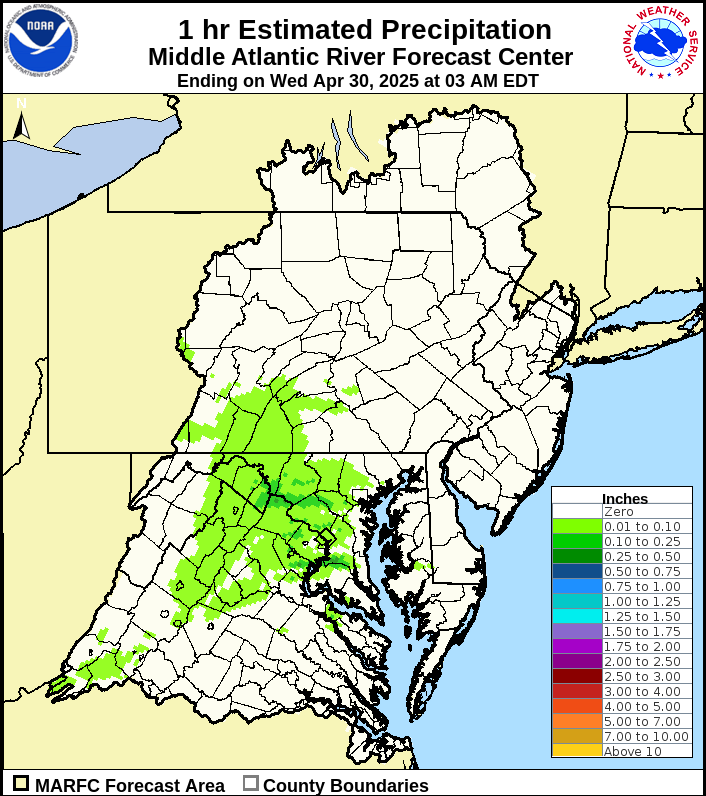
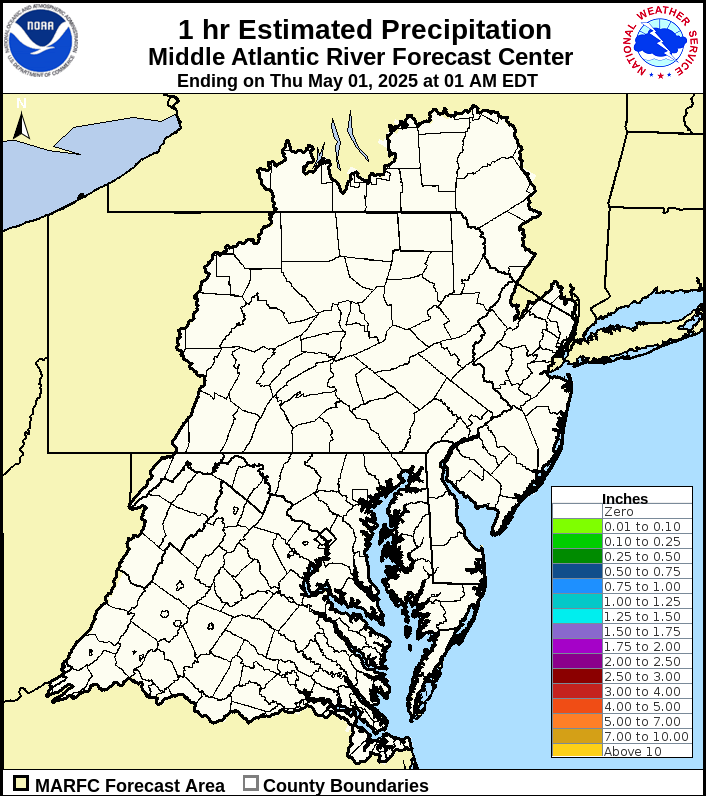
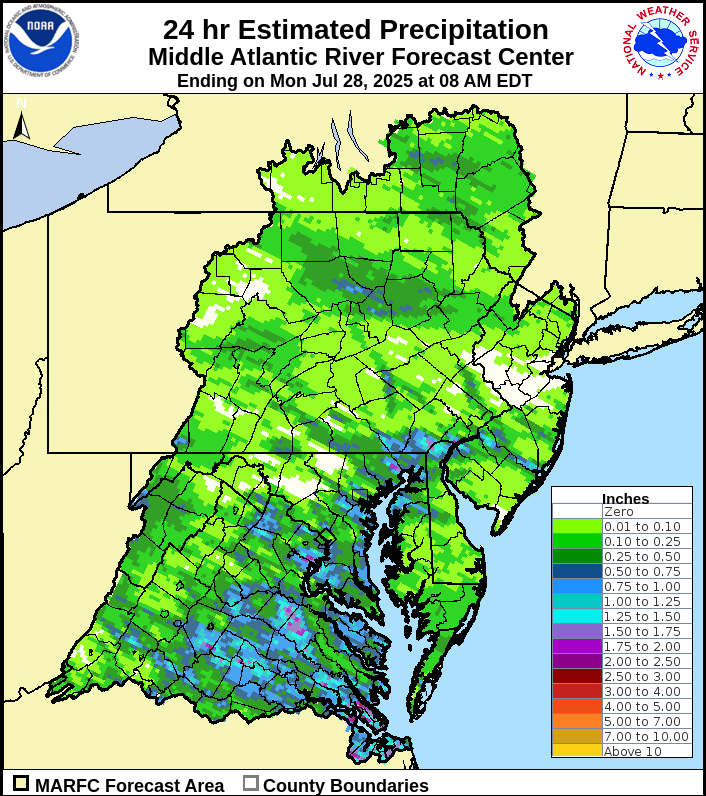
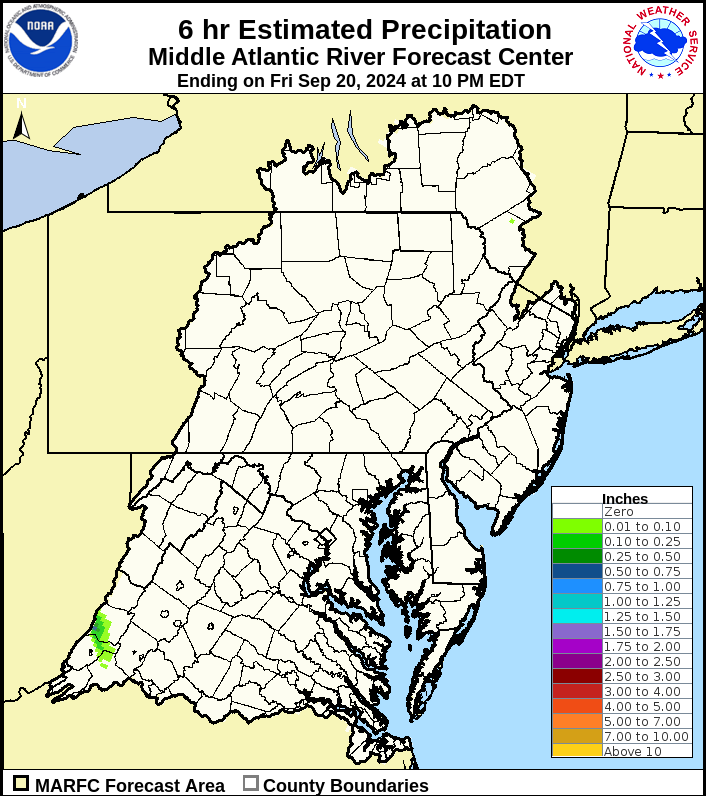
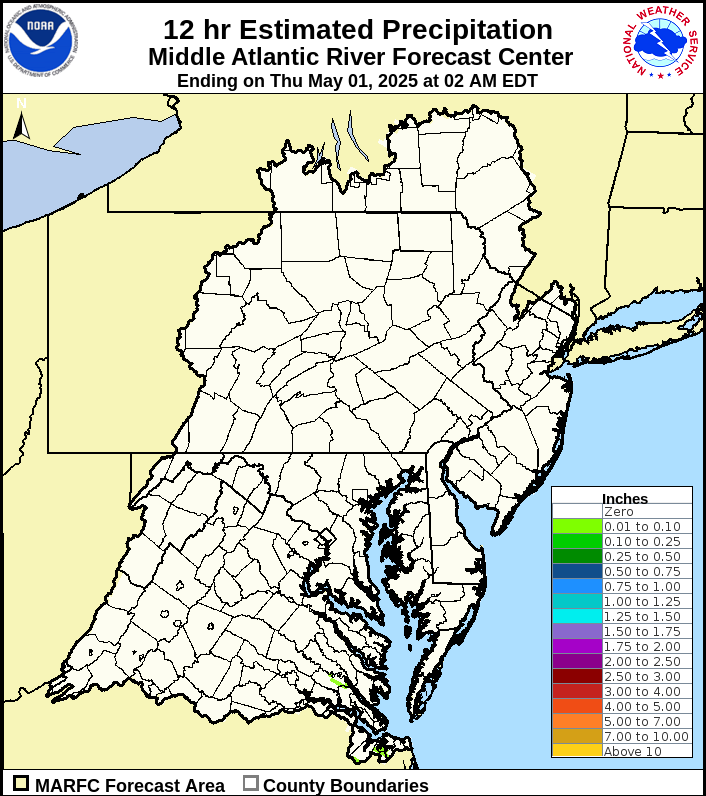
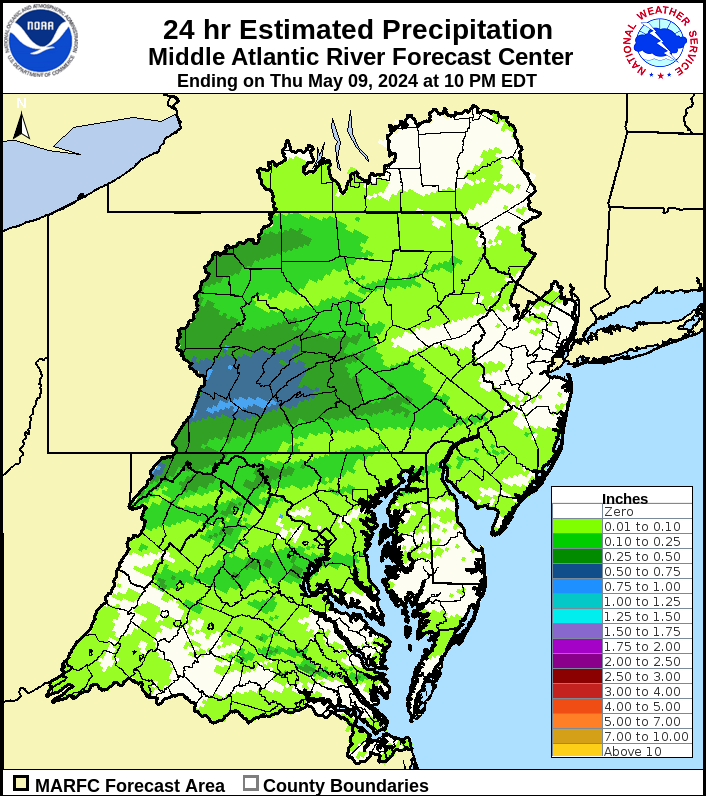
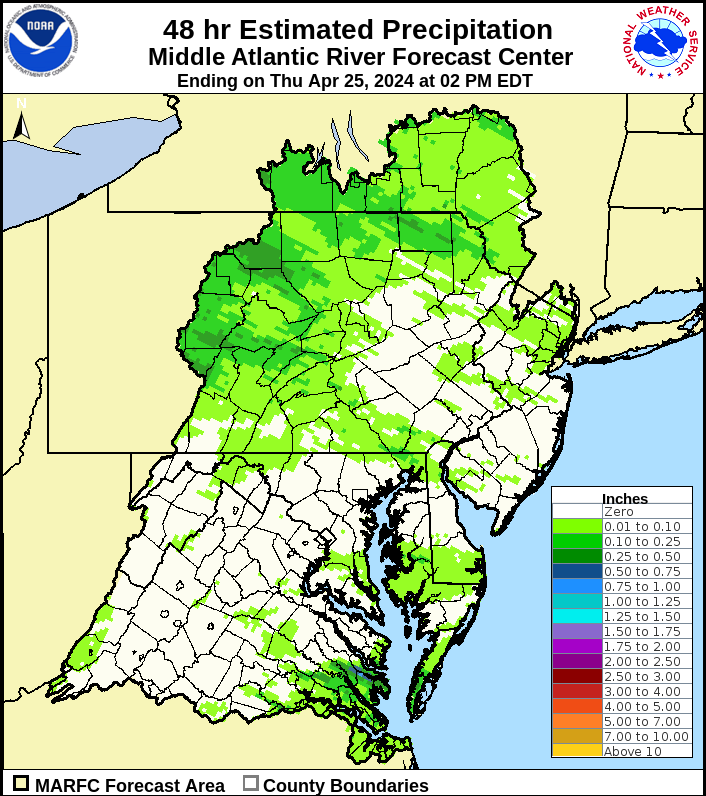
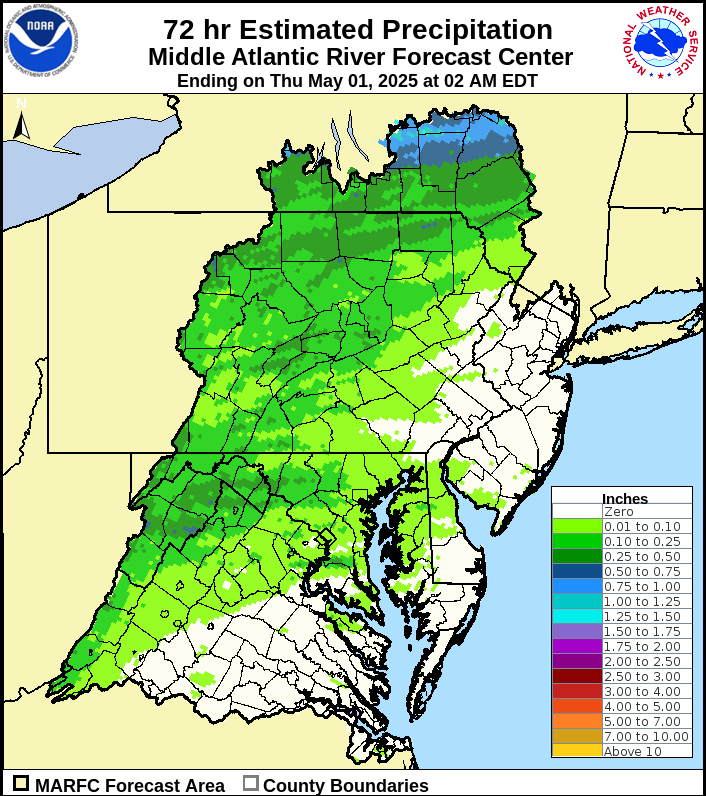
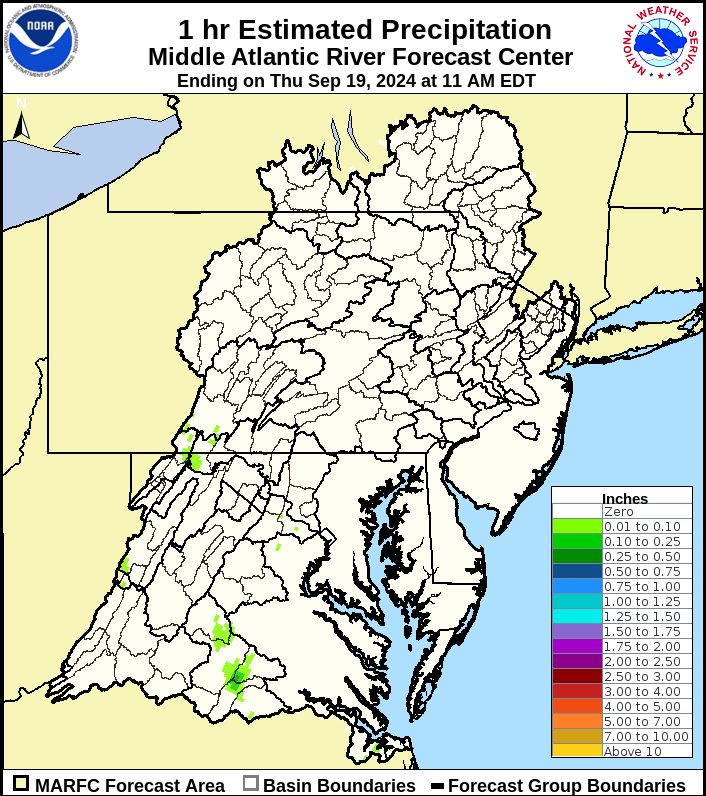
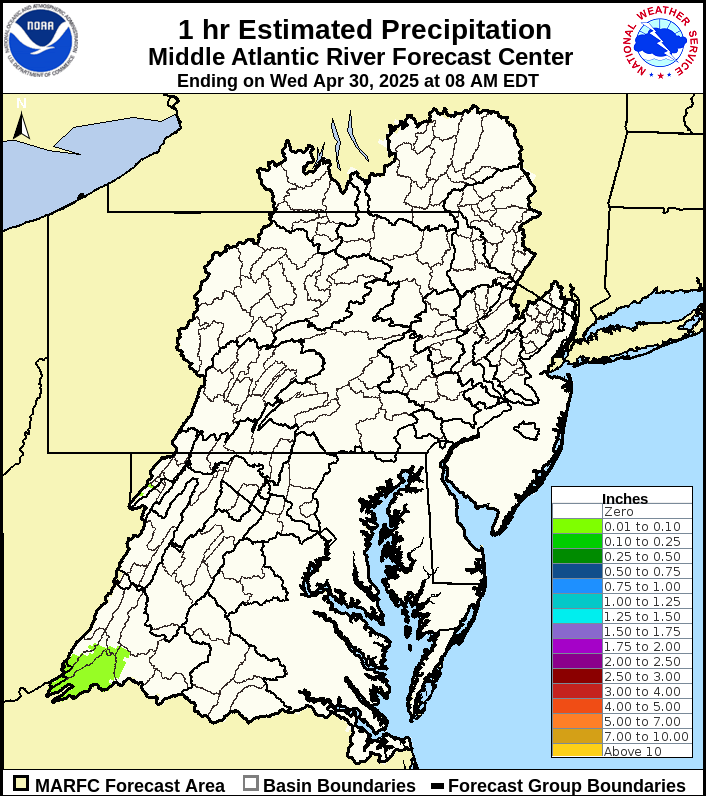
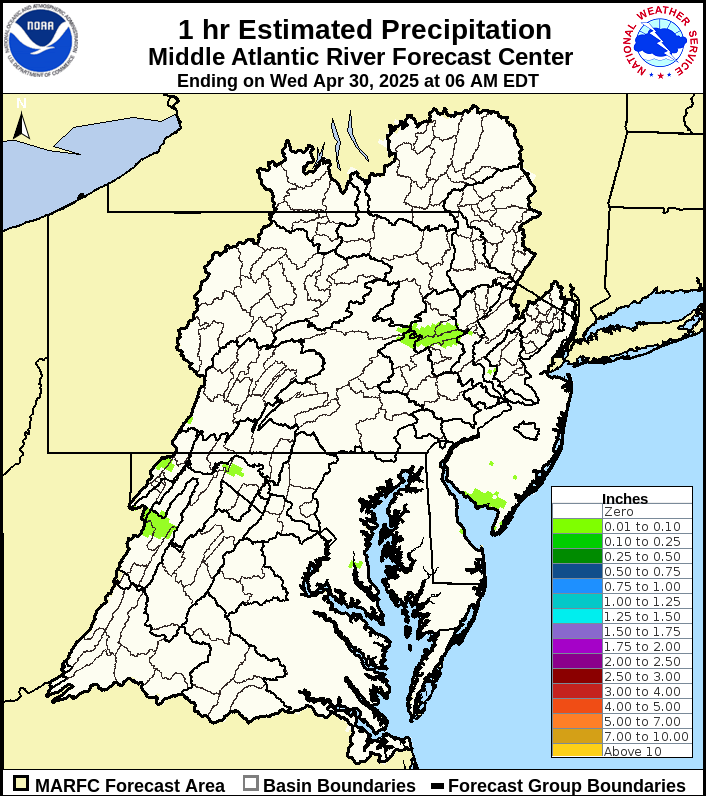
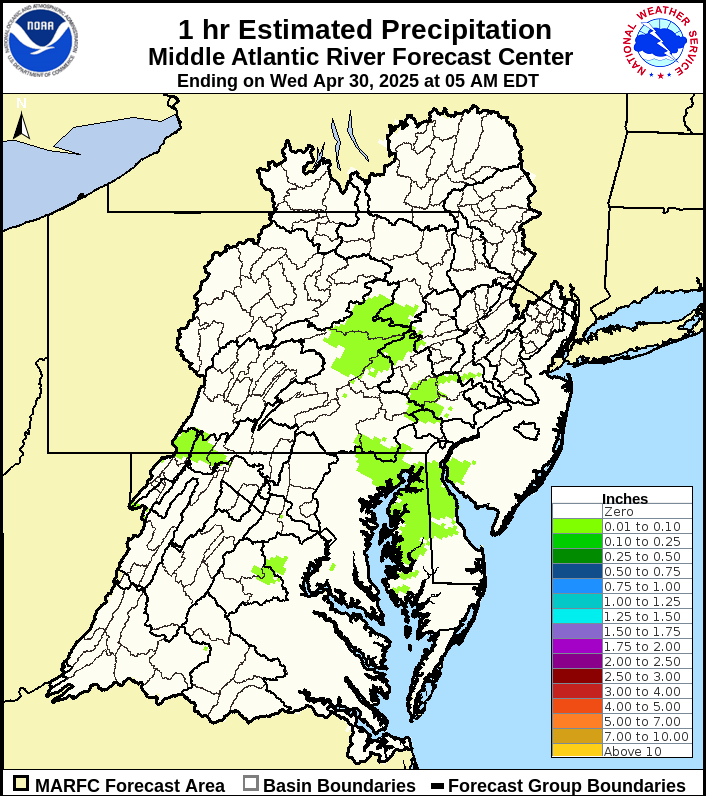
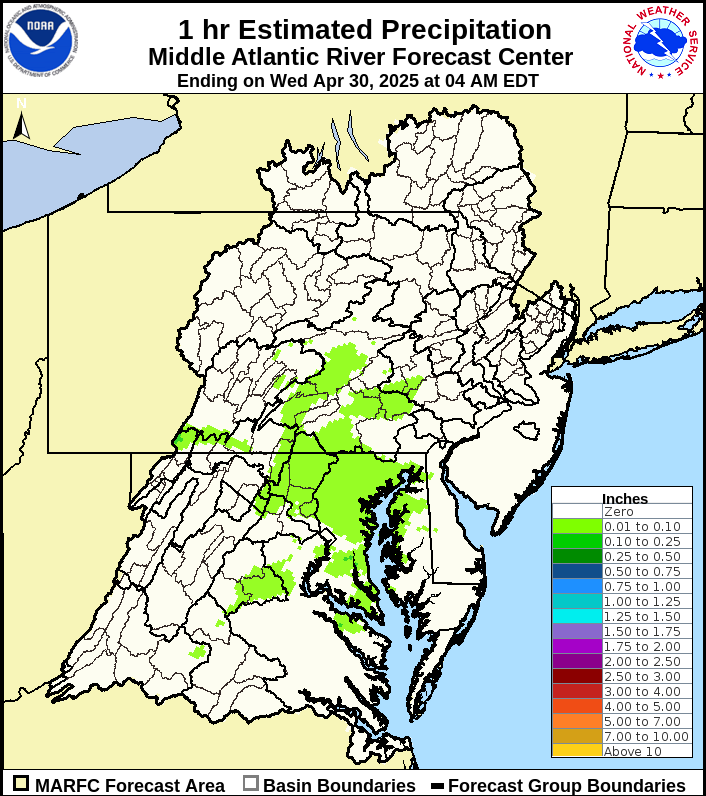
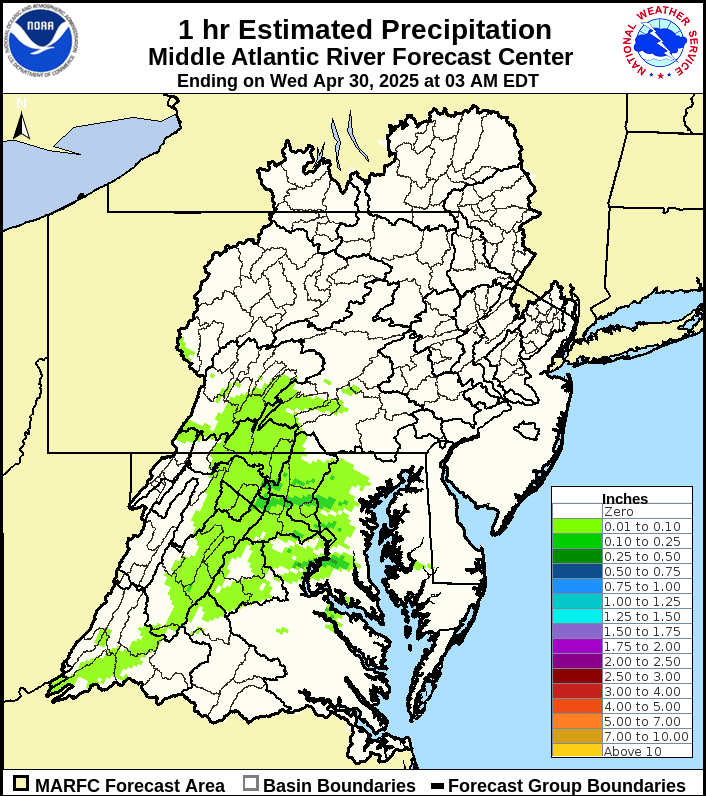
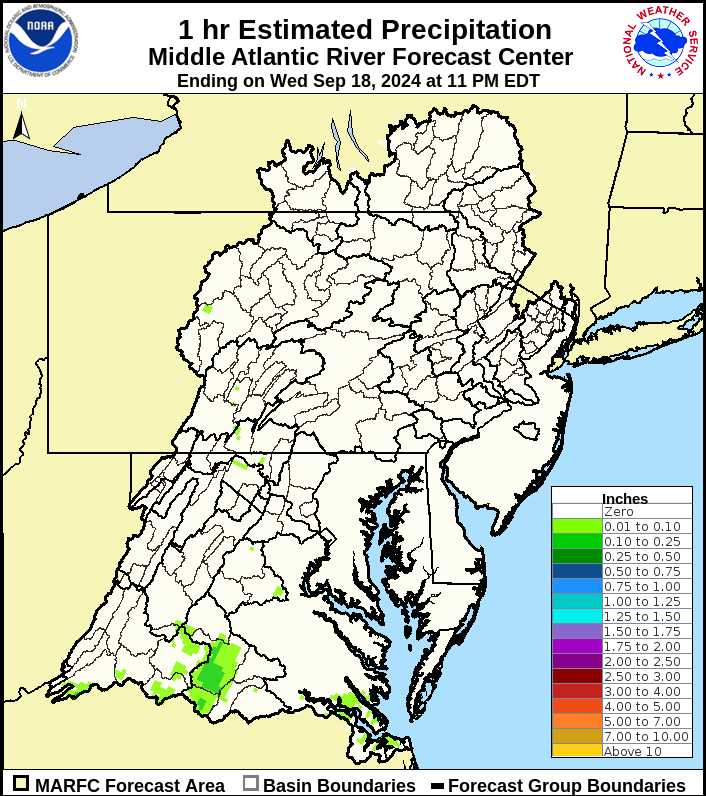
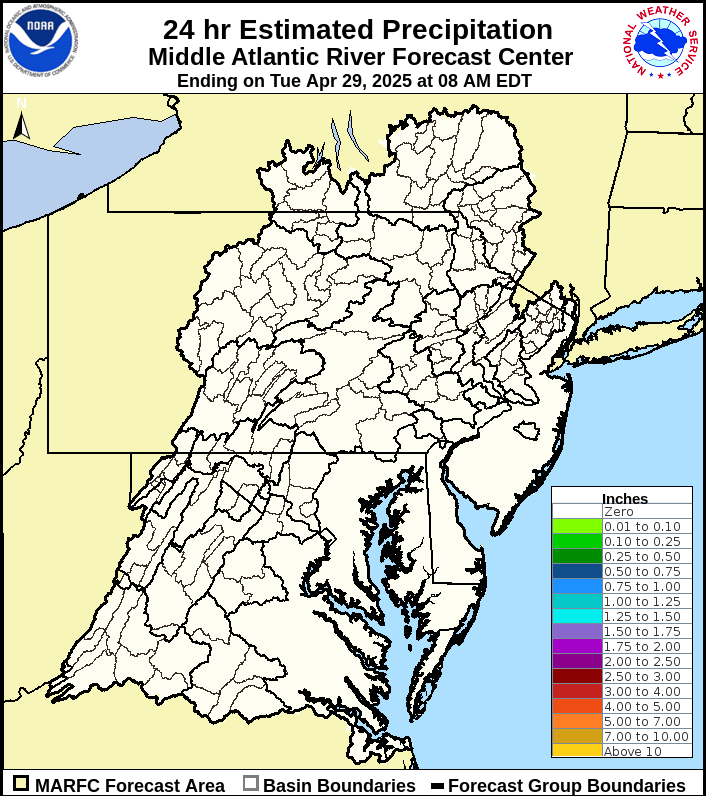
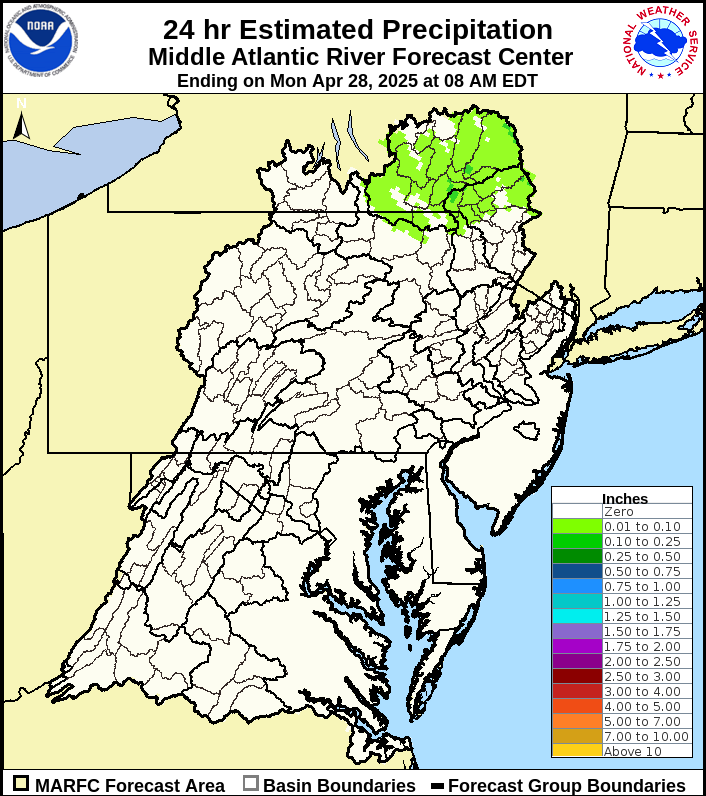
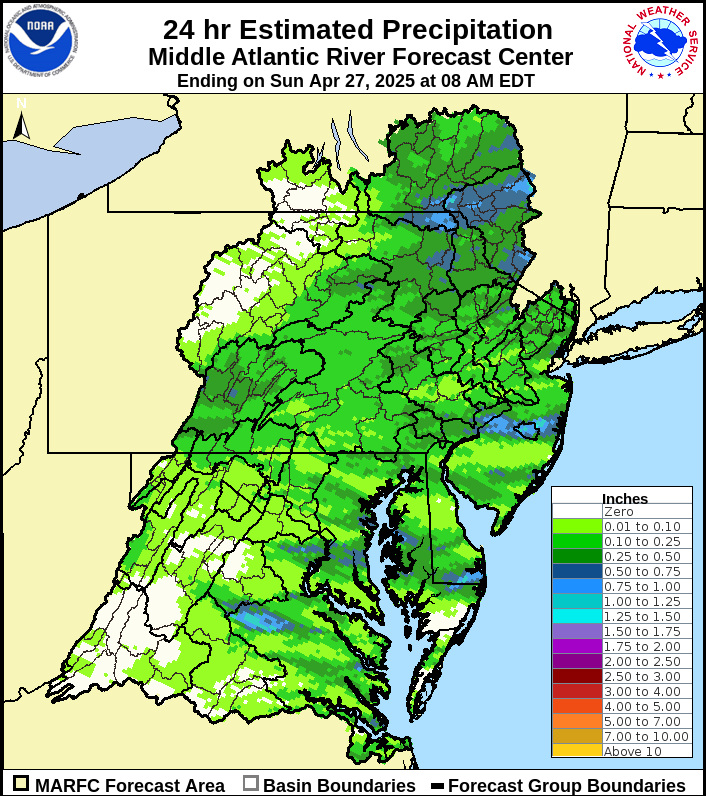
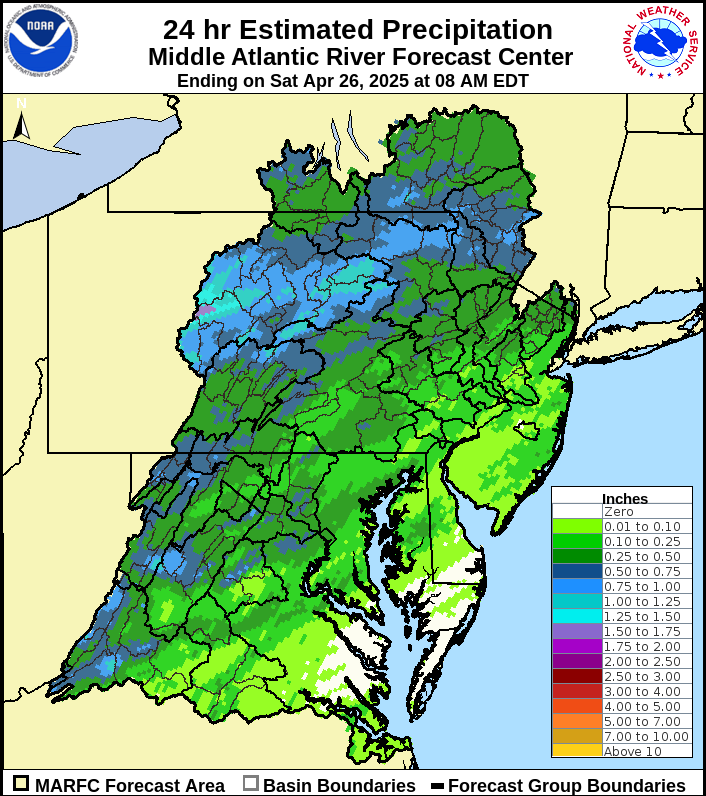
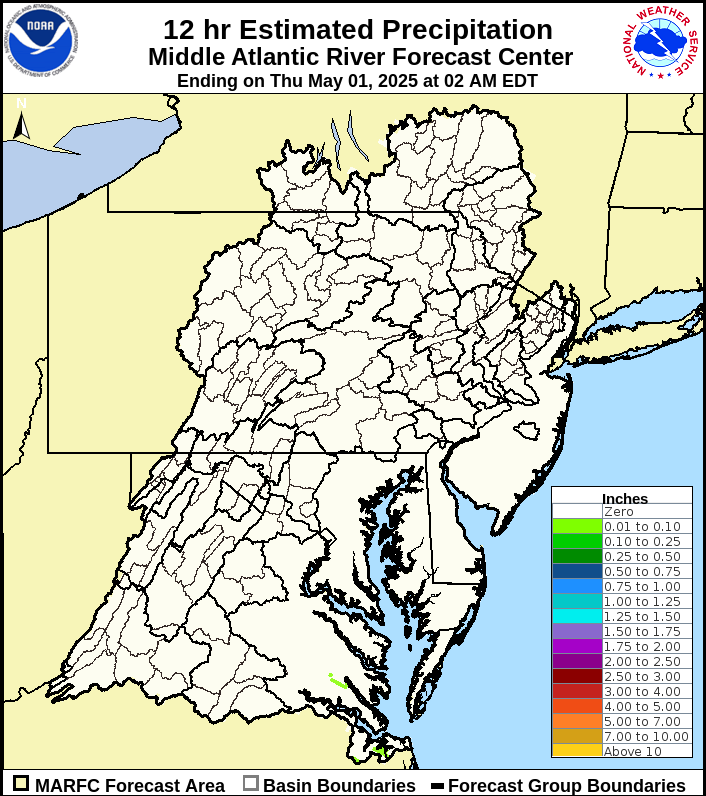
The graphics shown in this section are Multisensor Precipitation Estimates, otherwise known as MPE data, The multisensors involved at this time are radar and precipitation gages. In the future, satellite estimates may also be incorporated.
MPE is a gridded field, computed hourly. We currently quality control the past 24 hours of data each morning. MPE is currently used to verify precipitation forecasts, and to help initialize the national meteorological forecast models.
MPE is typically available for initial viewing at 40 minutes after the hour.
When using MPE data, it is important to remember it is vulnerable to the same inaccuracies that can be caused by either radar or precipitation gages. For radar, problems would be: freezing or frozen precipitation, low topped convection, bright banding, the reflectivity/rainfall relationship in use, calibration of the radar, radar location and elevation, range degradation, and the radar's effective coverage. For precipitation gages, problems come from freezing precipitation, windy conditions, gage siting, undermeasurement by tipping bucket gages in high intensity rainfall, and gage maintenance.
For more information on how MPE is calculated, or to provide feedback on MPE in general, please contact the MARFC webmaster.

