Overview of Tropical Storm Nestor
All images on this page may be expanded with a single click and can be returned to original size with a second click.
Tropical Storm Nestor, at its strongest, was a tropical storm containing sustained winds up to 60mph and a central pressure of 996mb. The main impacts to our region revolved mostly around strong winds along our coastal locations, and storm surge ranging from 1 to 3 feet along the coast of the FL Panhandle and Big Bend. While impacts besides surge were mostly limited across our region, heavy rain and tornadoes did cause much more damage across the Peninsula of FL. For more information on the impacts from Nestor's tornadoes, please see the write up of this event from the National Weather Service in Tampa.
 |
 |
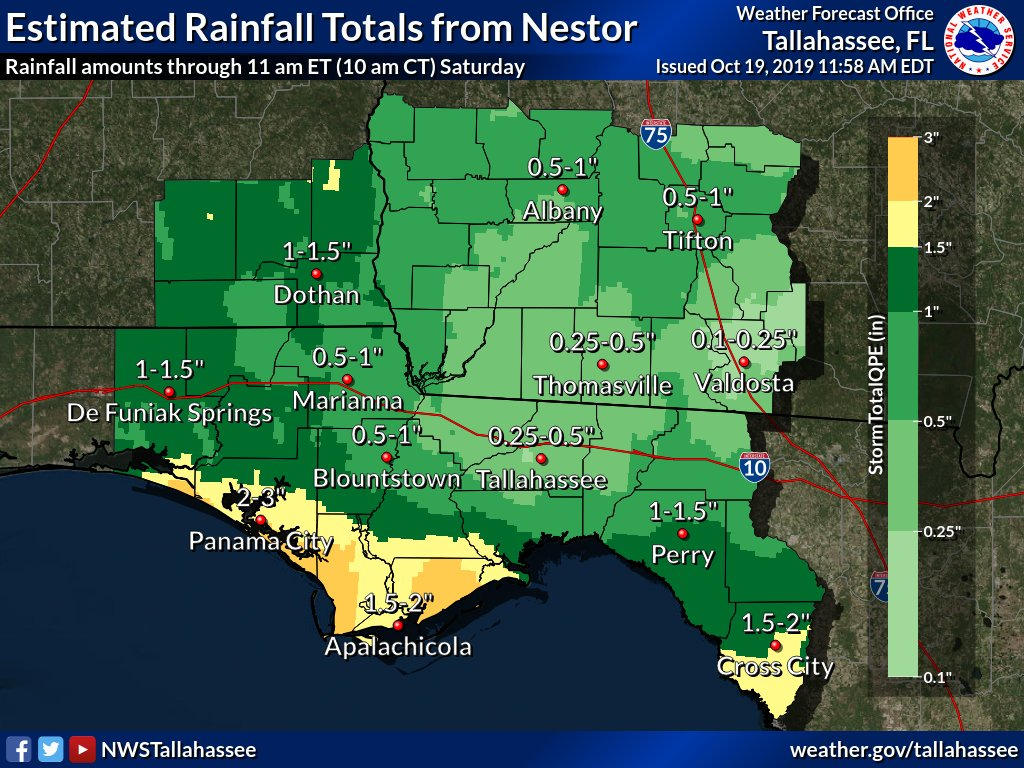 |
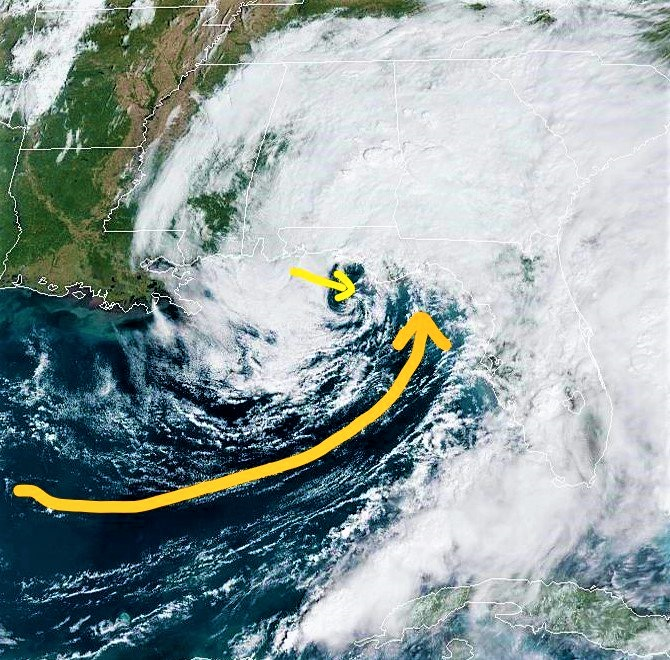
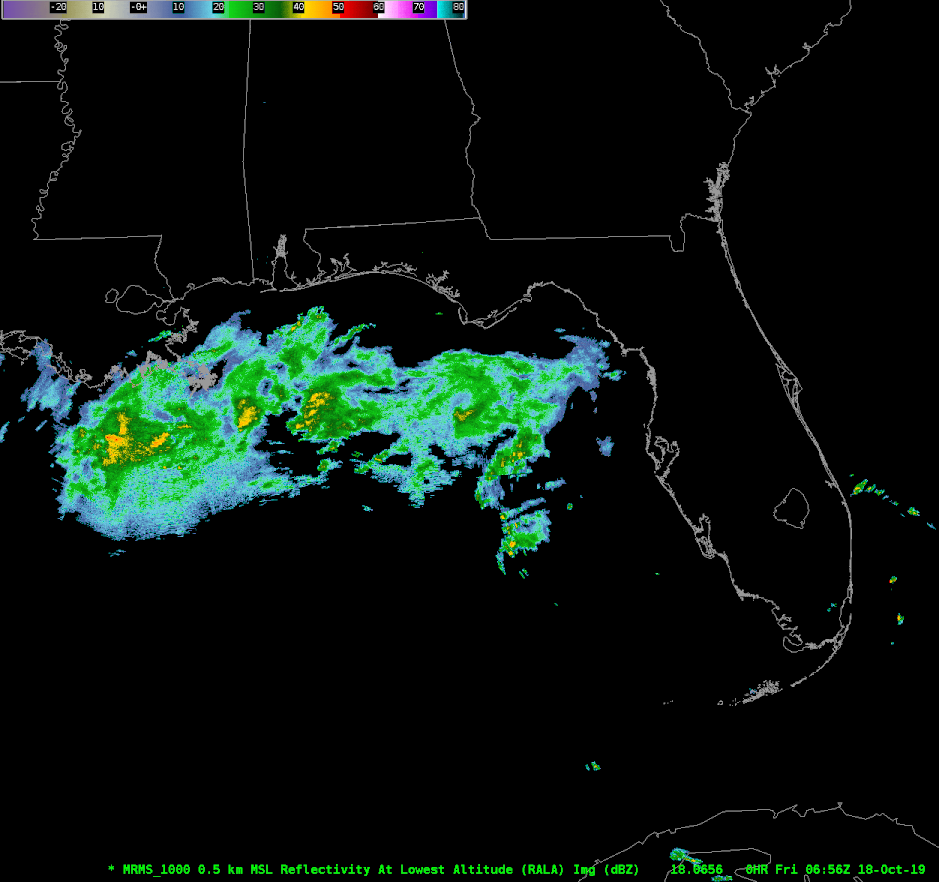
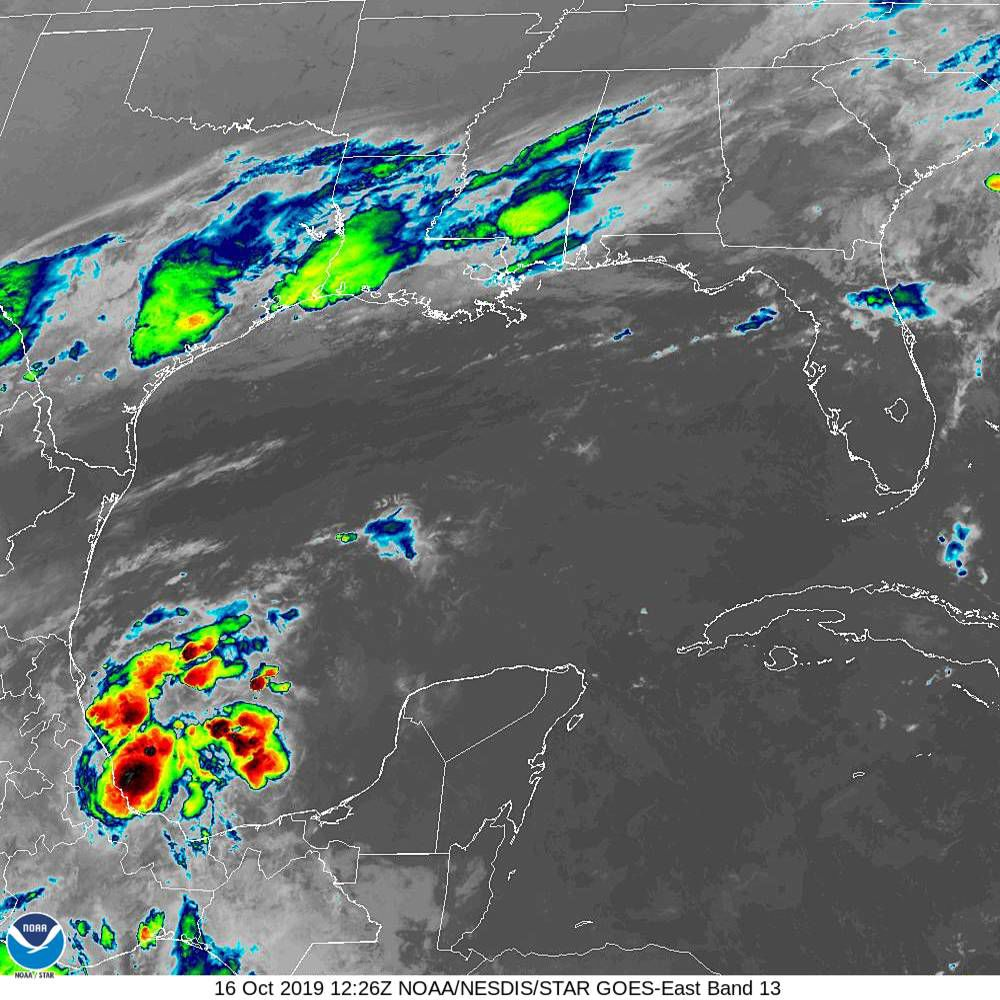
| Satellite Imagery from Nestor around 11am October 19, 2019. Nestor was undergoing a process called extra-tropical transition. | Radar imagery of Tropical Nestor from the morning of October 18th through the early afternoon of October 19th. Image courtesy NWS Tampa Bay | Radar estimated rainfall amounts from Tropical Storm Nestor. |
Photos & Video & Tweets
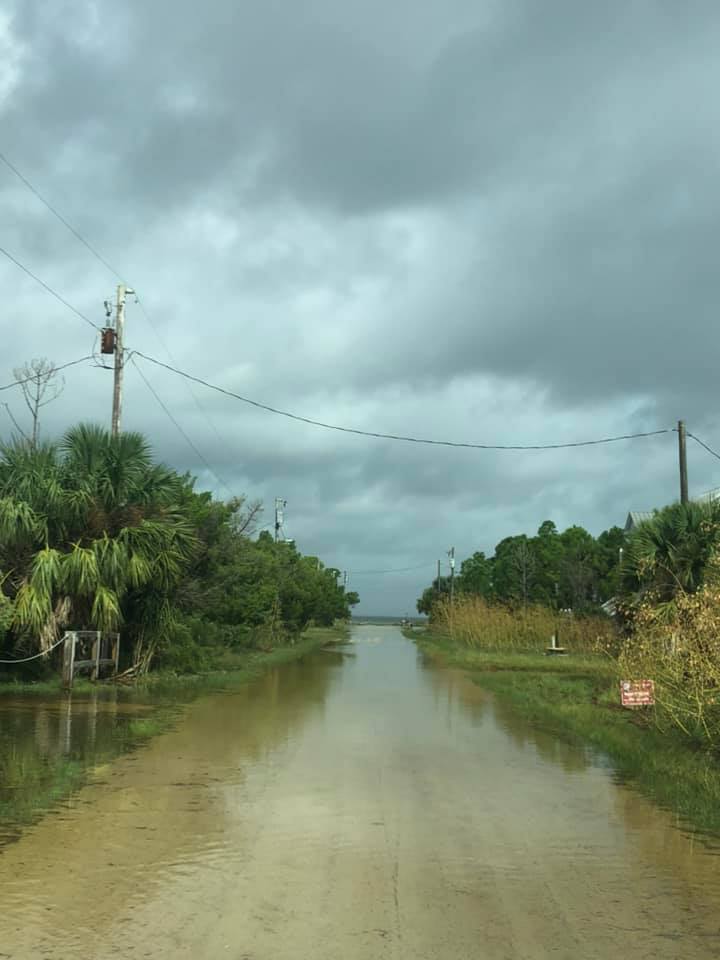
| Saint Marks Flooding | Beach Erosion (Various Locations) |
|
|
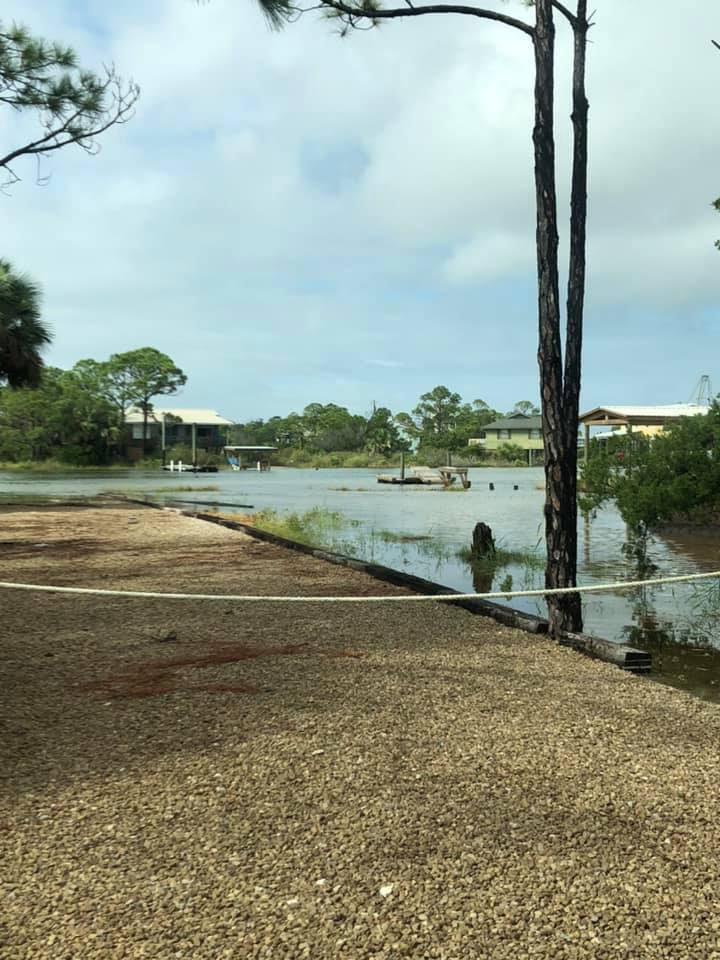
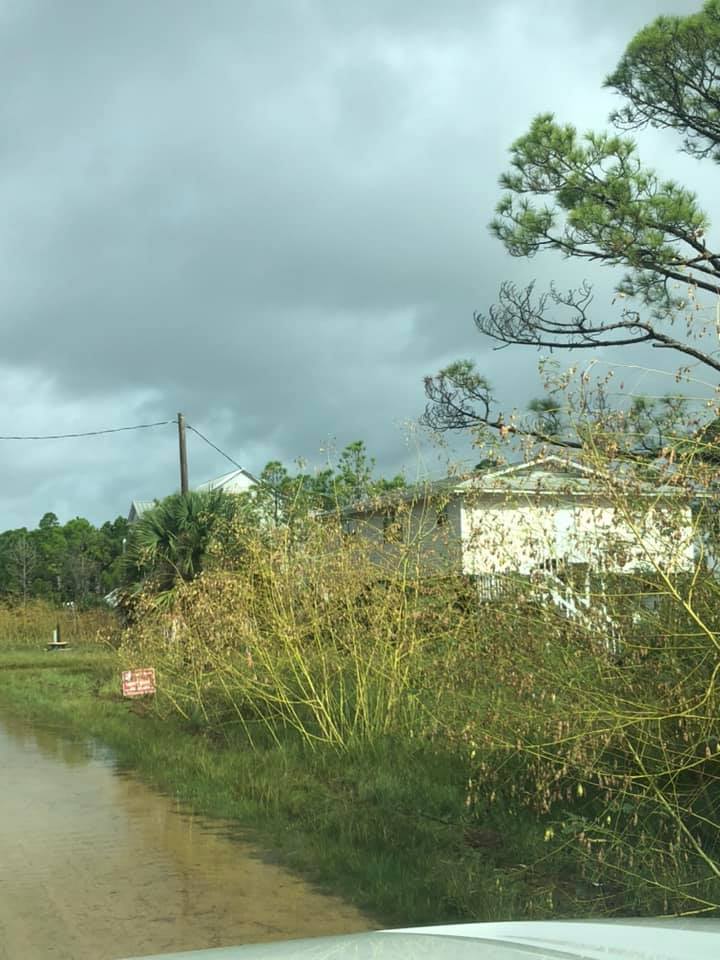
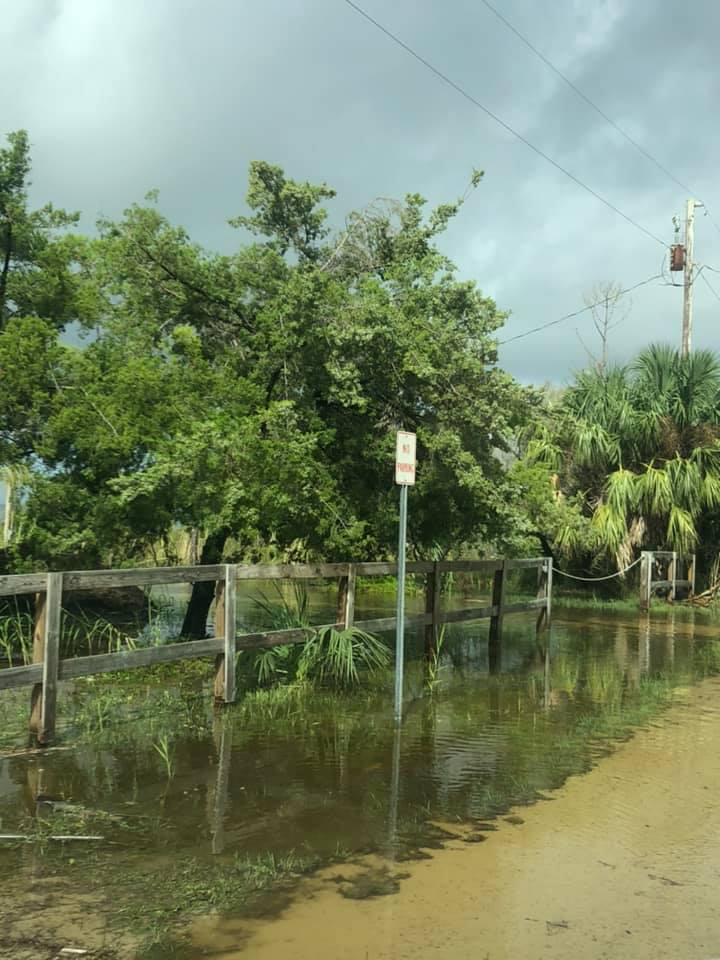
| Storm Surge at St. George Island | |||||
 |
 |
 |
 |
||
| These photos of storm surge at St. George Island are courtesy of Pamela Brownell of Franklin County Emergency Management. | |||||
Storm History
Information is preliminary and could change with the release of the National Hurricane Center's final report of Tropical Storm Nestor (found here when available).
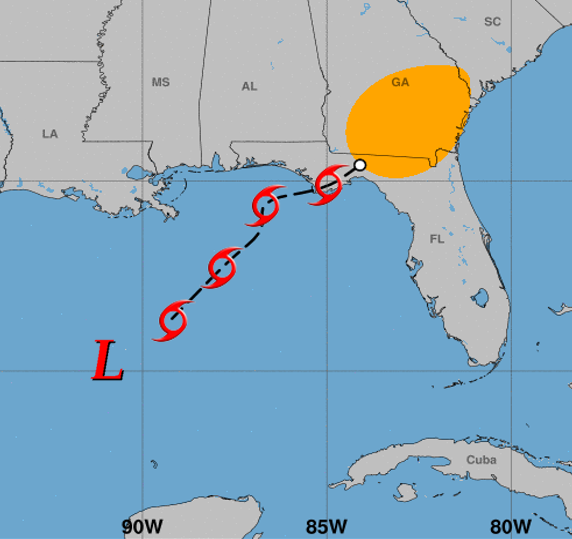
Tropical Storm Nestor originated as a broad area of low pressure in the southwest Gulf of America in the Bay of Campeche on October 16, 2019. Despite the relatively unorganized nature of the storm at the beginning, high chances of development over the next 24 to 36 hours would lead the National Hurricane Center to issue potential tropical cyclone advisories (i.e. potential tropical storm/hurricane advisory) to get the early warning of a tropical system out to the public. However, Nestor was a complex system from a meteorological perspective as the storms circulation was interacting with very cool conditions (normally associated with a cold front) to its west and a warmer, more tropical, air-mass to its east. By the 2pm Intermediate advisory on October 18, 2019, the potential tropical cyclone had gained sufficient tropical characteristics to be classified a tropical storm by the National Hurricane Center while it was located roughly 355 miles southwest of Panama City Beach, FL.
Nestor reached peak strength (by wind speed and pressure) early Saturday morning. Much of the impacts for our region were at their peak at this time as well. Storm surge values reached their peak at many of our coastal locations around 7 am to 9 am eastern time. The highest wind speeds (42 mph along the Saint George Island Bridge over land, and 52 mph1 over water at the Tyndall Air Force Base C-Tower) were recorded early Saturday morning.
Through Saturday, Nestor would slowly weaken as it made steady progress northeast. Just prior to landfall, and per the 11am NHC Advisory, Nestor became post-tropical. Nestor made landfall near St. Vincent Island around 1:30 pm Eastern Time. By this point much of the rainfall from Nestor had concluded and moved out of the region but strong winds remained across the area through the remainder of the afternoon and evening hours.
|
 |
 |
| Satellite imagery from around 11am on October 19, 2019 as Nestor became post-tropical and lost tropical characteristics. Yellow arrow indicates the center while the orange arrow indicates a dry slot (typically found in many extra-tropical systems). | Path of Tropical Storm Nestor beginning from the first advisory issued 11am ET on October 17th. The last advisory was issued at 5pm on October 19th, 2019. Image (NWSTampaBay) | The disturbance that would eventually become Nestor is seen here in the Bay of Campeche on the morning of October 16, 2019. |
1. 52 mph wind gust recorded at the C-Tower was at a height of approximately 33 meters (~100ft) and is not entirely representative of a surface wind speed.
Useful Links
Local Post Tropical Cyclone Report.
National Hurricane Center's Tropical Cyclone Report (When Available).
National Weather Service Offices in Mobile, Jacksonville, Tampa, Birmingham, and Atlanta.
Storm Surge
Tropical Storm Nestor brought approximately 2 to 3 feet of storm surge across portions of the Apalachee Bay with the highest values roughly between Saint Marks and Apalachicola. Surge amounts of 1 to 2 feet were observed west of Apalachicola towards Panama City Beach and east of Saint Marks along the rest of the Apalachee Bay towards the Steinhatchee River.
 |
 |
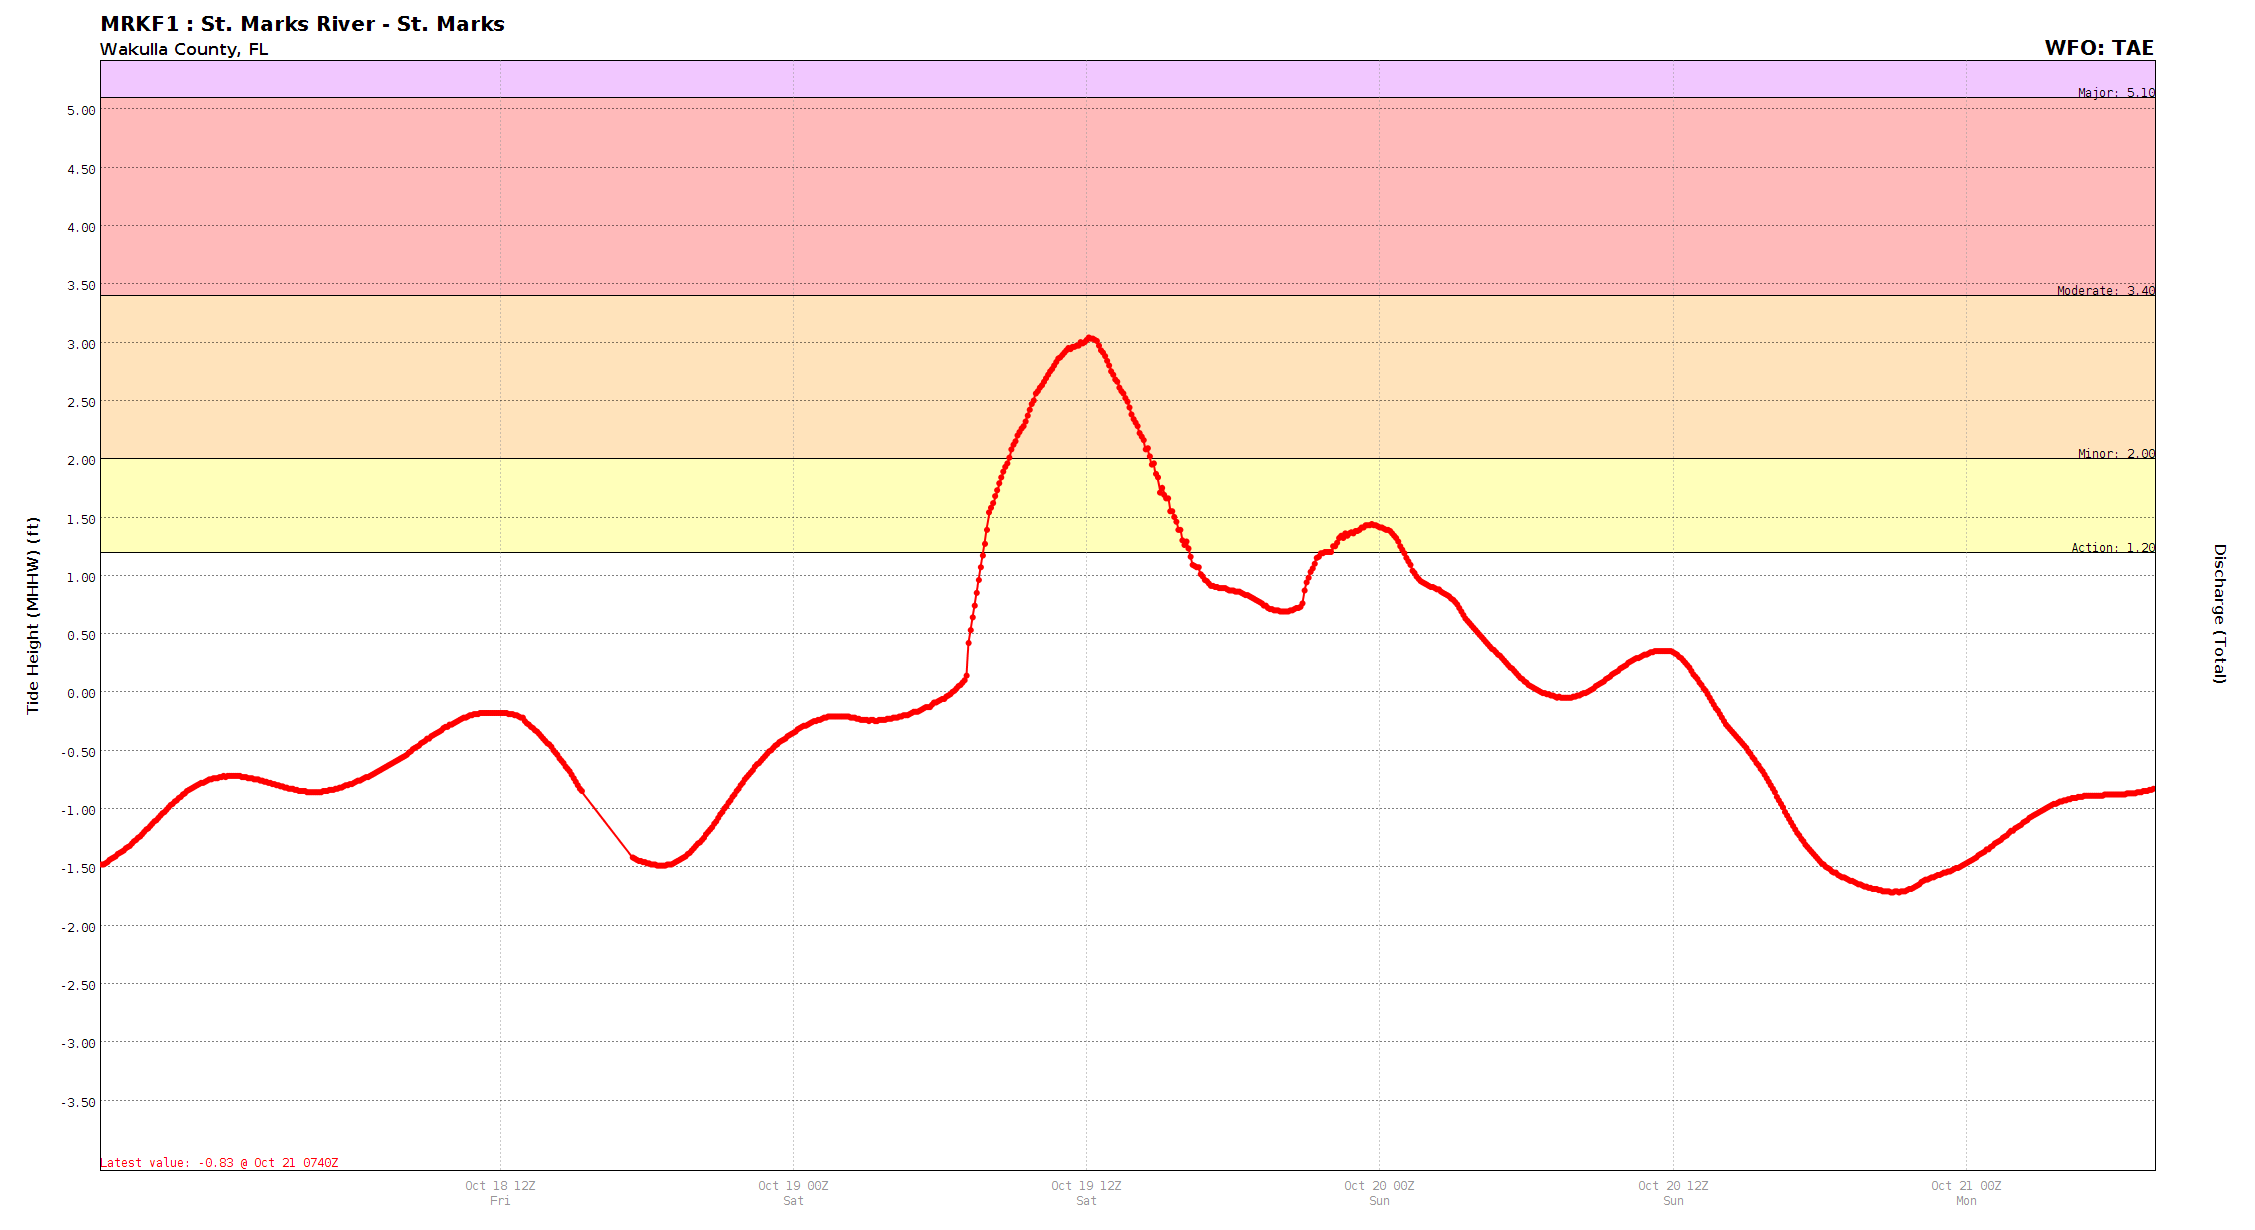 |
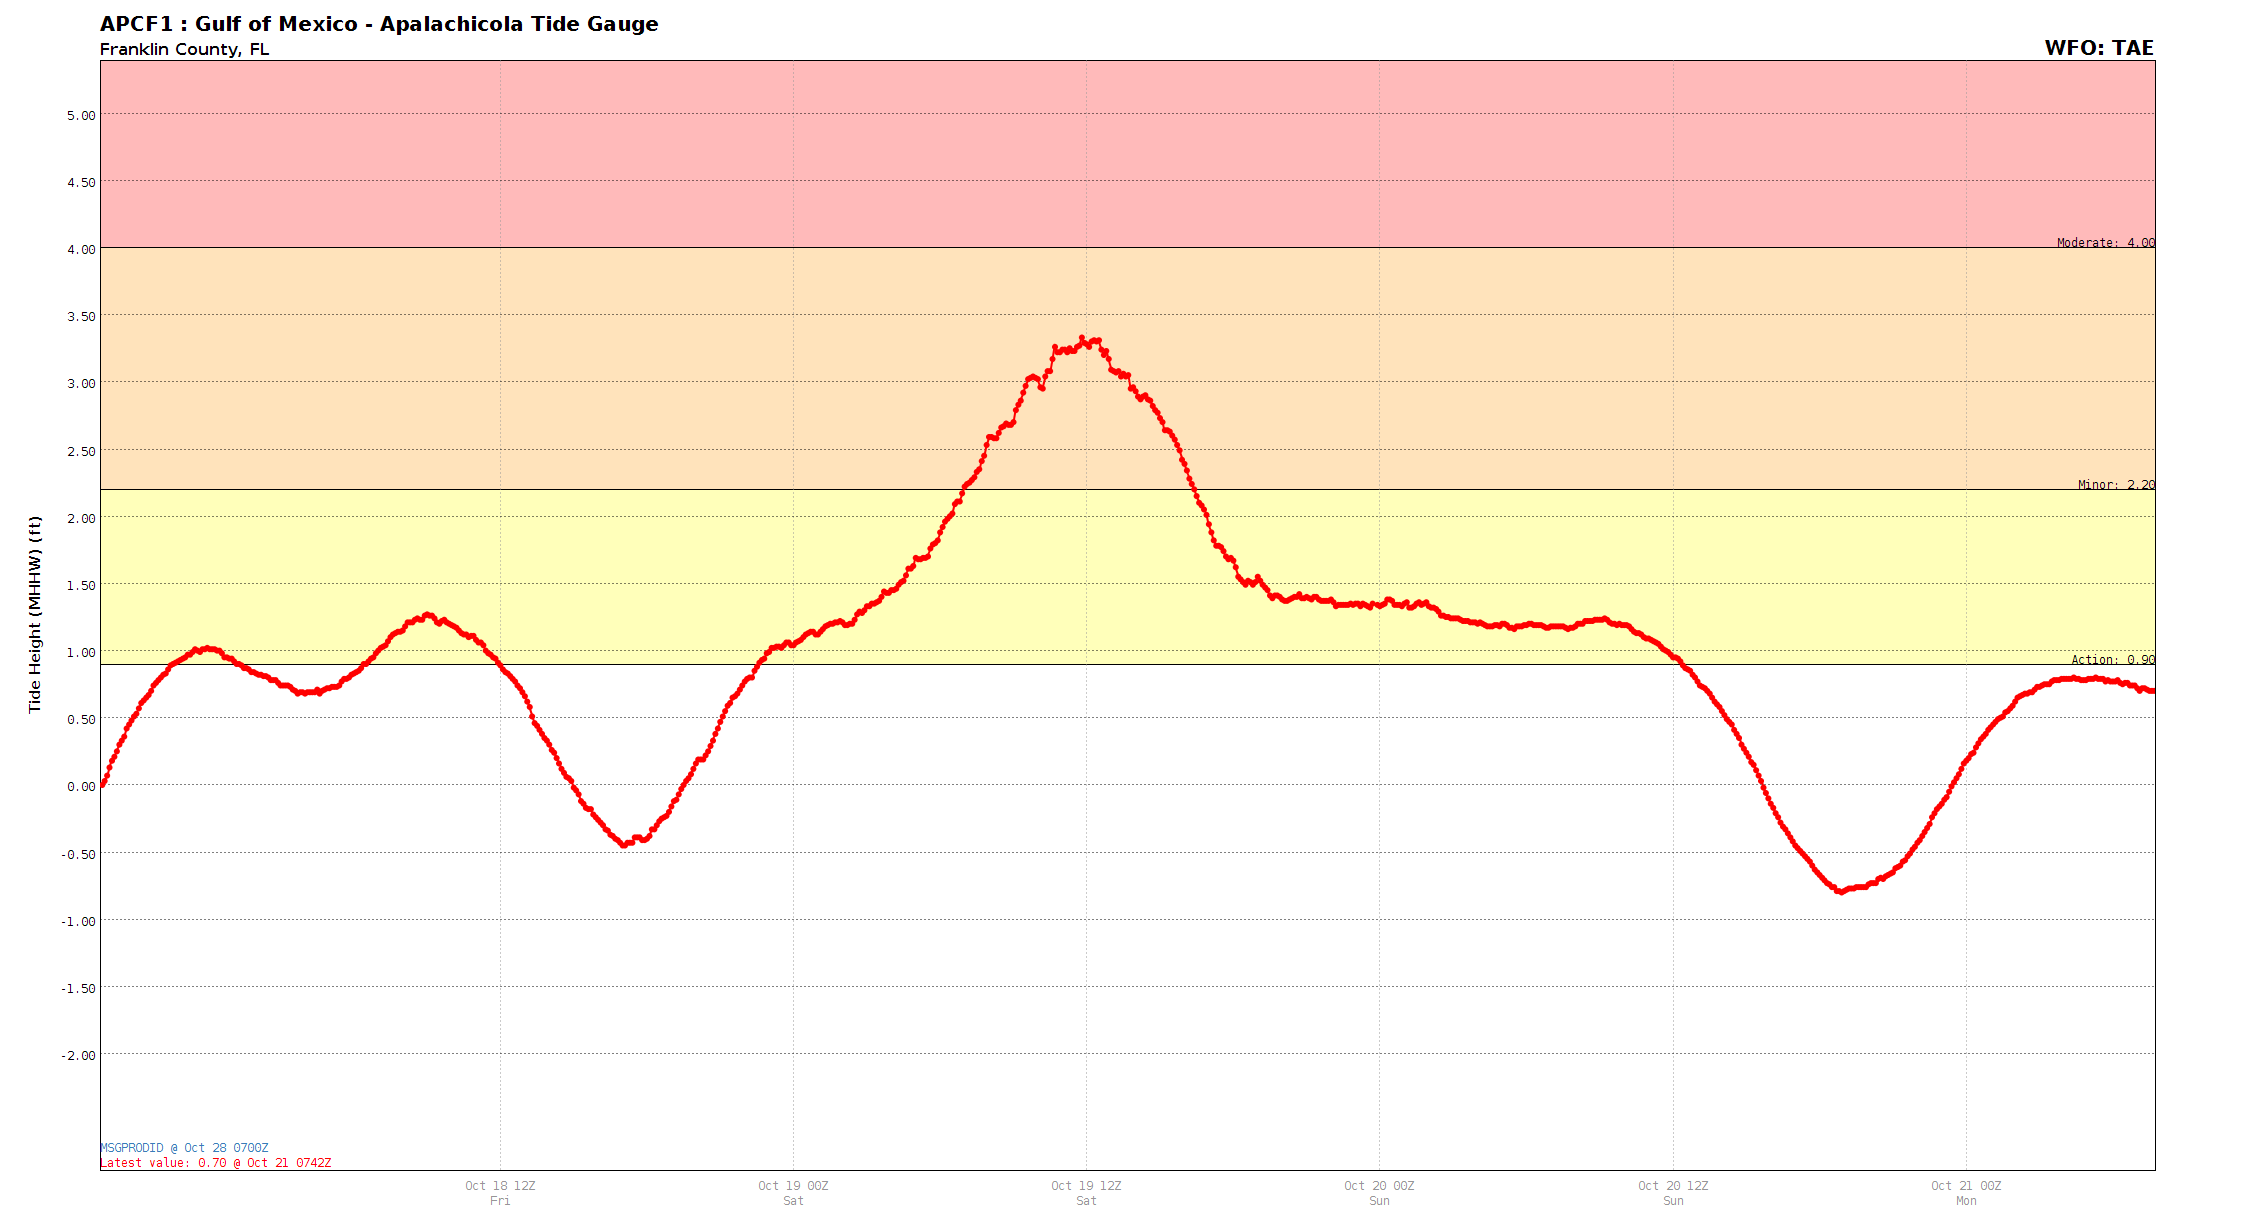
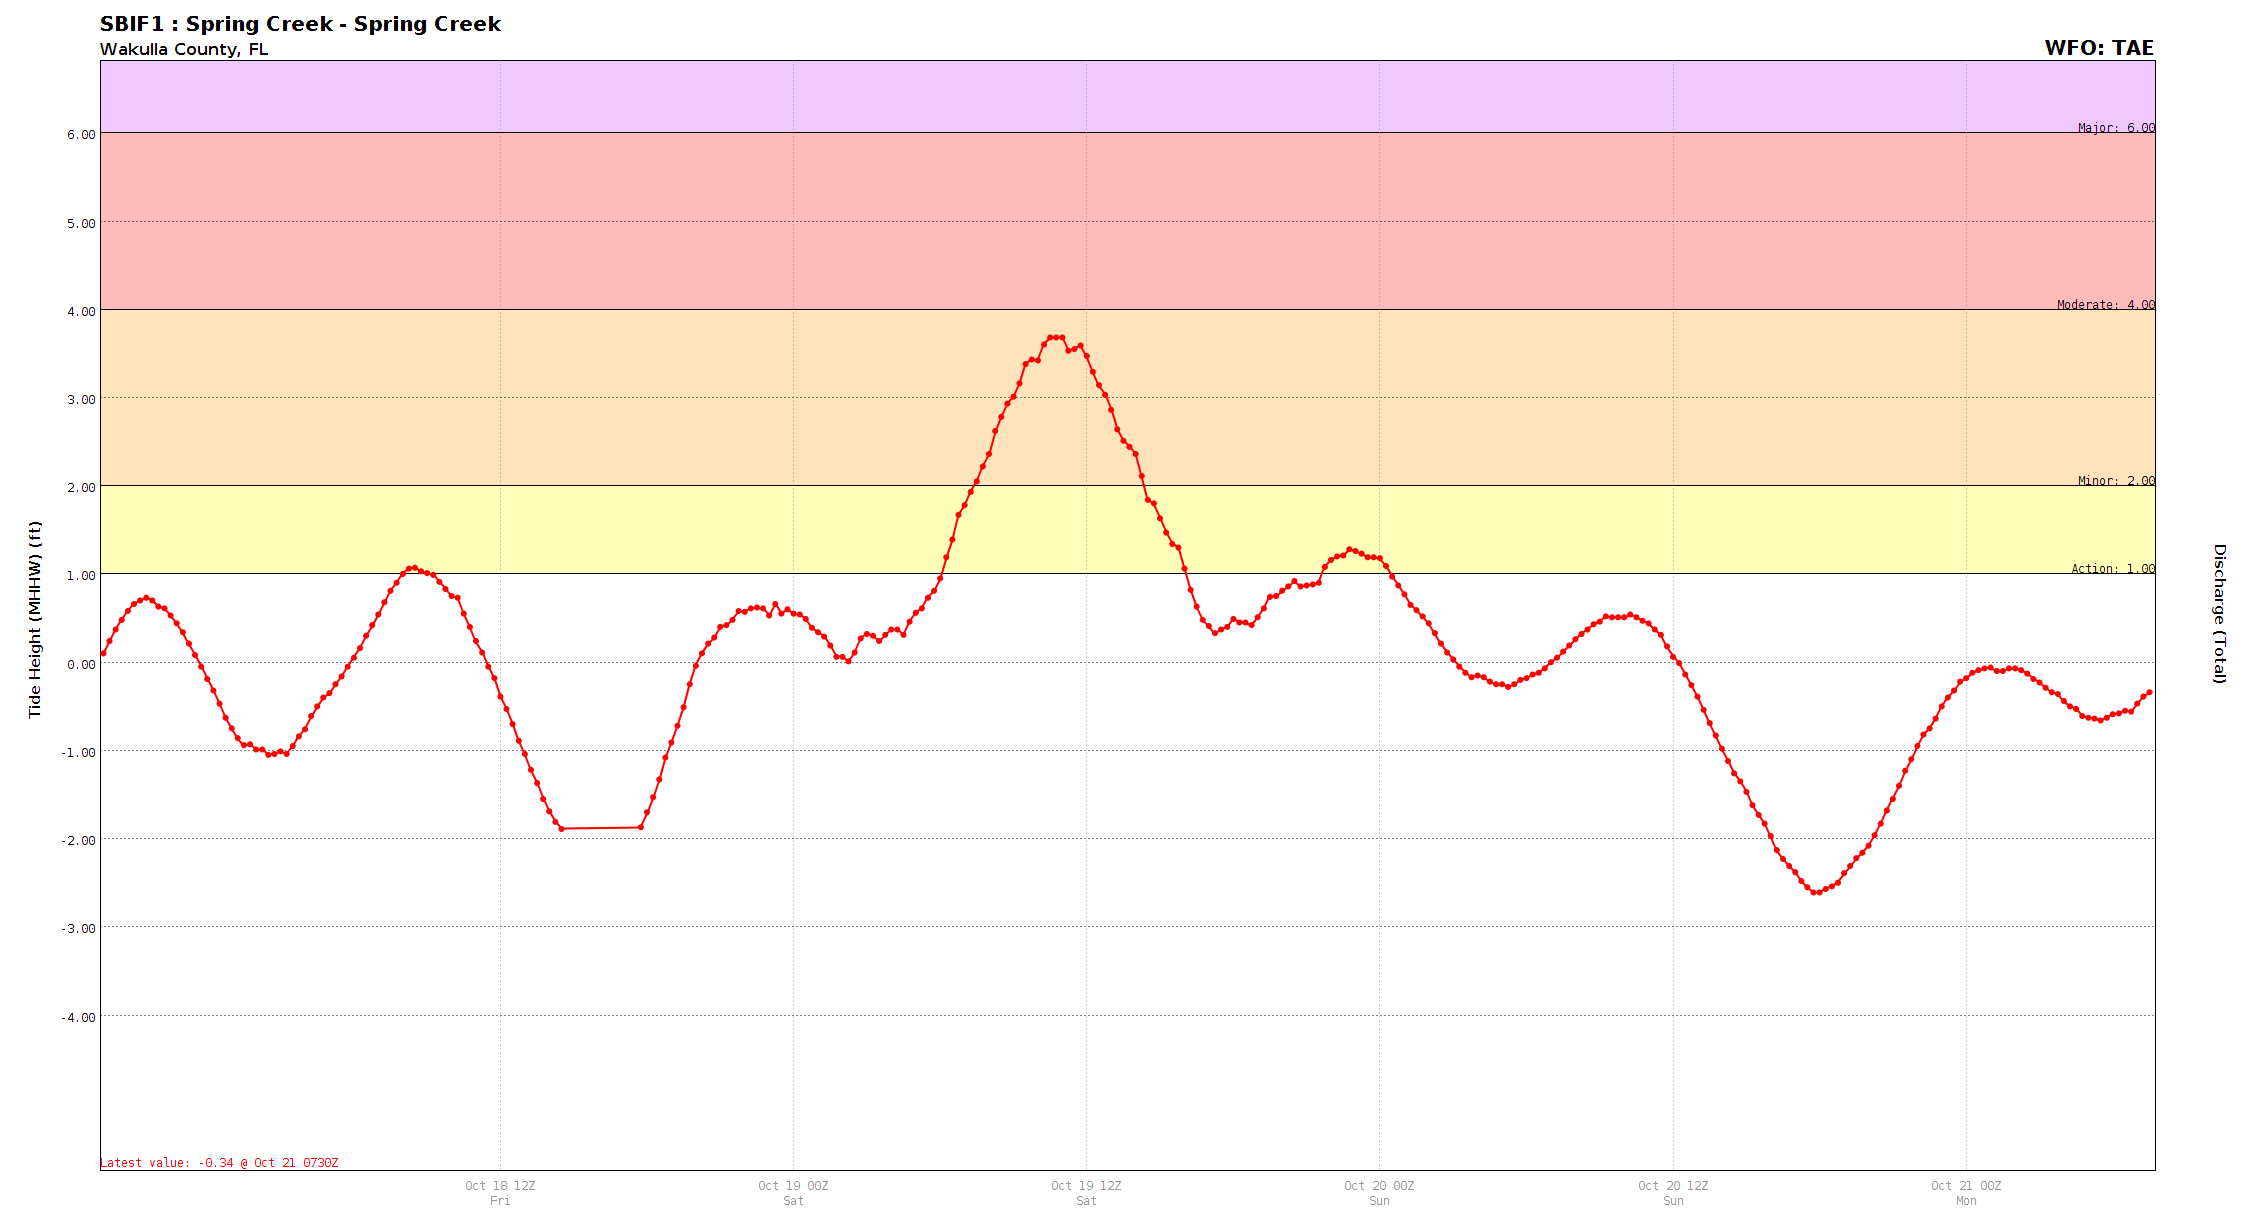
| Hydrograph at the Gulf of America Tide Gauge at Apalachicola during Nestor. This shows the peak inundation (approximately 3.33 ft MHHW). | Hydrograph at the Gulf of America Tide Gauge at Spring Creek Boat Ramp during Nestor. This shows the peak inundation (approximately 3.68 ft MHHW). | Hydrograph at the St. Marks River on the south side of St. Marks during Nestor. This shows the peak inundation (approximately 3.04 ft MHHW). |
SURGE REPORTS
MAXIMUM OBSERVED WATER LEVEL (WL)...
---------------------------------------------------------------------
ID     CITY/TOWN       COUNTY     STATE  WL  DATUM  DATE/   SOURCE
       OR LOCATION                      (FT)        TIME
---------------------------------------------------------------------
SBIF1  SPRING CREEK    WAKULLA      FL  3.68 MHHW   19/1030 USGS
30.0800  -84.3298

APCF1  APALACHICOLA    FRANKLIN     FL  3.33 MHHW   19/1148 NOS
29.7267  -84.9817

MRKF1  ST. MARKS       WAKULLA      FL  3.04 MHHW   19/1205 OTHER
30.1568  -84.2070

NUTF1  NUTALL RISE     TAYLOR       FL  2.55 MHHW   19/1054 USGS
30.1497  -83.9642

SUWF1  SUWANNEE        DIXIE        FL  2.20 MHHW   19/2345 USGS
29.3281  -83.1440

PCBF1  PANAMA CITY BCH BAY          FL  2.18 MHHW   19/0606 NOS
30.2133  -85.8783

PACF1  PANAMA CITY MAR BAY          FL  1.91 MHHW   19/0854 NOS
30.1523  -85.6669

SEWF1  WHITE CITY      GULF         FL  1.87 MHHW   19/0945 OTHER
29.8849  -85.2197

STIF1  STEINHATCHEE    TAYLOR       FL  1.82 MHHW   19/0900 OTHER
29.6761  -83.3962
 |
Media use of NWS Web News Stories is encouraged! Please acknowledge the NWS as the source of any news information accessed from this site. |
|

